Ecological Applications, 22(4), 2012, pp. 1131–1145 Ó 2012 by the Ecological Society of America Weather effects on avian breeding performance and implications of climate change SUSAN K. SKAGEN 1 AND AMY A. YACKEL ADAMS United States Geological Survey, Fort Collins Science Center, 2150 Centre Avenue, Building C, Fort Collins, Colorado 80526 USA Abstract. The influence of recent climate change on the world’s biota has manifested broadly, resulting in latitudinal range shifts, advancing dates of arrival of migrants and onset of breeding, and altered community relationships. Climate change elevates conservation concerns worldwide because it will likely exacerbate a broad range of identified threats to animal populations. In the past few decades, grassland birds have declined faster than other North American avifauna, largely due to habitat threats such as the intensification of agriculture. We examine the effects of local climatic variations on the breeding performance of a bird endemic to the shortgrass prairie, the Lark Bunting (Calamospiza melanocorys) and discuss the implications of our findings relative to future climate predictions. Clutch size, nest survival, and productivity all positively covaried with seasonal precipitation, yet relatively intense daily precipitation events temporarily depressed daily survival of nests. Nest survival was positively related to average temperatures during the breeding season. Declining summer precipitation may reduce the likelihood that Lark Buntings can maintain stable breeding populations in eastern Colorado although average temperature increases of up to 38C (within the range of this study) may ameliorate declines in survival expected with drier conditions. Historic climate variability in the Great Plains selects for a degree of vagility and opportunism rather than strong site fidelity and specific adaptation to local environments. These traits may lead to northerly shifts in distribution if climatic and habitat conditions become less favorable in the drying southern regions of the Great Plains. Distributional shifts in Lark Buntings could be constrained by future changes in land use, agricultural practices, or vegetative communities that result in further loss of shortgrass prairie habitats. Key words: Calamospiza melanocorys; climate change; clutch size; Lark Bunting; nest survival; North American prairie birds; paleoclimate; precipitation; shortgrass prairie. INTRODUCTION Effects of recent climate change on world’s biota are emerging with implications for many species (Root et al. 2003). Climate affects many aspects of a species’ ecological niche, including the abiotic conditions deter- mined by weather patterns, habitat structure as vegeta- tion responds to climatic changes, and biotic components such as the timing, composition, and abundance of the food supply, and the foraging patterns of local predators. Several types of bird responses to ecological changes recently have been attributed to climate change, including latitudinal range shifts (Par- mesan and Yohe 2003, Zuckerberg et al. 2009), advancing springtime arrival dates of migrants (Walther et al. 2002, Miller-Rushing et al. 2008), changes in the timing of breeding (Crick and Sparks 1999, Walther et al. 2002), changes in clutch size, parental provisioning rates and metabolic effort (Sanz 2003, Sanz et al. 2003), and altered competitive relationships among residents and migrants (Ahola et al. 2007). Although various influences of weather and climate cycles on adult survival and annual fecundity of passerines have been documented (George et al. 1992, Sillett et al. 2000), accounts explicitly linking recent climate change with avian reproductive output are rare (but see Dickey et al. 2008). In the past four decades, grassland birds across North America have undergone dramatic population declines; as a group, they have declined more quickly and consistently than any other group of North American birds (North American Bird Conservation Initiative, U.S. Committee 2009). For example, between 1966 and 2009, Lark Buntings (Calamospiza melanocorys) have declined annually by 4.6% in Colorado and 5.7% in the Central Breeding Bird Survey region (extending from the Mississippi River west to the Rocky Mountains; Sauer et al. [2011]; a map of BBS regions is available online). 2 Climate change poses additional threats of unknown magnitude to these already declining popula- tions. The climate of the Great Plains, renowned for its year-to-year variability, is projected to further increase in variability and frequency of extreme events such as Manuscript received 16 February 2011; revised 6 December 2011; accepted 5 January 2012. Corresponding Editor (ad hoc): E. M. Kirsch. 1 E-mail: [email protected]2 http://www.mbr-pwrc.usgs.gov/bbs/bbs_regions.png 1131
Transcript
Ecological Applications, 22(4), 2012, pp. 1131–1145� 2012 by the Ecological Society of America
Weather effects on avian breeding performance and implicationsof climate change
SUSAN K. SKAGEN1
AND AMY A. YACKEL ADAMS
United States Geological Survey, Fort Collins Science Center, 2150 Centre Avenue, Building C, Fort Collins, Colorado 80526 USA
Abstract. The influence of recent climate change on the world’s biota has manifestedbroadly, resulting in latitudinal range shifts, advancing dates of arrival of migrants and onsetof breeding, and altered community relationships. Climate change elevates conservationconcerns worldwide because it will likely exacerbate a broad range of identified threats toanimal populations. In the past few decades, grassland birds have declined faster than otherNorth American avifauna, largely due to habitat threats such as the intensification ofagriculture. We examine the effects of local climatic variations on the breeding performance ofa bird endemic to the shortgrass prairie, the Lark Bunting (Calamospiza melanocorys) anddiscuss the implications of our findings relative to future climate predictions. Clutch size, nestsurvival, and productivity all positively covaried with seasonal precipitation, yet relativelyintense daily precipitation events temporarily depressed daily survival of nests. Nest survivalwas positively related to average temperatures during the breeding season. Declining summerprecipitation may reduce the likelihood that Lark Buntings can maintain stable breedingpopulations in eastern Colorado although average temperature increases of up to 38C (withinthe range of this study) may ameliorate declines in survival expected with drier conditions.Historic climate variability in the Great Plains selects for a degree of vagility and opportunismrather than strong site fidelity and specific adaptation to local environments. These traits maylead to northerly shifts in distribution if climatic and habitat conditions become less favorablein the drying southern regions of the Great Plains. Distributional shifts in Lark Buntings couldbe constrained by future changes in land use, agricultural practices, or vegetative communitiesthat result in further loss of shortgrass prairie habitats.
Effects of recent climate change on world’s biota are
emerging with implications for many species (Root et al.
2003). Climate affects many aspects of a species’
ecological niche, including the abiotic conditions deter-
mined by weather patterns, habitat structure as vegeta-
tion responds to climatic changes, and biotic
components such as the timing, composition, and
abundance of the food supply, and the foraging patterns
of local predators. Several types of bird responses to
ecological changes recently have been attributed to
climate change, including latitudinal range shifts (Par-
mesan and Yohe 2003, Zuckerberg et al. 2009),
advancing springtime arrival dates of migrants (Walther
et al. 2002, Miller-Rushing et al. 2008), changes in the
timing of breeding (Crick and Sparks 1999, Walther et
al. 2002), changes in clutch size, parental provisioning
rates and metabolic effort (Sanz 2003, Sanz et al. 2003),
and altered competitive relationships among residents
and migrants (Ahola et al. 2007). Although various
influences of weather and climate cycles on adult
survival and annual fecundity of passerines have been
documented (George et al. 1992, Sillett et al. 2000),
accounts explicitly linking recent climate change with
avian reproductive output are rare (but see Dickey et al.
2008).
In the past four decades, grassland birds across North
America have undergone dramatic population declines;
as a group, they have declined more quickly and
consistently than any other group of North American
birds (North American Bird Conservation Initiative,
U.S. Committee 2009). For example, between 1966 and
2009, Lark Buntings (Calamospiza melanocorys) have
declined annually by 4.6% in Colorado and 5.7% in the
Central Breeding Bird Survey region (extending from
the Mississippi River west to the Rocky Mountains;
Sauer et al. [2011]; a map of BBS regions is available
online).2 Climate change poses additional threats of
unknown magnitude to these already declining popula-
tions. The climate of the Great Plains, renowned for its
year-to-year variability, is projected to further increase
in variability and frequency of extreme events such asManuscript received 16 February 2011; revised 6 December2011; accepted 5 January 2012. Corresponding Editor (ad hoc):E. M. Kirsch.
temperatures have increased about 1.18C in the past 30
years, and climate models project a continued warming
of 1.48C by 2025 and 2.28C by 2050, and seasonal shifts
in precipitation to yield greater midwinter, but decreased
late spring and summer precipitation (Ray et al. 2008).
Under the scenario of increasing temperatures driving
species northward, birds of the interior prairies of North
America (the Great Plains) are predicted to experience
greater range contractions than montane species of
western North America (Peterson 2003). This prediction
follows from the reasoning that birds restricted to
flatlands face intense reductions in area of suitable
habitat, especially if the area remains bounded to the
north by forest (Peterson 2003).
Species endemic to the interior grasslands of North
America have been exposed to extreme climate variabil-
ity through evolutionary time and presumably have
evolved mechanisms to cope with such variability. These
evolved responses to weather-related phenomena (e.g.,
drought, storms) and climate variability may yield
insights into how animals might respond to future
changes in climate. Knowledge of demographic param-
eters of bird populations across years of varying climatic
conditions allows for the development of models that
may prove to be highly informative in light of
anticipated climate change in the Great Plains of NorthAmerica.
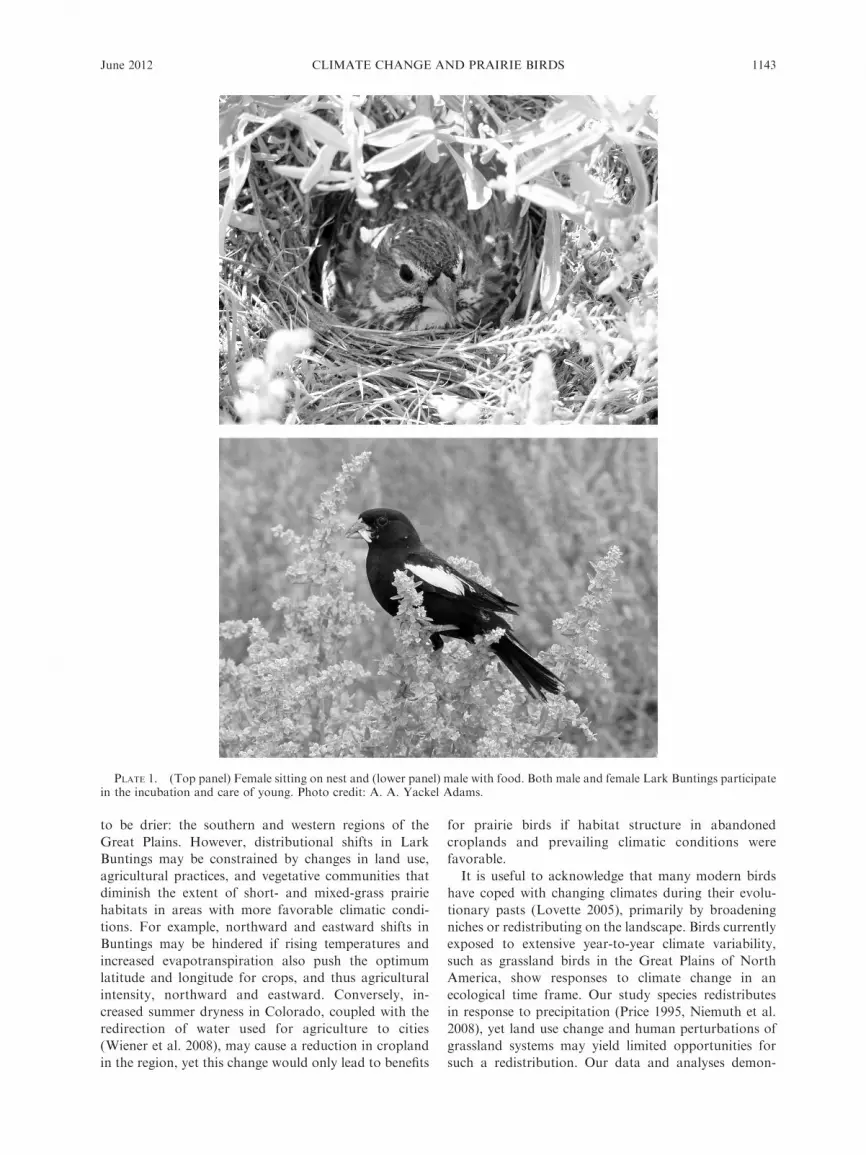
This manuscript presents a detailed analysis of theeffect of local climate variation on reproductive param-
eters of an endemic prairie passerine, the Lark Bunting(see Plate 1). This species is suited to the study of climate
change impacts because of the availability of long-termdata on reproduction, demography, and local climate(Simmons et al. 2004). It also can serve as a model to
examine potential impacts of climate on other birdspecies that are similar in ecology and habitat preference,
such as Baird’s Sparrow (Ammodramus bairdii), HornedLark (Eremophila alpestris), and other prairie-nesting
birds. During seven breeding seasons, we quantifiedvegetative features, clutch size, nest survival, and
productivity of grassland birds in 27 randomly selectedstudy sites. Weather during our study was fairly
representative of the past 70 years of recent climate.Here we model the influence of weather variables on
reproductive parameters while controlling for the influ-ences of nest age, vegetation characteristics of the site,
and seasonal timing. We use our best-approximatingmodel to generate predictions of reproductive para-
meters under various future climate scenarios. Wediscuss the implications of our findings for decliningprairie bird populations relative to future climate
predictions within the context of paleoclimatic condi-tions on the Great Plains of North America and the
evolutionary history of prairie breeding birds.
METHODS
Study area and study organism
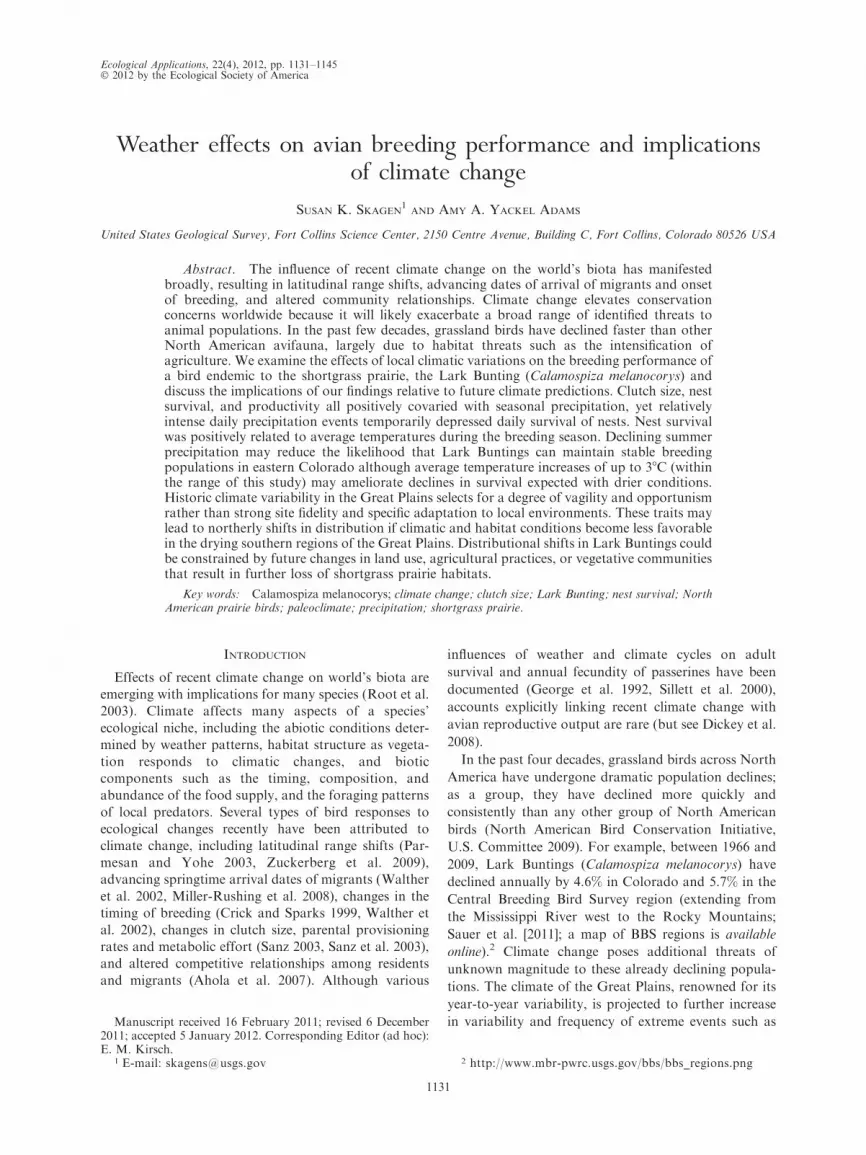
The study was conducted in and near the Pawnee
National Grassland (PNG), northeastern ColoradoUSA (40843 0 N, 104829 0 W) within an ecoregion
dominated by shortgrass steppe (Fig. 1). The shortgrasssteppe has a semiarid climate with average annual
precipitation of 340 mm. Precipitation in this region isepisodic, dominated by high inter- and intra-annualvariability, and is the primary driver of plant produc-
tivity in the region (Pielke and Doesken 2008). Smallrainfall events (,5 mm) comprise more than 70% of the
total precipitation during the growing season and areresponsible for the intra-annual variation, whereas large
precipitation events (.10 mm) account for most of theinterannual variation (Sala et al. 1992). Precipitation
records over 65 years (1939–2004) from the 6280-haCentral Plains Experimental Range bordering the PNG
in northeastern Colorado reveal interannual variationranging from 32% to 170% of the long-term annual
average and an increase of 1.8 mm per year; temperaturerecords show no discernable changes in monthly
minimum or maximum temperatures (Shortgrass SteppeLong Term Ecological Research 2010).
Our study area is a moderately fragmented grasslandlandscape composed of shortgrass prairie (62%), irrigat-
ed and nonirrigated crops (29%), and Conservation
FIG. 1. Spatial extent of the Great Plains of North America,the range of Lark Buntings (Calamospiza melanocorys) from theBreeding Bird Survey (range of densities of �4 Lark Buntingsper survey route; Sauer et al. 2011), and location of the PawneeNational Grassland, eastern Colorado, USA.
SUSAN K. SKAGEN AND AMY A. YACKEL ADAMS1132 Ecological ApplicationsVol. 22, No. 4
Reserve Program (CRP) fields (8%). Through the seven
years of the study, we randomly selected 27 study sites
(64.7 ha, quarter section), which included 19 shortgrass
prairie sites from a sampling frame of U.S. Forest
Service land and eight CRP sites from a sampling frame
of private CRP lands. All sites are contained within a 30
3 61 km area. The number of sites studied varied among
years due to short-term research questions and funding
and totaled 16, 16, 22, 1, 11, 2, and 3 from 1997 to 2003,
respectively. In 2002, we increased the size of the two
sites to include parts of 1–3 adjacent quarter sections to
augment numbers of nests monitored.
Shortgrass prairie study plots were dominated by
native xeric grasses such as buffalograss (Buchloe
dactyloides) and blue grama (Bouteloua gracilis), with
occasional shrub components of four-winged saltbush
(Atriplex canescens) and broom snakeweed (Gutierrezia
sarothrae). Study sites in CRP lands were primarily
exotic grasses such as smooth brome (Bromus inermis),
intermediate wheatgrass (Agropyron intermedium), and
crested wheatgrass (A. cristatum). Low- to moderate-
intensity grazing by cattle (�0.6 AUM/ha, where AUM
is animal unit month and animal refers to a cow–calf
pair; Augustine et al. 2012) occurred in the shortgrass
prairie sites managed by the U.S. Forest Service except
in 2002 when forage production was reduced by
drought. CRP sites were not grazed by cattle during
our study.
Our study species, the Lark Bunting, is an insectiv-
orous and granivorous endemic passerine of the short-
grass and midgrass prairie regions of North America,
inhabiting regions with annual precipitation ,586 mm
(Shane 2000). During May to July, males and females
build open-cup nests on the ground, often sheltered by
grass clumps or small shrubs. Both males and females
participate in incubation and care of nestlings and
fledglings (Shane 2000). Lark Buntings are primarily
single-brooded (2–6 eggs per clutch; average 4),
although they frequently renest after nest failure (Yackel
Adams et al. 2007). Their nesting period requires 23–28
days (2–3 d for nest building, 1 d per egg laid, 11–12 d
for incubation, and 8 d for nestling care). Potential nest
predators include thirteen-lined ground squirrel (Sper-
mophilus tridecemlineatus), coyote (Canis latrans), swift
fox (Vulpes velox), long-tailed weasel (Mustela frenata),
bullsnake (Pituophis melanoleucus), western hognose
snake (Heterodon nasicus), and Burrowing Owl (Athene
cunicularia).
Field procedures
From mid-May to early-August 1997–2003, we
located and monitored bird nests. We searched all sites
systematically for nests by dragging a rope between two
observers 25 m apart and by observing adult behavior.
To determine incubation stage, we floated two eggs (to
minimize nest disturbance) from each nest and used
Westerskov’s (1950) technique recalibrated for our study
species. We recorded number, age (based on maximum
value of the two eggs), and status of eggs and nestlings at
2–4 day intervals until nests were empty. During the last
nest check, we noted signs of fledging (parents feeding
young or calling in vicinity, fecal droppings outside of
nest).
We sampled vegetation structure and composition of
sites using two field techniques. The first technique was
used during late May and early June 1997–2001, and the
second technique was used in early August of 2001–
2003. In 2001, both techniques were used; about 50% of
nests were on sites associated with each technique. With
the first technique, we sampled 12 points 300 m apart
along point transects systematically placed at the center
of each study site. At each point, we visually estimated
the percent cover of grasses, sedges, forbs, shrubs, cacti,
and bare ground within 5 m radius plots, and we
measured grass and vegetation height at distances of 1,
3, and 5 m from the point in one direction (east). With
the second technique, we sampled 45 points at 15-m
intervals along a randomly placed 700-m transect. At
each point, we estimated percent cover of grasses,
sedges, forbs, shrubs, cacti, and bare ground within a
20 3 50 cm frame (Daubenmire 1959) and measured
heights of all vegetation types at 5, 25, and 45 cm along
the center line of the frame and maximum vegetation
height within the frame. For all data, we calculated
average and median heights and average percent cover
of all vegetation types, and we constructed new variables
based on products of height and cover variables to
indicate vegetation density (Table 1). The same field
crew sampled vegetation in all years except 1998 (the
observers in 1998 were trained in 1997). The difference
in sample timing between the two techniques is partially
mitigated by the measurement of standing dead vegeta-
tion. We assume that, despite use of two sampling
methods and scales of measurement, we captured the
relative differences in vegetation structure between sites.
Data analyses
We acquired historical weather data for 1997–2003
from the Western Regional Climate Center (available
online)3 and the Shortgrass Steppe Long Term Ecolog-
ical Research group (see Acknowledgments). Preliminary
models for productivity parameters included several
forms of daily and seasonal precipitation and temper-
ature from four weather stations within the boundaries
of our Colorado study area (NOAA Coop Station
050945 [Briggsdale], 055922 [New Raymer Coop],
055934 [New Raymer 21N], and weather station of the
Central Plains Experiment Station). We chose a range of
daily and seasonal precipitation metrics that might
reveal short- and long-term effects of precipitation both
on vegetation structure and on reproductive parameters.
Fall and winter precipitation determine soil moisture at
the beginning of the next growing season, which in turn
3 http://www.wrcc.dri.edu/
June 2012 1133CLIMATE CHANGE AND PRAIRIE BIRDS
positively influences vegetation growth as well as spring
and summer precipitation (Pielke and Doesken 2008).
Seasonal precipitation was expressed as the amount of
precipitation from September of the previous year
through August of the study year (annual) or the
amount of precipitation April through June of the study
year. For daily precipitation variables, we evaluated
measured precipitation, binary variables that denoted
rain events of different magnitudes (.5 mm, .10 mm,
and .20 mm), and amount of rainfall on the previous
day as a surrogate for varying predator behavior after
rainstorms (Dinsmore et al. 2002). Temperature was
expressed as daily and average daily maximum, mini-
mum, and mean temperatures during the study season.
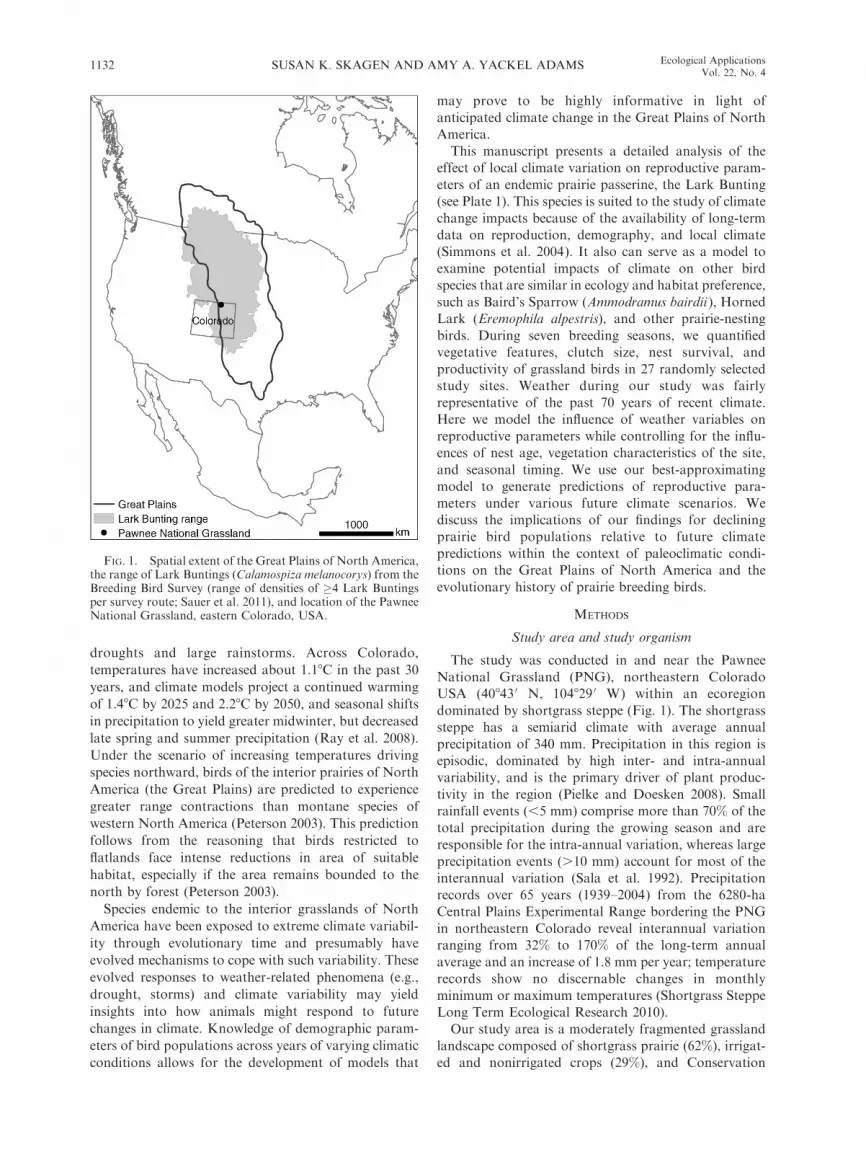
TABLE 1. Predictor variables with the most support (DAICc ¼ 0.00), indicating their influence on clutch size, nest survival, andproductivity of the Lark Bunting (Calamospiza melanocorys) in and near the Pawnee National Grassland, northeasternColorado, USA.
Habitat structure (covariates in model) date2 nest age þ clutch size clutch size
Covariates only 1896.21 21.84 2634.14 4.06 904.61 4.26Average grass height (AvGrHt) 1892.93 18.57 2631.66 1.59 900.35 0.00Median grass height (MedGrHt) 1888.12 13.76 2630.07 0.00 904.46 4.12Quadratic of median grass height 1889.87 15.51 2631.24 1.16 905.94 5.60Average height of forbs and shrubs 1895.23 20.86 2636.01 5.93 906.33 5.98Average height of all vegetation 1885.95 11.58 2632.25 2.18 903.93 3.58Percent cover of grasses and sedges 1884.61 10.29 2633.76 3.68 906.12 5.77Percent cover of forbs and shrubs 1893.73 19.36 2636.02 5.94 903.41 3.06Percent cover of all vegetation (VegCover) 1874.37 0.00 2634.46 4.39 903.35 3.00Product of median grass height and cover 1883.62 9.25 2633.55 3.47 904.91 4.56Product of forb/shrub height and cover 1896.30 21.93 2639.38 9.31 902.02 1.67Product of vegetation height and cover 1884.67 10.31 2636.13 6.05 906.06 5.71
Daily precipitation (covariates in model) date2 þ VegCover nest age þ clutch size þMedGrHt
Daily precipitation 1874.44 2.42 2631.87 4.33Precipitation the previous day 1872.02 0.00 2632.04 4.51Rain event � 5 mm 1874.06 2.04 2632.08 4.54Rain event � 10 mm 1875.54 3.52 2627.54 0.00Rain event � 20 mm 1876.04 4.02 2631.49 3.95Previous day with �5 mm 1876.01 3.98 2632.02 4.48Previous day with �10 mm 1873.40 1.38 2631.95 4.41Previous day with �20 mm 1875.00 2.97 2630.20 2.66
Seasonal precipitation (covariates in model) date2 þ VegCover nest age þ clutch size þMedGrHt
clutch size þ AvGrHt
Precipitation Sep–Aug 1852.95 0.00 2632.04 3.26 895.39 0.00Precipitation Apr–Jun 1858.66 5.67 2630.59 1.81 901.25 5.86No. days with �5 mm precipitation 1865.86 12.81 2628.78 0.00 896.33 0.94No. days with �10 mm precipitation 1860.91 7.88 2630.79 2.01 902.42 7.03No. days with �20 mm precipitation 1868.67 15.67 2631.75 2.97 902.14 6.76
Temperature (8C) (covariates in model) date2 þ VegCov nest age þ clutch size þMedGrHt
clutch size þ AvGrHt
Daily minimum 1876.05 22.58 2630.60 2.48Daily mean 1872.98 18.47 2629.65 1.55Daily maximum 1867.69 14.15 2629.52 1.41Average daily minimum 1870.25 16.99 2628.88 0.77 899.82 4.03Average daily mean 1859.98 5.75 2628.10 0.00 896.64 0.85Average daily maximum 1853.33 0.00 2628.43 0.32 895.79 0.00
Notes: Each nest is individually associated with the nearest weather station. Variables ultimately used in models are indicated inboldface. In some cases, closely competing variables (DAICc , 2.0) provided a better fit when substituted into best-approximatingmodels. Blank cells indicate variables that were not included in models.
SUSAN K. SKAGEN AND AMY A. YACKEL ADAMS1134 Ecological ApplicationsVol. 22, No. 4
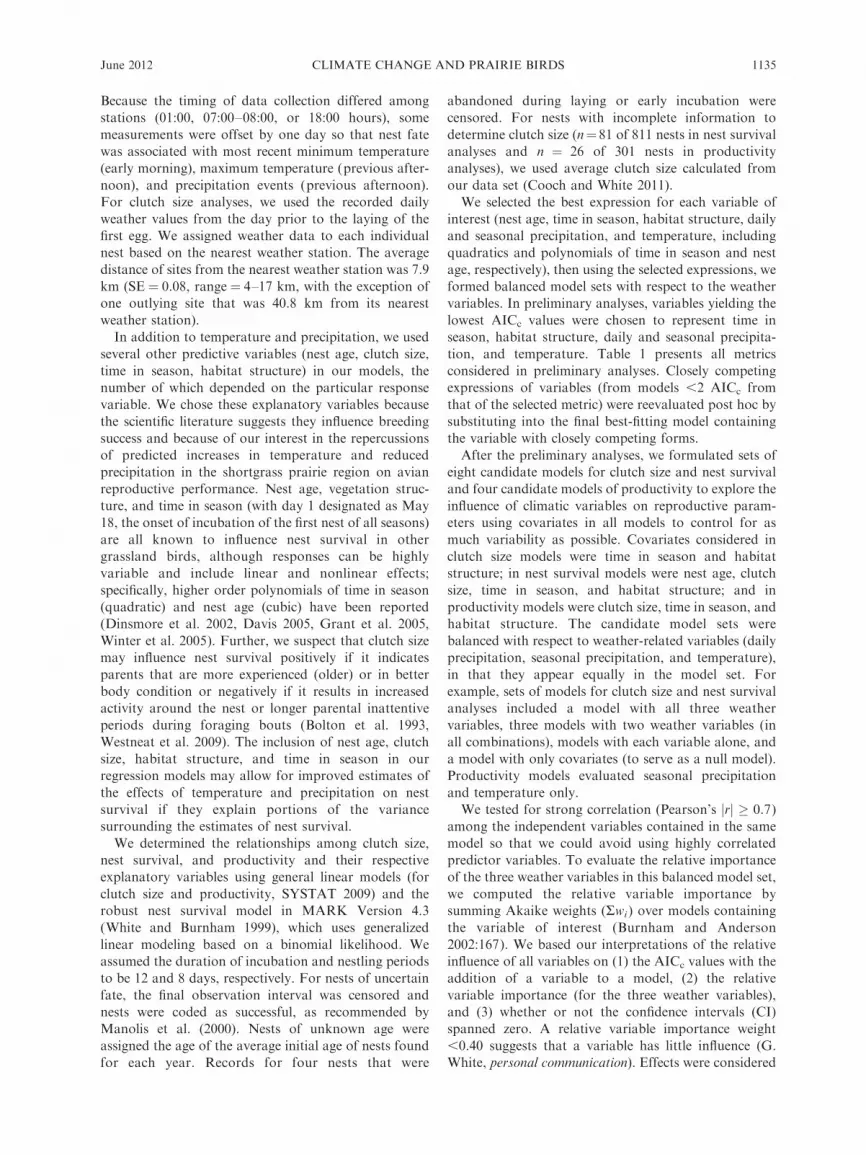
Because the timing of data collection differed among
stations (01:00, 07:00–08:00, or 18:00 hours), some
measurements were offset by one day so that nest fate
was associated with most recent minimum temperature
(early morning), maximum temperature (previous after-
noon), and precipitation events (previous afternoon).
For clutch size analyses, we used the recorded daily
weather values from the day prior to the laying of the
first egg. We assigned weather data to each individual
nest based on the nearest weather station. The average
distance of sites from the nearest weather station was 7.9
km (SE ¼ 0.08, range ¼ 4–17 km, with the exception of
one outlying site that was 40.8 km from its nearest
weather station).
In addition to temperature and precipitation, we used
several other predictive variables (nest age, clutch size,
time in season, habitat structure) in our models, the
number of which depended on the particular response
variable. We chose these explanatory variables because
the scientific literature suggests they influence breeding
success and because of our interest in the repercussions
of predicted increases in temperature and reduced
precipitation in the shortgrass prairie region on avian
We tested for strong correlation (Pearson’s jrj � 0.7)
among the independent variables contained in the same
model so that we could avoid using highly correlated
predictor variables. To evaluate the relative importance
of the three weather variables in this balanced model set,
we computed the relative variable importance by
summing Akaike weights (Rwi ) over models containing
the variable of interest (Burnham and Anderson
2002:167). We based our interpretations of the relative
influence of all variables on (1) the AICc values with the
addition of a variable to a model, (2) the relative
variable importance (for the three weather variables),
and (3) whether or not the confidence intervals (CI)
spanned zero. A relative variable importance weight
,0.40 suggests that a variable has little influence (G.
White, personal communication). Effects were considered
June 2012 1135CLIMATE CHANGE AND PRAIRIE BIRDS
strong if the 95% CI did not span zero, weak if the 90%
CI did not span zero, and as having no relationship with
the predictor variable if the 90% CI spanned zero. Nest
success was calculated as (daily survival)20 (where 20 is
the total number of days for incubation plus nestling
periods), and variance estimates were calculated using
the delta method (Seber 2002). Reported values are
means or regression coefficients 6 SE, unless otherwise
noted.
Last, we applied the best-approximating models to
predict clutch size, daily nest survival, and productivity
with increases in temperature and declines in precipita-
tion. We applied the models to 12 future climate
scenarios in which future average temperatures (mean
and maximum) and precipitation (daily and seasonal)
remain within the ranges of observed data from the four
weather stations used in our study. The 12 scenarios
included two temperature levels and six precipitation
levels. We set future temperatures at the maximum
observed in our study and at a value intermediate
between current averages and the maximum. To specify
precipitation levels, we calculated the span between the
current average and minimum for the seasonal and daily
precipitation variables in the models, and decreased
values by 0%, 20%, 40%, 60%, 80%, and 100% of this
amount. We treated vegetation variables in the same
manner as precipitation, and we assumed the mean
value for time in season. Predicted clutch sizes for the 12
scenarios were specified in the nest survival and
productivity models. We estimated fecundity (number
of female young/female) for each scenario assuming a
50:50 nestling sex ratio and 1.66 nesting attempts per
female (including renesting attempts; sensu Yackel
Adams et al. 2007).
RESULTS
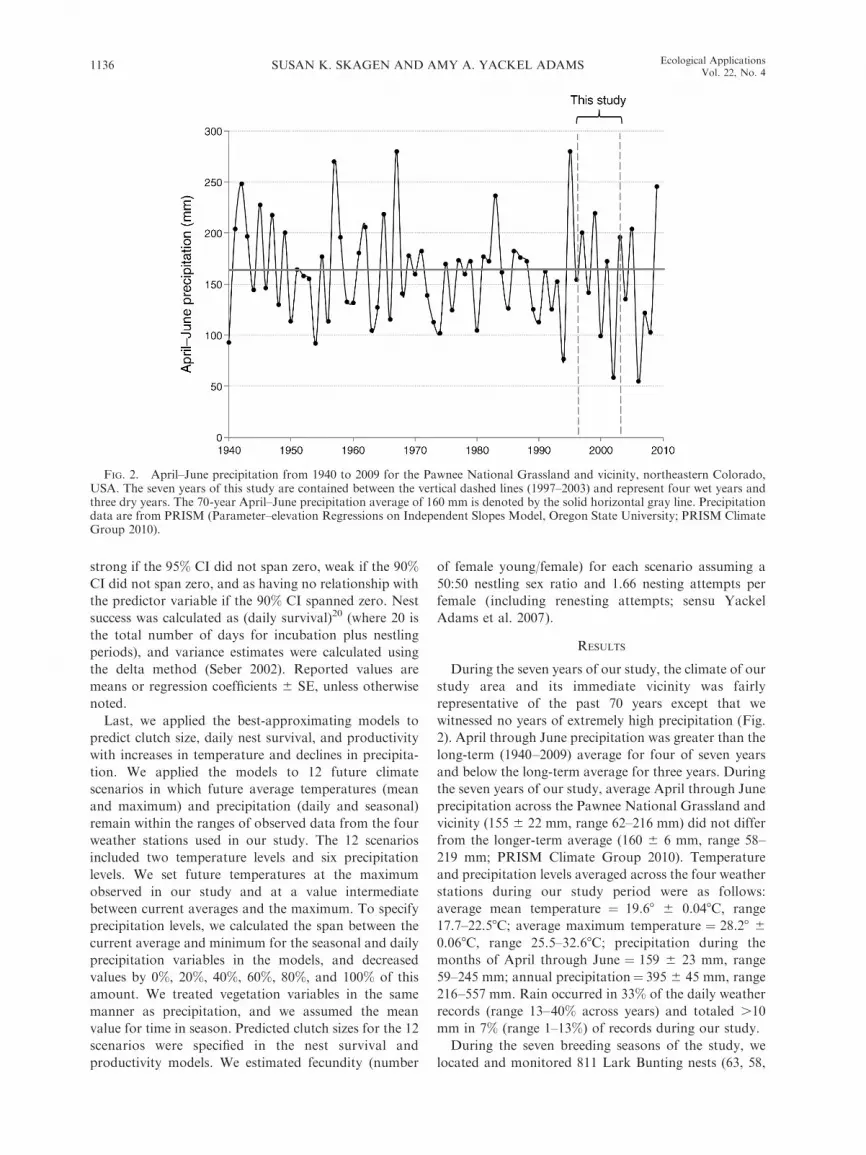
During the seven years of our study, the climate of our
study area and its immediate vicinity was fairly
representative of the past 70 years except that we
witnessed no years of extremely high precipitation (Fig.
2). April through June precipitation was greater than the
long-term (1940–2009) average for four of seven years
and below the long-term average for three years. During
the seven years of our study, average April through June
precipitation across the Pawnee National Grassland and
vicinity (155 6 22 mm, range 62–216 mm) did not differ
from the longer-term average (160 6 6 mm, range 58–
219 mm; PRISM Climate Group 2010). Temperature
and precipitation levels averaged across the four weather
stations during our study period were as follows:
average mean temperature ¼ 19.68 6 0.048C, range
17.7–22.58C; average maximum temperature ¼ 28.28 6
0.068C, range 25.5–32.68C; precipitation during the
months of April through June ¼ 159 6 23 mm, range
59–245 mm; annual precipitation¼ 395 6 45 mm, range
216–557 mm. Rain occurred in 33% of the daily weather
records (range 13–40% across years) and totaled .10
mm in 7% (range 1–13%) of records during our study.
During the seven breeding seasons of the study, we
located and monitored 811 Lark Bunting nests (63, 58,
FIG. 2. April–June precipitation from 1940 to 2009 for the Pawnee National Grassland and vicinity, northeastern Colorado,USA. The seven years of this study are contained between the vertical dashed lines (1997–2003) and represent four wet years andthree dry years. The 70-year April–June precipitation average of 160 mm is denoted by the solid horizontal gray line. Precipitationdata are from PRISM (Parameter–elevation Regressions on Independent Slopes Model, Oregon State University; PRISM ClimateGroup 2010).
SUSAN K. SKAGEN AND AMY A. YACKEL ADAMS1136 Ecological ApplicationsVol. 22, No. 4
141, 29, 284, 83, and 153 from 1997 through 2003,
respectively). These numbers varied due to differences
the number of study sites searched each year, as well as
the Buntings’ tendency to drastically fluctuate in local
numbers from year to year (Shane 2000). Adequate
information existed to determine number of eggs laid
(clutch size) for 732 of these nests. We suspected causes
of nest failure to be inclement weather (a minimum of
3.4% of 504 failed nests), nest desertion (2.8%), cattle
activity (0.6%), and predation (93.2%), although nest
loss from starvation of chicks and inclement weather can
be difficult to distinguish from predation. Brood
parasitism did not occur. Fate and nest age were
unknown for 3.0% and 3.2% of nests, respectively.
Preliminary analyses to select variable expressions
In our evaluation of the influence of weather patterns
on clutch size, the quadratic of date, percent cover of all
vegetation, precipitation on the day prior to egg
formation, annual precipitation (from September of
the previous year through August of the study year), and
average daily maximum temperature were selected
during preliminary analyses (Table 1). Substitution of
In preliminary analyses of nest survival, the cubic
polynomial of nest age received substantially more
support than other lower-order models (Table 1). The
null model best described time in season. Habitat
structure was best described by median grass height. In
all cases, weather variables had more influence on nest
survival when each individual nest was associated with
data from the nearest weather station rather than when
weather metrics were weighted by number of nests
nearest the station, although the differences in AICc for
various forms of temperature were slight. Daily precip-
itation was best described by whether a given day
received .10 mm of rainfall. Seasonal precipitation was
best represented by the number of days with �5 mm
precipitation, and temperature was best represented by
average daily mean temperature during the study season
(Table 1). Closely competing variables for habitat
structure, time in season, and daily precipitation did
not improve fit of the best-approximating model (DAICc
ranged from 1.72 to 7.31 and evidence ratios from 2.4 to
38.6, suggesting that the original models were more than
2.4–38.6 times as likely as the competing models). The
original best models for seasonal precipitation and
temperature were outcompeted by the total amount of
precipitation during April through June (DAICc¼ 6.413,
evidence ratio 24.7) and average daily maximum
temperature (DAICc ¼ 1.717, evidence ratio 2.4).
Therefore, we used them in the nest survival candidate
model set (Table 2).
In preliminary analyses for productivity (number of
young fledged per successful nest), the best models
included average grass height, precipitation from Sep-
tember of the previous year through August of the study
year, and average daily maximum temperature. The
addition of time in season did not improve the model
consisting of covariates only (Table 1). Substitution of
closely competing expressions into the best-approximat-
ing model improved model fit only for average mean
temperature (DAICc¼ 0.373). We did not evaluate daily
precipitation or daily temperature variables for produc-
tivity.
Models of clutch size
The balanced model set that we considered for clutch
size contained time in season and habitat structure in all
eight models. The best-approximating model included
all weather variables (daily and seasonal precipitation,
temperature) and yielded a model weight of wi ¼ 0.555
(Table 2). The combined weight of the top two models
was wi ¼ 0.885. The relative variable importance of the
weather variables indicate that seasonal precipitation
(0.949), temperature (0.936), and daily precipitation
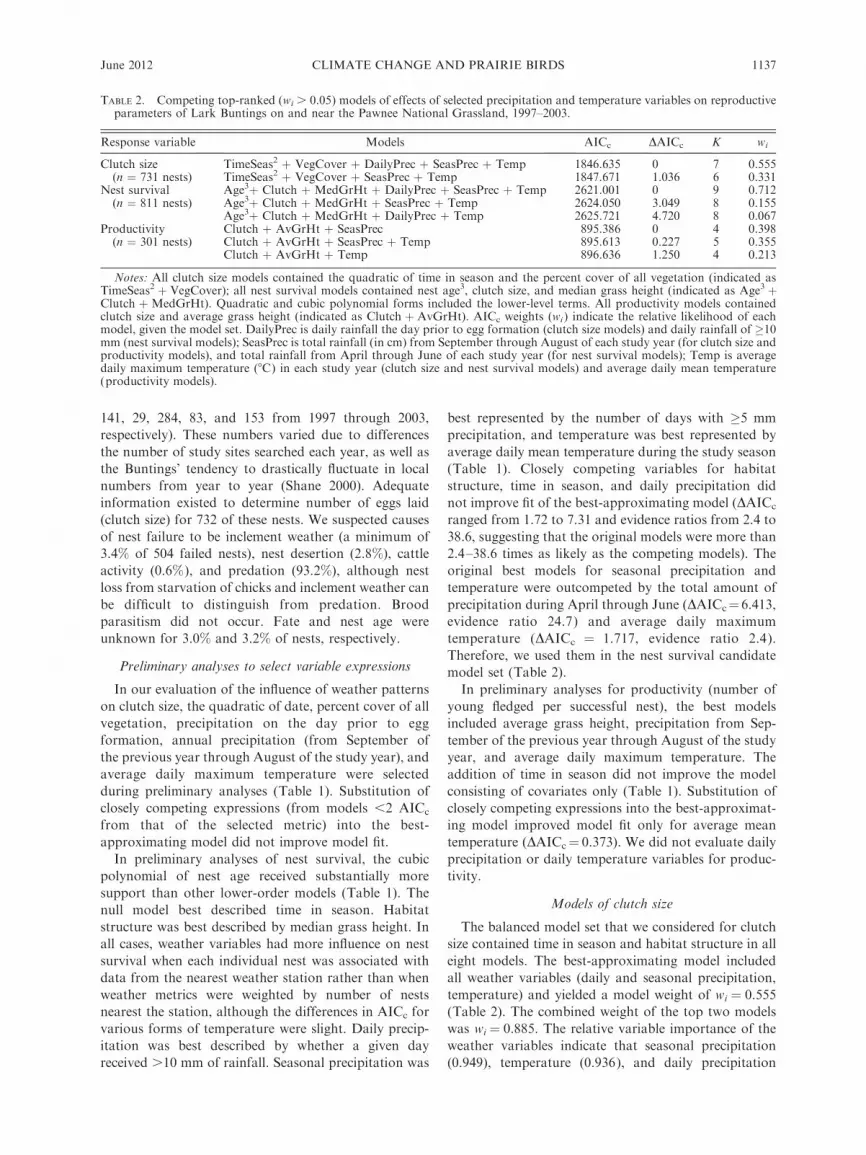
TABLE 2. Competing top-ranked (wi . 0.05) models of effects of selected precipitation and temperature variables on reproductiveparameters of Lark Buntings on and near the Pawnee National Grassland, 1997–2003.
Notes: All clutch size models contained the quadratic of time in season and the percent cover of all vegetation (indicated asTimeSeas2 þ VegCover); all nest survival models contained nest age3, clutch size, and median grass height (indicated as Age3 þClutch þMedGrHt). Quadratic and cubic polynomial forms included the lower-level terms. All productivity models containedclutch size and average grass height (indicated as Clutch þ AvGrHt). AICc weights (wi ) indicate the relative likelihood of eachmodel, given the model set. DailyPrec is daily rainfall the day prior to egg formation (clutch size models) and daily rainfall of �10mm (nest survival models); SeasPrec is total rainfall (in cm) from September through August of each study year (for clutch size andproductivity models), and total rainfall from April through June of each study year (for nest survival models); Temp is averagedaily maximum temperature (8C) in each study year (clutch size and nest survival models) and average daily mean temperature(productivity models).
June 2012 1137CLIMATE CHANGE AND PRAIRIE BIRDS
(0.630) influenced clutch size during the years of our
study. Clutch size decreased nonlinearly as time in
season progressed and was positively related to daily
rainfall at the onset of egg formation (Table 3).
Furthermore, clutch size was strongly (95% CI did not
span zero) and positively related to annual precipitation
and strongly negatively related to average maximum
temperatures. There was no discernable relationship
(90% CI spanned zero) between clutch size and the
percent cover of all vegetation (Table 3).
Nest survival models
The balanced model set for nest survival contained
nest age, clutch size, and habitat structure in all eight
models. The best-approximating model of the balanced
model set (wi ¼ 0.712; Table 2) included all of the
weather predictor variables (daily and seasonal precip-
itation, temperature). The relative variable importance
weights of the weather variables indicate that tempera-
ture (0.937), seasonal precipitation (0.895), and daily
precipitation (0.828) all had strong influences on nest
survival during the years of our study. No independent
variables were strongly correlated (e.g., jrj � 0.7); thus
they were retained in the models. Median grass height
was only moderately positively correlated with seasonal
precipitation (April through June of the study year; r¼0.446), indicating that ,20% of the variance in grass
height was related to precipitation.
Nest age and clutch size had strong effects on survival
of Lark Bunting nests, as evidenced by 95% CI that did
not span zero for any of these terms (Table 3). Nest
survival increased with nest age during early incubation
and late in the nestling stage, but declined during late
incubation and the early nestling stage. Broods from
larger clutches had a higher likelihood of fledging at
least one young. Part of the clutch size effect may have
been confounded with time in season, but the two
variables were only slightly negatively correlated (r2 ¼0.135). Habitat structure did not show a clear effect on
nest survival, with 90% CI broadly spanning zero (Table
3).
Daily precipitation had a strong negative effect on
nest survival, as indicated by a negative regression
coefficient and 95% CI that did not span zero. To
illustrate the role of daily precipitation events on nest
survival, we ran models that allowed the slope for nest
age to vary for each year–weather station combination.
Nest survival dramatically decreased on days with .10
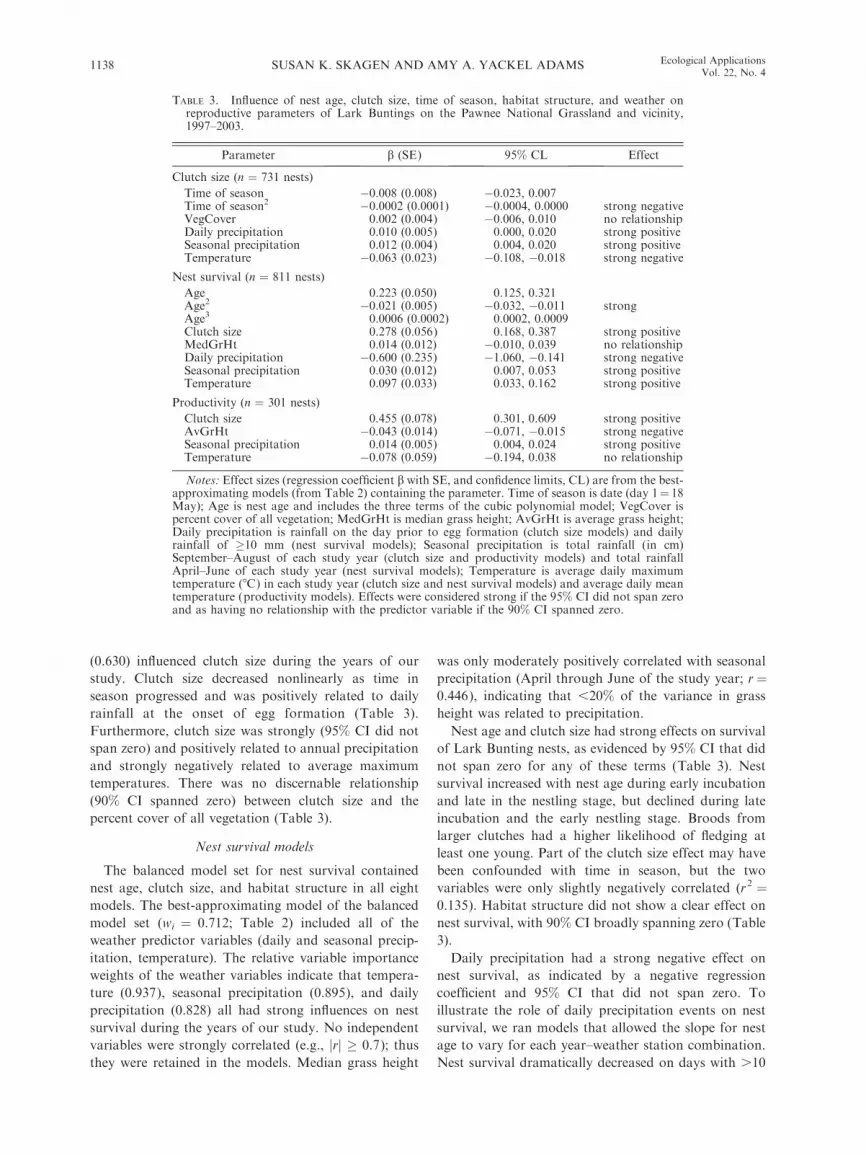
TABLE 3. Influence of nest age, clutch size, time of season, habitat structure, and weather onreproductive parameters of Lark Buntings on the Pawnee National Grassland and vicinity,1997–2003.
Parameter b (SE) 95% CL Effect
Clutch size (n ¼ 731 nests)
Time of season �0.008 (0.008) �0.023, 0.007Time of season2 �0.0002 (0.0001) �0.0004, 0.0000 strong negativeVegCover 0.002 (0.004) �0.006, 0.010 no relationshipDaily precipitation 0.010 (0.005) 0.000, 0.020 strong positiveSeasonal precipitation 0.012 (0.004) 0.004, 0.020 strong positiveTemperature �0.063 (0.023) �0.108, �0.018 strong negative
Notes: Effect sizes (regression coefficient b with SE, and confidence limits, CL) are from the best-approximating models (from Table 2) containing the parameter. Time of season is date (day 1¼ 18May); Age is nest age and includes the three terms of the cubic polynomial model; VegCover ispercent cover of all vegetation; MedGrHt is median grass height; AvGrHt is average grass height;Daily precipitation is rainfall on the day prior to egg formation (clutch size models) and dailyrainfall of �10 mm (nest survival models); Seasonal precipitation is total rainfall (in cm)September–August of each study year (clutch size and productivity models) and total rainfallApril–June of each study year (nest survival models); Temperature is average daily maximumtemperature (8C) in each study year (clutch size and nest survival models) and average daily meantemperature (productivity models). Effects were considered strong if the 95% CI did not span zeroand as having no relationship with the predictor variable if the 90% CI spanned zero.
SUSAN K. SKAGEN AND AMY A. YACKEL ADAMS1138 Ecological ApplicationsVol. 22, No. 4
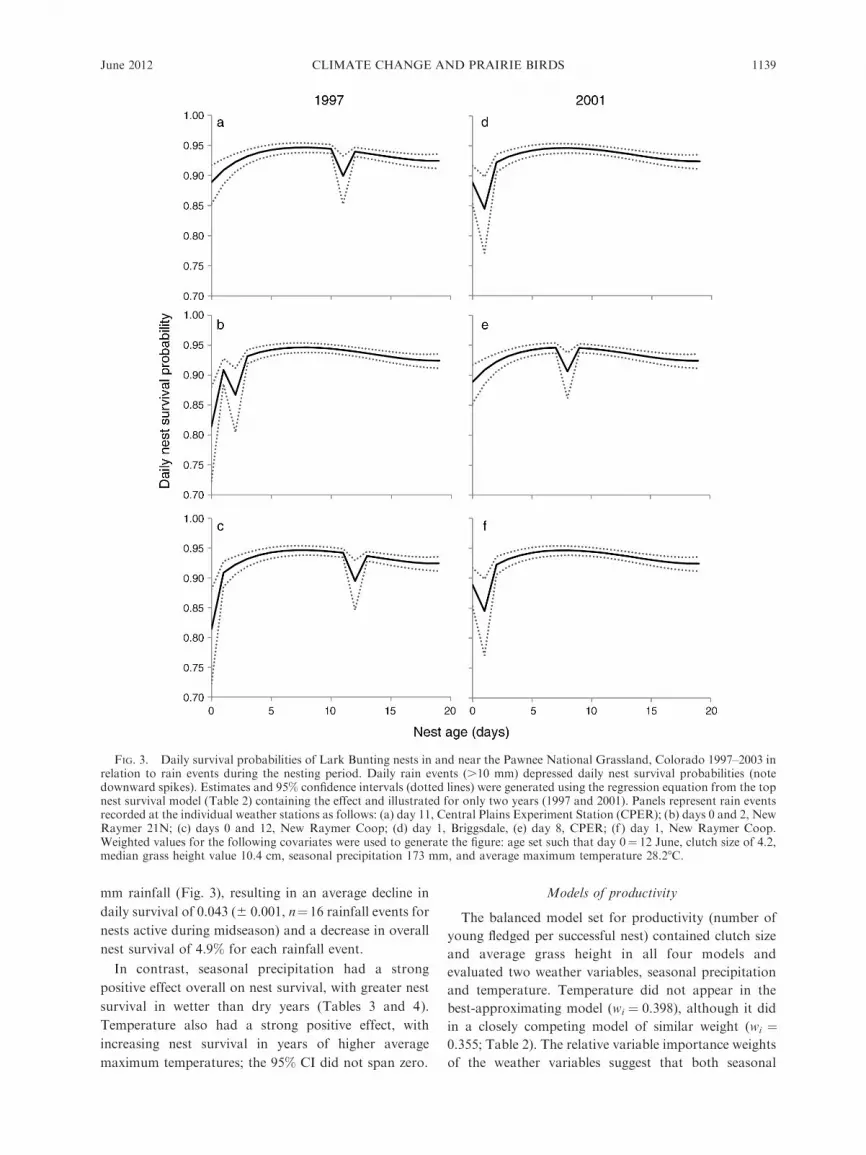
mm rainfall (Fig. 3), resulting in an average decline in
daily survival of 0.043 (6 0.001, n¼16 rainfall events for
nests active during midseason) and a decrease in overall
nest survival of 4.9% for each rainfall event.
In contrast, seasonal precipitation had a strong
positive effect overall on nest survival, with greater nest
survival in wetter than dry years (Tables 3 and 4).
Temperature also had a strong positive effect, with
increasing nest survival in years of higher average
maximum temperatures; the 95% CI did not span zero.
Models of productivity
The balanced model set for productivity (number of
young fledged per successful nest) contained clutch size
and average grass height in all four models and
evaluated two weather variables, seasonal precipitation
and temperature. Temperature did not appear in the
best-approximating model (wi ¼ 0.398), although it did
in a closely competing model of similar weight (wi ¼0.355; Table 2). The relative variable importance weights
of the weather variables suggest that both seasonal
FIG. 3. Daily survival probabilities of Lark Bunting nests in and near the Pawnee National Grassland, Colorado 1997–2003 inrelation to rain events during the nesting period. Daily rain events (.10 mm) depressed daily nest survival probabilities (notedownward spikes). Estimates and 95% confidence intervals (dotted lines) were generated using the regression equation from the topnest survival model (Table 2) containing the effect and illustrated for only two years (1997 and 2001). Panels represent rain eventsrecorded at the individual weather stations as follows: (a) day 11, Central Plains Experiment Station (CPER); (b) days 0 and 2, NewRaymer 21N; (c) days 0 and 12, New Raymer Coop; (d) day 1, Briggsdale, (e) day 8, CPER; (f ) day 1, New Raymer Coop.Weighted values for the following covariates were used to generate the figure: age set such that day 0¼ 12 June, clutch size of 4.2,median grass height value 10.4 cm, seasonal precipitation 173 mm, and average maximum temperature 28.28C.
June 2012 1139CLIMATE CHANGE AND PRAIRIE BIRDS
precipitation (0.754) and temperature (0.569) influenced
productivity during the years of our study. Productivity
increased with increasing clutch size, declined with
increasing average grass height, and was greater in
wetter years (Table 3). In contrast to the relative
variable importance weight, the regression coefficient
and confidence intervals did not suggest a relationship
between productivity and temperature. The effect of
temperature may have been masked by the effects of
annual precipitation because the two variables were
moderately negatively correlated (r2 ¼ 0.274).
Projections of reproductive parameters
under future climate scenarios
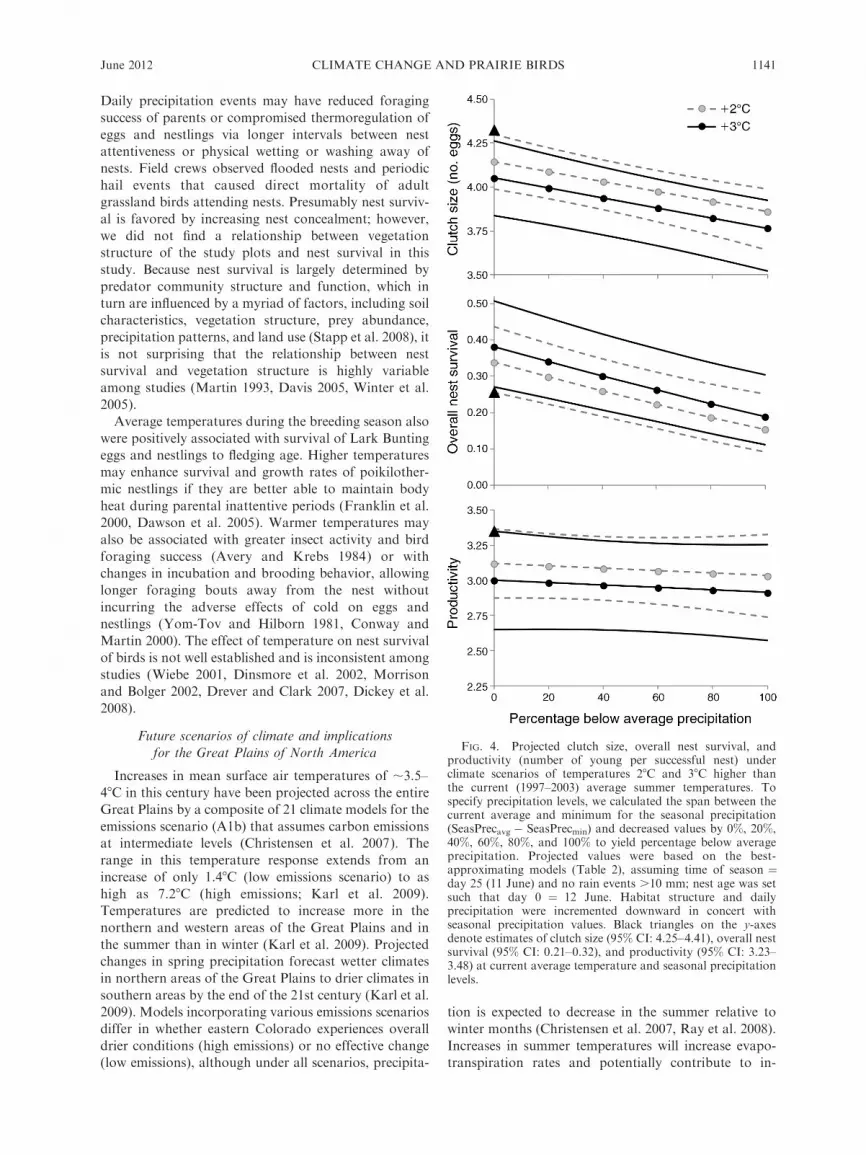
Reproductive parameters were predicted at average
mean temperature increases of 28 and 38C during the
breeding season (or similarly, average maximum tem-
perature increases of 3.38 and 4.48C). For all future
scenarios, the number of young produced per 100 nests
increased with increasing temperatures (due to increases
in nest survival) but declined with reductions in
precipitation. Higher temperatures with no accompany-
ing change in precipitation led to 4–6% smaller clutches,
31–50% higher daily nest survival, and 5–8% lower
productivity (Fig. 4). These changes yielded 22–32%additional young per 100 nests, corresponding to a rise
in fecundity from 0.72 to 0.88–0.95. However, under
scenarios of rising temperatures and declines in seasonal
precipitation to the minimum observed in our study,
clutch size, daily nest survival, and productivity all
declined by 12–14%, 27–40%, and 7–10%, at 2–38C
increases, respectively. The number of young per 100
nests declined by 36–46% and fecundity declined to
0.39–0.46.
DISCUSSION
Species’ responses to environmental change have
consequences for population persistence through time.
When challenged with climate change, species can evolve
new physiological tolerances or behaviors, they can
maintain their current ecological niches and move
spatially to track suitable conditions, or they can face
extirpation. This study suggests that our focal species
will be negatively affected by predicted climate change
because several facets of reproductive performance were
reduced under drought conditions. Decreased seasonal
precipitation negatively influenced clutch size in Lark
Buntings, as well as nest survival and productivity after
the effects of clutch size were considered. Higher
temperatures also depressed clutch size. With predicted
temperature increases of 2–38C, decreases in average
precipitation beyond 30–40% could lead to declines in
fecundity, further compromising the ability of local
populations to persist in the absence of immigration
(sensu Yackel Adams et al. 2007).
In semiarid environments, climatic influences on food
abundance and predation may potentially yield the
patterns of avian reproductive success that we observed.
Increased precipitation may enhance primary and
secondary productivity (e.g., biomass of invertebrate
prey), which may then lead to greater clutch sizes and
higher fledging success. Larger clutches of two passerine
species, Brewer’s Sparrow (Spizella breweri ) in the
northern Great Basin and Rufous-crowned Sparrow
(Aimophila ruficeps) in coastal southern California
(Rotenberry and Wiens 1989, 1991, Morrison and
Bolger 2002) in wetter years support this idea. During
drought periods, food scarcity may demand that parents
have longer foraging bouts and thus spend less time
defending the nest from predators (Schmidt 1999).
Predation may also increase during drought if food
scarcity results in greater intensity of spontaneous
begging by underfed nestlings early in the nestling
period (A. A. Yackel Adams, personal observation).
Although wet years of our study generally favored
nest survival, large precipitation events (.10 mm)
temporarily depressed daily survival of nests. In
Colorado, 70–80% of the annual precipitation falls
during the growing season, and severe thunderstorms
and hail damage regularly occur (Doesken et al. 2003).
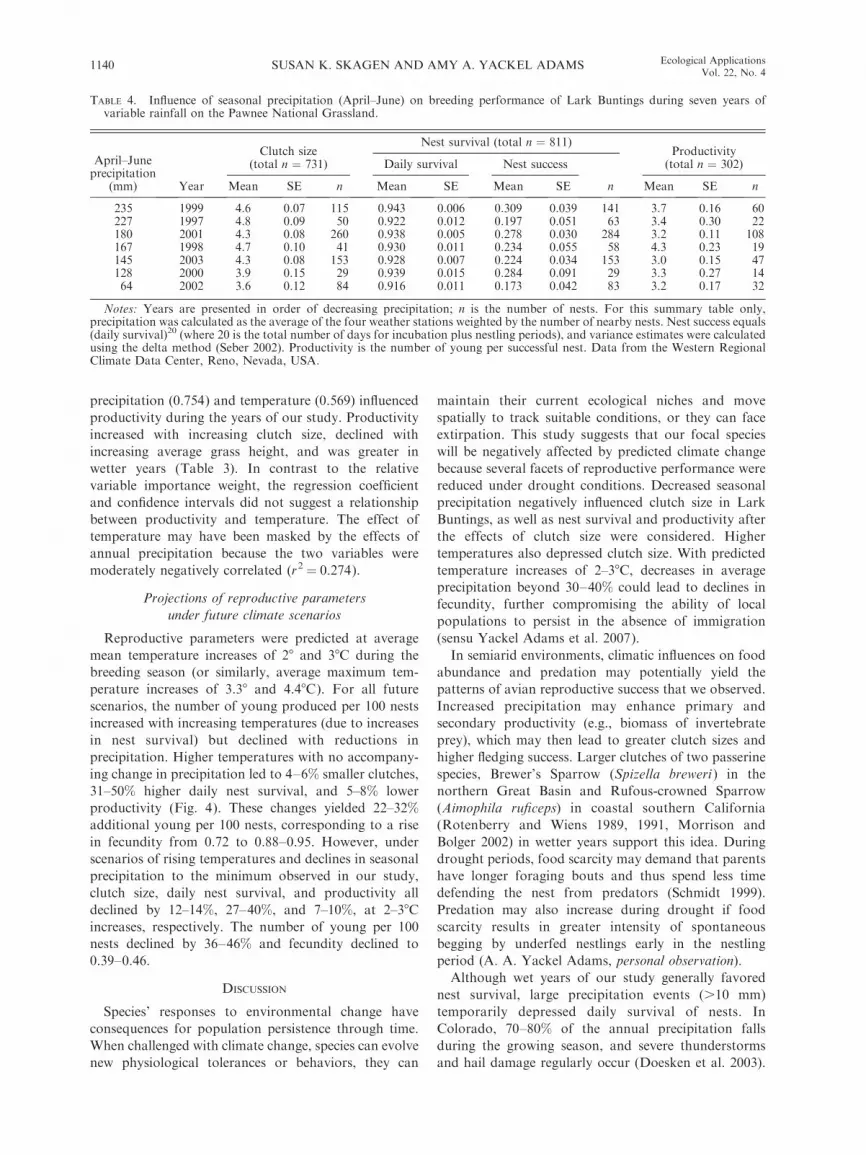
TABLE 4. Influence of seasonal precipitation (April–June) on breeding performance of Lark Buntings during seven years ofvariable rainfall on the Pawnee National Grassland.
Notes: Years are presented in order of decreasing precipitation; n is the number of nests. For this summary table only,precipitation was calculated as the average of the four weather stations weighted by the number of nearby nests. Nest success equals(daily survival)20 (where 20 is the total number of days for incubation plus nestling periods), and variance estimates were calculatedusing the delta method (Seber 2002). Productivity is the number of young per successful nest. Data from the Western RegionalClimate Data Center, Reno, Nevada, USA.
SUSAN K. SKAGEN AND AMY A. YACKEL ADAMS1140 Ecological ApplicationsVol. 22, No. 4
Daily precipitation events may have reduced foraging
success of parents or compromised thermoregulation of
eggs and nestlings via longer intervals between nest
attentiveness or physical wetting or washing away of
nests. Field crews observed flooded nests and periodic
precipitation patterns, and land use (Stapp et al. 2008), it
is not surprising that the relationship between nest
survival and vegetation structure is highly variable
among studies (Martin 1993, Davis 2005, Winter et al.
2005).
Average temperatures during the breeding season also
were positively associated with survival of Lark Bunting
eggs and nestlings to fledging age. Higher temperatures
may enhance survival and growth rates of poikilother-
mic nestlings if they are better able to maintain body
heat during parental inattentive periods (Franklin et al.
2000, Dawson et al. 2005). Warmer temperatures may
also be associated with greater insect activity and bird
foraging success (Avery and Krebs 1984) or with
changes in incubation and brooding behavior, allowing
longer foraging bouts away from the nest without
incurring the adverse effects of cold on eggs and
nestlings (Yom-Tov and Hilborn 1981, Conway and
Martin 2000). The effect of temperature on nest survival
of birds is not well established and is inconsistent among
studies (Wiebe 2001, Dinsmore et al. 2002, Morrison
and Bolger 2002, Drever and Clark 2007, Dickey et al.
2008).
Future scenarios of climate and implications
for the Great Plains of North America
Increases in mean surface air temperatures of ;3.5–
48C in this century have been projected across the entire
Great Plains by a composite of 21 climate models for the
emissions scenario (A1b) that assumes carbon emissions
at intermediate levels (Christensen et al. 2007). The
range in this temperature response extends from an
increase of only 1.48C (low emissions scenario) to as
high as 7.28C (high emissions; Karl et al. 2009).
Temperatures are predicted to increase more in the
northern and western areas of the Great Plains and in
the summer than in winter (Karl et al. 2009). Projected
changes in spring precipitation forecast wetter climates
in northern areas of the Great Plains to drier climates in
southern areas by the end of the 21st century (Karl et al.
2009). Models incorporating various emissions scenarios
differ in whether eastern Colorado experiences overall
drier conditions (high emissions) or no effective change
(low emissions), although under all scenarios, precipita-
tion is expected to decrease in the summer relative to
winter months (Christensen et al. 2007, Ray et al. 2008).
Increases in summer temperatures will increase evapo-
transpiration rates and potentially contribute to in-
FIG. 4. Projected clutch size, overall nest survival, andproductivity (number of young per successful nest) underclimate scenarios of temperatures 28C and 38C higher thanthe current (1997–2003) average summer temperatures. Tospecify precipitation levels, we calculated the span between thecurrent average and minimum for the seasonal precipitation(SeasPrecavg � SeasPrecmin) and decreased values by 0%, 20%,40%, 60%, 80%, and 100% to yield percentage below averageprecipitation. Projected values were based on the best-approximating models (Table 2), assuming time of season ¼day 25 (11 June) and no rain events .10 mm; nest age was setsuch that day 0 ¼ 12 June. Habitat structure and dailyprecipitation were incremented downward in concert withseasonal precipitation values. Black triangles on the y-axesdenote estimates of clutch size (95% CI: 4.25–4.41), overall nestsurvival (95% CI: 0.21–0.32), and productivity (95% CI: 3.23–3.48) at current average temperature and seasonal precipitationlevels.
June 2012 1141CLIMATE CHANGE AND PRAIRIE BIRDS
creased frequency of meteorological droughts (Karl et
al. 2008), especially in seasons and areas of stable or
declining precipitation, such as summers in eastern
Colorado.
The findings from this study suggest that, within a
local area, the components of climate have different
effects on reproductive success. In the immediate future,
the negative effects of reduced spring and summer
precipitation on daily nest survival may be offset
partially by the positive influences of temperature
increases up to 38C (within the range of temperatures
in our study) and of potential declines in frequency of
large rain events (.10 mm). Declining seasonal precip-
itation and increasing temperatures (again, within the
ranges measured during our study) could also contribute
to smaller clutches, although there may be a slight
increase in the proportion of eggs that survive to
fledging.
Climate change and birds: an evolutionary perspective
Perspectives from paleoclimate and evolutionary
history can help to refine questions and identify possible
management directions/actions toward the conservation
of native bird populations and their habitats in light of
pending climate change. The highly variable climatic
conditions experienced by prairie biota across several
spatial and temporal scales are evidenced by the climate
history of the Great Plains. Grassland birds, and
presumably Lark Buntings, have persisted through
millennia of both climate stasis and extreme variability
throughout their evolutionary history. Passerines ap-
peared in the northern hemisphere by 25 Mya [million
years ago] (Steadman 2005). Fossil evidence of modern
grassland songbirds dates to the early Pliocene, 4.3–4.8
Mya (Emslie 2007), with identified fossil remains
specifically of Lark Buntings in southwestern Kansas
in the late Pleistocene (26 700–29 000 yr BP; Downs
1954, Shane 2000). Extensive prairie and steppe habitat
dominated the Great Plains during the early Pliocene
when the climate was relatively stable; with the advent of
the glacial–interglacial cycles of the Pleistocene begin-
ning ca. 2.5 Mya, the prairie–steppe habitat periodically
appeared and disappeared (Emslie 2007). During the
past 10 000 years (the Holocene), relatively moist
conditions on North American grassland landscapes
were repeatedly interrupted with droughts intense
enough to impact vegetation composition and mobilize
sand dunes (Forman et al. 2001).
During the 20th century, the American West has
experienced less frequent and less severe droughts than
the conditions revealed in paleoclimate records of the
last 1000 years (Ray et al. 2008). Over the past 400 years,
droughts as intense or greater than the extreme droughts
of the 1930s and 1950s occurred with some regularity,
and prior to AD 1600, droughts were longer (often
spanning decades) and more spatially extensive than
droughts of the 20th century (Woodhouse and Overpeck
1998). Tree ring and lake salinity records extending back
2000 years also suggest overall drier conditions and
more frequent and persistent droughts prior to AD 1200
than in modern times (Laird et al. 1996). Our study
period included the drought of 2002 across the Great
Plains of North America, one of the six driest periods of
the past century (Ray et al. 2008).
At broad spatial and temporal scales, Lark Buntings
and other prairie birds presumably have evolved
strategies that allow them to cope with the extreme
interdecadal and interannual climate variability of the
Holocene. Selection for migratory behavior purportedly
tions have increased in eastern Montana (Sauer et al.
2011), a relatively intact grassland landscape where the
climate is only slightly drier than eastern Colorado,
based on data from the Western Regional Climate
Center.
The behavioral traits of vagility and opportunism,
which enable Lark Buntings to respond to long- and
short-term habitat conditions influenced by weather
variation, may lead to northerly and easterly shifts in
distribution if precipitation and habitat conditions
become more favorable there than in areas predicted
SUSAN K. SKAGEN AND AMY A. YACKEL ADAMS1142 Ecological ApplicationsVol. 22, No. 4
to be drier: the southern and western regions of the
Great Plains. However, distributional shifts in Lark
Buntings may be constrained by changes in land use,
agricultural practices, and vegetative communities that
diminish the extent of short- and mixed-grass prairie
habitats in areas with more favorable climatic condi-
tions. For example, northward and eastward shifts in
Buntings may be hindered if rising temperatures and
increased evapotranspiration also push the optimum
latitude and longitude for crops, and thus agricultural
intensity, northward and eastward. Conversely, in-
creased summer dryness in Colorado, coupled with the
redirection of water used for agriculture to cities
(Wiener et al. 2008), may cause a reduction in cropland
in the region, yet this change would only lead to benefits
for prairie birds if habitat structure in abandoned
croplands and prevailing climatic conditions were
favorable.
It is useful to acknowledge that many modern birds
have coped with changing climates during their evolu-
tionary pasts (Lovette 2005), primarily by broadening
niches or redistributing on the landscape. Birds currently
exposed to extensive year-to-year climate variability,
such as grassland birds in the Great Plains of North
America, show responses to climate change in an
ecological time frame. Our study species redistributes
in response to precipitation (Price 1995, Niemuth et al.
2008), yet land use change and human perturbations of
grassland systems may yield limited opportunities for
such a redistribution. Our data and analyses demon-
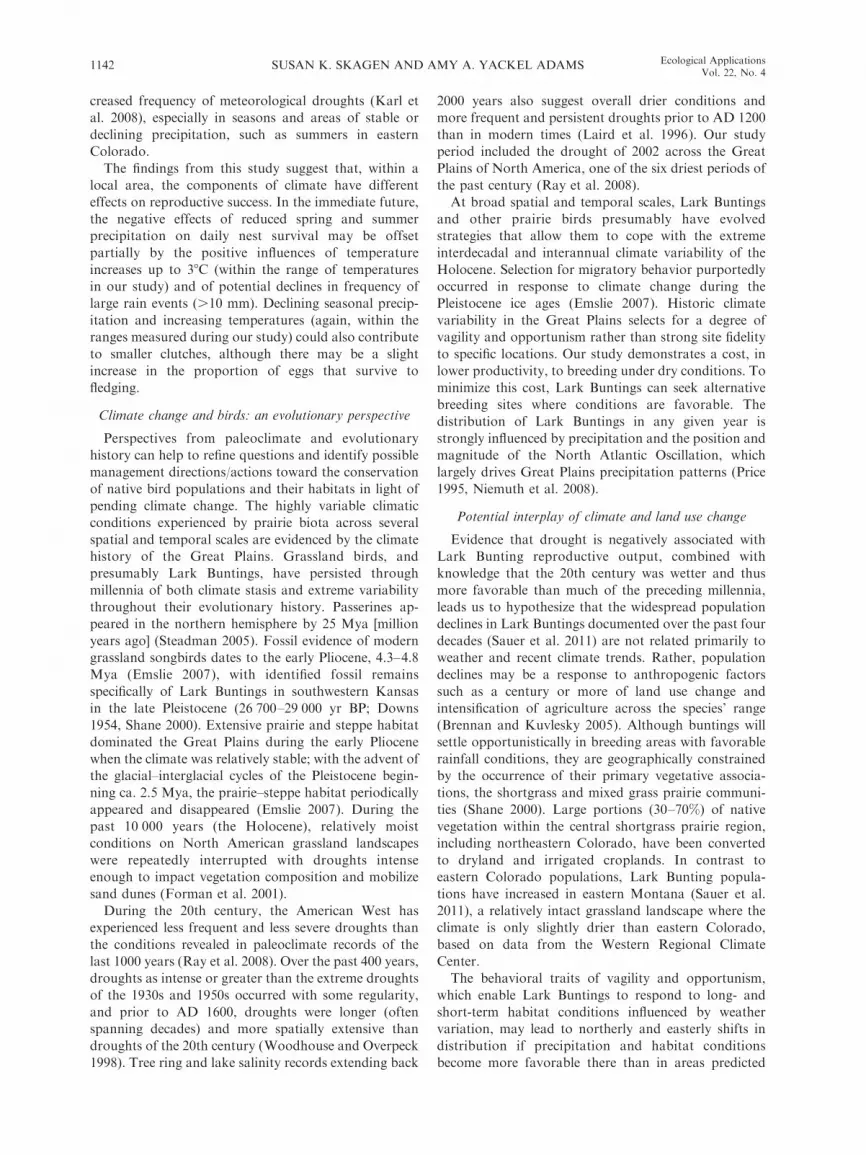
PLATE 1. (Top panel) Female sitting on nest and (lower panel) male with food. Both male and female Lark Buntings participatein the incubation and care of young. Photo credit: A. A. Yackel Adams.
June 2012 1143CLIMATE CHANGE AND PRAIRIE BIRDS
strate the costs (lower reproductive output) of breeding
in an area during a drought, and thus the costs of highly
altered landscapes that constrain movements because
there is no habitat suitable for immigration. Protection
of grasslands through easement programs and manage-
ment through the use of grazing and fire would provide
a buffer against climate change by allowing the Lark
Bunting to shift into suitable areas as needed.
ACKNOWLEDGMENTS
We extend our gratitude to our dedicated field crews: R.Adams, R. Corcoran, M. Dillon, A. Lueders, E. DeMasters, J.Tjornehoj, T. Cronk, Z. Draper, S. Patterson, M. Eitel, and C.Melcher, and we thank the numerous volunteers who assisted insearching for nests. For logistical support, housing, andvehicles, we thank J. Godbey (USGS), D. Weber (USFS),and G. Schoonveld (Colorado DOW). Weather data for theyears of our study were acquired from the Western RegionalClimate Center (http://www.wrcc.dri.edu/) and the ShortgrassSteppe Long Term Ecological Research group, a partnershipbetween Colorado State University, the U.S. Department ofAgriculture, Agricultural Research Service, and the U.S. ForestService Pawnee National Grassland. Significant funding for thelatter data was provided by the National Science FoundationLong Term Ecological Research program (NSF Grant NumberDEB-0217631). L. E. Burris designed Fig. 1 and summarizedlong-term climate data acquired from PRISM (Parameter–elevation Regressions on Independent Slopes Model, OregonState University). N. Carr, J. J. Fontaine, J. P. McCarty, D. B.Poole, and three anonymous reviewers provided comments.This project was supported by the U.S. Geological Survey, theU.S. Fish and Wildlife Survey Region 6, and the Great PlainsLandscape Conservation Cooperative. Any use of trade namesis for descriptive purposes only and does not imply endorse-ment by the U.S. Government.
LITERATURE CITED
Ahola, M. P., T. Laaksonen, T. Eeva, and E. Lehikoinen. 2007.Climate change can alter competitive relationships betweenresident and migratory birds. Journal of Animal Ecology76:1045–1052.
Augustine, D. J., D. T. Booth, S. Cox, and J. D. Derner. 2012.Grazing intensity and spatial heterogeneity in bare soil in agrazing-resistant grassland. Rangeland Ecology and Man-agement 65:39–46.
Avery, M. I., and J. R. Krebs. 1984. Temperature and foragingsuccess of Great Tits Parus major hunting for spiders. Ibis126:33–38.
Bolton, M., P. Monaghan, and D. C. Houston. 1993. Proximatedetermination of clutch size in lesser black-backed gulls: theroles of food supply and body condition. Canadian Journalof Zoology 71:273–279.
Brennan, L. A., and W. P. Kuvlesky, Jr. 2005. North Americangrassland birds: an unfolding conservation crisis? Journal ofWildlife Management 69:1–13.
Burnham, K. P., and D. R. Anderson. 2002. Model selectionand inference: a practical information-theoretic approach.Second edition. Springer-Verlag, New York, New York,USA.
Christensen, J. H., et al. 2007. Regional climate projections.Pages 847–940 in S. Solomon, D. Qin, M. Manning, M.Marquis, K. B. Averyt, M. Tignor, H. L. Miller, and Z.Chen, editors. Climate change 2007: The physical basis.Contribution of Working Group I to the Fourth AssessmentReport of the Intergovernmental Panel on Climate Change.Cambridge University Press, Cambridge, UK. http://www.ipcc.ch/publications_and_data/ar4/wg1/en/ch11.html
Conway, C. J., and T. E. Martin. 2000. Evolution of passerineincubation behavior: influence of food, temperature, and nestpredation. Evolution 54:670–685.
Cooch, E. G., and G. C. White, editors. 2011. ProgramMARK: a gentle introduction. http://www.phidot.org/software/mark/docs/book/
Crick, H. Q. P., and T. H. Sparks. 1999. Climate change relatedto egg-laying trends. Nature 399:423.
Daubenmire, R. F. 1959. A canopy coverage method ofvegetational analysis. Northwest Science 35:43–64.
Davis, S. K. 2005. Nest-site selection patterns and the influenceof vegetation on nest survival of mixed-grass prairiepasserines. Condor 107:605–616.
Dawson, R. D., C. C. Lawrie, and E. L. O’Brien. 2005. Theimportance of microclimate variation in determining size,growth and survival of avian offspring: experimentalevidence from a cavity nesting passerine. Oecologia144:499–507.
Dickey, M. H., G. Gauthier, and M. C. Cadieux. 2008. Climaticeffects on the breeding phenology and reproductive success ofan arctic-nesting goose species. Global Change Biology14:1973–1985.
Dinsmore, S. J., G. C. White, and F. L. Knopf. 2002. Advancedtechniques for modeling avian nest survival. Ecology83:3476–3488.
Doesken, N. J., R. A. Pielke, Sr., and O. A. P. Bliss. 2003.Climate of Colorado. Climatography of the United StatesNo. 60. National Climatic Data Center, Asheville, NorthCarolina, USA.
Downs, T. 1954. Pleistocene birds from the Jones Fauna ofKansas. Condor 56:207–221.
Drever, M. C., and R. G. Clark. 2007. Spring temperature,clutch initiation date and duck nest success: a test of themismatch hypothesis. Journal of Animal Ecology 76:139–148.
Emslie, S. D. 2007. Fossil passerines from the early Pliocene ofKansas and the evolution of songbirds in North America.Auk 124:85–95.
Forman, S. L., R. Oglesby, and R. S. Webb. 2001. Temporaland spatial patterns of Holocene dune activity on the GreatPlains of North America: megadroughts and climate links.Global and Planetary Change 29:1–29.
Franklin, A. B., D. R. Anderson, R. J. Gutierrez, and K. P.Burnham. 2000. Climate, habitat quality, and fitness inNorthern Spotted Owl populations in northwestern Califor-nia. Ecological Monographs 70:539–590.
George, T. L., A. C. Fowler, R. L. Knight, and L. C. McEwen.1992. Impacts of a severe drought on grassland birds inwestern North Dakota. Ecological Applications 2:275–284.
Grant, T. A., T. L. Shaffer, E. M. Madden, and P. J. Pietz.2005. Time specific variation in passerine nest survival: newinsights into old questions. Auk 122:661–672.
Karl, T. R., G. A. Meehl, C. D. Miller, S. J. Hassol, A. M.Waple, and William L. Murray, editors. 2008. Weather andclimate extremes in a changing climate. U.S. Climate ChangeScience Program Synthesis and Assessment Product 3.3.Department of Commerce, Washington, D.C., USA. http://www.climatescience.gov/Library/sap/sap3-3/final-report/
Karl, T. R., J. M. Melillo, and T. C. Peterson, editors. 2009.Global climate change impacts in the United States. Cam-bridge University Press, New York, USA. http://www.globalchange.gov/usimpacts
Laird, K. R., S. C. Fritz, K. A. Maasch, and B. F. Cumming.1996. Greater drought intensity and frequency before A.D.1200 in the northern Great Plains, USA. Nature 384:552–554.
Lovette, I. J. 2005. Glacial cycles and the tempo of avianspeciation. Trends in Ecology and Evolution 20:57–59.
Manolis, J. C., D. E. Andersen, and F. J. Cuthbert. 2000.Uncertain nest fates in songbird studies and variation inMayfield estimation. Auk 117:615–626.
SUSAN K. SKAGEN AND AMY A. YACKEL ADAMS1144 Ecological ApplicationsVol. 22, No. 4
Martin, T. E. 1993. Nest predation and nest sites: newperspectives on old patterns. BioScience 43:523–532.
Miller-Rushing, A. J., T. L. Lloyd-Evans, R. B. Primack, andP. Satzinger. 2008. Bird migration times, climate change, andchanging population sizes. Global Change Biology 14:1959–1972.
Morrison, S. A., and D. T. Bolger. 2002. Variation in asparrow’s reproductive success with rainfall: food andpredator-mediator processes. Oecologia 133:315–324.
Niemuth, N. D., J. W. Solberg, and T. L. Shaffer. 2008.Influence of moisture on density and distribution of grasslandbirds in North Dakota. Condor 110:211–222.
North American Bird Conservation Initiative, U.S. Committee.2009. The state of the birds, United States of America, 2009.U.S. Department of Interior, Washington, D.C., USA.
Parmesan, C., and G. Yohe. 2003. A globally coherentfingerprint of climate change impacts across natural systems.Nature 421:37–42.
Peterson, A. T. 2003. Projected climate change effects on RockyMountain and Great Plains birds: generalities of biodiversityconsequences. Global Change Biology 9:647–655.
Pielke, R. A., Sr., and N. J. Doesken. 2008. Climate of theshortgrass steppe. Pages 14–29 in W. K. Lauenroth and I. C.Burke, editors. Ecology of the shortgrass steppe: a long-termperspective. Oxford University Press, New York, New York,USA.
Price, J. T. 1995. Potential impacts of global climate change onthe summer distributions of some North American grasslandbirds. Dissertation. Wayne State University, Detroit, Mich-igan, USA.
PRISM Climate Group. 2010. PRISM products matrix.PRISM Climate Group, Oregon State University, Corvallis,Oregon, USA. http://prism.oregonstate.edu/
Ray, A. J., J. J. Barsugli, and K. B. Averyt. 2008. Climatechange in Colorado: a synthesis to support water resourcesmanagement and adaptation. CU-NOAA Western WaterAssessment, Boulder, Colorado, USA.
Root, T. L., J. T. Price, K. R. Hall, S. H. Schneider, C.Rosenzweig, and J. A. Pounds. 2003. Fingerprints of globalwarming on wild animals and plants. Nature 42:57–60.
Rotenberry, J. T., and J. A. Wiens. 1989. Reproductive biologyof shrubsteppe passerine birds: geographical and temporalvariation in clutch size, brood size, and fledging success.Condor 91:1–14.
Rotenberry, J. T., and J. A. Wiens. 1991. Weather andreproductive variation in shrubsteppe sparrows: a hierarchi-cal analysis. Ecology 72:1325–1335.
Sala, O. E., W. K. Lauenroth, and W. J. Parton. 1992. Long-term soil water dynamics in the shortgrass steppe. Ecology73:1175–1181.
Sanz, J. J. 2003. Large-scale effect of climate change onbreeding parameters of pied flycatchers in Western Europe.Ecography 26:45–50.
Sanz, J. J., J. Potti, J. Moreno, S. Merino, and O. Frı́as. 2003.Climate change and fitness components of a migratory birdbreeding in the Mediterranean region. Global ChangeBiology 9:461–472.
Sauer, J. R., J. E. Hines, J. E. Fallon, K. L. Pardieck, D. J.Ziolkowski, Jr., and W. A. Link. 2011. The North AmericanBreeding Bird Survey, results and analysis 1966–2009.Version 3.23.2011. USGS Patuxent Wildlife Research Center,Laurel, Maryland, USA. http://www.mbr-pwrc.usgs.gov/bbs/bbs.html
Schmidt, K. A. 1999. Foraging theory as a conceptualframework for studying nest predation. Oikos 85:151–159.
Seber, G. A. F. 2002. The estimation of animal abundance andrelated parameters. Second edition. Blackburn Press, Cald-well, New Jersey, USA.
Shane, T. G. 2000. Lark Bunting (Calamospiza melanocorys).No. 542 in A. Poole and F. Gill, editors. The birds of NorthAmerica. Academy of Natural Sciences, Philadephia, Penn-sylvannia, and American Ornithologists’ Union, Washing-ton, D.C., USA.
Shortgrass Steppe Long Term Ecological Research. 2010. SGSLTER Annual Report 2010: activities and findings. http://sgslter.colostate.edu/pdfs/2010rprts-prpsls/2010FinalAR.pdf
Sillett, T. S., R. T. Holmes, and T. W. Sherry. 2000. Impacts ofa global climate cycle on population dynamics of a migratorysongbird. Science 288:2040–2042.
Simmons, R. E., P. Barnard, W. R. J. Dean, G. F. Midgley, W.Thuiller, and G. Hughes. 2004. Climate change in birds:perspectives and prospects from southern Africa. Ostrich75:295–308.
Stapp, P., B. Van Horne, and M. D. Lindquist. 2008. Ecologyof mammals of the shortgrass steppe. Pages 132–180 inW. K.Lauenroth and I. C. Burke, editors. Ecology of the shortgrasssteppe: a long-term perspective. Oxford University Press,New York, New York, USA.
Steadman, D. W. 2005. The paleoecology and fossil history ofmigratory landbirds. Pages 5–17 in R. Greenberg and P. P.Marra, editors. Birds of two worlds: the ecology andevolution of migration. Johns Hopkins University Press,Baltimore, Maryland, USA.
SYSTAT. 2009. SYSTAT 13. Systat Software, Chicago,Illinois, USA.
Walther, G.-R., E. Post, P. Convey, A. Menzel, C. Parmesan,T. J. C. Beebee, J.-M. Fromentin, O. Hoegh-Guldberg, andF. Bairlein. 2002. Ecological responses to recent climatechange. Nature 416:389–395.
Westerskov, K. 1950. Methods for determining the age of gamebird eggs. Journal of Wildlife Management 14:56–67.
Westneat, D. F., I. R. K. Stewart, and M. I. Hatch. 2009.Complex interactions among temporal variables affect theplasticity of clutch size in a multi-brooded bird. Ecology90:1162–1174.
White, G. C., and K. P. Burnham. 1999. Program MARK:survival estimation from populations of marked animals.Bird Study 46:120–139.
Wiebe, K. L. 2001. Microclimate of tree cavity nests: is itimportant for reproductive success in Northern Flickers?Auk 118:412–421.
Wiener, J. D., K. A. Dwire, S. K. Skagen, R. R. Crifasi, and D.Yates. 2008. Riparian ecosystem consequences of waterredistribution along the Colorado Front Range. WaterResources Impact 10:18–21.
Winter, M., D. H. Johnson, and J. A. Shaffer. 2005. Variabilityin vegetation effects on density and nesting success ofgrassland birds. Journal of Wildlife Management 69:185–197.
Woodhouse, C. A., and J. T. Overpeck. 1998. 2000 years ofdrought variability in the central United States. Bulletin ofthe American Meteorological Society 79:2693–2714.
Yackel Adams, A. A., S. K. Skagen, and J. A. Savidge. 2007.Population-specific demographic estimates provide insightsinto declines of Lark Buntings (Calamospiza melanocorys).Auk 124:578–593.
Yom-Tov, Y., and R. Hilborn. 1981. Energetic constraints onclutch size and time of breeding in temperate zone birds.Oecologia 48:234–243.
Zuckerberg, B., A. J. Woods, and W. F. Porter. 2009. Polewardshifts in breeding bird distributions in New York State.Global Change Biology 15:1866–1883.