

Superfund Records Ce'"* SITE: Aw&dUfft BREAK: UT ^ OTHER: 3 ^ 7 (
EPA WORK ASSIGNMENT NUMBER: 04-1L43
EPA CONTRACT NUMBER: 6 8 - 0 1 - 7 2 5 0
EBASCO SERVICES INCORPORATED
DRAfT FINAL
BASELIN# ECOLOGICAL RISK ASSESSMENT
NEW BEDFORD HARBOR SITE FEASIBILITY STUDY
APRIL 1990
Prepared by:
Richard A. McGrath Senior Environmental Scientist E.C. Jordan Co.
Submitted by : Approved by:
Site E.C. Jordan Co
Alan S. Fowler Project Lead Ebasco Services, Inc.
NOTICE
The information in this document has been funded by the United States Environmental Protection Agency (EPA) under REM III Contract No. 68-01-7250 to Ebasco Services, Inc. (Ebasco). This document has been formally released by Ebasco to the EPA. This document does not represent, however, the EPA's position or policy, and has not been formally released by the EPA.

NEW BEDFORD HARBOR, MASSACHUSETTS ECOLOGICAL RISK ASSESSMENT
TABLE OF CONTENTS
Section Title Page No.
EXECUTIVE SUMMARY ES-1
1.0 INTRODUCTION 1-1
1.1 NEW BEDFORD HARBOR ECOSYSTEM 1-1
1.2 SITE HISTORY 1-3
1.3 OBJECTIVES AND LIMITATIONS OF THIS REPORT. . . 1-5
1.4 PROGRAM DATA BASE 1-11
1.4.1 PCB Concentrations in Sediments . . . . 1-12
1.4.1.1 BOS Calibration/Validation Data 1-12
1.4.1.2 Alliance Data Base 1-13 1.4.1.3 NUS Data Base 1-13 1.4.1.4 Selection of Data 1-13 1.4.1.5 Sample Depths 1-14 1.4.1.6 Data Conversions 1-14 1.4.1.7 Data Processing and Analysis . 1-15
1.4.2 PCB Water Concentrations . . . . . . . 1-15 1.4.3 Metals Concentrations 1-16
1.5 OVERVIEW OF METHOD FOR THE ECOLOGICAL RISK ASSESSMENT 1-16
2.0 EXPOSURE ASSESSMENT 2-1
2.1 RECEPTOR IDENTIFICATION 2-3
2.1.1 Exposed Species-Analysis 2-3
2.1.2 Species of Concern 2-4
2.2 EXPOSURE LEVELS FOR RECEPTORS 2-6
2.2.1 Introduction 2-6 2.2.2 Methods 2-7 2.2.3 Exposure to Water Column Contamination. 2-8

NEW BEDFORD HARBOR, MASSACHUSETTS ECOLOGICAL RISK ASSESSMENT
TABLE OF CONTENTS
Section Title Page No.
2.2.3.1 Species and Mechanisms 2-8 2.2.3.2 PCB Exposure Concentrations
in Water 2-9 2.2.3.3 Metals Exposure Concentrations
in Water 2-9
2.2.4 Exposure to Sediment Contamination. . . . 2-12
2.2.4.1 Species and Mechanisms 2-12 2.2.4.2 PCB Exposure Concentrations
in Sediment Pore Water 2-13 2.2.4.3 Metals Exposure Concentrations
in Sediment Pore Water 2-13
2.2.5 Exposure to Contaminated Food 2-15
3.0 ECOTOXOCITY ASSESSMENT 3-1
3.1 ECOTOXICITY PROFILES 3-1
3.1.1 PCBs 3-1 3.1.2 Copper 3-3 3.1.3 Cadmium 3-4 3.1.4 Lead 3-5
3.2 EFFECTS EVALUATION 3-5
3.2.1 Methods 3-5
3.2.2 Application and Results 3-7
3.2.2.1 Marine Fish 3-7 3.2.2.2 Crustaceans 3-9 3.2.2.3 Mollusks 3-11 3.2.2.4 Polychaetes 3-12 3.2.2.5 Algae 3-12
3.2.3 Evaluation of MATCs 3-13
4.0 RISK CHARACTERIZATION 4-1
4.1 JOINT PROBABILITY ANALYSIS 4-1
4.1.1 PCB Water Column Contamination 4-1 4.1.2 PCB Sediment Contamination 4-12 4.1.3 Water Column Metals Contamination. . . . 4-16 4.1.4 Sediment Metals Contamination 4-20

NEW BEDFORD HARBOR, MASSACHUSETTS ECOLOGICAL RISK ASSESSMENT
TABLE OF CONTENTS
Section Title Page No.
4.2 COMPARISON WITH AMBIENT WATER QUALITY CRITERIA 4-20
4.2.1 Water Column Concentrations 4-20
4.2.2 Sediment Concentrations 4-21
4.3 SITE-SPECIFIC TOXICITY TESTS 4-22
4.4 RISK DUE TO BIOACCUMULATION OF PCBS 4-24
4.5 BENTHIC SURVEYS 4-28
4.6 SUMMARY OF RISK CHARACTERIZATION 4-29
GLOSSARY OF ACRONYMS AND ABBREVIATIONS
REFERENCES
APPENDICES
APPENDIX A - EXPECTED EXPOSURE CONCENTRATIONS FOR COPPER, CADMIUM, AND LEAD
APPENDIX B - TOXICITY DATA FOR PCBS, COPPER, CADMIUM, AND LEAD
APPENDIX C - MATCS, EECS, AND CHRONIC EFFECTS PROBABILITIES FOR COPPER, CADMIUM, AND LEAD

NEW BEDFORD HARBOR, MASSACHUSETTS ECOLOGICAL RISK ASSESSMENT
LIST OF FIGURES
Figure Title Page No.
1-1 SITE LOCATION MAP 1-2
1-2 FISHERY CLOSURE AREAS 1-4
1-3 CHEMICAL STRUCTURE OF A PCB MOLECULE 1-8
2-1 HARBOR ZONATION FOR RISK ASSESSMENT 2-2
2-2 EECs BY ZONE FORPCBS, WATER COLUMN 2-11
2-3 EECs BY ZONE FOR PCBs, PORE WATER 2-14
2-4 LOBSTER FOOD CHAIN 2-16
2-5 FLOUNDER FOOD CHAIN 2-17
3-1 MATC CURVES FOR PCBs 3-10
4-1 MATC FOR ALGA AND EECS FOR ALL ZONES, PCBs, WATER COLUMN 4-2
4-2 MATC FOR MOLLUSKS AND EECs FOR ALL ZONES, PCBS, WATER COLUMN 4-3
4-3 MATC FOR CRUSTACEANS AND EECs FOR ALL ZONES, PCBs, WATER COLUMN 4-4
4-4 MATC FOR MARINE FISH AND EECs FOR ALL ZONES, PCBS, WATER COLUMN 4-5
4-5 CHRONIC EFFECTS PROBABILITIES FOR ALGA, PCBS, WATER COLUMN 4-8
4-6 CHRONIC EFFECTS PROBABILITIES FOR MOLLUSKS, PCBs, WATER COLUMN 4-9
4-7 CHRONIC EFFECTS PROBABILITIES FOR CRUSTACEANS, PCBs, WATER COLUMN 4-10
4-8 CHRONIC EFFECTS PROBABILITIES FOR MARINE FISH, PCBS, WATER COLUMN 4-11

NEW BEDFORD HARBOR, MASSACHUSETTS ECOLOGICAL RISK ASSESSMENT
LIST OF FIGURES
Figure Title Page No.
4-9 MATC FOR MOLLUSKS AND EECs FOR ALL ZONES, PCBs, PORE WATER 4-13
4-10 MATC FOR CRUSTACEANS AND EECs FOR ALL ZONES, PCBS, PORE WATER 4-14
4-11 MATC FOR MARINE FISH AND EECs FOR ALL ZONES, PCBS, PORE WATER 4-15
4-12 CHRONIC EFFECTS PROBABILITIES FOR MOLLUSKS, PCBS, PORE WATER 4-17
4-13 CHRONIC EFFECTS PROBABILITIES FOR CRUSTACEANS, PCBS, PORE WATER 4-18
4-14 CHRONIC EFFECTS PROBABILITIES FOR MARINE FISH, PCBs, PORE WATER 4-19

NEW BEDFORD HARBOR, MASSACHUSETTS ECOLOGICAL RISK ASSESSMENT
LIST OF TABLES
Table Title Page No.
2-1 DISTRIBUTION OF THE 28 SELECTED SPECIES OF CONCERN IN NEW BEDFORD HARBOR 2-5
2-2 EXPECTED EXPOSURE CONCENTRATIONS FOR PCBS. . . . 2-10
2-3 WHOLE-BODY CONCENTRATIONS OF TOTAL PCBS (PPM) IN ORGANISMS COLLECTED FROM NEW BEDFORD HARBOR 2-19
2-4 RANGE OF TOTAL WHOLE-BODY METALS IN NEW BEDFORD HARBOR BIOTA 2-21
3-1 PCB MATC ESTIMATES FOR ORGANISMS AT NEW BEDFORD HARBOR 3-8
4-1 CUMULATIVE PROBABILITY THAT THE EXPECTED EXPOSURE CONCENTRATION WILL EXCEED THE PCB MATC FOR THE PARTICULAR TAXON 4-6
4-2 CONVERSION OF WHOLE-BODY WINTER FLOUNDER PCB TISSUE CONCENTRATIONS TO EXPECTED GONAD CONCENTRATIONS 4-26

EXECUTIVE SUMMARY
New Bedford Harbor i s a t idal estuary on the western shore of Buzzards Bay, Massachusetts. Studies of the harbor conducted in the mid-197 0s indicated widespread po lychlor inated biphenyl (PCB) and heavy metals contamination. Large areas of the harbor were subsequently closed to fishing to reduce the potential for human exposure to PCBs. The New Bedford Harbor s i t e was added t o the U .S . Environmental Protect ion Agency (EPA) Interim National Pr ior i t i e s List in July 1982; shortly therea f ter , EPA i n i t i a t e d a more comprehensive assessment of the extent of the PCB contamination problem. These and o t h e r s t u d i e s have confirmed extensive PCB contamination of water, sediments, and biota in the harbor, with sediment concentrat ions reported in excess of 100,000 parts per mill ion (ppm) in the area of maximum contamination. Concentrations in biota in many areas exceed the U.S. Food and Drug Administration tolerance leve l of 2 ppm.
Under author i ty of the Comprehensive Environmental Response, Compensation, and L i a b i l i t y Act (or Superfund) , EPA i s r e s p o n s i b l e for conduct ing a Remedial I n v e s t i g a t i o n and Feas ib i l i ty Study (RI/FS) to support the need for and extent of remediation in New Bedford Harbor. This baseline ecological risk assessment, as part of the RI/FS proces s , presents and q u a n t i f i e s r i s k s to aquatic organisms due to exposure to PCBs and heavy metals in New Bedford Harbor. Based on c u r r e n t condit ions in the harbor, i t w i l l serve as a benchmark against which the e f f e c t i v e n e s s of various remedial opt ions may be evaluated.
The e c o l o g i c a l r i s k assessment i s based on data col lected by several invest igat ions , but draws most heav i ly on information generated by Batte l le (Battel le Pacific Northwest Laboratories, Richland, Washington; and B a t t e l l e Ocean Sc i ences , Ouxbury, M a s s a c h u s e t t s ) in c o n j u n c t i o n wi th the development of a numerical hydrodynamic/sediment-transport model of the harbor. Risk to aquatic b io ta was evaluated using a jo int probability a n a l y s i s in which two p r o b a b i l i t y d i s t r i b u t i o n s , one represent ing contaminant l eve l s in various zones of the harbor and the second r e p r e s e n t i n g t h e s e n s i t i v i t y of b i o t a t o c o n t a m i n a n t s , were combined t o p r e s e n t a comprehens ive p r o b a b i l i s t i c evaluat ion of r i s k . The j o i n t p r o b a b i l i t y a n a l y s i s was supplemented by comparison of PCB l e v e l s in the harbor t o EPA w a t e r q u a l i t y c r i t e r i a , e v a l u a t i o n o f s i t e - s p e c i f i c t o x i c i t y t e s t s , and examination of data on the structure of faunal communities in the harbor.
Results of these various approaches to eva luat ing r i s k , both together and independently, support the conclusion that aquatic organisms are a t s i g n i f i c a n t r i s k due t o e x p o s u r e t o
ES-1

PCBs in New Bedford Harbor. Some risk due to exposure to metals was also identified; however, it was negligible compared to the risk due to PCBs.
Concentrations of dissolved PCBs in the area of maximum contamination (i.e., the Hot Spot) and in all areas of the Inner Harbor (i.e., inside the Hurricane Barrier) were sufficiently elevated to result in a significant likelihood of chronic effects to indigenous biota. PCB concentrations in sediment and sediment pore water in many areas of the harbor were found to be highly toxic to at least some members of all major taxonomic groups of organisms. In the Upper Estuary, the probability of these sediments being toxic to marine fish, the most sensitive taxonomic group investigated, approached certainty. These conclusions were found to be consistent with the reported results of laboratory experiments conducted using New Bedford Harbor sediments and with available data on faunal community structure. EPA ambient water quality criteria and interim sediment quality criteria were exceeded in many areas of the Inner Harbor.
Potential community or ecosystem level impacts due to PCBs in New Bedford Harbor cannot be evaluated fully by assessing impacts to individual species or taxonomic groups. However, the state of development of ecological risk assessment methodology does not allow quantification of impacts or risk at these higher levels. Nonetheless, the results of numerous site-specific and laboratory studies, including this risk assessment, indicate that New Bedford Harbor is an ecosystem under stress and there is a high probability that PCBs are a significant contributing factor to the integrity of the harbor as an integrated functioning ecosystem.
ES-2
1.0 INTRODUCTION
1.1 NEW BEDFORD HARBOR ECOSYSTEM
New Bedford Harbor is a tidal estuary on the western shore of Buzzards Bay, Massachusetts, situated between the City of New Bedford on the west and the towns of Fairhaven and Acushnet on the east. The area contains approximately six square miles of open water, tidal creeks, salt marshes, and wetlands. The major freshwater inflow to this area is the Acushnet River, a small stream with mean annual flow of approximately 1 cubic meter per second. As a result, the system does not fit the traditional definition of an estuary; salinities throughout the harbor are high and the strong horizontal and vertical salinity gradients that control patterns of faunal distribution in estuaries are absent. Nonetheless, the system does provide habitats for a wide variety of aquatic organisms that use this area for spawning, foraging, and overwintering.
The topographical characteristics of New Bedford Harbor have been adequately described in several other reports generated as a result of studies undertaken to provide information for the Remedial Investigation/Feasibility Study (RI/FS) process and will not be repeated herein. However, several features of the area have importance for understanding the ecological risk assessment. The estuary and harbor may be conveniently divided into subareas by bridges and other manmade structures that also represent logical divisions between zones of ecological similarity. Therefore, the Coggeshall Street Bridge represents not only a convenient boundary for the area defined in these studies as the Upper Estuary, but also separates an area of shallow water with predominantly organic silts and clays with silty sands poorly sorted muddy to the north from deeper water with silty sands to the south (Figure 1-1) . At the State Route 6 Bridge (Popes Island), depths generally increase, with water depths in most of the area south of the bridge maintained by dredging. This area of New Bedford Harbor is also the most heavily impacted by industrialization, with considerable shoreline development and ship traffic related to the fishing industry.
The Lower Harbor ends at the Hurricane Barrier, which separates the comparatively low-energy silty sediment of the harbor from the high-energy sands typical of littoral areas in Buzzards Bay. The Hurricane Barrier represents a significant feature of importance for the current regime in the harbor, and the jet effect created by the narrow opening dominates patterns of mixing.
1-1

mi1*
(Doshers ,-Pt
MASS ^ SOURCE: USGS QUADRANGLES; NEW BEDFORD NORTH & SOUTH. MASS.. 1977 & 1979
'„ . A'jRANlGLE LOCATION
HOT SPOT (APPROXIMATE LOCATION)
ESTUARY
LOWER HARBOR/BAY
SCALE IN FEET
2000
FIGURE 1-1 SITE LOCATION MAP
NEW BEDFORD, MASSACHUSETTS 4000

1.2 SITE HISTORY
Between 1974 and 1982, a number of environmental studies were conducted to assess the magnitude and distribution of polychlorinated biphenyl (PCB) and, to a lesser extent, heavy metals contamination in New Bedford Harbor. Results of these studies revealed that sediment north of the Hurricane Barrier contain elevated levels of PCBs and heavy metals. Additional investigations revealed that PCBs had been discharged into the surface waters of New Bedford Harbor, causing significantly elevated PCB concentrations in sediment, water, fish, and shellfish.
To reduce the potential for human exposure to PCBs, the Massachusetts Department of Public Health closed much of the New Bedford Harbor area to fishing. Three closure areas were established on September 25, 1979 (Figure 1-2) . Area 1 (New Bedford Harbor) is closed to the talcing of all finfish, shellfish, and lobster. Area 2 (Hurricane Barrier to a line extending from Ricketson Point to Wilbur Point) is closed to the taking of lobster and bottom-feeding fish (eel, scup, flounder, and tautog) . Area 3 (from Area 2 out to a line from Mishaum Point, Negro Ledge, and Rock Point) is closed to the taking of lobster.
In July 1982, the U.S. Environmental Protection Agency (EPA) placed New Bedford Harbor on the Interim National Priorities List (NPL). The final NPL was promulgated in September 1984. The site, as listed, includes the Upper Estuary of Acushnet River, New Bedford Harbor, and portions of Buzzards Bay. Following the NPL listing, EPA Region I initiated a comprehensive assessment of the PCB problem in the New Bedford Harbor area, including an areawide ambient air monitoring program, sediment sampling in the Acushnet River and New Bedford Harbor, and biota sampling in the estuary and harbor.
As a result of these studies, the extent of PCB contamination is better understood. The entire harbor north of the Hurricane Barrier, an area of 985 acres, is underlain by sediment containing elevated levels of PCBs and heavy metals. PCB concentrations in this area range from a few parts per million (ppm) to more than 100,000 ppm. Portions of western Buzzards Bay sediment are also contaminated, with PCB concentrations occasionally exceeding 50 ppm. The water column in New Bedford Harbor has been measured to contain PCBs in excess of the EPA 3 0-parts-per-trillion ambient water quality criterion
1-3

© ACUSHNET
AEROVOX
ESTUARY
NEW BEDFORD
NEW 8EDFORD< LANOFILL
SULLIVAN'S LEDGE
DARTMOUTH
FAIRHAVEN
COGGESHALL STREET BRIDGE
AREA 1
* Six"* *
X!f-<
C£'
RJCKETSOHS PQIHT
M M W • • ' » • " " " • ' ' « M "
' .\SCONTICUT iNECK
H.
-i >$
WEST .ISLAND.
WtLSUff
powr
ROCK POINT
AREA 3
SMITH NECK
itlSHAUM POINT
NOT TO SCALE
AREA 4
NEGRO LEDGE
AREAS SUBJECT TO PC8 CLOSURES'
• • • WATERS CLOSED TO ALL FISHING
>$mm WATERS CLOSED TO THE TAKING OF EELS, mBi LOBSTERS, FLOUNDERS, SCUP AND TAUTOG
X . 1 WATERS CLOSED TO LOBSTERING ONLY
FIGURE 1-2 FISHERY CLOSURE AREAS
NEW BEDFORD, MASSACHUSETTS

(AWQC). C o n c e n t r a t i o n s of PCBs in e d i b l e p o r t i o n s o f l o c a l l y caught f i s h have been measured in excess of the U.S. Food and Drug Administrat ion (FDA) 2-ppm t o l e r a n c e l e v e l for PCBs.
In 1 9 8 4 , EPA c o n d u c t e d an i n i t i a l FS of t h e h i g h l y contaminated mudflats and sediment in the Upper Estuary of Acushnet R iver (NUS, 1984a and 1984b) . F i v e c l ean-up o p t i o n s were p r e s e n t e d i n t h a t r e p o r t . EPA r e c e i v e d e x t e n s i v e comments on t h e s e opt ions from other f e d e r a l , s t a t e , and l o c a l o f f i c i a l s , p o t e n t i a l l y r e s p o n s i b l e p a r t i e s , and the p u b l i c . Many of the comments expressed concern regarding t h e proposed dredg ing t e c h n i q u e s and p o t e n t i a l impacts of dredging on the harbor, and p o t e n t i a l l eachate from the proposed unlined d i sposa l s i t e s .
In responding t o t h e s e comments, EPA e l e c t e d t o conduct a d d i t i o n a l s t u d i e s before choosing a clean-up a l t e r n a t i v e for the Upper Estuary. Concurrent with these s t u d i e s , EPA conducted a d d i t i o n a l surveys t o b e t t e r def ine the e x t e n t of PCB contamination throughout t h e o v e r a l l harbor and bay . Through t h e s e e f f o r t s , c lean-up opt ions for t h e s i t e are being developed.
1.3 OBJECTIVES AND LIMITATIONS OF THIS REPORT
EPA Region I i s r e spons ib l e f o r t h e c l eanup of t h e New Bedford Harbor s i t e under authori ty of the Comprehensive Environmental Response, Compensation, and L i a b i l i t y Act (CERCLA) a s amended by t h e Superfund Amendments and Reauthorization Act of 1986. Pursuant t o t h i s c h a r t e r , EPA h a s d i r e c t r e s p o n s i b i l i t y f o r c o n d u c t i n g t h e appropriate s t u d i e s for t h i s s i t e t o support the need for and e x t e n t o f r e m e d i a t i o n . In a c c o r d a n c e w i t h t h e National Contingency Plan, these s t u d i e s form the b a s i s of the RI/FS for the s i t e .
This e c o l o g i c a l r i s k a s se s sment presents and q u a n t i f i e s r i s k s t o aquatic organisms due t o exposure t o PCBs and s e l e c t e d heavy metals ( i . e . , copper, cadium, and lead) in t h e New B e d f o r d Harbor a r e a under b a s e l i n e ( i . e . , e x i s t i n g ) c o n d i t i o n s . The b a s e l i n e a s s e s s m e n t i s t h e f i r s t of a s e r i e s of r i s k eva lua t ions t h a t w i l l p r o v i d e t h e b a s i s f o r e v a l u a t i n g t h e need f o r and e x t e n t o f remediation. I t i s based on e x i s t i n g c o n d i t i o n s i n New Bedford Harbor o n l y ; t h e p o t e n t i a l natura l decrease i n contaminant mass and concentrat ion i n t h e harbor due t o transport and degradation through time i s not cons idered . S u b s e q u e n t e v a l u a t i o n s w i l l e x a m i n e t h e r e l a t i v e e f f e c t i v e n e s s of v a r i o u s remedia l a l t e r n a t i v e s a g a i n s t
1-5

c u r r e n t c o n d i t i o n s u s i n g r e s u l t s of t h e n u m e r i c a l s i m u l a t i o n model for PCBs.
EPA d e f i n e s e c o l o g i c a l r i s k r e s u l t i n g from t o x i c contaminants to include both direct r isks to the growth, r e p r o d u c t i o n , or surv iva l of the e c o l o g i c a l receptor species , as we l l as the resource value of any s p e c i e s being reduced as a r e s u l t of contaminant body burdens. Although both aspects of risk wi l l be considered to some extent in t h i s document, the former (direct) r isk i s the major concern of the assessment.
Ecological r isks in New Bedford Harbor were determined by a mathematical evaluation and combination of two factors: (1) the degree of exposure to contaminants at the s i t e , and (2) the eco tox ic i ty of PCBs and the three metals t o aquatic organisms. Ecological risk was then quantified as the p r o b a b i l i t y of impact to s p e c i f i c taxonomic groups representing the major ecotypes present in the harbor. Future evaluation of remedial alternatives via t h i s method w i l l require only repeating the exposure s e c t i o n of the a s s e s s m e n t to r e f l e c t the new exposure condi t ions as determined by the numerical modeling r e s u l t s , and then using the previously derived (and unchanged) ecotoxic i ty calculations to determine new risk probabi l i t ies .
Following t h i s s t r a t e g y , t h i s report c o n s i s t s of three s e c t i o n s . The f i r s t section i s the exposure assessment, in which a representative subset of the organisms residing in the New Bedford Harbor area i s ident i f ied, the routes of exposure are defined, and the degree of exposure i s q u a n t i f i e d . The second s e c t i o n , t h e e c o t o x i c i t y assessment, describes the acute and chronic toxic e f f e c t s a s s o c i a t e d w i t h PCB and m e t a l s exposure f o r each identi f ied group. In addi t ion , e x i s t i n g standards and c r i t e r i a for PCBs and metals are discussed. The f inal sect ion, the r i s k eva luat ion , combines the information presented in the two preceding sections to describe and quantify p o t e n t i a l adverse e f f e c t s on the New Bedford Harbor ecosystem r e s u l t i n g from the presence of these contaminants.
Both PCBs and m e t a l s are d i s c u s s e d in t h i s r e p o r t ; however, PCBs were t h e primary focus of t h i s s tudy. Therefore, only the t a b l e s and f i g u r e s f o r PCBs a r e included with the t ex t . The tables and figures associated with the metals discussion are presented in Appendices A, B, and C.
1-6
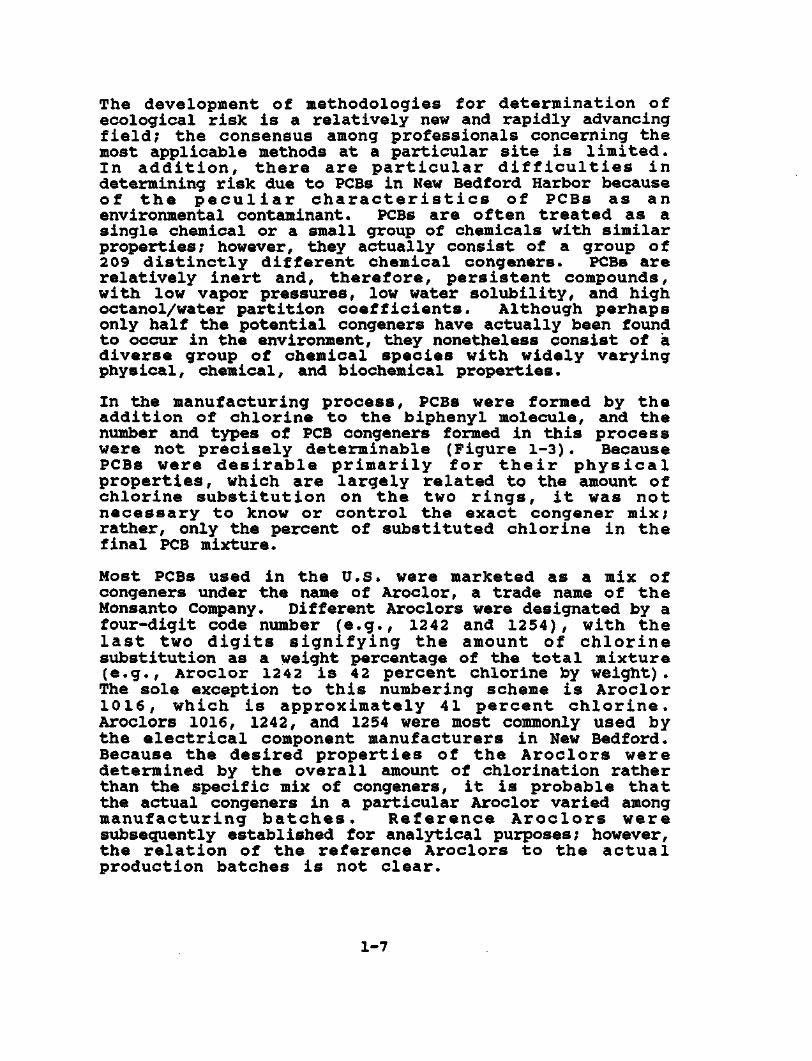
The development of methodologies for determination of ecological risk i s a re la t ive ly new and rapidly advancing f i e l d ; the consensus among professionals concerning the most applicable methods at a particular s i t e i s l i m i t e d . In a d d i t i o n , t h e r e are p a r t i c u l a r d i f f i c u l t i e s i n determining risk due to PCBs in New Bedford Harbor because o f t h e p e c u l i a r c h a r a c t e r i s t i c s of PCBs as an environmental contaminant. PCBs are of ten t rea ted as a s ingle chemical or a small group of chemicals with similar properties; however, they actually consist of a group of 209 d i s t i n c t l y d i f f e r e n t chemical congeners. PCBs are re la t ive ly i n e r t and, there fore , p e r s i s t e n t compounds, with low vapor pressures, low water so lub i l i ty , and high octanol/water part i t ion c o e f f i c i e n t s . Although perhaps only half the potential congeners have actually been found to occur in the environment, they nonetheless consist of a d iverse group of chemical s p e c i e s with widely varying physical, chemical, and biochemical properties.
In the manufacturing process , PCBs were formed by the addit ion of ch lor ine to the biphenyl molecule, and the number and types of PCB congeners formed in t h i s process were not p r e c i s e l y determinable (Figure 1-3). Because PCBs were d e s i r a b l e p r i m a r i l y f o r t h e i r p h y s i c a l p r o p e r t i e s , which are l a r g e l y re la ted to the amount of ch lor ine s u b s t i t u t i o n on the two r i n g s , i t was n o t n e c e s s a r y t o know or control the exact congener mix; rather, only the percent of subst i tuted ch lor ine in the f inal PCB mixture.
Most PCBs used in the U.S. were marketed as a mix of congeners under the name of Aroclor, a trade name of the Monsanto Company. Different Aroclors were designated by a four-digit code number ( e . g . , 1242 and 1254) , with the l a s t two d i g i t s s i g n i f y i n g t h e amount of c h l o r i n e substitution as a weight percentage of the t o t a l mixture ( e . g . , Aroclor 1242 i s 42 percent chlorine by weight) . The so le exception to t h i s numbering scheme i s Aroclor 1 0 1 6 , which i s approx imate ly 41 p e r c e n t c h l o r i n e . Aroclors 1016, 1242, and 1254 were most commonly used by the e l e c t r i c a l component manufacturers in New Bedford. Because the des ired p r o p e r t i e s of t h e A r o c l o r s were determined by the overa l l amount of chlorination rather than the spec i f ic mix of congeners, i t i s probable t h a t the actual congeners in a particular Aroclor varied among manufactur ing b a t c h e s . R e f e r e n c e A r o c l o r s w e r e subsequently established for analytical purposes; however, the r e l a t i o n of the reference Aroclors to the a c t u a l production batches i s not c l e a r .
1-7

nCL nCL
(WHERE n AND n' MAY VARY FROM OTO 5)
FIGURE 1-3 CHEMICAL STRUCTURE OF A PCB MOLECULE
NEW BEDFORD, MASSACHUSETTS

After PCBs in the form of Aroclors are introduced into the environment, they begin to "weather," thereby changing and further complicating the problem of determining the actual mixture of components present. Lighter (i.e., less chlorinated) congeners are generally more volatile and soluble; therefore, they are (1) transported farther from the source before deposition, (2) less easily deposited into sediment, and (3) more easily mobilized and transported out of the original zone of deposition. More saturated congeners would demonstrate generally opposite behavior. In addition, differential rates of biochemical degradation, uptake, and depuration by biota, not easily related to level -of -chlorination but also determined by the actual pattern of chlorine substitution, would further serve to make the actual congener mix at any location different from the mixture originally released.
Although work is still ongoing to develop better analytical methods, it is possible to analyze environmental samples for many of the actual PCB congeners present; however, few congener-specific data are available because of the considerably greater analytical cost of the procedure. Most early studies reported PCBs as a "total" concentration or as the concentration of one or more Aroclors. Due to these problems, both methods produce less than completely satisfactory results. For the field sampling program conducted by Battelle Ocean Sciences (BOS) to produce calibration/validation data for the physical/chemical model (the source of much of the data used in this risk assessment) , the analyses were reported in terms of "level-of-chlorination" homologs. This type of analysis provides valuable additional information, and because physical behavior determining fate and transport of PCBs is relatively similar for each homolog group, quantification (and subsequent numerical modeling) by homologs was deemed a reasonable cost-effective analytical goal for the modeling program. It was later decided to model only total PCBs, and the modeling program data were subsequently converted into total PCBs for risk assessment purposes by summing all homolog groups. Because the modeling and any remedial activities will be determined solely on the basis of total PCBs and, because of the lack of homolog-specific toxicity data, the risk assessment was conducted using total PCBs only.
The unique properties of PCBs and the problems with analysis described previously present considerable difficulties for determination of ecological (or public health) risk. Without analysis for specific congeners, it is not possible in most cases to know the actual congener
1-9

mix at a p a r t i c u l a r s i t e , even i f the exact congener composition of the PCBs introduced to the s i t e were known, which i s e s sent ia l ly never the case. Even i f the mix of congeners were determined, the a n a l y s i s would be va l id only for the spec i f ic sample, and in an area such as New Bedford Harbor, the changing concentrations and mixture of congeners would present a complicated mosaic of s p a t i a l and temporal change . T h e r e f o r e , the f i r s t s tep in conducting a r i s k assessment ( i . e . , d e t e r m i n i n g t h e concentrat ion of the contaminant(s) of interest at the specif ied s i t e ) i s not possible for PCBs at the same leve l of deta i l as for other environmental contaminants. Most analytical d i f f i c u l t i e s and uncertainties a s s o c i a t e d with determining PCB concentrat ions in the environment apply equally to any toxicological studies conducted with PCBs. A synthesis of the resul ts of these studies i s the second fundamental step in r i sk assessment and, because work t o d a t e has been conducted w i t h contaminant concentrations reported as to ta l PCBs or as one or more Aroclors , i t i s d i f f i c u l t to combine and use a l l data sources equally. Accordingly, various assumptions and s i m p l i f i c a t i o n s were necessary at several points in the risk assessment so that the limited available data on PCB tox i c i ty would not be unnecessarily reduced.
Recent work i n d i c a t e d s u b s t a n t i a l v a r i a b i l i t y among congeners with regard to t o x i c i t y t o aquatic organisms ( D i l l e t a l . , 1982) . Some toxicological properties are believed related to the configuration the two phenyl rings assume r e l a t i v e t o each o t h e r which i s , i n t u r n , contro l l ed by the p o s i t i o n of the c h l o r i n e s on t h e molecule. Fully ortho-substituted congeners do not assume a co-planar structure and are believed, in general, to be the l e a s t t o x i c . C o n v e r s e l y , non-or tho- subs t i tu ted congeners are free to assume a co-planar configuration and are believed to be more toxic in general.
S i t e - s p e c i f i c water and sediment t o x i c i t y t e s t i n g i s perhaps the bes t s o l u t i o n t o t h i s problem; however , l i m i t e d work has been conducted on New Bedford Harbor water and sediment. Although the a v a i l a b i l i t y of more data would have been valuable in that i t would enable evaluation of the t o x i c i t y of the actual weathered PCB mixtures in New Bedford Harbor, i t cannot prove that any e f f e c t s measured are in fac t due to the PCBs p r e s e n t r a t h e r than another contaminant . T h e r e f o r e , both laboratory data on the tox ic i ty of "pure" Aroclors and the l imi t ed data on actual t o x i c i t y of New Bedford Harbor environmental media must be used in combination to provide the "weight of evidence" for ecological r isk.
1-10
The combinat ion of t h e s e f a c t o r s n e c e s s a r i l y l i m i t s t o some degree c o n f i d e n c e i n t h e a c c u r a c y o f t h e r i s k p r o b a b i l i t i e s f o r PCBs generated in t h i s assessment, i n t h e same way t h a t c o n f i d e n c e i s d e c r e a s e d i n u s i n g a s t a t i s t i c a l t e s t t o c a l c u l a t e p r o b a b i l i t i e s when a l l assumptions for the t e s t are not s t r i c t l y s a t i s f i e d . In some c a s e s , i t was p o s s i b l e t o q u a n t i f y t h e degree of u n c e r t a i n t y of some of t h e p a r a m e t e r s and d e v e l o p a q u a n t i t a t i v e es t imate of o v e r a l l uncerta inty . For other i s s u e s , s u c h a s t h e q u e s t i o n o f c o n g e n e r - s p e c i f i c t o x i c i t y , i t i s not p o s s i b l e t o approach the i s s u e in a q u a n t i t a t i v e s e n s e . However, b e c a u s e mos t t o x i c i t y s t u d i e s have used congener mixtures, i t i s probable tha t a wide v a r i e t y of t o x i c i t i e s i s represented in both the t e s t mixtures and the mixture occurring in New Bedford Harbor. The use of t h e r i s k p r o b a b i l i t i e s i n a r e l a t i v e s e n s e ( i . e . , t o compare t h e e f f i c a c y of d i f f e r e n t remed ia l a l t e r n a t i v e s aga ins t a no-act ion a l t e r n a t i v e ) would have c o n s i d e r a b l y grea ter v a l i d i t y , even i f the abso lute r i s k p r o b a b i l i t i e s were quest ionable . I t i s t h i s l a t t e r u s e tha t i s important for the r i s k assessment.
Determination of r i s k due t o heavy metals was not a f f e c t e d by the problems described p r e v i o u s l y f o r PCBs; however , other concerns became apparent during the a n a l y s i s . Chief among t h e s e was t h e c o n s i d e r a b l y s m a l l e r d a t a s e t a v a i l a b l e for the three metals (par t i cu lar ly cadmium) and the p r o b a b i l i t y tha t sampling for metals was concentrated in areas of suspected high concentrat ions , thereby b i a s i n g the data s e t . In addi t ion , a n a l y s i s of metals was d e l e t e d from t h e B a t t e l l e p h y s i c a l / c h e m i c a l model and i t was therefore not p o s s i b l e t o work from the i n i t i a l condi t ions e s t a b l i s h e d f o r each model c e l l , as was done for PCBs. This l a t t e r procedure would have l a r g e l y corrected for the s a m p l i n g b i a s . I t was d e c i d e d f i n a l l y t o u s e t h e a v a i l a b l e m e t a l s d a t a e x a c t l y a s p r o v i d e d t h e r e b y p r o v i d i n g , t o the extent that the data are biased toward higher c o n c e n t r a t i o n s , a more c o n s e r v a t i v e e s t i m a t e o f r i s k .
1.4 PROGRAM DATA BASE
At most CERCLA s i t e s , the e c o l o g i c a l r i s k assessment would be based on f indings of the RI report . However, because of t h e many s t u d i e s conducted as part of the New Bedford Harbor p r o j e c t , numerous reports have been produced which o b v i a t e the need for a separate RI document. Therefore, t h i s r i s k assessment i s based p r i m a r i l y on t h e sampl ing d a t a c o n t a i n e d i n t h e New Bedford Harbor da ta b a s e ,
1-11

aspects of modeling efforts by HydroQual, Inc. (Hydroqual) and Batte l le Pacif ic Northwest Laboratories (PNL), various s i t e investigation reports, the Greater New Bedford Health E f f e c t s Study, and the U.S. Army Corps of Engineers (USACE) Pi lo t Dredging Study and Wetlands Assessment. An e x t e n s i v e data base generated between 1981 and 1986 provides an accurate description of the current extent and l e v e l of contamination within most of the New Bedford Harbor area.
1.4.1 PCB Concentrations in Sediments
Data on distr ibution of PCBs in sediment and over ly ing w a t e r s of New Bedford Harbor and the Acushnet River Estuary were provided by PNL and BOS. For cons i s t ency with other aspects of the RI/FS process at the New Bedford Harbor s i t e , the ecological risk assessment for PCBs was based primari ly on a data s e t developed as the i n i t i a l condi t ions for the phys ica l /chemical transport model . I n i t i a l c o n d i t i o n s were e s t a b l i s h e d by PNL u s i n g information on PCBs in the harbor obtained from three s o u r c e s : ( 1 ) d a t a c o l l e c t e d by BOS (Duxbury , Massachusetts) s p e c i f i c a l l y for the c a l i b r a t i o n and va l idat ion of the model; (2) a data base compiled by GCA Corporation (now A l l i a n c e T e c h n o l o g i e s Corporat ion [A l l i ance ] ) from various h i s t o r i c a l sources; and (3) a detai led survey of PCBs in the harbor conducted by NUS C o r p o r a t i o n (NUS). These t h r e e d a t a s e t s were subsequently combined into the central New Bedford Harbor data base by BOS. An additional intensive sampling of the Hot Spot p r o v i d e d t h e d a t a u s e d t o e s t a b l i s h c o n c e n t r a t i o n s i n Hot Spot s e d i m e n t .
1 .4 .1 .1 BOS Calibration/Validation Data
From 1985 through 198 6, BOS conducted four samplings of water, sediment, and biota in the Acushnet River Estuary, New Bedford Harbor, and adjacent areas of Buzzards Bay to provide data f o r c a l i b r a t i o n and v a l i d a t i o n of t h e phys ica l /chemica l transport model and food-chain model. Twenty-five stat ions were established and sampled on each of three surveys; the remaining survey was l imi ted t o eight stat ions and was conducted immediately fo l lowing a storm event . Although the samples obtained during these surveys were col lected and analyzed under rigorous quality c o n t r o l p r o c e d u r e s , the data were intended for use p r i m a r i l y for model c a l i b r a t i o n / v a l i d a t i o n . The u s e f u l n e s s for de termin ing p a t t e r n s of contaminant d i s t r i b u t i o n in New Bedford Harbor i s l i m i t e d by t h e r e l a t i v e l y sparse s p a t i a l d i s t r i b u t i o n .
1-12

1.4.1.2 Alliance Data Base
This previously compiled data base summarizing several of d iverse f i e l d i n v e s t i g a t i o n s in New Bedford Harbor r e p r e s e n t s an important source of data and was used extensively to se t i n i t i a l conditions for the model. The data base was original ly constructed for EPA by Metcalf & Eddy, Inc . , in 1983 and was transferred to A l l i a n c e in 1986 . A l l i a n c e began t o expand t h e data base and converted i t to run under dBASE I I I , a personal computer data base management software package. This work was never completed, and the data base was s u b s e q u e n t l y p r o v i d e d t o BOS for q u a l i t y a s surance checks and subsequent incorporat ion in to the centra l New Bedford Harbor data base. The Alliance data base was provided to PNL by E.C. Jordan Co. (Jordan) as part of the data base PNL u s e d t o e s t a b l i s h i n i t i a l c o n d i t i o n s f o r t h e p h y s i c a l / c h e m i c a l t r a n s p o r t model.
1.4.1.3 NUS Data Base
The NUS data base was provided to PNL in digital form by BOS. The data base was apparently complete and contained data for PCBs expressed as the concentrations of various Aroclors for samples obtained on a regular grid. The NUS data proved to be valuable because concentration data for the entire study area was provided. Data in the Alliance data base, for example, were concentrated at the Hot Spot and around various wastewater or combined sewer overflow discharges.
Details of the data selection, conversions, and manipulations conducted by PNL to establish the initial sediment PCB concentrations for the physical/chemical model will be discussed in the final modeling report currently in preparation (Battelle, 1990). In the remainder of this section, aspects of this process that are important for understanding this risk assessment are reviewed.
1.4.1.4 Selection of Data
Sediment PCB data from the BOS and NUS data sets were complete and easily interpretable, and were used as received. The Alliance data base contained a wide variety of contaminant measurements and included samples of air, water, wastewater, sediment, and biota from the general vicinity of New Bedford Harbor. In addition to data on PCBs and metals, the data base included data on water
1-13

qua l i ty parameters and o ther o r g a n i c and i n o r g a n i c c o n t a m i n a n t s , most o f which were i r r e l e v a n t f o r establishing i n i t i a l PCB concentrations for the modeling. PCB data were retrieved from the Alliance data base via a ser ies of FORTRAN programs written by PNL.
1 .4 .1 .5 Sample Depths
The BOS data base contained v a r i o u s combinat ions of samples taken at a number of d i f ferent horizons in the sediment, gross (bulk) samples, and samples of d i f f e r e n t s i z e fract ions ( i . e . , sand, s i l t , and c lay) . Only gross (bulk) sediment samples from the upper s tratum (5 centimeters) were retained for subsequent evaluation. The NUS data included samples taken from the upper stratum (6 i n c h e s ) , depths of 12 to 18 inches , and at s p e c i f i e d greater depths. Only samples from t h e upper 6 - i n c h stratum were re ta ined .
Ref l ec t ing i t s mul t ip le data sources, the Alliance data base included a wide variety of sampling hor izons . The data records were divided into two categories: (1) surface samples obtained with a grab sampling device or col lected as subsamples from the upper 8 inches of a sediment core; and (2) deep samples, for which any part of the subsample was taken from 8 inches or deeper below the sediment water i n t e r f a c e . Only t h e s u r f a c e samples were used i n subsequent data a n a l y s i s .
1 .4.1.6 Data Conversions
The data s e t s used by PNL t o e s t a b l i s h the i n i t i a l conditions for the modeling included PCB data in var ious forms. The most variation was encountered in the Alliance data base, in which PCBs were reported most commonly as A r o c l o r s 1242, 1254, and 1242/1016, and n o n - s p e c i f i c PCBs. Some samples included data on level-of-chlorinat ion homologs. The des ired f i n a l measure, t o t a l PCBs, was obtained for each sample by summing the concentrations of a l l q u a n t i f i e d A r o c l o r s . Any samples reported on a wet-weight basis were converted to dry weight using an average water content of 55 percent.
PCB concentrations in the NUS data base were reported as Aroclor 1242, Aroclor 1248, or Aroclor 1254 in u n i t s of micrograms per kilogram, and assumed to be dry weight. Typically, only one or two Aroclor concentrat ions were r e p o r t e d f o r e a c h s a m p l e . A l l r e p o r t e d A r o c l o r concentrat ions were summed and converted t o u n i t s of micrograms per gram (ug/g), equivalent to ppm dry weight.
1-14

The BOS data base reported PCB concentrations by level-of-chlorination homolog in units of ug/g dry weight. These concentrations were summed to produce an estimate of total PCB concentration.
Values below specified detection limits occurred in all three data bases and were used in determining the initial conditions; values reported as zero were not used. Data reported below detection limits were assigned a value equal to approximately 0.1 times the specified detection limit of the analytical procedure and were placed in a separate file. When detection limits were not reported, concentrations of zero were assigned values of approximately 0.1 times the lowest reported value. These somewhat arbitrary assignments were necessary because the data were later log-transformed and values of zero would have been unacceptable.
1.4.1.7 Data Processing and Analysis
Standard univariate statistics were calculated by PNL for the raw and log-transformed data. The log-transformed data produced near-normal distributions around the mean value for each data set.
Contour plots of the surface sediment PCB concentrations were prepared at PNL and delivered to Jordan in November 1987. Initial PCB concentrations were calculated by PNL on a 100-by-100-foot grid and subsequently transferred to the larger i,j physical/chemical model grid by calculating an arithmetic average of all 100-foot grid data within each model grid element. The initial values for the i, j model grid, provided to Jordan by PNL in April 1989, were used for all subsequent analyses conducted for the ecological risk assessment, with one modification at the Hot Spot. Following the final assignment of initial conditions for the model, USACE funded an additional intensive survey of PCB concentrations in the Hot Spot. Three model grid cell concentrations were changed from initial condition assignments to reflect the updated information.
1.4.2 PCB Water Concentrations
PCB c o n c e n t r a t i o n s in the water column for the r i s k assessment were a l s o based on v a l u e s used for t h e p h y s i c a l / c h e m i c a l t r a n s p o r t model. However, un l ike sediment concentrations, the use of i n i t i a l conditions i s not appropr ia te because preliminary model runs indicated
1-15

tha t concentra t ions i n t h e water column are de termined l a r g e l y by the ass igned sediment concentrat ions fo l lowing a b r i e f " s p i n - u p " p e r i o d o f a p p r o x i m a t e l y 90 d a y s s i m u l a t i o n . A c c o r d i n g l y , PNL did not determine i n i t i a l condi t ions for the water column in a manner s i m i l a r t o t h a t p r e v i o u s l y d e s c r i b e d f o r s e d i m e n t ; r a t h e r , i t ass igned i n i t i a l condi t ions genera l ly c o n s i s t e n t wi th t h e f i e l d data and then allowed the model t o produce i t s own " s t a r t i n g c o n d i t i o n s " based on t h e a s s i g n e d s e d i m e n t c o n c e n t r a t i o n s . These s t a r t i n g condi t ions in the water column were averaged v e r t i c a l l y for each c e l l in t h e i , j g r i d and p r o v i d e d t o Jordan w i t h t h e i n i t i a l sediment c o n d i t i o n s .
1 .4 .3 Metals Concentrations
B e c a u s e m e t a l s were n o t i n c l u d e d i n t h e B a t t e l l e phys ica l / chemica l modeling e f f o r t , i t was not p o s s i b l e t o u s e model i n i t i a l c o n d i t i o n s f o r t h e c a l c u l a t i o n o f exposure es t imates a t the New Bedford Harbor s i t e . Metals data were obtained from the program data base m a i n t a i n e d by BOS. A l l da ta f o r t h e t h r e e m e t a l s i n water and sediment were requested and r e c e i v e d v i a magnet i c d i s k . Data c h a r a c t e r i z e d as "rejected" in the data v a l i d a t i o n were removed from the data s e t and not used i n t h e r i s k a s s e s s m e n t . T h e d a t a s e t c o n t a i n e d n u m e r o u s "non-detects ," which were e n t e r e d i n t o t h e a n a l y s i s a s h a l f the lowest reported concentrat ion for the p a r t i c u l a r metal . A l l remaining data were used as rece ived .
1.5 OVERVIEW OF METHOD FOR THE ECOLOGICAL RISK ASSESSMENT
A j o i n t p r o b a b i l i t y model was used in the r i s k assessment t o q u a n t i t a t i v e l y e v a l u a t e p o t e n t i a l impacts t o New Bedford Harbor b i o t a f o r each contaminant . The b a s i c components of the model are two probab i l i t y d i s t r i b u t i o n s , one represent ing the expected d i s t r i b u t i o n of contaminant l e v e l s in the environment, and the second represent ing the p r o b a b i l i t y d i s t r i b u t i o n of some benchmark c o n c e n t r a t i o n for a p a r t i c u l a r group of p o t e n t i a l receptors over a range of contaminant l e v e l s . The j o i n t p r o b a b i l i t y model i s used t o de termine t h e l i k e l i h o o d that a t y p i c a l s p e c i e s (which d i s p l a y s a p a r t i c u l a r b i o l o g i c a l e f f e c t a t t h e benchmark c o n c e n t r a t i o n ) w i l l encounter an environmental concentrat ion s u f f i c i e n t t o e l i c i t the p a r t i c u l a r e f f e c t .
In S u b s e c t i o n 2 . 1 . 2 , d e v e l o p m e n t o f t h e e x p e c t e d d i s t r i b u t i o n of environmental l e v e l s i s d i scussed . These d i s t r i b u t i o n s a r e t e r m e d e x p e c t e d e n v i r o n m e n t a l c o n c e n t r a t i o n (EEC) probab i l i t y curves . The development
1-16
of the probab i l i t y dens i ty f u n c t i o n t h a t r e l a t e s contaminant concentration to a biological benchmark i s d i scussed in Subsection 3 . 2 . F i n a l l y , the j o i n t probability model i s used to determine quantitative risk estimates in Section 4.0.
1-17

2.0 EXPOSURE ASSESSMENT
The environmental exposure a s s e s s m e n t was performed t o i d e n t i f y r e p r e s e n t a t i v e organisms w i t h i n New Bedford Harbor t h a t may be exposed t o PCBs and m e t a l s . The assessment included i d e n t i f i c a t i o n of e c o l o g i c a l receptors and exposure r o u t e s , with the goal of s e l e c t i n g a s u b s e t of s p e c i e s t o r e p r e s e n t t h e wide v a r i e t y of p o t e n t i a l aquatic receptors a t the s i t e . These s p e c i e s were used t o i d e n t i f y t h e p r i n c i p a l r o u t e s of exposure and descr ibe contaminant exposure within the New Bedford Harbor area.
For t h e purposes of a c c u m u l a t i n g r e s u l t s a t v a r i o u s ( s i m u l a t e d ) p o i n t s in t ime, the B a t t e l l e transport model d i v i d e s the estuary and harbor i n t o t h e f o l l o w i n g f i v e zones, based in part on natural and manmade s t ruc tures and on the i n i t i a l contaminant concentrat ions de tec ted in t h e sediment (Figure 2-1) :
o Zone 1: t h e area between the Wood S t r e e t Bridge and t h e southern boundary of t h e Hot Spot
o Zone 2: from t h e sou thern boundary o f the Hot Spot t o the Coggeshall S t r e e t Bridge
o Zone 3: the area between t h e C o g g e s h a l l S t r e e t Bridge and Popes Is land (State Route 6 Bridge)
o Zone 4: t h e area between Popes I s l a n d ( S t a t e R o u t e 6 B r i d g e ) and t h e H u r r i c a n e B a r r i e r
o Zone 5: from the Hurricane B a r r i e r out t o t h e l i m i t o f t h e m o d e l i n g g r i d , r o u g h l y de l inea ted by the l i n e from R i c k e t s o n s Point t o Wilbur Point
D i f f e r e n t s y s t e m s of d i v i d i n g New Bedford Harbor i n t o zones have been u s e d a t v a r i o u s t i m e s f o r s p e c i f i c purposes. The zone d e f i n i t i o n used in t h i s report for the purpose of the e c o l o g i c a l r i s k assessment i s i d e n t i c a l t o t h e z o n a t i o n b e i n g u s e d f o r t h e p h y s i c a l / c h e m i c a l t r a n s p o r t m o d e l i n g . The r i s k a s s e s s m e n t i s b a s e d primari ly on both the input t o and output from the model, and use of the same zones s i m p l i f i e d i n c l u s i o n of the data from m o d e l i n g r u n s . T h e r e f o r e , s l i g h t l y d i f f e r e n t d i v i s i o n s of t h e harbor were u s e d f o r t h e HydroQual f o o d - c h a i n model, the publ ic hea l th r i s k assessment, and t h e d r a f t e c o l o g i c a l r i s k a s s e s s m e n t .
2-1

ACUSHNET
AEROVOX
ESTUARY
NEW BEDFORD
fZONE 11
FAIRHAVEN
IZONE 2 COGGESHALL STREET BRIDGE
DARTMOUTH
ROCK POINT
NOT TO SCALE
FIGURE 2-1 HARBOR ZONATION FOR RISK ASSESSMENT
NEW BEDFORD, MASSACHUSETTS

Although a l l these d i v i s i o n s correspond in some a r e a s t o t h e v a r i o u s f i s h e r y c l o s u r e z o n e s , none i s e x a c t l y t h e same.
2 .1 RECEPTOR IDENTIFICATION
2 . 1 . 1 Exposed Species Analys is
Many organisms i n New Bedford Harbor are p o t e n t i a l l y a t r i s k as a r e s u l t of exposure t o PCBs and heavy m e t a l s . The four primary r o u t e s of exposure include (1) d i r e c t contact with the water i n t h e water column, (2) d i r e c t contact with or i n g e s t i o n of sediment, (3) d i r e c t contact w i t h s e d i m e n t p o r e w a t e r , and ( 4 ) i n g e s t i o n o f contaminated f o o d . The r o u t e of exposure can a l s o be def ined by the method of obtaining food ( e . g . , herbivore , c a r n i v o r e , s u s p e n s i o n f e e d e r , d e p o s i t f e e d e r , and s c a v e n g e r ) . To d e s c r i b e how a q u a t i c organisms may be exposed t o contaminants a t the New Bedford Harbor s i t e , a r epresen ta t ive subset of the s p e c i e s known t o inhabi t t h i s a r e a was i d e n t i f i e d . The b a s i s of t h e s e l e c t i o n was d e f i n e d by t h e p o s s i b l e r o u t e s o f e x p o s u r e f o r t h e organisms i n q u e s t i o n .
To e v a l u a t e the l e v e l of e f f e c t s due t o exposure and f o r r i s k c h a r a c t e r i z a t i o n , the organisms in New Bedford Harbor were s e p a r a t e d i n t o e c o t y p e s , which a l s o correspond t o taxonomic groups. Five groups of organisms, corresponding t o t h e major aquatic organisms present in the harbor and a l s o representa t ive of the range of exposure r o u t e s , were d e v e l o p e d : m a r i n e f i s h , c r u s t a c e a n s , m o l l u s k s , po lychae tes , and a lgae . The r a t i o n a l e for these groupings and t y p i c a l representa t ive s p e c i e s for each in New Bedford H a r b o r a r e p r e s e n t e d i n S e c t i o n 3 . 0 . L a c k o f t o x i c o l o g i c a l d a t a f o r m a r i n e p o l y c h a e t e s p r e c l u d e d separate a n a l y s i s of p o t e n t i a l contaminant e f f e c t s on t h i s group. However, t h e s e organisms are considered r e l a t i v e l y i n s e n s i t i v e t o organic contamination in sediment and a r e w i d e l y used f o r bioaccumulation s t u d i e s for t h i s reason. In the determination of r i s k in Sect ion 4 . 0 , i t i s assumed that a t y p i c a l polycheate would be no more s e n s i t i v e than a t y p i c a l m o l l u s k , and t h e benchmark d i s t r i b u t i o n f o r m o l l u s k s w i l l be used c o n s e r v a t i v e l y t o a s s e s s r i s k t o polychaetes as w e l l .
Although most organisms can be exposed t o env i ronmenta l contaminants v i a a l l media, f o r purposes of a s s e s s i n g exposure i n t h i s r i s k a s s e s s m e n t , t h e v a r i o u s h a b i t a t l o c a t i o n s ( i . e . , b e n t h i c or p e l a g i c ) , l i f e s t a g e s ( i . e . , egg, larvae , and a d u l t ) , and feeding method ( e . g . , f i l t e r
2-3

feeder, deposit feeder, or carnivore) of t y p i c a l members of each group were used to define the primary routes of exposure for the group. Based on habitat, direct contact with d i s s o l v e d or par t i cu la t e contaminants in the water column was considered the primary route of exposure for p e l a g i c f i s h , b i v a l v e s , and plankton. An important secondary r o u t e of e x p o s u r e f o r most s p e c i e s i s c o n s u m p t i o n o f b i o t a t h a t have b i o a c c u m u l a t e d contaminants. For benthic infaunal invertebrates, i t was determined that d i r e c t contact with and i n g e s t i o n of contaminated sediment and food organisms were the primary routes of exposure. Direct contact with the water column was determined to be a secondary r o u t e of e x p o s u r e , although i t can a l s o be the primary exposure route for planktonic l i f e s tages of infaunal adults.
2 .1.2 Species of Concern
Species of concern inhabiting the New Bedford Harbor area were ident i f ied based on the biological surveys conducted by IEP, Inc . , for USACE (USACE, 1988b); Sanford Ecological Services for USACE (USACE, 1986); Camp, Dresser and McKee (Camp, Dresser and McKee, 1979); and h i s t o r i c a l da ta reported in Bigelow and Schroeder (Bigelow and Schroeder, 1953).
A subset of receptor species was selected from these data based on the following cr i t er ia : distribution within the study area, trophic l e v e l ( i . e . , producer , pr imary , s e c o n d a r y , or t e r t i a r y consumer) ; commercial and/or recrea t iona l use; and a v a i l a b i l i t y of b i o l o g i c a l and e c o l o g i c a l information.
Cr i t er ia such as habi ta t l o c a t i o n , trophic l e v e l , and reproductive p o t e n t i a l are important fac tors that may influence the ways in which each species may be exposed to contaminants in the New Bedford Harbor area and t h e potential e f fec t s of contaminant exposure. The commercial and/or recreational value of a resource species i s a key f a c t o r f o r s p e c i e s s e l e c t i o n because t h e l o s s and l i m i t a t i o n of use of such s p e c i e s may have economic s i g n i f i c a n c e .
Twenty-eight species of various trophic l eve l s and habitat types representing the f ive taxonomlc groups of aquat ic o r g a n i s m s d i s c u s s e d p r e v i o u s l y ( i . e . , f i n f i s h , crustaceans , mol lusks , a n n e l i d s , and p lankton) were selected as typical aquatic receptors for the New Bedford Harbor s i t e . Dis tr ibut ion of these s p e c i e s wi th in the Acushnet River/Buzzards Bay area i s shown in Table 2-1 .
2-4

TABLE 2-1 DISTRIBUTION OF THE 28 SELECTED SPECIES OF CONCERN IN NEW BEDFORD HARB
NEW BEDFORD HARBOR
ZONE 1 ZONE 2 ZONE 3 ZONE 4 Z ALL ZONES (AREA 1) (AREA 1) (AREA 1) (AREA 1) (A
Fish Herring American Eel American Eel Scup Scup Sc Flounder Tautog Tautog Ta Silverside Mummichog
American Eel Mackeral Ma
Crustaceans
Mollusks Quahog Ribbed Mussel
Isopod
Mud Nasa Soft-shell Clam
Plankton Diatoms
Annelids Clam Worm Mud Worm Thread Worm
Blue Crab Fiddler Crab Green Crab Amphipod
Mud Nasa Soft-shell Clam Blue Mussel Quahog
Copepod
Blue Crab Green Crab Lobster Fiddler Crab Amphipod Grass Shrimp
Blue Mussel Slipper Shell Bay Scallop Soft-shell Clam Eastern Oyster Quahog
Copepod
Green Crab Lobster Grass Shrimp
Blue Mussel Slipper Shell Eastern Oyster Quahog
Lo Am
Qu
Copepod Co
NOTE:
Zones correspond to Figure 2-1; areas correspond to Figure 1-2.
3.88.80 0023.0.0

2.2 EXPOSURE LEVELS FOR RECEPTORS
2 . 2 . 1 Introduct ion
The amount of contaminant exposure e x p e r i e n c e d by an a q u a t i c o r g a n i s m i s a f u n c t i o n o f t h e t y p e ( s ) o f contaminated media t o which t h e organism i s e x p o s e d , c o n t a m i n a n t c o n c e n t r a t i o n s i n t h e m e d i a , and t h e mechanisms by which contaminants are taken up from each medium. Each f a c t o r was c o n s i d e r e d and, t o the e x t e n t p o s s i b l e , quant i f i ed , in determining exposure l e v e l s f o r the f i v e organism groups used for the r i s k assessment.
PCB c o n t a m i n a t i o n i n New B e d f o r d Harbor h a s b e e n documented i n a l l e n v i r o n m e n t a l media ( i . e . , w a t e r , s e d i m e n t , and b i o t a ) throughout the harbor; however, i t v a r i e s considerably in concentrat ion, genera l ly decreas ing w i t h d i s t a n c e from t h e Hot Spot i n t h e Upper Estuary. Metals contamination i s s i m i l a r l y ubiqui tous; however, the area of h i g h e s t metals concentrat ions i s found in Zone 3 between the Coggeshall S t r e e t and Popes I s l a n d b r i d g e s . Organisms r e s i d i n g in New Bedford Harbor for a l l or part of t h e i r l i v e s may be exposed t o these contaminants a s a r e s u l t o f d i r e c t c o n t a c t w i t h a n d / o r i n g e s t i o n o f contaminated food, water, and s e d i m e n t . M i g r a t i o n from t h e harbor of prey s p e c i e s with e l evated PCB and meta ls t i s s u e burdens expands the p o t e n t i a l area of exposure for p r e d a t o r s . Uptake of contaminants from water, sediment, or food i n t o the t i s s u e s of organisms u l t i m a t e l y occurs by e i t h e r p a s s i v e d i f f u s i o n , a c t i v e transport , or f a c i l i t a t e d t r a n s p o r t a c r o s s t h e m e m b r a n e s o f t h e g i l l s , g a s t r o i n t e s t i n a l l i n i n g , mouth l i n i n g , and body w a l l (Swartz and Lee, 1 9 8 0 ) .
Terms such as b ioconcentrat ion and bioaccumulation r e l a t e t o t h e s o u r c e and s p e c i f i c o u t c o m e s of exposure t o contaminants. Bioconcentration r e f e r s t o t h e n e t uptake o f d i s s o l v e d c h e m i c a l s i n t o an organism from w a t e r . Another d i r e c t l y r e l a t e d term, b i o c o n c e n t r a t i o n f a c t o r (BCF) , i s the r a t i o of concentrat ion found in the t i s s u e of an organism t o the concentrat ion in the water t o which the organism was exposed (Schimmel and Garnas, 1985) . The term b i o a c c u m u l a t i o n r e f e r s t o t h e n e t u p t a k e o f a contaminant by an organism from a l l s o u r c e s , inc luding i n g e s t i o n of and/or contact with water, food, and sediment (Menzer and Nelson, 1986) . Biomagnification i s g e n e r a l l y used t o r e f e r t o t h e c o n c e n t r a t i o n o f a c o n t a m i n a n t between t r o p h i c l e v e l s i n a food c h a i n .
2-6
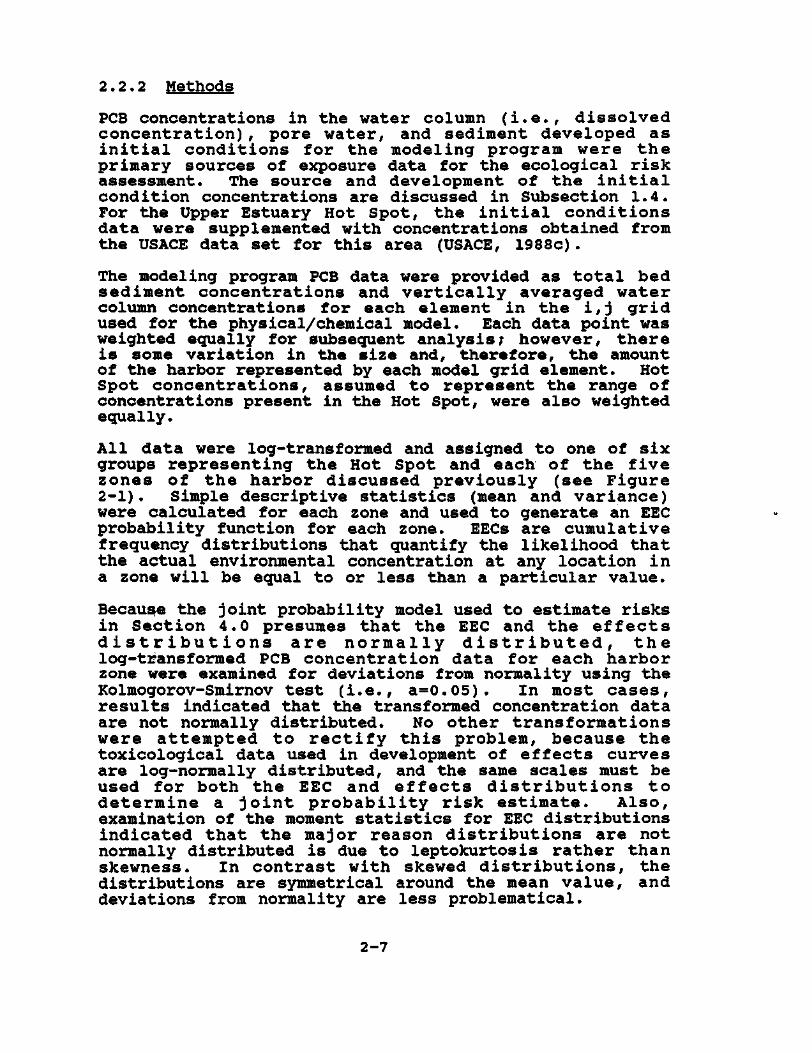
2.2.2 Methods
PCB concentrations in the water column (i.e., dissolved concentration), pore water, and sediment developed as initial conditions for the modeling program were the primary sources of exposure data for the ecological risk assessment. The source and development of the initial condition concentrations are discussed in Subsection 1.4. For the Upper Estuary Hot Spot, the initial conditions data were supplemented with concentrations obtained from the USACE data set for this area (USACE, 1988c) .
The modeling program PCB data were provided as total bed sediment concentrations and vertically averaged water column concentrations for each element in the i,j grid used for the physical/chemical model. Each data point was weighted equally for subsequent analysis; however, there is some variation in the size and, therefore, the amount of the harbor represented by each model grid element. Hot Spot concentrations, assumed to represent the range of concentrations present in the Hot Spot, were also weighted equally.
All data were log-transformed and assigned to one of six groups representing the Hot Spot and each of the five zones of the harbor discussed previously (see Figure 2-1). Simple descriptive statistics (mean and variance) were calculated for each zone and used to generate an EEC probability function for each zone. EECs are cumulative frequency distributions that quantify the likelihood that the actual environmental concentration at any location in a zone will be equal to or less than a particular value.
Because the joint probability model used to estimate risks in Section 4.0 presumes that the EEC and the effects distributions are normally distributed, the log-transformed PCB concentration data for each harbor zone were examined for deviations from normality using the Kolmogorov-Smirnov test (i.e., a=0.05). In most cases, results indicated that the transformed concentration data are not normally distributed. No other transformations were attempted to rectify this problem, because the toxicological data used in development of effects curves are log-normally distributed, and the same scales must be used for both the EEC and effects distributions to determine a joint probability risk estimate. Also, examination of the moment statistics for EEC distributions indicated that the major reason distributions are not normally distributed is due to leptokurtosis rather than skewness. In contrast with skewed distributions, the distributions are symmetrical around the mean value, and deviations from normality are less problematical.
2-7
Data reduction and a n a l y s i s for metals was conducted f o l l o w i n g procedures e s s e n t i a l l y s i m i l a r t o t h o s e described prev ious ly for PCBs, the primary d i f f e r e n c e being that raw data from the program data base maintained by BOS were used in place of i n i t i a l condi t ions for the physical/chemical model.
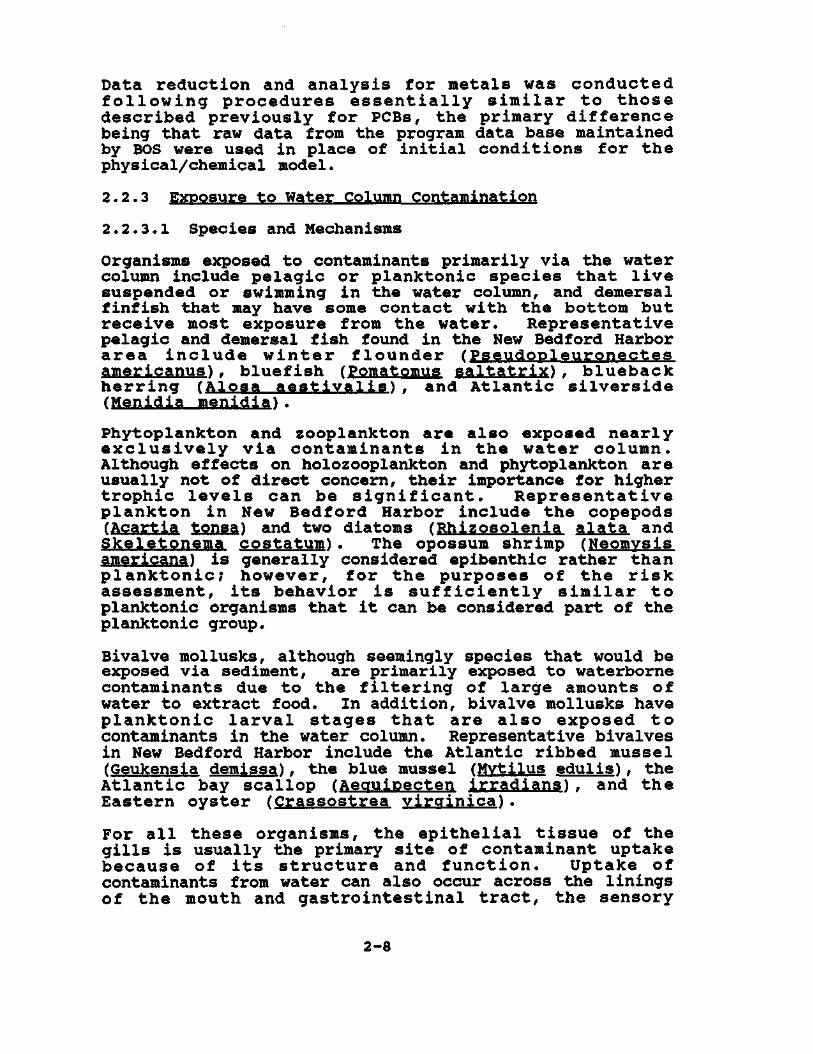
2 .2.3 Exposure to Water Column Contamination
2 .2 .3 .1 Species and Mechanisms
Organisms exposed to contaminants primarily via the water column include p e l a g i c or planktonic s p e c i e s that l i v e suspended or swimming in the water column, and demersal f inf i sh that may have some contact with the bottom but r e c e i v e most exposure from the water. Representat ive pelagic and demersal f i sh found in the New Bedford Harbor a r e a i n c l u d e w i n t e r f l o u n d e r ( P s e u d o p l e u r o n e c t e s americanus), b l u e f i s h (Pomatomus s a l t a t r i x ) , b lueback h e r r i n g (Alosa a e s t i v a l i s ) , and A t l a n t i c s i l v e r s i d e (Menidia menidia) .
Phytoplankton and zooplankton are a l s o exposed near ly e x c l u s i v e l y v i a contaminants in t h e water column. Although e f fec t s on holozooplankton and phytoplankton are usually not of direct concern, their importance for higher trophic l e v e l s can be s i g n i f i c a n t . R e p r e s e n t a t i v e p lankton i n New Bedford Harbor include the copepods (Acartia tonsa) and two diatoms (Rhizosolenia a l a t a and Skeletonema costatum) . The opossum shrimp (Neomysis americana) i s generally considered epibenthic rather than p l a n k t o n i c ; however, for t h e purposes of t h e r i s k assessment, i t s behavior i s s u f f i c i e n t l y s i m i l a r t o planktonic organisms that i t can be considered part of the planktonic group.
Bivalve mollusks, although seemingly species that would be exposed via sediment, are primarily exposed to waterborne contaminants due to the f i l t e r i n g of large amounts of water to extract food. In addition, bivalve mollusks have p l a n k t o n i c l a r v a l s t a g e s t h a t are a l s o exposed t o contaminants in the water column. Representative bivalves in New Bedford Harbor include the Atlantic ribbed mussel (Geukensia demissa), the blue mussel (Mytilus edu l i s ) , the A t l a n t i c bay s c a l l o p fAeaulpecten i r r a d i a n s ) , and t h e Eastern oys ter (Crassostrea v i r q i n i c a ) .
For a l l these organisms, the e p i t h e l i a l t i s s u e of the g i l l s i s usually the primary s i t e of contaminant uptake because of i t s s t r u c t u r e and f u n c t i o n . Uptake of contaminants from water can also occur across the l in ings of the mouth and g a s t r o i n t e s t i n a l t r a c t , the sensory
2-8

organs, and even the v i s c e r a i f they are perfused with water, as in some mollusks. Waterborne contaminants can also become adsorbed onto exposed surfaces such as the skin, where they may disrupt the function of some t i s sues but do not generally contribute to systemic t o x i c i t y .
2 .2 .3 .2 PCB Exposure Concentrations in Water
Exposure l eve l s in the water column are for the disssolved concentrat ions of PCBs. The dissolved component in the water column, as opposed to to ta l concentrations, was used because most data about toxicological e f fec t s of PCBs on organisms are based on d i s s o l v e d c o n c e n t r a t i o n s . T h e r e f o r e , a s s e s s i n g t h e i m p a c t o f d i s s o l v e d concentrations of the contaminant more direct ly re la tes to the toxicological data. The concentration i s the average for t h e e n t i r e water column. The mean, s t a n d a r d deviation, and variance for each zone are l i s t e d in Table 2-2. Cumulative probability p lo t s for the water column exposure l e v e l s , presented in Figure 2-2, are based on a random sample of 100 data points from d i s t r ibut ions with the c a l c u l a t e d parameters (see Table 2-2) . As shown in Table 2-2, the mean water column PCB l eve l s decrease with increasing distance from the Hot Spot in Zone 1. Despite the large difference in the number of gr id elements for t h e v a r i o u s zones, the variances a s s o c i a t e d with the different zones are similar. Mean values for Zone 1 and t h e Hot Spot are 2.55 and 3.10 micrograms per l i t e r (ug/L), respectively, decreasing to 0.02 ug/L in Zone 5.
Because of the s imi lari ty in the variances associated with the environmental concentrat ion data, the shape of the r e s u l t i n g EEC curves are s i m i l a r , d i f f e r i n g mainly i n l o c a t i o n along the PCB concentrat ion a x i s (see Figure 2-2) .
2.2.3.3 Metals Exposure Concentrations in Water
The exposure levels in the water column for all metals are for the dissolved concentrations of the metals. As in the case of PCBs, the dissolved component was used rather than the total concentration because most of the data about toxicological effects of metals are based on dissolved concentrations. The geometric mean, standard deviation, and variance for each zone are in Appendix A; that is, Table A-l for copper, Table A-2 for cadmium, and Table A-3 for lead. The cumulative EEC probability plots for all zones for copper, cadmium, and lead are presented in Figures A-l, A-2, and A-3, respectively.
There is little indication of any relationship between the concentrations of copper and cadmium, and distance from
2-9

TABLE 2-2 EXPECTED EXPOSURE CONCENTRATIONS FOR PCBS (1)
NEW BEDFORD HARBOR ECOLOGICAL RISK ASSESSMENT
TRANSFORMED VALUES (2)
HARBOR MEAN STANDARD ZONE (ug/1) MEAN DEVIATION VARIANCE
Hot Spot, Water Column 3.097 0.491 0.128 0.016
1. Water Column 2.559 0.408 0.139 0.019
2. Water Column 1.074 0.031 0.272 0.074
3. Water Column 0.157 -0.804 0.250 0.063
4. Water Column 0.065 -1.185 0.099 0.010
5. Water Column 0.023 -1.639 0.255 0.065
Hot Spot, Pore Water 73.114 1.864 0.642 0.767
1. Pore Water 38.282 1.583 0.302 0.091
2. Pore Water 4.406 0.644 0.954 0.910
3. Pore Water 0.277 -0.558 0.393 0.154
4. Pore Water 0.075 -1.125 0.708 0.502
5. Pore Water 1.000 -1.320 0.551 0.303
NOTES:
All data developed using initial conditions for Battelle numerical model. Expected pore water concentrations derived from initial sediment concentrations times model mass-transfer coefficient.
2. Log (base 10) transformed values, with standard deviations and variances.

1.0
0.8
o § 0.6
0)
§ 0.4 (0 "5 E O 0.2
0.0
ZONE 4
ZONE 5
HOT SPOT
ZONE 1
X -2 0 2
Log PCB Concentration ( ug/l)
EECs BY ZONE FOR PCBs, NEW BEDFORD, M

the Upper Estuary, as was found with PCBs. However, there is a noticeable decrease in lead concentrations with increasing distance from Zone 1; within zones, lead concentrations were more variable than copper and cadmium concentrations.
2.2.4 Exposure to Sediment Contamination
2.2.4.1 Species and Mechanisms
Direct contact with and ingestion of contaminated sediment and i t s a s soc ia t ed pore water are the primary routes of exposure for b e n t h i c i n f a u n a t h a t l i v e i n c l o s e association with or are buried in the sediment. Exposure of epifaunal benthic organisms i s more d i f f i c u l t t o quantify because they are exposed to both sediment and the overlying water; for these species , exposure primarily t o sediment can be used as a c o n s e r v a t i v e worst c a s e . Typical benthic i n v e r t e b r a t e s in New Bedford Harbor i n c l u d e t h e American l o b s t e r (Homarus americanus) , amphipod (Ampelisca vadorum), tubi f ic id worm (Tubificoides s p . ) , s l i p p e r she l l (Crepidula fornicata) . and mud snai l (Ilyanassa obsoleta) .
In the environment, sediment usua l ly provides the most concentrated pool of contaminants, as evidenced at the New Bedford Harbor s i t e (Larsson, 1985) . For most of the contaminated sediment in the harbor, PCBs and metals are continually being released into the i n t e r s t i t i a l or pore water, from which uptake by benthic organisms occurs . Resuspension of sediment also increases to ta l contaminant c o n c e n t r a t i o n s i n t h e w a t e r co lumn, b u t t h e s e particulate-bound contaminants are not d irect ly a v a i l a b l e for uptake as are the dissolved-phase contaminants.
Sediment-bound contaminants are a l s o taken up d irec t ly from the sediment by aquatic organisms (O'Donnel e t a l . , 1985) . Deposit-feeding organisms that feed by ingesting sediment a l s o i n g e s t any contaminants bound t o t h e sediment. Contaminants s trongly bound to sediment are l e s s l i k e l y to desorb from sediment p a r t i c l e s , and are absorbed in t h e gut l e s s than the more weakly bound contaminants. Uptake may a l s o occur as a r e s u l t o f equilibrium partit ioning of contaminants between the body surfaces of the organism and surface coa t ings of t h e sediment (Swartz and Lee, 1980).
Although these various modes of uptake have a l l been d o c u m e n t e d , a q u a n t i t a t i v e a s s e s s m e n t o f r i s k incorporating a l l the mechanisms i s not possible because of the lack of s u f f i c i e n t re levant t o x i c o l o g i c a l data . Therefore, risk for benthic organisms was defined as risk
2-12

due to exposure to contaminants dissolved in pore water. By assessing risk in this form, it is possible to draw on the body of toxicological data that has largely been developed using dissolved contaminants.
2.2.4.2 PCB Exposure Concentrations in Sediment Pore Water
PCB concentrations in pore water were calculated from the initial conditions sediment concentration data for the physical/chemical model via partition coefficients (K.) . Because of the properties of PCBs discussed in Subsection 1.3, partitioning is a complex phenomenon that varies over several orders of magnitude according to specific PCB congeners. Because the PCBs present in New Bedford Harbor represent a mixture of congeners, no single K. can fully describe the partitioning that is occurring.
Values for site-specific apparent K. in New Bedford Harbor are available from experiments conducted by BOS as part of the modeling program, and from the literature (Brownawell and Farrington, 1986) . The K.s ultimately selected were numerically equivalent to the mass transfer K.s used in the physical/chemical model to approximate diffusion of dissolved PCBs from bed sediment, and are generally comparable to K.s determined empirically by BOS, and consistent with tne range of values reported in other studies (Brownawell and Farrington, 1986; and Pavlou and Dexter, 1979).
For areas above the Coggeshall Street Bridge (i.e., Zones 1 and 2) , the K. used was 5x10 ; below the Coggeshall Street Bridge (i.e., Zones 3, 4, and 5), the K. used was 2x10 . The K.s were applied to the original data and the results log-transformed. Descriptive statistics were calculated as described for water concentrations, and the results are summarized in Table 2-2. As with the water column data, estimated pore-water PCB concentrations are highest in the Hot Spot, decreasing with distance from this area. Mean values for Zone 1 and the Hot Spot are 38.28 and 73.11 ug/L, respectively, decreasing to 0.05 ug/L in Zone 5. As was the case with data for water column PCB levels, variances associated with estimated pore water levels for the different zones are comparable, resulting in similarly shaped EEC curves (Figure 2-3) .
2.2.4.3 Metals Exposure Concentrations in Sediment Pore Water
Exposure levels for metals in the pore water were calculated from the sediment concentrations via K.s.
2-13

0 2 Log PCB Concentration ( ug/l)
EECs BY ZONE FOR PC NEW BEDFORD, M

The K.s used were based on f i e l d measurements made throughout the New Bedford Harbor s i t e , provided by Damian Shea from BOS (unpublished masters . thes is ) . The K.s used- were 8x10 for copper , 4x10 for cadmium, and 2xlOa for l ead .
The mean, standard deviation, and variance for each zone are presented in Table A-l for copper, Table A-2 for cadmium, and Table A-3 for l ead . The cumulative EEC p r o b a b i l i t y p lots for a l l zones for copper, cadmium, and l e a d are p r e s e n t e d in F i g u r e s A-4 , A - 5 , and A - 6 , r e s p e c t i v e l y .
Calculated pore water concentrations of copper and cadmium were the lowest in Zone 5 and the highest in Zones 1 and 3 (Figures A-4 and A-5) . Lead concentrations in the pore water were the lowest in Zone 4 and the highest in Zones 1 and 3 . For a l l m e t a l s , t h e h i g h e s t v a r i a n c e was a s s o c i a t e d w i t h Zone 2 . As wi th t h e water column c o n c e n t r a t i o n s , a d e c r e a s e i n c o n c e n t r a t i o n s w i t h increasing distance from the PCB Hot Spot i s not as w e l l defined as for PCB concentrations, although a weak trend can be observed.
2 .2 .5 Exposure to Contaminated Food
Allotrophic organisms in New Bedford Harbor are exposed to PCBs and m e t a l s v i a i n g e s t i o n of contaminated food. L i p o p h i l i c o r g a n i c compounds ( e . g . , PCBs) t r a n s f e r e f f i c i e n t l y a c r o s s t h e gut membranes because of the re la t ive ly long contact time between food and membranes. The consumption of contaminated food i s of concern i f dietary intake direct ly resul ts in tox i c i ty , and/or i f the chemical i s subjec t t o food-chain transfer result ing in t i s sue burdens that may potent ial ly be tox ic .
A food-chain model i s being developed for the New Bedford Harbor s i t e by HydroQual. The transfer and fate of PCBs and metals are being assessed with the model for two d i f f e r e n t food cha ins , culminating in American lobster ( H o m a r u s amer i c a n u s ) a n d w i n t e r f l o u n d e r (Pseudooleuronectes americanus), respectively (Figures 2-4 and 2-5) .
The HydroQual model consis ts of a ser ies of d i f f e r e n t i a l equations that numerically simulate the various processes t h a t determine t h e r e s i d u e v a l u e , or amount of a contaminant that remains in the t i s sues of the organism over t ime. Processes simulated in the model i n c l u d e surface sorption, transfer across the g i l l s , ingestion of
2-15

LOBSTER
CLAM MUSSEL
CRAB
POLYCHAETES AND OTHER
BENTHIC INVERTEBRATES
PLANKTON SEDIMENT
FIGURE 2- 4 LOBSTER FOOD CHAIN
NEW BEDFORD, MASSACHUSETTS
4959-50

FLOUNDER
—f CLAM L —f "N JUVENILE I CRABS |
\
POLYCHAETES AND OTHER
BENTHIC INVERTEBRATES
—f
\
POLYCHAETES AND OTHER
BENTHIC INVERTEBRATES
/
PLANKTON SEDIMENT
FIGURE 2- 5 FLOUNDER FOOD CHAIN
NEW BEDFORD, MASSACHUSETTS
4959-50

contaminated food, desorption, metabolism, excret ion, and g r o w t h . T h e s e p r o c e s s e s a r e r e g u l a t e d by t h e phys ica l /chemica l c h a r a c t e r i s t i c s of PCBs and by t h e p h y s i o l o g i c a l processes of the b i o t a .
The f o o d - c h a i n model i s designed to pred ic t res idue concentrations in species consumed by humans; t h e r e f o r e , i t i s a component of the public health risk assessment, as well as the ecological risk assessment. Because there are r e l a t i v e l y few data a v a i l a b l e on the e f fect of residue values on aquatic biota, i t i s not p o s s i b l e to use the model resul ts d irect ly in the ecological risk assessment. The model does not include provisions for modifying any of t h e p h y s i o l o g i c a l p r o c e s s e s as the organisms become stressed due to increasing body burdens of contaminants. However, i t i s necessary to consider toxic e f fec t s due to residue values as part of the risk assessment (see Section 4.0) .
A l so of importance for the r i s k a s s e s s m e n t i s t h e observation, based on cal ibrat ion and v a l i d a t i o n of the food-chain model, that consumption of PCB-contaminated food may account for the majority (up to 95 percent) of PCB r e s i d u e concentrat ions in aquatic s p e c i e s in New Bedford Harbor, although other investigators consider t h i s f i g u r e unreasonably h igh for a l l but top predators (Hansen , 1 9 9 0 ) . T h e r e f o r e , a l t h o u g h t h e r e a r e insuff ic ient data to evaluate t h i s pathway quantitat ively, i t must be considered in some way i f the risk assessment i s t o r e f l e c t actual e f f e c t s on aquatic b io ta in New Bedford Harbor. This a s p e c t of e c o l o g i c a l r i s k i s d i scussed in Sect ion 4 . 0 .
The mean l e v e l s (and ranges) of PCB t i s sue concentration found in organisms in the New Bedford Harbor area are summarized in Table 2-3, which i s based on l eve l s found in samples co l lected during the B a t t e l l e c r u i s e s of 1984, 1985, and 1986. These data i n d i c a t e that PCB t i s s u e residue concentrations are correlated with the l e v e l s of PCBs found in the New Bedford Harbor sediment and water column. For the s i x s p e c i e s comprising varied t rophic l e v e l s and habi ta t preferences , h ighes t t i s s u e burdens were found in organisms col lected from the inner harbor; l e v e l s decreased in successive areas in the outer harbor. The h ighes t t i s s u e l e v e l s were observed in polychaete worms, which are in d i r e c t and continuous contact with h i g h l y c o n t a m i n a t e d s e d i m e n t . w i n t e r f l o u n d e r fPseudopleuronectes americanusl also had re la t ive ly high whole-body t i s sue l e v e l s , perhaps ref lect ing i t s p o s i t i o n in the marine food web and i t s habit of lying par t ia l ly covered by bottom sediments.
2-18

TABLE 2-3 WHOLE-BODY CONCENTRATIONS OF TOTAL PCBS (PPM) IN ORGANISMS
COLLECTED FROM NEW BEDFORD HARBOR
NEW BEDFORD HARBOR
LOCATION3
SPECIES AREA 1 AREA 2 AREA 3 AREA 4
American Lobster Minimum 0.195 0.042 0.017 Mean 1.1312 0.568 0.213 0.064 Maximum 1.235 0.351 0.176
Winter Flounder Minimum 3.138 0.926 0.515 0.123 Mean 7.992 2.853 2.138 0.777 Maximum 20.230 8.067 6.349 2.616
Mussel Minimum 1.467 1.461 0.254 0.008 Mean 2.262 3.874 0.266 0.023 Maximum 2.962 6.204 0.278 0.039
Quahog Minimum 0.200 0.010 0.026 0.200 Mean 5.300 1.777 1.200 0.300 Maximum 2.121 1.182 0.478 0.137
Green Crab Minimum 0.071 0.067 0.624 0.020 Mean 0.398 0.184 0.976 0.048 Maximum 0.725 0.301 1.329 0.077
Polychaetes Minimum 0.096 0.182 Mean 12.9722 1.6542 0.392 0.486 Maximum ___ _ mm mm 0.689 0.790
NOTES:
1 Locations correspond to Fishing Closure Areas (see Figure 1-2), 2 Only one value available.
SOURCE: New Bedford Harbor Data Base
3.88.80 0060.0.0

Table 2-4 summarizes the ranges of whole-body metals concentrations detected In organisms In the New Bedford Harbor area. The t i s sue residue l eve l s of metals did not show general trends in contaminant concentrations between areas or between species . Overall, cadmium was detected at concentrat ions lower than e i t h e r copper or l e a d . Copper concentrations were highest In crustaceans ( I . e . , crabs and l o b s t e r s ) , which probably r e f l e c t s t h e i r copper-based heme system.
2-20

TABLE 2-4 RANGE OF TOTAL WHOLE-BODY METALS IN NEW BEDFORD HARBOR BIOTA
NEW BEDFORD HARBOR ECOLOGICAL RISK ASSESSMENT
ORGANISM CADMIUM (ppm) COPPER (ppm) LEAD (ppm) n
Lobster
Winter Flounder
Mussel
Quahog
Green Crab
Polychaetes
0.002NC 0.002-0.703 0.001-0.538 0.002-0.588
0.004-0.014 0.002-0.019 0.002-0.012 0.003-0.099
0.242-0.326 0.229-0.271 0.326-0.397 0.145-0.209
0.087-0.356 0.209-0.329 0.12-0.381 0.119-0.495
0.075-0.105 0.027-0.095,
0.081' 0.057
NA NA
.065-0.188, O.lll'
2 16 14 21
23 27 17 22
9 9 6 6
18 18 18 10
5 4 1 3
0.11-24.9 20.778-46.814 17.997-50.945 15.788-62.663
0.692-11.147 0.618-19.847 0.691-51.642 0.480-43.9
1.948-2.49 1.895-2.779 0.726-0.841 0.727-1.081
3.727-8.302 1.47-4.055 1.302-2.713 1.225-2.239
53.418-262.475 12.^-52.897
,2 201 180.231
NA NA
2.36-6.37 , 7.708'
2 16 14 21
23 27 17 22
9 9 6 6
18 18 18 10
5 4 1 3
6 3
0.223-1.29 2 0.106-3.034 16 0.021-1.124 14 0.029-0.842 21
0.215-3.336 22 0.154-4.523 27 0.099-2.728 17 0.089-6.84 22
0.293-1.41 9 0.237-1.17 9 0.367-0.647 6 0.134-0.308 6
0.58-1.901 18 0.488-0.981 18 0.208-3.463 18 0.098-1.720 10
4.292-29.768 5 1.45-6.908
30.6 4 1.45-6.908
30.6 1 13.824 3
NA NA
0.467-3.979 1.076
6 0.467-3.979 1.076 3
NOTES:
. Each value represents the mean of several organisms within one size class _ Only one value available , Total number of organisms sampled in each area
Areas correspond to Fisheries Closure Areas NA = Not Available

3.0 ECOTOXICITY ASSESSMENT
The ecotoxlcl ty assessment i s a two-step process consist ing of a c o m p i l a t i o n and e v a l u a t i o n of a v a i l a b l e t o x i c o l o g i c a l information, and a synthesis of the information to provide a q u a n t i t a t i v e a s s e s s m e n t of c o n c e n t r a t i o n / r e s p o n s e d a t a . Available toxicological information, some of which i s presented herein, strongly supports the conclusion that PCBs in the marine environment represent a potential threat to biota, and provides addi t iona l information necessary to determine the nature and severity of actual or potential adverse e f fec t s associated with exposure. Although addit ional toxicological studies would be u s e f u l , t h e data a v a i l a b l e a r e s u f f i c i e n t t o a l l o w a q u a n t i t a t i v e es t imat ion of the risk from contaminant exposure for four of the f ive groups discussed in Section 2 .0 . For the remaining group, the polychaete worms, the lack of available d a t a p r e c l u d e s d e v e l o p m e n t o f g o o d q u a n t i t a t i v e c o n c e n t r a t i o n / r e s p o n s e r e l a t i o n s h i p s . T h e concentration/response re la t ionsh ips developed herein w i l l be combined with the exposure concentrations from Section 2.0 to provide the quantitative estimate of r isk.
3.1 ECOTOXICITY PROFILES
3.1.1 PCBs
PCBs belong to a class of chemically stable, multi-use industrial chemicals that have been widely distributed in the New Bedford Harbor ecosystem. Electrical component manufacturers in New Bedford used PCBs in transformers and capacitors as dielectric insulating fluids resistant to fire. Discharge of PCBs into the harbor has resulted in contamination of the sediment, water, and biota in the area. Aspects of the structure, fate, and transport of PCBs with importance for determination of ecological risk are discussed in Subsection 1.3.
Adsorption to organic material in sediment is probably the major fate in the marine and estuarine environments of at least the more heavily chlorinated PCBs. Once bound, PCBs may persist for years, with slow desorption providing continuous exposure to the surrounding environment. Because PCBs are persistent in the environment and are lipophilic compounds, they are bioaccumulated (EPA, 1980b). The potential for bioaccumulation of an Aroclor mixture, as with other aspects of the biochemical behavior of PCBs, is related to the percentage of chlorine, with the BCF value generally increasing with higher chlorine content (Callahan et al., 1979). PCBs may be degraded by microorganisms (mainly the mono-, di-, and tri-chlorinated congeners) and by photolysis by ultraviolet light (mainly PCBs with five or more
3-1

chlorines) . Biodegradation rates and mechanisms appear to be specific to individual isomers and it is impossible to generalize about the overall rate for complex mixtures, except that many Aroclors persist for years or decades in the environment. Photolysis is extremely slow, but it may be a significant degradation pathway (EPA, 1980b).
EPA derived an AWQC for the protection of marine organisms for PCBs of 0.03 ug/L (parts per billion [ppb]). This value is based on laboratory-derived BCFs and was established to ensure that PCB burden in edible fish tissue (i.e., the final residue value [FRV]) would not exceed the former FDA tolerance level of 5.0 milligrams per kilogram (mg/kg) and not necessarily to protect ecological receptor organisms (EPA, 1980c) . A recalculation of the criteria based on the new tolerance level value of 2.0 mg/kg would establish the new criterion at 0.012 U9/L (ppb) 7 however, this change has not yet been made.
FDA tolerance levels are set to be protective of public health, but are based in part on economical and technical considerations. However, data from acute and chronic toxicity tests using Aroclors indicate that neither acute nor chronic toxicity should occur at the AWQC of 0.03 ug/L.
Marine AWQC, based on final toxicity values, are established to be protective of 95 percent of saltwater species. For PCBs, the AWQC document does not derive final acute or chronic values because determination of acute toxicity concentrations is problematic for PCBs (acute values are often in excess of maximum solubilities); minimum data criteria are not satisfied; and differing toxicities are demonstrated by the various PCB Aroclors and congeners (EPA, 1980b). Therefore, the saltwater AWQC for PCBs is based on the FRV, and is intended to protect the use of marine species as seafood rather than the species themselves, although it is considered sufficiently protective of the organisms as well. As such, these criteria serve as a tool to make general comparisons between the observed water column concentrations in New Bedford Harbor and toxicity information. However, site-specific ecotoxicity data provide a more definitive measure of the potential adverse effects of PCBs to marine organisms in New Bedford Harbor.
Tables B-l, B-2, and B-3 in Appendix B summarize available PCB ecotoxicity data, including acute and chronic toxicity data, as well as bioconcentration data for saltwater species discussed in the toxicological evaluation. Although PCBs have been shown to be acutely toxic to aquatic organisms, the actual exposure concentrations are unknown because the reported concentrations for the acute toxicity tests exceeded solubilities for some portion of PCB isomers, and the complex physical behavior of PCB mixtures makes cross-study comparisons difficult.
3-2

Based on the summarized acute and chronic toxicity data on PCBs, marine fish as a group are sensitive to the effects of PCB exposure. Chronic effects observed for marine fish include reduced hatching of embryos, reduced survivorship of fry, lethargy, fin rot, and decreased feeding, as well as mortality. Crustaceans are also quite sensitive, with acute effects being observed at exposures as low as 1 ug/L. The observed effects after chronic exposure for crustaceans include molt inhibition, dispersion of melanin in shells, altered metabolic state, and avoidance (Table B-2) . Mortality has also been observed for crustaceans after chronic exposure.
Mollusks as a group are generally not as sensitive to PCB exposure as marine fish and crustaceans; however, reduced growth was observed at an exposure of 5 ug/L. Reduced growth rates are also observed in alga exposed to PCBs. Reduced cell division, reduced carbon dioxide uptake, and even no growth have been observed in alga after chronic exposure to PCBs. When populations of more than one algae species are exposed to PCBs, changes in species ratios and decreased diversity in the communities are observed. Overall PCB toxic effects are varied and at low concentrations. Toxic effects have been reported at concentrations of PCBs higher than the solubilities of the compounds.
BCFs for marine organisms are relatively high, ranging from 800 to greater than 670,000 (EPA, 1980b). Field and Dexter summarized available data for bioaccumulation from PCB-contaminated sediment with ratios ranging to 20 (Field and Dexter, 1988). These high factors would be predictable based on the lipophilic nature of PCBs. BCFs vary depending on several factors, including the level of total organic carbon (TOC) in the sediment and the length of exposure. BCFs vary among species and for different congeners. In general, the factors will be higher for species with greater amounts of fatty tissue. For congeners, the highest factors appear to occur among the congeners with five and six chlorine atoms; the lowest among those with eight and nine atoms (Lake et al., 1989).
3.1.2 Copper
Copper is a necessary nutrient for plants and animals; however, it is toxic at higher concentrations (EPA, 1985a). The copper ion is highly reactive and complexes with many inorganic and organic constituents of natural waters (EPA, 1985a) . Hydrous iron and manganese oxides can effectively remove almost all free copper from the water column (Lee, 1975) ; and sediment/clay complexes, carbonates, and organic acids are all similarly effective under particular conditions. Most organic and inorganic copper complexes and precipitates appear to be much less toxic than free cupric ion.
3-3

Relatively few marine toxicological data are available for copper. However, mollusks and phytoplankton appear to be most sensitive to copper. Tables B-4 and B-5 in Appendix B summarize the toxicity data available for marine organisms. Copper has been shown to be acutely toxic to embryos of the blue mussel (Mvtilus edulisl at 5.8 ug/L (Martin et al., 1977), and several diatom and marine alga species are sensitive to copper in the l-to-10-ppb range. In fact, copper has been historically used as an aquatic herbicide and as a molluscicide to control schistosomiasis. Mean lethal concentration (LC5_) values for tests on winter flounder embryos (Pseudopleuronecxes americanus) and the American lobster (Homarus americanus) were 13 0 and 6 9 ug/L, respectively (EPA, 1985a).
The only chronic data available for marine organisms are for Mvsidopsis bahia; EPA established a chronic value of 54 ug/L based on lifecycle tests with this species. Various phytoplankton, polychaete worms, and mollusks have been shown to bioaccumulate copper with BCF values ranging from less than 100 to over 20,000. The marine chronic AWQC was established by EPA at 2.9 ug/L (ppb).
3.1.3 Cadmium
Although cadmium i s i n s o l u b l e in water, i t s ch lor ide and sulphate s a l t s readily so lub i l i ze . Humic acids and, to a l e s ser e x t e n t , hydrous i r o n and manganese o x i d e s , appear to be primarily responsible for determining the extent of adsorption to sediment, whi le increased acidity and oxygenation tends to amplify desorption rates and subsequent b ioava i lab i l i ty (Eisler, 1985; and Forstner, 1983) . In addit ion, increasing s a l i n i t y appears to mitigate the toxicological impact of t h i s contaminant (EPA, 1985b) . Tables B-6 and B-7 in Appendix B summarize the available saltwater ecotoxicity data for cadmium.
In general, freshwater species are considerably more s e n s i t i v e to cadmium poisoning than marine species (Eisler, 1985). Among marine organisms, invertebrates are most s e n s i t i v e t o cadmium t o x i c i t y , with acute t e s t r e s u l t s ranging from 41 to 135,00 0 u g / L f o r M y s i d o p s i s b a h i a and an o l i g o c h a e t e worm, Monophylephorus c u t i c a l c a t u s . r e s p e c t i v e l y (EPA, 1985b).
Sublethal e f f e c t s , including growth retardation, physiological d i s r u p t i o n s , and a l t e r a t i o n of oxygen c o n s u m p t i o n and r e s p i r a t o r y r a t e s , have been observed in marine organisms exposed to ambient cadmium concentrations on the order of 0.5 to 10 ug/L (Eisler, 1985) .
Marine organisms can read i ly bioconcentrate cadmium, and BCF values over 2,000 have been recorded in some polychaete worms
3-4
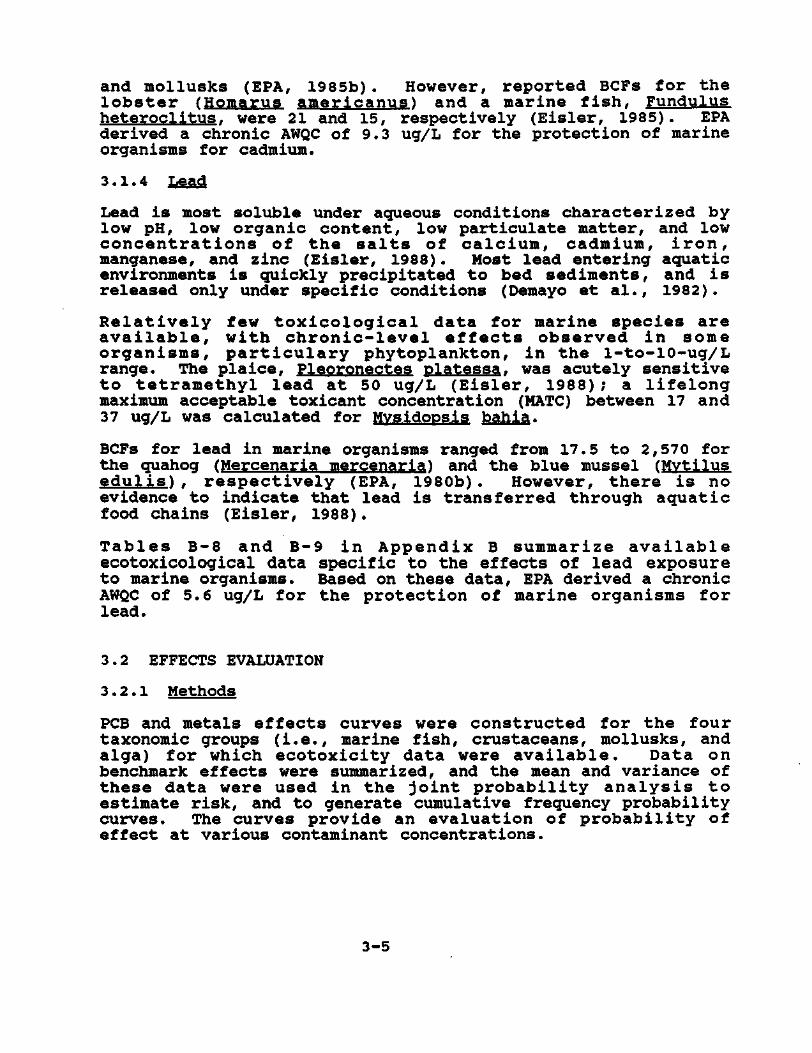
and mollusks (EPA, 1985b). However, reported BCFs for the lobster (Homarus americanus) and a marine fish, Fundulus heteroclitus, were 21 and 15, respectively (Eisler, 1985). EPA derived a chronic AWQC of 9.3 ug/L for the protection of marine organisms for cadmium.
3.1.4 Lead
Lead i s most s o l u b l e under aqueous condi t ions c h a r a c t e r i z e d by low pH, low o r g a n i c c o n t e n t , low p a r t i c u l a t e matter, and low c o n c e n t r a t i o n s o f t h e s a l t s o f c a l c i u m , cadmium, i r o n , manganese, and z inc ( E i s l e r , 1988) . Most lead enter ing aquatic environments i s quickly p r e c i p i t a t e d t o bed s e d i m e n t s , and i s r e l eased only under s p e c i f i c condi t ions (Demayo e t a l . , 1982) .
R e l a t i v e l y few t o x i c o l o g i c a l d a t a f o r marine s p e c i e s a r e a v a i l a b l e , w i t h c h r o n i c - l e v e l e f f e c t s o b s e r v e d i n some o r g a n i s m s , p a r t i c u l a r y p h y t o p l a n k t o n , i n t h e l - t o - 1 0 - u g / L range. The p l a i c e , Pleoronectes p l a t e s s a . was acute ly s e n s i t i v e t o t e t r a m e t h y l l e a d a t 50 ug/L ( E i s l e r , 1 9 8 8 ) ; a l i f e l o n g maximum acceptable tox i cant concentrat ion (MATC) between 17 and 37 ug/L was c a l c u l a t e d for Mysidopsis bahia.
BCFs for lead in marine organisms ranged from 17.5 t o 2,570 for the quahog (Mercenaria mercenaria) and the blue mussel (Mytilus e d u l i s ) , r e s p e c t i v e l y (EPA, 1980b) . However, t h e r e i s no evidence t o i n d i c a t e t h a t lead i s t r a n s f e r r e d through a q u a t i c food chains ( E i s l e r , 1988) .
T a b l e s B-8 and B-9 i n A p p e n d i x B summarize a v a i l a b l e e c o t o x i c o l o g i c a l data s p e c i f i c t o the e f f e c t s of l e a d exposure t o marine organisms. Based on these data, EPA derived a chronic AWQC of 5.6 ug/L f o r t h e p r o t e c t i o n of marine organisms f o r l ead .
3.2 EFFECTS EVALUATION
3 . 2 . 1 Methods
PCB and metals effects curves were constructed for the four taxonomic groups (i.e., marine fish, crustaceans, mollusks, and alga) for which ecotoxicity data were available. Data on benchmark effects were summarized, and the mean and variance of these data were used in the joint probability analysis to estimate risk, and to generate cumulative frequency probability curves. The curves provide an evaluation of probability of effect at various contaminant concentrations.
3-5

The standard acute benchmark for evaluating the acute response of an aquatic organism to the environmental concentration of a toxic contaminant is the 96-hour median LC5Q (EPA, 1982; and ASTM, 1984) . However, for purposes of ri.sk assessment, the acute benchmark is not appropriate because the organisms are assumed to be exposed for periods longer than 96 hours. A more appropriate benchmark is the MATC, which is the threshold for significant effects on growth, reproduction, or survival (EPA, 1982; and ASTM, 1984). The benchmark is based on the most sensitive response of the organism to the contaminant in question.
Few MATC data are available for marine organisms, and the research that has been performed is limited with respect to both contaminant type and test organisms used. There are insufficient MATC data for PCBs to generate distributions for any of the taxonomic groups of interest. For this risk assessment, MATCs for the four taxonomic groups were developed using a method described by Suter and Rosen (Suter et al., 1986; and Suter and Rosen, 1986) . This method uses an errors-in-variables regression model to predict a toxicological endpoint (in this case, the MATC) based on an extrapolation from existing endpoints for similar organisms. The regression equations used were established based on several large aquatic toxicological data bases (Suter and Rosen, 1986). For example, the model allows extrapolation from the LC5Q of one species to the LC-. of another; similar extrapolations can be performed Between LC5Qs and MATCs. Therefore, a regression equation can be developed that has a coefficient (slope) and constant (intercept) that characterizes a between-taxon LC50 relationship or a within-taxon relationship between LC,ns and MATCs. 3 U
The errors-in-variables approach considers the following characteristics of toxicity data that a linear least-squared model would not address: (1) the observed values of both the independent (X) and dependent (Y) variables have inherent variability and are subject to measurement error; (2) the independent variable is not a controlled variable; and (3) the values assumed by (X) and (Y) are open-ended and non-normally distributed (Ricker, 1973). This method allows for quantification of uncertainty from interspecific differences in sensitivity, and the variability of the relationship between acute and chronic effects of contaminants. The uncertainty is quantified in the variances that result from the extrapolation. This variance is then applied in the joint probability analysis, which uses the estimated toxicological benchmark value and its variance, along with an EEC and its variance to estimate risk of chronic effects to a particular group of organisms. The final risk estimate is interpreted as the probability of an adverse effect being realized in a typical member of the group in question, given the variability in contaminant levels.
3-6

This model and i t s application are discussed in more deta i l in Section 4 .0 . MATCs for four groups of organisms ( i . e . , marine f i s h , crustaceans , mollusks, and alga) representative of the range of organisms found in New Bedford Harbor were developed using t h i s approach. The taxonomic groupings were necessary to f a c i l i t a t e t h e a p p l i c a t i o n of t h e e r r o r s - i n - v a r i a b l e s methodology , because ex trapo la t ions are wi th in or between taxonomic l e v e l s . A comparable a n a l y s i s by s t r i c t t r o p h i c and/or habitat c la s s i f i ca t ion by th i s method would not have been possible because multiple taxa groups would be a part of such an analys is . However, these groups generally also define a primary means of exposure ( e . g . , via water or sediment) and, therefore, a l l o w c o n s i s t e n c y w i t h r e s p e c t t o a p p l y i n g e x p o s u r e c o n c e n t r a t i o n s t o p r o v i d e a r i s k e s t i m a t e .
For marine f i sh , crustaceans, and mollusks, MATCs were developed us ing the e r r o r s - i n - v a r i a b l e s methodology. For the algae, a chronic e f fect concentration was developed based on the exis t ing t o x i c o l o g i c a l d a t a . The data used for the o v e r a l l MATC development for alga and mollusks came from the AWQC and Eis ler documents (EPA, 1980a, 1980b, and 1980c; and E i s l er , 1986) . These data se t s were also used as the source of the LC_0 for the sheepshead minnow and the MATC for Daohnia magna used in extrapolations for marine f ish and crustacean MATCs.
All data used for the regressions were log-transformed. Test resul t s reported as greater than or l e s s than a particular value were not used. When r e p l i c a t e data were a v a i l a b l e for a chemica l - spec ies pa i r , the geometric mean for the species was used. Use of the geometric rather than the arithmetic mean for r e p l i c a t e t e s t s i s c o n s i s t e n t w i th EPA methods for AWQC development (EPA, 1982) .
3.2.2 Application and Results
3 .2 .2 .1 Marine Fish
Development of the MATCs for marine f ish was based on previously r e p o r t e d r e l a t i o n s h i p s . S u t e r and Rosen p e r f o r m e d e x t r a p o l a t i o n s between t h e LC^.s for sheepshead minnow (Cyprinodon v a r i e a a t u s ) and LC__s for marine s p e c i e s , as we l l as der iva t ion of the e r r o r s - i n - v a r i a b l e s r e l a t i o n s h i p between marine f i s h LC50 and marine f i s h MATCs (Suter and Rosen, 1986) . The slope, i n t e r c e p t , and variance from t h e s e extrapolations used in the MATC development and risk assessment for marine f i sh in New Bedford Harbor are presented in Table 3-1.
The overa l l marine f i sh MATC for PCBs was created by a double extrapolation: f i r s t from the sheepshead minnow chronic LC5Q for PCBs (0.93 ug/L) to a t y p i c a l marine f i sh LC_Q for PCBs
3-7

TABLE 3—l PCB MATC ESTIMATES FOR ORGANISMS AT NEW BEDFORD HARBOR
NEW BEDFORD HARBOR ECOLOGICAL RISK ASSESSMENT
TAXON SLOPE INTERCEPT MATC TOTAL
VARIANCE
Marine F i s h 0 .97 0 .03
0 .98 - 0 . 6 - 0 . 6 0 1 1 .021
Crustaceans 0 .95 0 .0 0 .668 0 .956
Mo H u s k s 1.577 - 0 . 4 5 6
0 .98 - 0 . 6 1.358 3 .024
Algae 0 .987 4 .907
NOTES:
1. The basic regression equation that defines the extrapolation is Y - Intercept + (X * Slope), where X is the acute toxicological estimate and Y the extrapolated MATC value.
2. No extrapolation was done for algae; rather, chronic data were used to estimate the benchmark value for the taxon.
3. In cases where two sets of slope and intercept values are listed, the first set is for a LC50-to-LC50 extrapolation, and the second for the final LC50-to-MATC extrapolation.
4. All units expressed as Log (base 10) ug/L.
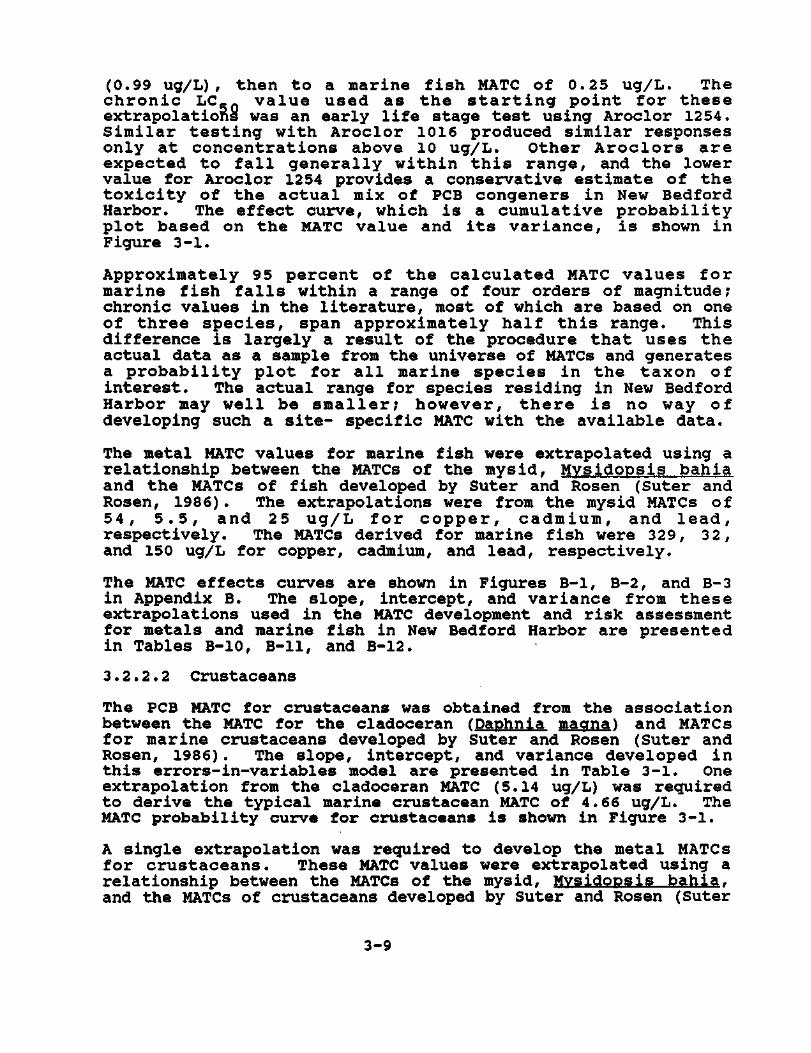
(0.99 ug/L), then to a marine fish MATC of 0.25 ug/L. The chronic LC 5 Q value used as the starting point for these extrapolations was an early life stage test using Aroclor 1254. Similar testing with Aroclor 1016 produced similar responses only at concentrations above 10 ug/L. Other Aroclors are expected to fall generally within this range, and the lower value for Aroclor 1254 provides a conservative estimate of the toxicity of the actual mix of PCB congeners in New Bedford Harbor. The effect curve, which is a cumulative probability plot based on the MATC value and its variance, is shown in Figure 3-1.
Approximately 95 percent of the calculated MATC values for marine fish falls within a range of four orders of magnitude; chronic values in the literature, most of which are based on one of three species, span approximately half this range. This difference is largely a result of the procedure that uses the actual data as a sample from the universe of MATCs and generates a probability plot for all marine species in the taxon of interest. The actual range for species residing in New Bedford Harbor may well be smaller; however, there is no way of developing such a site- specific MATC with the available data.
The metal MATC values for marine fish were extrapolated using a relationship between the MATCs of the mysid, Mysidopsis bahia and the MATCs of fish developed by Suter and Rosen (Suter and Rosen, 1986). The extrapolations were from the mysid MATCs of 54, 5.5, and 25 ug/L for copper, cadmium, and lead, respectively. The MATCs derived for marine fish were 329, 32, and 150 ug/L for copper, cadmium, and lead, respectively.
The MATC effects curves are shown in Figures B-l, B-2, and B-3 in Appendix B. The slope, intercept, and variance from these extrapolations used in the MATC development and risk assessment for metals and marine fish in New Bedford Harbor are presented in Tables B-10, B-ll, and B-12.
3.2.2.2 Crustaceans
The PCB MATC for crustaceans was obtained from the association between the MATC for the cladoceran (Daphnia magna) and MATCs for marine crustaceans developed by Suter and Rosen (Suter and Rosen, 1986). The slope, intercept, and variance developed in this errors-in-variables model are presented in Table 3-1. One extrapolation from the cladoceran MATC (5.14 ug/L) was required to derive the typical marine crustacean MATC of 4.66 ug/L. The MATC probability curve for crustaceans is shown in Figure 3-1.
A single extrapolation was required to develop the metal MATCs for crustaceans. These MATC values were extrapolated using a relationship between the MATCs of the mysid, Mysidopsis bahia. and the MATCs of crustaceans developed by Suter and Rosen (Suter
3-9

Log PCB Concentration ( ug/i)
MATC CU NEW BEDFORD, M

and Rosen, 1986). The extrapolations were from the mysid MATC values of 54, 5.5, and 25 ug/L for copper, cadmium, and lead, respectively. The extrapolated MATCs developed for crustaceans were 65.5, 10.5, and 35.3 ug/L for copper, cadmium, and lead, respectively. The slope, intercept, and variance from these models are shown in Tables B-10, B-ll, and B-12 in Appendix B. The MATC curves for copper, cadmium, and lead are shown in Figures B-l, B-2, and B-3, respectively.
3.2.2.3 Mollusks
To develop the PCB MATC for mollusks, two extrapolations were needed. First, a relationship between the LC..S for the mysid, Mys idopsis bahia. and LC-Qs of mdllusks was developed. The relationship between these species was used because the greatest number of matches between chemical-species pairs was available and, although there is no close taxonomic relationship, the mysid is a standard test species. Because there are no MATC data available for mollusks, an estimate of the MATC was performed by using the relationship between marine fish LC s and MATCs, on the assumption that the ratios between acute and chronic effects for marine fish and mollusks are similar. The slopes, intercepts, and variances used in this MATC development are shown in Table 3-1.
The mollusk LCgQ of 99.61 ug/L was obtained by forward extrapolation irom the mysid LC (36.0 ug/L). The estimated mollusk LC,-n was then used to estimate the typical mollusk MATC (2 2 .TT2 ug/L) based on the LC 5 Q/MATC relationship for marine fish. The effects curve is shown in Figure 3-1. There is a large variance associated with this MATC due to the double extrapolation. Large variances were observed by Suter and Rosen for similar extrapolations between higher level taxonomic groups (Suter et al., 1986; and Suter and Rosen, 1986). Because the variance for the extrapolation from LC_0 to MATC for marine fish is small, its use in this application may result in an underestimation of the variance associated with the MATC for mollusks.
As in the case of PCBs, limited data are available on metal MATCs for mollusks. To develop MATCs for mollusks, the same marine fish LCg0-to-MATC relationship was used as for PCBs, assuming that tne ratios between acute and chronic effects for marine fish and mollusks are similar. The LC5Qs used in this extrapolation were developed from values reported in the AWQC and Eisler documents (EPA, 1980a, 1980b, and 1980c; and Eisler 1985 and 1986). These data are compiled in Tables B-4 through B-9 in Appendix B. For each metal, the mollusk LC5Q value used in the extrapolation is a geometric mean of the values reported for all mollusks.
3-11

The metal MATCs for mollusks were derived from the mollusk LCgQ v a l u e s of 7 2 . 4 , 2 , 6 6 6 , and 1,244 ug/L for copper , cadmium, and l e a d , r e s p e c t i v e l y . The s i n g l e f o r w a r d extrapolat ion for each metal estimated the mollusk MATCs to be 1 6 . 7 , 5 7 1 , and 271 ug/L for copper , cadmium, and l e a d , respect ively. The e f fec t s curves for the MATCs are presented in Figures B-l , B-2, and B-3 in Appendix B. The slope, intercept, and variance from these extrapolations are presented in Tables B-10, B- l l , and B-12.
3.2.2.4 Polychaetes
There were sufficient acute toxicological data for the three metals to develop MATC estimates for polychaetes, using the crustacean LC5Q and MATC extrapolation developed by Suter and Rosen (Suter and Rosen, 1986) . In this case, it was assumed that the ratios between acute and chronic effects for crustaceans and polychaetes are similar. The LC_Qs used in this extrapolation were developed from values reported in the AWQC and Eisler documents (EPA, 1980a, 1980b, and 1980c; and Eisler 1985 and 1986) . Tables B-4 through B-9 in Appendix B summarize of the toxicological data used to develop MATC estimates for polychaetes. The polychaete LC.Q for each metal is a geometric mean of the values reported for all polychaetes and oligochaetes.
The metal MATCs for polychaetes were derived from the polychaete LC5- values of 199, 9,682, and 10,691 ug/L for copper, cadmium, and lead, respectively. A single forward extrapolation for each metal was necessary to estimate the polychaete MATCs as 30.2, 1,276, and 1,409 ug/L for copper, cadmium, and lead, respectively. MATC curves for copper, cadmium, and lead are shown in Figures B-l, B-2, and B-3, respectively. The slope, intercept, and variance from these individual extrapolations are presented in Tables B-10, B-ll, and B-12.
3.2.2.5 Algae
For the algal species at the New Bedford Harbor site, a benchmark concentration was developed using the geometric mean of the results from chronic tests as presented in the AWQC and Eisler documents (EPA, 1980; and Eisler, 1986). Although this value is not an MATC by definition, it is a reasonable best estimate of chronic toxicological effects of PCBs on algal species based on the limited data available. The benchmark concentration of 9.71 ug/L has a high amount of variance (4.44); this is due to the large amount of variability in reported responses to PCBs. The effects curve is shown in Figure 3-1.
For the metals, a geometric mean was developed from chronic effects data presented in the AWQC and Eisler documents (EPA, 1980a and 1980c; and Eisler, 1985 and 1988). The benchmark
3-12

values derived were 12, 99.3, and 234 ug/L for copper, cadmium, and lead, respectively. The effects curves for the MATCs are shown in Figures B-l, B-2, and B-3 in Appendix B. Summary statistics for these benchmark concentrations are in Tables B-10, B-ll, and B-12.
3.2.3 Evaluation of MATCs
Because of the l imi t ed amount of data a v a i l a b l e about t h e e f fec t s of PCBs and metals on marine organisms, the estimates of MATC or c h r o n i c e f f e c t benchmarks as used in t h i s r i s k assessment have some uncertainty, which was quantified to some e x t e n t by t h e v a r i a n c e s from t h e e r r o r s - i n - v a r i a b l e s e x t r a p o l a t i o n s . The r e l a t i v e e f f e c t of t h i s source of uncertainty may be observed graphica l ly by comparison of the slope of the probability function for the MATC of each group in Figure 3-1 . This uncertainty i s also evident in the e f fect of the variance on resul ts of the analysis of extrapolation error model used for risk characterization in Sect ion 4 . 0 . In a l l c a s e s , the variance in the estimates for metal MATC values was not as high as for PCBs, primarily due to the fact that only one extrapolation was necessary.
Another area of uncerta inty for these MATC estimates resu l t s from the need to perform extrapolations from a s ingle species to a taxonomic group consist ing of many species , some of which may be only dis tant ly related. If the s ingle species used in the e x t r a p o l a t i o n happens t o be p a r t i c u l a r l y s e n s i t i v e t o contaminants, the f inal estimate of the group MATC may be overly conservat ive . This i s probably the case for the extrapolation from the sheepshead minnow to marine f i sh in general. The PCB LC5Q for the sheepshead minnow (0.93 ug/L), the species used to develop most of the available data, i s quite low, driving the marine f i s h MATC t o a lower v a l u e than may be the c a s e . However, other marine f i s h t e s t e d a l s o have low LC_.s f o r PCBs. 3 U
3-13

4.0 RISK CHARACTERIZATION
Risk to marine organisms in New Bedford Harbor was evaluated for exposure to waterborne and sediment-bound PCBs and metals, as well as for consumption of PCB-contaminated food. Risk estimates for each environmental medium were evaluated by taxonomic group for each harbor zone described in Section 1.0, and overall ecosystem risk was assessed qualitatively from the individual risk estimates.
A quantitative uncertainty (or joint probability) analysis was performed by combining results of the analyses of exposure and ecotoxicity presented in the two preceding sections to develop probabilistic estimates of risk in New Bedford Harbor. In addition, risk to organisms exposed to dissolved contaminants in the water and directly to PCB-contaminated sediment was evaluated by comparing analytical data on existing contaminant levels with appropriate water and sediment criteria, and by examining the results of site-specific bioassays. Risk due to ingestion of PCB-contaminated food was evaluated by comparing the tissue burden levels detected in New Bedford Harbor biota to effect levels associated with reproductive impairment and pathological effects in marine fish.
4.1 JOINT PROBABILITY ANALYSIS
4.1.1 PCB Water Column Contamination
The probability functions for chronic effects due to dissolved PCBs in the water column for each of the four taxonomic groups with sufficient toxicological data to perform the analysis are shown co-plotted with the EEC probability functions for the Hot Spot and Zones 1 through 5 in Figures 4-1 through 4-4. Results of the joint probability analysis for each group using these two sets of curves are presented in Table 4-1. For the algae (see Figure 4-1), potential impacts are projected for each zone, particularly areas north of the Coggeshall Street Bridge (Zones 1 and 2, and the Hot Spot) , where there is a 30 percent or greater probability that the average dissolved PCB concentration encountered by a typical marine algal species would exceed the respective chronic benchmark. Another way of expressing this effect would be as an impact on the most sensitive 30 percent of the various algal species used for the toxicity studies upon which the chronic effects curve was based and, therefore, are representative of taxa that might occur in the area. For Zones 3 and 4, the average concentration encountered would potentially impact 2 0 percent or less of the algal species; however, essentially the entire harbor north of the Hurricane Barrier has a high probability of impacting more than 5 percent of the algal species (i.e., a benchmark used by EPA in determining water quality criteria) . Because of the wide range of sensitivities
4-1

- 4 - 2 0 2 Log PCB Concentration ( ug/l)
MATC FOR ALGA AND EECs FOR ALL ZONES, PCBs, NEW BEDFORD, M

#
1.0
0.8 -
o § 0.6
<D
§ 0.4
3 E O 0.2
0.0
ZONE 4 -f—*
HOT SPOT
ZONE 5
U MATC For Mollusks
ZONE 1
1 •2 0 2
Log PCB Concentration ( ug/l)
MATC FOR MOLLUSKS AND EECs FOR ALL ZONES, PCBs, NEW BEDFORD, M

#
1.0
0.8
o § 0.6 3
> °-4
O 0.2
0.0
ZONE 4 -#—*•
ZONE 5 *
MATC for Crustac
ZONE 1
•2 0 2
Log PCB Concentration ( ug/l)
MATC FOR CRUSTACEANS AND EECs FOR ALL ZONES, PCBs, NEW BEDFORD, M

as
1.0
0.8
>»
o g 0.6 cr
(0
E O 0.2
0.0
ZONE 4-4—>•
ZONE 1
-2 0 2 Log PCB Concentration ( ug/l)
MATC FOR MARINE FISH AND EECs FOR ALL ZONES, PCBs, W NEW BEDFORD, MA

TABLE 4-1 CUMULATIVE PROBABILITY THAT THE EXPECTED EXPOSURE CONCENTRATION
WILL EXCEED THE PCB MATC FOR THE PARTICULAR TAXON
NEW BEDFORD HARBOR ECOLOGICAL RISK ASSESSMENT
HARBOR MARINE ZONE FISH CRUSTACEANS MOLLUSKS ALGAE
Hot Spot, Water Column 0.86 0.43 0.31 0.41
1. Water Column 0.84 0.40 0.29 0.40
2. Water Column 0.73 0.26 0.23 0.33
3. Water Column 0.42 0.07 0.11 0.21
4. Water Column 0.28 0.03 0.07 0.16
5. Water Column 0.16 0.01 0.04 0.12
Hot Spot, Pore Water 0.97 0.82 0.60 0.64
1. Pore Water 0.98 0.81 0.55 0.61
2. Pore Water 0.82 0.49 0.36 0.44
3. Pore Water 0.52 0.12 0.14 0.25
4. Pore Water 0.33 0.07 0.09 0.18
5. Pore Water 0.24 0.04 0.07 0.16
NOTES:
Probabilities calculated as the area under a normally distributed curve defined by a particular Z score, where Z • (Mean EEC - BM) / (Var EEC + Var BM)A2. Source: Suter et al., 1986.
EEC - Expected Environmental Concentration
BM « Benchmark, which in this application are the MATCs developed by extrapolation, in the case of Marine Fish, Crustaceans, and Mollusks. For Algae, the benchmark was based on available chronic toxicity data

demonstrated by this taxonomic group (indicated by the slope of the chronic effects function), even the highest concentrations seen at the Hot Spot would not impact the least sensitive 5 0 percent of algal species.
Because of the similarity between the chronic effects probability curves, the effects for algal species generally are true for mollusks (see Figure 4-2). PCB concentrations above the Coggeshall Street Bridge would be expected to impact approximately 2 0 percent of the molluscan species; however, concentrations in the remainder of the harbor would not be expected to pose as great a threat to this group, and would likely impact less than 10 percent of the species.
The pattern of risk for crustaceans (see Figure 4-3) is markedly different from the preceding two groups because of the generally narrower range of sensitivities to PCB exposure, as indicated by the steeper slope of the MATC function. For the crustaceans, there is approximately a 40 percent likelihood that the typical PCB concentrations encountered in the Hot Spot and Zone 1 would be expected to exceed the MATC value of the typical crustacean. The slightly lower concentrations in Zone 2 would have a smaller yet still serious impact. Outside the Coggeshall Street Bridge, anticipated impacts on crustaceans are small, with concentrations projected to impact less than 5 percent of the species.
Because of their much greater sensitivity to dissolved PCBs, marine fish are the most heavily impacted group (see Figure 4-4) . For this group, typical concentrations in the Upper Estuary are projected to impact more than 80 percent of the fish species, and even the tenth-percentile concentration would have nearly as large an effect. In Zones 3 and 4, the impact remains high, with concentrations projected to impact approximately 3 0 percent of the marine fish. This analysis indicates that marine fish are at high risk of impact due to chronic exposure to dissolved PCBs for the entire area inside the Hurricane Barrier.
The mean total PCB concentration in Zone 5 was below concentrations shown in laboratory studies to produce toxic effects. In addition, the exceedance probabilities for all taxonomic groups were in the 5- to 15-percent range, indicating that potential impacts of PCB contamination in this zone would be expected to be much less than the remainder of the study area, although still significant.
Figures 4-5 through 4-8 show the areal extent of the probability that chronic effects will be observed due to water column exposure to PCBs for the various taxonomic groups, based on the initial conditions concentration for each grid cell. The probability contours shown on these maps indicate general trends within each zone and should not be used to assess localized differences of chronic effects.
4-7

© (NOTE: REFER TO FIGURE 2.1 FOR ZONE LOCATIONS)
AEROVOX
NEW BEDFORD
FAIRHAVEN
COGGESHALL STREET BRIDGE
DARTMOUTH
MISHAUM POINT
ROCK POINT
NEGRO LEOGE
MOT TO SCALE
FIGURE 4-5 MAP OF
CHRONIC EFFECTS PROBABILITIES FOR ALGA, PCBs, WATER COLUMN
NEW BEDFORD, MASSACHUSETTS

© (NOTE: REFER TO FIGURE 2.1 FOR ZONE LOCATIONS)
AEROVOX
FAIRHAVEN
NEW BEDFORD
DARTMOUTH
V ^
NOT TO SCALE
MISHAUM POINT
ROCK POINT
NEGRO LEDGE
FIGURE 4-6 MAP OF
CHRONIC EFFECTS PROBABILITY FOR MOLLUSKS, PCBs, WATER COLUMN
NEW BEDFORD, MASSACHUSETTS

© (NOTE REFER TO FIGURE 2.1 FOR ZONE LOCATIONS)
FAIRHAVEN
NEW BEDFORD
DARTMOUTH
< /
NOT TO SCALE
MISHAUM POINT
ROCK POINT
NEGRO LEDGE
FIGURE 4-7 MAP OF
CHRONIC EFFECTS PROBABILITIES FOR CRUSTACEANS, PCBs, WATER COLUMN
NEW BEDFORD, MASSACHUSETTS

© (NOTE: REFER TO FIGURE 2.1 FOR ZONE LOCATIONS)
AEROVO
FAIRHAVEN
NEW BEDFORD
DARTMOUTH
ROCK POINT
NEGRO LEDGE
^Z/
MOT TO SCALE
MISHAUM POINT FIGURE 4-8 MAP OF
CHRONIC EFFECTS PROBABILITIES FOR MARINE FISH, PCBs, WATER COLUMN
NEW BEDFORD, MASSACHUSETTS

4.1.2 PCB Sediment Contamination
The r i s k s p r e v i o u s l y d i s c u s s e d caused by w a t e r column contamination with dissolved PCBs occur ultimately as a resul t of contaminated bed sediment in the harbor and es tuary , which provide a r e s e r v o i r of PCBs that are desorbed and resuspended into the water column. Therefore, a l l r isks in the system may be thought of as due to sediment contamination. However, throughout the r i s k assessment r i s k s due t o contaminated sediment are meant to include those r i s k s that r e s u l t from direct exposure to the sediment and i t s associated pore water, and not to overlying water contaminated from the sediment.
The exposure curves developed for the various harbor zones in t h i s a n a l y s i s represent the expec ted d i s t r i b u t i o n of PCB contaminant l eve l s in the pore water. Considerable ef fort has been devoted in the New Bedford Harbor project to the quest ion of pore water concentrat ions as part of the modeling e f fort ; however, no s i t e - s p e c i f i c c a l c u l a t i o n of pore water PCB c o n c e n t r a t i o n s from sediment-bound concentrat ions has been developed. As d iscussed in S u b s e c t i o n 2 . 2 . 2 . 2 , t h e mass t r a n s f e r c o e f f i c i e n t s deve loped for c a l i b r a t i o n of t h e physical/chemical model were used as apparent K.s t o c a l c u l a t e pore water concentra t ions for t h i s r i s k assessment. This approach resul ts in pore water concentrations that are generally higher than the overlying water column concentrations.
In development of the food-chain model, pore water was assumed to be in equilibrium with the overlying water column; therefore, the water column concentrat ions were also used as pore water concentrations. I t i s probable that the actual concentrat ions experienced by benthic and demersal organisms w i l l be between these two extremes; consequently, the developed exposure curves probably o v e r e s t i m a t e the a c t u a l exposure concentrat ions experienced by most species . As such, the r i s k p r o b a b i l i t i e s should be considered conservative; however, in the absence of more spec i f ic data, a conservative approach i s necessary.
MATC curves and EEC sediment ( i . e . , sediment pore water) curves are c o - p l o t t e d for mollusks, crustaceans, and marine f i sh in Figures 4-9 through 4-11- Because they would not be expected to be exposed t o sediment pore water, the eva luat ion was not conducted for a lgae . There i s cons iderable v a r i a b i l i t y i n behavior and habitat preference among the species comprising a l l three taxonomic groups, and some species ( e . g . , p e l a g i c f i s h , mussels, and copepods) would not be expected to have any direct contact with sediment pore water. However, i n s u f f i c i e n t data were avai lable to construct separate MATC curves based on l i f e history and, on the assumption that s e n s i t i v i t y to PCBs would not be expected to vary between benthic and pelagic members of a taxonomic group, the s ingle MATC curve was used for each group. Consequently, chronic e f f e c t s d i s t r i b u t i o n s for these three
4-12
#
1.0
0.8
>» u S 0.6 o
f 0.4 TO 3 E O 0.2
0.0 -4
ZONE 5
MATC for Mol
-2 0 2 Log PCB Concentration ( ug/l)
MATC FOR MOLLUSKS AND EECs FOR ALL ZONES, PCB NEW BEDFORD, M

#
1.0
0.8
o S> 0.6 mm
| 0.4 '•5* (0 3 E O 0.2
0.0 •4
ZONE S — *
HOT SPOT
-2 0 2 Log PCB Concentration ( ug/l)
MATC FOR CRUSTACEANS AND EECs FOR ALL ZONES, PC NEW BEDFORD, M

a«
1.0
0.8
>» o § 0.6 0)
I 0.4
3 E O 0.2
0.0
ZONE 5
- MATC for Marine Fish
-4
HOT SPOT
•2 0 2 Log PCB Concentration ( ug/i)
MATC FOR MARINE FISH AND EECs FOR ALL ZONES, PCB NEW BEDFORD, M

groups are the same as used in the joint probability analysis for the water column exposure.
These results are summarized in Table 4-1 as the percent probability of the median sediment concentration resulting in risk to each group. Exceedance probabilities in the Hot Spot and Zone 1 are 81 and 55 percent for crustaceans and mollusks, respectively, declining with increasing distance from the Upper Estuary. In Zone 4, the probability that a typical member of either group would experience contaminant levels likely to result in chronic effects is predicted to be less than 10 percent.
Based on available toxicological data, the probability that fish exposed to pore water PCB concentrations in Zone 1 and the Hot Spot, specifically, will experience chronic effects is close to a certainty. This likelihood is approximately 8 2 percent in Zone 2, declining to 24 percent in Zone 5. It is unlikely that any fish will be continually exposed to dissolved PCB concentrations similar to those found in the pore water; to the extent that this is not the case, the actual risks experienced would be considerably lower.
Figures 4-12 through 4-14 show the areal extent of the probability that chronic effects will be observed due to pore water exposure to PCBs for the various taxonomic groups, based on initial conditions for each grid cell.
4.1.3 Water Column Metals Contamination
The chronic effects probability functions for each of the five taxonomic groups are shown in Appendix C, co-plotted with the EEC probability functions for Zones 1 through 5 in Figures C-l through C-5, Figures C-6 through C-10, and Figures C-ll through C-15, for copper, cadmium, and lead, respectively. Tables C-l through C-3 present results of the joint probability analysis for each group.
Compared with results discussed previously for PCBs, there is less indication that aquatic organisms are at risk due to the metals contamination in New Bedford Harbor. This analysis would predict that crustaceans, as a group, are most likely to experience deleterious effects from copper, cadmium, and lead contamination. However, even in the most contaminated zones, impacts are predicted for less than 20 percent of these sensitive organisms. The other four taxonomic groups are at little discernable risk due to metals contamination in the water column, except for mollusks exposed to dissolved copper in Zones 1, 2, and 3 (see Figure C-3). In this case, this analysis would predict that levels of dissolved copper in the water column could have some impact on the most sensitive 10 to 15 percent of mollusk species in New Bedford Harbor. Although these potential
4-16

© (NOTE: REFER TO FIGURE 2.1 FOR ZONE LOCATIONS)
AEROVOX 9f& 0.6
NEW BEDFORD
FAIRHAVEN
COGGESHALL .4 STREET BRIOGE
DARTMOUTH
^ >
NOT TO SCALE
MISHAUM POINT
ROCK POINT
NEGRO LEDGE
FIGURE 4-12 MAP OF
CHRONIC EFFECTS PROBABILITIES FOR MOLLUSKS, PCBs, PORE WATER
NEW BEDFORD, MASSACHUSETTS

© (NOTE: REFER TO FIGURE 2.1 FOR ZONE LOCATIONS)
FAIRHAVEN
NEW BEDFORD
DARTMOUTH
^
MOT TO SCALE
MISHAUM POINT
ROCK POINT
NEGRO LEDGE
FIGURE 4-13 MAP OF
CHRONIC EFFECTS PROBABILITIES FOR CRUSTACEANS, PCBs, PORE WATER
NEW BEDFORD, MASSACHUSETTS

© (NOTE: REFER TO FIGURE 2.1 FOR ZONE LOCATIONS)
AEROVOX
NEW BEDFORD
FAIRHAVEN
OGGESHALL TREET BRIDGE
DARTMOUTH
S>
NOT TO SCALE
MISHAUM POINT
ROCK POINT
NEGRO LEDGE
FIGURE 4-14 MAP OF
CHRONIC EFFECTS PROBABILITIES FOR MARINE FISH, PCBs, PORE WATER NEW BEDFORD, MASSACHUSETTS

risks are significant, they are not of the same magnitude as those described previously for PCBs.
Figures C-16 through c-30 show the areal extent of the probability that chronic effects will be observed due to water column exposure to metals for the various taxonomic groups.
4.1.4 Sediment Metals Contamination
MATC curves and EEC pore water curves are co-plotted for all taxonomic groups except algae in Appendix C, Figures C-3 1 through C-34, Figures C-35 through C-38, and Figures C-39 through C-42 for copper, cadmium, and lead, respectively. As for PCBs, the same chronic effects distributions were used for comparison with sediment pore water concentrations as with water column concentrations.
These results are summarized in Tables C-l through C-3 as the percent probability of the mean sediment concentration resulting in risk to each group for the three metals of concern. In general, the exceedance probabilities are similar to those determined for water column exposures to these metals. Crustaceans are predicted to be most likely impacted by sediment contamination, with risk estimates of a much lower magnitude to those calculated for PCB contamination in these same areas (i.e., Zones 1, 2, and 3).
The other three taxonomic groups are predicted to be minimally impacted by the levels of these three contaminants in sediment, with probabilities ranging from 5 percent to virtually zero probability of exceeding the respective chronic effects thresholds.
Figures C-43 through C-46, Figures C-47 through C-50, and Figures C-51 through C-54, present the areal extent of the probabilities that chronic effects will be observed due to pore water exposure to copper, cadmium, and lead (respectively) for the various taxonomic groups.
4.2 COMPARISON WITH AMBIENT WATER QUALITY CRITERIA
4.2.1 Water Column Concentrations
The chronic PCB AWQC for the protection of marine life and its uses is 0.03 ug/L. There is no 1-hour marine acute criterion for PCBs; however, the AWQC document indicates that acute effects to aquatic organisms from PCB exposure may be probable at concentrations greater than 10 ug/L (EPA, 1980b).
Because the intent of the baseline risk assessment is to provide a benchmark against which results of numerical modeling of
4-20

remedial alternatives may be compared, the model start-up conditions were used for risk comparisons. The start-up conditions reflect both the initial sediment conditions, which are based on available data for the area, and the dynamics of the physical/chemical model. The vertically averaged start-up conditions in each zone were believed to accurately represent chronic exposure in the harbor.
The maximum concentrations observed were considered to be reflective of potential short-term exposures. Consequently, for each zone, maximum PCB concentration values were compared to the 10-ug/L benchmark, and mean concentration data to the chronic AWQC, to generate a measure of potential risks to aquatic organisms. Simple statistics summarizing the concentration data by zone are presented in Table C-l in Appendix C. The acute benchmark concentration of 10 ug/L was not exceeded by the maximum concentration in the start-up conditions data in any zone at the New Bedford Harbor site. Based on this comparison, potential risks associated with short-term exposure to PCBs dissolved in the water column are expected to be slight.
However, the chronic AWQC is exceeded by the mean PCB concentration in all zones except Zone 5. Therefore, aquatic organisms are potentially at risk of experiencing effects due to chronic exposure to PCB contamination in all areas of New Bedford Harbor north of the Hurricane Barrier. Because the chronic AWQC of 0.03 ug/L for PCBs is not based solely on toxicity information (EPA, 1980b), it does not necessarily reflect a level protective of aquatic life, but rather of aquatic life and its uses, and may be considered a conservative standard against which to evaluate risk.
Although the chronic marine AWQC for copper (2.9 ug/L) was exceeded by the mean water column concentrations in both Zones 2 and 3 (see Table 2-3), the exceedence was slight. Ratios of the mean copper concentration to the chronic criterion were only 1.17 and 1.2 for Zones 2 and 3, respectively. Although some potential exists for adverse impacts due to dissolved copper in the water column in these areas, these ratios suggest that any effects would not be severe. The chronic criteria for cadmium and lead were not exceeded in any zone in New Bedford Harbor.
4.2.2 Sediment Concentrations
An interim Sediment Quality Criterion (SQC) is available for PCBs (Aroclor 1254) ; no SQC have been developed for metals. As is the case for the AWQC, the interim SQC developed by EPA (EPA, 1988) is residue-based; that is, it is intended to be a value that will not result in commercially harvested species having PCB body burdens exceeding the original FDA action level of 5 ppm. SQC are not currently considered to be ARARs for Superfund programs. The SQC was derived from the AWQC by applying a
4-21

partitioning coefficient (K ) that varies with the amount of organic carbon in the sediment. The upper and lower 95 percent confidence intervals (CIs) for the SQC are based on the variance of K and represent the range within which the actual sediment criterion value is expected to fall. The lower CI is assumed to represent the concentration which, with 97.5 percent certainty, will result in body burdens in resident commercial species remaining below 5 ppm.
The mean sediment concentrations in each zone were compared to the lower 95 percent CI; the maximum concentrations were compared to the SQC. TOC values for sediments in the area of interest vary from less than 1 percent to nearly 10 percent, but are generally higher in the Acushnet River Estuary where values near 5 percent are typical. For simplicity, a value of 1 percent TOC was assumed for all areas, providing a conservative estimate of sediment toxicity in the estuary. Assuming an average TOC of 1 percent, the carbon-normalized SQC is 0.418 ug/g (ppm)/ with a lower 95 percent CI of 0.083 ug/g. These results indicate that virtually all areas of the harbor, including most adjacent areas of the Outer Harbor and even some areas well out into Buzzards Bay, pose a risk to at least some aquatic organisms. Even assuming a TOC of 10 percent, which would reduce the amount of PCB available for uptake by biota by an order of magnitude, essentially all areas of the harbor would exceed the lower 95 percent CI of 0.829 ug/g.
4.3 SITE-SPECIFIC TOXICITY TESTS
Several toxicity tests have been performed with New Bedford Harbor sediment, and the results provide the most realistic indication of the degree of toxicity posed by contaminated sediment in the harbor. Although these studies provide the most direct indication of toxicity, it is difficult to separate effects due to PCBs from effects due to metals and other contaminants that may be present in the sediment. In addition, it is difficult to evaluate how closely the laboratory conditions simulated actual harbor conditions in the various tests. Despite these limitations, site-specific data permit an independent verification of the reasonableness and accuracy of the more theoretically based predictions discussed previously.
In a solid-phase bioassay, Hansen exposed the sheepshead minnow fCyprinodon varieaatus) and amphipod (Ampelisca abdita) to New Bedford Harbor sediment (Hansen, 1986). The toxicological endpoints examined were mortality, fish embryo survival, and hatched fish survival. Other sublethal effects theoretically included in the joint probability and AWQC evaluations may also have been occurring but were not evaluated. In addition, it is not possible to identify the specific contaminants responsible for these effects.
4-22

The reported results of Hansen's study were as follows (Hansen, 1986):
o significant reduction in survival of adult sheepshead minnows exposed for 29 days to sediment (i.e., to water contaminated by contact with contaminated sediment) collected from Zones 1 and 2 (zero and 7 2 percent, respectively)
o significant reduction in survival of progeny (i.e. , embryos and/or hatched fish) of adult minnows exposed to sediment collected from Zones 1, 2, and 3
o 10-day amphipod mortality correlated with the spatial gradient of contaminants in harbor sediment, with mortality rates of 100 and 92.2 percent in amphipods exposed to sediment from Zones 1 and 2, respectively, compared to 13.3 percent in the reference area
o mortality rates of 11.1 to 73.3 percent in amphipods exposed for 10 days to sediment obtained from Zones 4 and 3, respectively
Results of these sediment toxicity tests indicate that New Bedford Harbor sediment is toxic to certain aquatic organisms. Based on these data, it appears that sediment obtained from within the inner harbor (north of the Popes Island/State Route 6 Bridge) poses a risk to resident aquatic invertebrates and to the survival and reproduction of resident fish. Measurable but less severe adverse effects were observed in fish and amphipods exposed to sediment obtained from Zone 4, which contained 10 ppm total PCBs (Hansen, 1986).
In general, the toxicity of New Bedford Harbor sediment to amphipods and fish decreases from the Upper Estuary toward the Hurricane Barrier. Toxic effects have been observed in sediment from Zone 4; however, these effects are not statistically significant when compared to a reference sediment collected from central Long Island Sound.
In 1988, the National Oceanic and Atmospheric Administration developed sediment target levels for PCBs that were considered protective of aquatic life. The recommended range, 0.1 to 1.0 ppm PCBs, is based on information showing that concentrations of PCBs in aquatic organisms residing in contaminated areas are equal to or exceed the PCB concentrations found in the sediment (Field and Dexter, 1988). This relationship is generally true for xenobiotic compounds (e.g., PCBs) that are persistent in the environment, readily bioaccumulated by aquatic organisms, and slowly biotransformed and excreted by fish (Lech and Peterson,
4-23

1983) . In add i t ion , t o x i c o l o g i c a l e f f e c t s were observed in f i s h w i t h t i s s u e c o n c e n t r a t i o n s of PCBs l e s s than 0 . 1 ppm ( s e e S u b s e c t i o n 4 . 4 ) .
4 .4 RISK DUE TO BIOACCUMULATION OF PCBS
Bioaccumula t ion of PCBs by exposed organisms r e s u l t s in high t i s s u e burden l e v e l s of t h e s e compounds. There i s e v i d e n c e s u g g e s t i n g t h a t PCBs are a l s o biomagnified in the food chain (Shaw and C o n n e l l , 1 9 8 2 ; Thomann, 1 9 7 8 ; and Thomann and Conno l ly , 198 4) . The b i o a c c u m u l a t i o n of PCBs may r e s u l t i n e l e v a t e d t i s s u e l e v e l s t h a t may be t o x i c t o t h e o r g a n i s m d i r e c t l y , or i n d i r e c t l y as a r e s u l t of modified behavior with consequent increased exposure t o predators .
Food-chain t r a n s f e r of PCBs i s considered l i k e l y f o r organi sms w i t h i n t h e New B e d f o r d Harbor a r e a , b e c a u s e e l e v a t e d PCB c o n c e n t r a t i o n s were d e t e c t e d i n prey o r g a n i s m s . Mean PCB concentrat ions in po lychaetes , clams, mussels , and crabs in the harbor are 1 2 . 9 , 5 . 3 , 2 . 6 , and 0.4 ppm, r e s p e c t i v e l y ( see Figure 4-2) . These organisms are a l l c o n s t i t u e n t s of t h e d i e t of winter f lounder, s t r i p e d bass , and b l u e f i s h .
PCB t i s s u e concentrat ions r e s u l t i n g from d i e t a r y exposure i n upper l e v e l carnivores have been shown t o produce the fo l lowing e f f e c t s in marine f i s h :
o C o n c e n t r a t i o n s o f 11 t o 98 mg/kg c a u s e d l i v e r abnormali t ies in the tomcod (Klauda e t a l . , 1981) .
o C o n c e n t r a t i o n s g r e a t e r t h a n 24 mg/kg c a u s e d r e p r o d u c t i v e f a i l u r e i n t h e c y p r i n i d minnow ( B e n g t s s o n , 1 9 8 0 ) .
o Concentrat ions greater than 7.0 mg/kg caused reduced surv iva l of sheepshead minnow embryos (Hansen, 1973) .
o C o n c e n t r a t i o n s o f 0 . 1 2 mg/kg c a u s e d i n h i b i t e d reproduction in the B a l t i c flounder (Sp ies , 1985) .
o C o n c e n t r a t i o n s of 0 .2 mg/kg reduced r e p r o d u c t i v e s u c c e s s i n t h e s t a r r y f l o u n d e r ( S p i e s , 1 9 8 5 ) .
o C o n c e n t r a t i o n s of 1.4 mg/kg c a u s e d r e p r o d u c t i v e impairment in the s t r iped bass (Ray e t a l . , 1984) .
o C o n c e n t r a t i o n s from 0 . 0 0 5 t o 0 . 0 5 mg/kg caused h i s t o l o g i c a l changes in the A t l a n t i c cod (Freeman e t a l . , 1982) .
PCB t i s s u e l e v e l s in winter flounder from the New Bedford Harbor area were compared t o a v a i l a b l e t o x i c i t y d a t a f o r s i m i l a r
4-24

species. To allow comparisons between the New Bedford Harbor whole-body concentrations and organ-specific toxicity data, the whole-body PCB concentrations were adjusted using an edible:whole-body ratio derived by BOS for winter flounder collected to provide calibration data for the food-chain model (Battelle, 1987). Whole-body concentrations for winter flounder in the modeling program data base were multiplied by 0.13 to produce edible-tissue concentrations, which were then adjusted based on the results using striped bass to produce concentrations in the gonads (Ray et al., 1984). Ray found that fish tend to accumulate PCBs in the gonadal tissues, with the ratio of muscle to gonad PCB concentrations ranging from 1:1 to 10:1 (Ray et al., 1984). Estimates of the PCB concentration in the gonads of winter flounder are listed in Table 4-2.
Limited data are available on the effects of PCB concentrations in gonads of winter flounder. Toxicity data for two similar species (Baltic and starry flounder) were used to qualitatively assess the potential risks associated with PCB tissue burdens. These data indicate that concentrations as low as 0.12 and 0.2 ppm PCBs in the ovaries of these species can inhibit reproduction (Spies, 1985; and Von Westernhagen et al., 1981). The range of estimated PCB concentrations in the gonads of the winter flounder exceed 0.2 ppm PCBs in all areas except Area 4, where the mean estimated gonad concentration was 0.1 ppm.
Because of the assumptions used to derive these concentrations, conclusions concerning the potential risk to these organisms cannot be made. However, these data do indicate the potential for the accumulation of PCBs in reproductive organs of species inhabiting New Bedford Harbor to levels that have been shown to cause reproductive effects.
Reproductive effects in winter flounder exposed to surface water from New Bedford Harbor have been observed by Black (Black, et al., 1986). Gravid female flounder were collected from New Bedford Harbor (Zone 5), and the collected progeny were reared under uncontaminated conditions. Elevated PCB concentrations were observed in the eggs of winter flounder from the New Bedford Harbor area. Larvae hatched from these eggs were significantly smaller in length and lower in weight than the eggs and larvae from the reference area near Fox Island in lower Narragansett Bay. PCB tissue concentrations in the adult winter flounder were not reported; therefore, direct relationships between PCB body burdens and reproductive effects cannot be made. At larval metamorphosis, the differences between locations had disappeared. However, in a competitive and stressful natural environment, it is likely that even transient differences in size would result in significant differences in juvenile survivorship.
4-25

TABLE 4-2 CONVERSION OF WHOLE-BODY WINTER FLOUNDER PCB
TISSUE CONCENTRATIONS TO EXPECTED GONAD CONCENTRATIONS
NEW BEDFORD, MASSACHUSETTS
Winter Flounder
Whole-body PCB
Concentration (mg/kg)
Edible-tissue PCB
Concentration1
(mg/kg)
Expected Range of PCB-gonad Concentration2
(mg/kg)
20.23 7.99
2.63 1.039
2.63 • 1.039 •
- 26.30 - 10.39
8.07 2.85
1.05 0.371
1.05 • 0.371 •
- 10.5 - 3.71
6.35 2.14
0.83 0.278
0.83 • 0.278 -
- 8.3 - 2.78
2.62 0.78
0.34 0.101
0.34 -0.101 •
- 3.4 - 1.01
Area 1 MAXIMUM MEAN
Area 2 MAXIMUM MEAN
Area 3 MAXIMUM MEAN
Area 4 MAXIMUM MEAN
NOTES:
1 These values are based on an edible-muscle-to-whole-body ratio of 0.13. 2 These values are based on muscle-to-gonad ratios ranging from 1:1 to 10:1.
3.88.80 0064.0.0

Thurberg examined the e f f e c t s of high PCB body res idues in American l o b s t e r , Homarus americanus. on egg-hatching success, larval growth and survival, molting success, and the duration of the larval period (Thurberg, 1985). Despite the elevated l eve l s of PCBs in the eggs and larvae of New Bedford Harbor lobs ters , there were no discernable differences in any of the bio logical response variables .
Capuzzo investigated the e f fects of PCB uptake and accumulation on growth, energetics , and reproductive potential of the mollusk (Myt i l i s edu l i s ) (Capuzzo, 1986). Mussels were p l a c e d i n s c r e e n e d c a g e s a t v a r i o u s l o c a t i o n s in Buzzards Bay and Nantucket Sound where i n s i t u p h y s i o l o g i c a l measurements r e l a t i n g t o e n e r g e t i c p a r t i t i o n i n g were t a k e n . Mussels t r a n s p l a n t e d t o the Hurricane B a r r i e r (Zone 4) showed considerable uptake of PCBs i n i t i a l l y , followed by a gradual s t a b i l i z a t i o n , and exper i enced a lower growth p o t e n t i a l , r e l a t i v e to the s t a t i o n s in Nantucket Sound and at Cleveland Ledge. This e f f e c t was due to a decrease in the amount of carbon i n g e s t e d and a s s i m i l a t e d , as we l l as t o increased resp ira tory expenditures . These i n d i v i d u a l s a l s o made t h e lowest reproductive e f f o r t (measured as the amount of energy allocated to reproduction re lat ive to the to ta l amount of energy a s s i m i l a t e d t o growth and r e s p i r a t i o n during the spawning period) of the three s t a t i o n s .
The studies c i ted previously have shown that:
o PCBs accumulate in c e r t a i n a q u a t i c o r g a n i s m s (Capuzzo, 1 9 8 6 ) .
o PCBs concentrate in the gonads of f i sh (Ray at a l . , 1984).
o PCB concentrations greater than 0.1 ppm in the gonads of flounder have been shown to cause reproductive e f fec t s (Spies , 1985 and Van Westernhagen e t a l . , 1981).
o Eggs from winter flounder in the New Bedford Harbor area had e levated l e v e l s of PCBs (Black e t a l . , 1986) .
o Larvae hatched from eggs containing e l eva ted PCB l e v e l s were smaller in length and lower in weight.
o Reproductive e f f e c t s (measured as t h e amount of energy a l l o t t e d to reproduction) were lower in the mussels exposed to surface water from the New Bedford Harbor area.
4-27

The body of toxicity data described indicate that biota at the New Bedford Harbor site are at potential risk due to the consequences of PCB accumulation; this is supported by the site-specific data generated by Black and Capuzzo (Black et al., 1986; and Capuzzo, 1986).
Because no toxicity data associated with PCB tissue burdens could be identified for other species (e.g., lobsters, clams, crabs, and polychaetes), a discussion of risk to these species is not possible. However, PCBs are lipophilic, are known to accumulate in fatty tissues, and have been detected in all biota in New Bedford Harbor. Although there is considerable variation in tolerance to PCBs across species, some species would be expected to be at least as sensitive to PCBs as the species for which data are available, and would therefore be expected to be impacted by the observed body burdens.
4.5 BENTHIC SURVEYS
Several infaunal surveys have been performed at the New Bedford Harbor site. Although many ecological factors in addition to chemical contamination can contribute to areal differences in the numbers and kinds of organisms, these results generally support the conclusions reached previously in this report.
An extensive benthic sampling program was conducted for USACE (USACE, 1988a). The 26 sampling locations spanned all areas of New Bedford Harbor discussed in this report. Significant correlations between the level of PCB contamination in the harbor and several measures of community, including the number of species, and diversity and evenness indices were found. Due to differences in the sampling methodology used during the program, there is some concern regarding comparability of the sampling data. However, overall trends relating benthic community descriptors to PCB levels appear to be consistent. The basic pattern observed was a domination in the Upper Estuary by the polychaete, Streblospio benedicti; another polychaete, Tharyx acutus. was dominant in the rest of the inner harbor. Outside the Hurricane Barrier, bivalves and gastropods became the most common organisms. Associated with these taxonomic differences were an increase in the species diversity of the infaunal community and a more equal representation of individual species from the Upper Estuary into the outer harbor.
A comparative study of this nature suffers from the gross differences in habitat between different locations. It is possible that physical factors (e.g., sediment characteristics and turbidity) are the primary determinants of the community patterns observed. However, these results do not contradict previous conclusions regarding risks associated with different zones. Many polychaetes are generally less sensitive to
4-28

sediment c o n t a m i n a t i o n than o t h e r t a x a , and t h e i r g e n e r a l dominat ion of t h e most h i g h l y contaminated sediments in the harbor sugges t s the impact that PCBs and other chemicals may be having on t h i s ecosystem (Rubinstein, 1989) .
A wet land study compared chemical and b i o l o g i c a l data from s i x wetland areas in the harbor and from a r e l a t i v e l y u n p o l l u t e d reference area in Buzzards Bay (USACE, 1988b). The study found a d e p r e s s e d b e n t h i c community in t h e Zone 1 w e t l a n d . I n a d d i t i o n , comparison of t h e b i o l o g i c a l data between a Zone 2 wetland and the reference area indicated s i g n i f i c a n t d i f f e r e n c e s i n s p e c i e s d i v e r s i t y and e v e n n e s s , p a r t i c u l a r l y among p o l y c h a e t e s , a m p h i p o d s , and m o l l u s k s . However , h a b i t a t d i f f e r e n c e s c o m p l i c a t e any at tempt t o r e l a t e d i f f e r e n c e s i n benthic community pat terns t o v a r i a t i o n in the PCB contamination between these l o c a t i o n s .
4.6 SUMMARY OF RISK CHARACTERIZATION
As part of the ecological risk assessment for the New Bedford Harbor site, a joint probability analysis was used to develop probabilistic risk estimates for the effects of PCBs and heavy metals (i.e., copper, cadmium, and lead) contamination on marine organisms. The expected distribution of a taxonomic group response to a contaminant was estimated by extrapolating the responses observed in individual organisms to larger groups. This methodology involved the summarization of the available toxicological data using errors-in-variables regression models and the quantification of uncertainty as the combining of variances through the various extrapolations.
Separate estimates were developed for the major taxonomic groups in New Bedford Harbor to provide more detailed information on how contamination is affecting specific components of the harbor ecosystem. This permits the risk assessment process to isolate the most sensitive groups of organisms, as well as quantifying the likelihood of impact for all groups. Presentation of the risk analysis in probabilistic terms will provide a more complete representation of the impacts of the various remedial alternatives on potentially affected organisms. In addition to this approach, PCB and metals concentrations in the harbor were compared to sediment and water criteria, and the results of various site-specific bioassays and benthic surveys were evaluated with respect to potential risk. Results of these different approaches are summarized in the following paragraphs; risks are discussed in view of these findings.
Aquatic organisms (particularly marine fish) are at risk due to exposure to waterborne PCBs in New Bedford Harbor. The mean PCB concentrations in the Hot Spot and Zones 1 through 4 exceed the
4-29

chronic AWQC, and the joint probability analysis indicates that there is significant likelihood that chronic effects will be realized in at least some species inhabiting New Bedford Harbor. These risks are most severe in Zones 1 and 2 and the Hot Spot; however, potential risk is evident for all zones within the Hurricane Barrier.
The pore water PCB concentrations in the sediment are highly toxic to at least some members of all major taxonomic groups. In the Upper Estuary, the likelihood that chronic effects would be observed in a typical marine fish species exposed to PCBs in pore water is close to 100 percent; risk is substantial for mollusks and crustaceans as well. The risk probabilities for all groups decline toward the outer harbor; however, marine fish may still be substantially impacted in Zone 5. However, in Zone 4, the likelihood that chronic effects would be realized in typical crustaceans and mollusks is predicted to be less than 10 percent. The SQC, carbon-normalized to 1 percent TOC, is exceeded in Zones 1 and 2, and the lower 95 percent confidence level for the SQC is exceeded in all zones. Finally, results of various sediment bioassays support the conclusions based on laboratory-generated toxicological data and comparisons with interim SQC. Sediment from the inner harbor has been demonstrated to be toxic to both benthic invertebrates and fish; the degree of toxicity is correlated with PCB levels in test sediments.
Many marine organisms from New Bedford Harbor have been shown to be contaminated with elevated tissue levels of PCBs. PCB levels in gonadal tissue of winter flounder collected from Zones l, 2, and 3 exceed levels shown to result in reproductive impairment and other effects in marine fish. Levels in organisms from lower trophic levels may either induce toxicological effects or impact predator species.
Risk due to exposure to PCBs is also largely dependent on location of the organisms in the harbor, and may be a function of migratory behavior or reproductive habits. Organisms such as American eels, which reside mostly in the Upper Estuary (i.e., Zones 1 and 2) in close contact with the sediment, are likely to be at greater risk of toxic effects from exposure to PCB contamination than organisms that only migrate periodically into this area (e.g., blueback herring) and remain in the water column. In addition, juvenile aquatic organisms using the Upper Estuary/Hot Spot area as a nursery ground may be at an elevated risk of contaminant exposure, given that this lifestage is generally more sensitive to chemical insult than the adult stage. Foraging behavior and prey preferences can also influence the degree of exposure encountered by a particular organism.
4-30

With regard to potential risks due to heavy metals, both the joint probability analysis and a comparison with AWQC indicate some possibility for impacts on marine biota in New Bedford Harbor. Based on comparisons with AWQC, concentrations of copper in the water column represent some potential for concern, with crustaceans determined to be the taxon most likely at risk. Results of this analysis suggest that, although metals may be having some impact on the harbor ecosystem, the effects attributable to these contaminants are overshadowed by the presence of PCBs at much more harmful levels.
Potential impacts due to the presence of PCBs or heavy metals in New Bedford Harbor cannot be adequately defined by assessing risk to a single species or taxonomic group or by exposure to a single medium. Chemical stresses placed on aquatic organisms are multilayered. An organism in New Bedford Harbor is simultaneously exposed to many contaminants in addition to those evaluated in this risk assessment. However, based on available data, it appears that the four contaminants chosen (i.e., PCBs, copper, cadmium, and lead) constitute the most significant risk to organisms in the harbor. It is impossible to quantify the effects of multiple exposures to a mixture of contaminants. Furthermore, member species in an ecological community interact and depend on other species to satisfy many essential biological needs. Because of the interdependence of ecological units that comprise an ecosystem, seemingly minor disturbances affecting components of the system can have significant ramifications on the stability and functioning of the overall system. In view of the inherent complexity involved in attempting to assess the impacts of chemical stress on overall ecosystem integrity, only a qualitative approach is typically feasible.
The effects of chemical stress on an ecosystem can potentially affect such interspecific ecological interactions as competition, predation, and disease resistance. These effects can alter a population's birth and death rates resulting in long-term changes in numerical abundance (Ricklefs, 1979). The elimination of commercial harvesting of finfish, shellfish, and lobsters since 1979 further complicates the evaluation of large-scale effects in New Bedford Harbor.
Numerous site-specific and laboratory studies indicate that New Bedford Harbor is an ecosystem under stress due to PCBs and other chemical contamination. This stress can be manifested in many ways that are perceived as having negative consequences from a human perspective. There are many potentially affected species for which changes in population dynamics or marketability are of interest, including various shellfish and fish harvested from New Bedford Harbor before the closure enactment. On another level, however, the health of the overall
4-31

harbor i s of concern, in that anthropogenic e f f e c t s can a l t e r the resource value of the harbor ( i . e . , recreational, food, and e s t h e t i c s ) . The issue i s whether the s t a b i l i t y and functioning of the harbor ecosystem has been or w i l l be impacted by the described c o n t a m i n a t i o n , s t a b i l i t y b e i n g d e f i n e d as t h e i n t r i n s i c a b i l i t y of a system to withstand or recover from externally caused change (Ricklefs, 1979) . Overall s t a b i l i t y may be a f f e c t e d by v a r i o u s changes r e l a t e d t o chemica l contamination in the harbor, including population s i z e , spec ies d i v e r s i t y or evenness, and physiological or behavioral changes that impact interactions between species .
In conclusion, a l l approaches used to a s s e s s r i s k a s s o c i a t e d with PCB contamination in New Bedford Harbor i n d i c a t e tha t l e v e l s in Zones 1, 2, and 3 have the p o t e n t i a l t o s t rong ly impact indiv idual biota in the harbor, as well as the overall integri ty of the harbor as an integrated functioning unit . This impact may take the form of numerical changes at the population l e v e l , changes in community c o m p o s i t i o n , and u l t i m a t e l y ecosystem s t a b i l i t y . Ecosystem l e v e l d i srupt ions are l e s s s trongly ind icated in Zone 4 but s t i l l are probable.
4-32
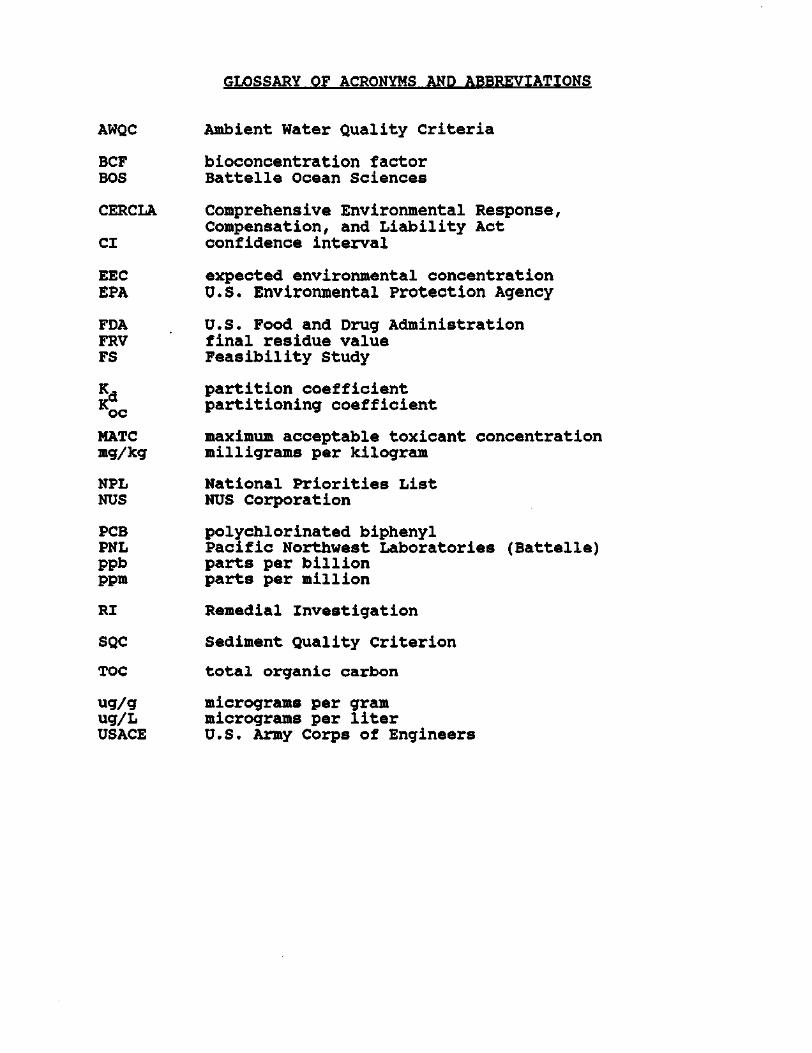
GLOSSARY OF ACRONYMS AND ABBREVIATIONS
AWQC Ambient Water Quality Criteria
BCF BOS
CERCLA
CI
EEC EPA
FDA FRV FS
d oc
MATC mg/kg
NPL NUS
PCB PNL ppb ppm
RI
SQC
TOC
ug/g ug/L USACE
bioconcentration factor Battelle Ocean Sciences
Comprehensive Environmental Response, Compensation, and Liability Act confidence interval
expected environmental concentration U.S. Environmental Protection Agency
U.S. Food and Drug Administration final residue value Feasibility Study
partition coefficient partitioning coefficient
maximum acceptable toxicant concentration milligrams per kilogram
National Priorities List NUS Corporation
polychlorinated biphenyl Pacific Northwest Laboratories (Battelle) parts per billion parts per million
Remedial Investigation
Sediment Quality Criterion
total organic carbon
micrograms per gram micrograms per liter U.S. Army Corps of Engineers
REFERENCES
American S o c i e t y for Test ing and Materials (ASTM) , 1984. 1984 Book of ASTM Standards ; V o l . 1 1 . 0 4 ; P h i l a d e l p h i a , Pennsylvania.
B a t t e l l e Memorial I n s t i t u t e , 1990 . "Model l ing of t h e Transport, D i s t r i b u t i o n , and Fate of PCBs and Heavy Metals i n t h e Acushnet River/New Bedford Harbor/Buzzards Bay System;" i n p r e p a r a t i o n .
B a t t e l l e Ocean Sc i ences , 1987. "Ratios of E d i b l e T i s s u e t o Whole Body PCB Concentrations in Flounder and Lobster from New Bedford Harbor"; submitted t o U.S. Environmental P r o t e c t i o n A g e n c y ; O f f i c e o f Marine and E s t u a r i n e P r o t e c t i o n ; Contract No. 6 8 - 0 3 - 3 3 1 9 ; J u l y 15 , 1987 .
B e n g t s s o n , B . E . , 1 9 8 0 . "Long- term E f f e c t s o f PCB ( C l o p h e n a 50) on Growth, Reproduct ion , and Swimming Performance i n t h e Minnow. Phoxinus Phox inus": Water Resources; Vol. 14; pp. 681-687.
Bigelow, H.B., and W.C. Schroeder, 1953. "Fishes of the Gulf of Maine"; Fishery B u l l e t i n of the Fish and W i l d l i f e Serv ice ; Vol. 53 .
Black , D . E . , D.K. P h e l p s , and R.L. Lopan, 1986. "The Ef fec t of Inher i ted Contamination on Egg and Larval Winter F l o u n d e r . P s e u d o p l e u r o n e c t e s Americanus"; u n p u b l i s h e d m a n u s c r i p t .
B r o w n a w e l l , B . J . , a n d J . W . F a r r i n g t o n , 1 9 8 6 . " B i o g e o c h e m i s t r y of PCBs i n I n t e r s t i t i a l Waters o f a C o a s t a l Marine Sediment"; Geochemica e t Cosmochimica Acta ; V o l . 50 ; pp. 1 5 7 - 1 6 9 .
C a l l a h a n , M.A., M.W. Slimak, N.W. Gabel, e t a l . , 1979. " W a t e r - r e l a t e d E n v i r o n m e n t a l F a t e o f 129 P r i o r i t y P o l l u t a n t s " ; V o l . 1; U . S . Environmental P r o t e c t i o n Agency; Off ice of Water Planning and Standards, Off ice of Water and W a s t e w a t e r Management; EPA 4 4 0 / 4 - 7 9 - 0 2 9 a ; Washington, DC.
Camp, Dresser, and McKee, 1979. "1983 301(h) Appl icat ion for New Bedford Harbor Water Treatment P lant ."
Capuzzo, J.M., 1986. "PCBs in Buzzards Bay: E f f e c t s on Energet ics and Reproductive Cycles on B i v a l v e M o l l u s k s " ; Woods H o l e O c e a n o g r a p h i c I n s t i t u t i o n ; Woods H o l e , M a s s a c h u s e t t s ( u n p u b l i s h e d r e p o r t ) .

REFERENCES (Continued)
Demayo, A., M.C. Taylor, K.W. Taylor, and P.V. Hodson, 1982. "Toxic Effects of Lead and Lead Compounds on Human Health, Aquatic Life, Wildlife Plants, and Livestock"; CRC Critical Review on Environmental Control; Vol. 12; pp. 257-305.
Dill, O.C., M.A. Mayes, C.G. Mendoza, 6.U. Boggs, and J.A. Emmitte, 1982. "Comparison of the Toxicities of Biphenyl, Monochlorobiphenyl, and 2,2 ', 4, 4 ' -Tetrachlorobiphenyl to Fish and Daphnids"; Aquatic Toxicology and Hazard Assessment; Fifth Conference, ASTM STP 766; J. 6. Pearson, R.B. Foster, and W.E. Bishop (Eds.); American Society for Testing and Materials; pp. 245-256.
Eisler, R., 1985. "Cadmium Hazards to Fish, Wildlife, and Invertebrates: A Synoptic Review"; Biological Report 85 (1.2); U.S. Fish and Wildlife Service.
Eisler, R., 1986. "Polychlorinated Biphenyl Hazards to Fish, Wildlife, and Invertebrates: A Synoptic Review"; Biological Report 85 (1.7); U.S. Fish and Wildlife Service.
Eisler, R., 1988. "Lead Hazards to Fish, Wildlife, and Invertebrates: A Synoptic Review"; Biological Report 8 5 (1.4); U.S. Fish and Wildlife Service.
Field, L.J., and R.N. Dexter, 1988. "A Discussion of PCB Target Levels in Aquatic Sediments"; National Oceanic and Atmospheric Administration; Ocean Assessments Division; Seattle, Washington.
Forstner, U., 1983. "Metal Transfer Between Solid and Aqueous Phases"; In: Metal Pollution in the Aquatic Environment"; U. Forstner and G.T.W. Whitman (Eds.); Springer-Verlag, 2nd edition.
Freeman, H.C., 6. Sangalang, and B. Fleming, 1982. "The Sublethal Effects of A Polychlorinated (Arochlor 1254) Diet on the Atlantic Cod (Gadus morhua)"; Science of the Total Environment; Vol. 24, No. 1; pp. 1-11.
Hansen, D., 1973. "Arochlor 1254 in Eggs of Sheepshead Minnows: Effect on Fertilization Success and Survival of Embryos and Fry"; Proceedings of the 27th Annual Conference of the Southeast Association of Game Fish Communities; p. 42 0.
REFERENCES (Continued)
Hansen, D. , 1986. "Preliminary Data Report, New Bedford Harbor P r o j e c t " ; EPA Narranganse t t Laboratory; Rhode I s l a n d ; unpub l i shed r e p o r t .
Hansen, D. , 1990. "Review of the August 1989 Draft Final New B e d f o r d Harbor S i t e E c o l o g i c a l Risk Asse s sment" ; Comments sent t o Frank C i a v e t t e r i , EPA Region I ; January 2, 1990.
Klauda, R.J., T.H. Peck, and 6.K. Rice, 1981. "Accumulation of Polychlorinated Biphenyls in Atlantic Tomcod (Microaadus tomcod) Collected from the Hudson River Estuary"; New York Environ. Contam. Toxicol; Vol. 27; pp. 829-835.
Lake, J., N. Rubenstein, H. Lee, C. Lake, J. Heltshe, and S. Pavignano, 1989. "Equilibrium Partitioning and Bioaccumulation of Sediment-associated Contaminants by Infaunal Organisms"; Journal of Environmental Toxicology and Chemistry; in press.
Larsson, P., 1985. "Contaminated Sediments of Lake and Oceans Act as Source of Chlorinated Hydrocarbons for Release to Water and Atmosphere"; Nature; Vol. 317; pp. 347-349.
Lech, J.J., and R.E. Peterson, 1983. "Biotransformation and Persistence of Polychlorinated Biphenyls in Fish"; In: PCBs; Human and Environmental Hazards; F.M. D'ltic and M.A. Koria (Eds.); Ann Arbor Science Publishers, Inc.; Ann Arbor, Michigan; pp. 187-201.
Lee, G.F., 1975. "Role of Hydroxous Metal Oxides in the Transport of Heavy Metals in the Environment"; In: Heavy Metals in the Aquatic Environment; P.A. Krenkel (Ed.); Pergamon Press; pp. 137-147.
Martin, M., et al., 1977. "Copper Toxicity Experiments in Relation to Abalone Deaths Observed in a Power Plant's Cooling Waters"; California Fish and Game; Vol. 63; p. 95.
Menzer, R.E., and J.O. Nelson, 1986. "Water and Soil Pollutants"; In: Casarett and Doull's Toxicology; The Basic Science of Poisons. Third Edition; CD. Klaassen, M.O. Amdur, and J. Doull (Eds.); Macmillan Publishing Co.
NUS Corporation, 1984a. "Draft Feasibility Study of Remedial Action Alternatives, Acushnet River Estuary above the Coggeshall Street Bridge, New Bedford Site, Bristol County, Massachusetts"; September 1984.

REFERENCES (Continued)
NUS Corporation, 1984b. "Addendum - Draft F e a s i b i l i t y Study of Remedial A c t i o n A l t e r n a t i v e s , Acushnet R i v e r Estuary above the Coggeshall S t r e e t B r i d g e , New Bedford S i t e , B r i s t o l County, Massachusetts"; September 1984.
O ' D o n n e l , J . R . , M.B. Kaplan, and H.E. A l l e n , 1 9 8 5 . " B i o a v a i l a b i l i t y of Trace M e t a l s i n N a t u r a l Water" ; Aquat i c T o x i c o l o g y and Hazard Assessment Symposium; ASTM STP 854; R.D. Caldwell , e t a l . (Eds . ) ; American S o c i e t y for Test ing and Mater ia l s , Phi ladelphia , Pennsylvania; pp. 485-501.
Pav lou , S . P . , and R.N. Dex ter , 1979 . " P h y s i c a l and Chemical A s p e c t s of t h e D i s t r i b u t i o n of Polychlor inated B i p h e n y l s i n t h e Aquat ic E n v i r o n m e n t " ; I n : A q u a t i c T o x i c o l o g y : ASTM STP 667; L.L. Marking and R.A. Kimerle (Eds . ) ; American Soc ie ty for T e s t i n g and M a t e r i a l s ; p p . 195-211.
Ray, S . , B.M. Jessop , J . Coff in, and D.A. Swetman, 1984. "Mercury and P o l y c h l o r i n a t e d B i p h e n y l s i n S t r i p e d Bass (Morone s a x a t i l u s ) from Two Nova Scot ia Rivers"; Water. Air , and S o i l P o l l u t i o n : Vol. 21; pp. 15-23 .
R i c k e r , W.E., 1973 . "Linear R e g r e s s i o n s i n F i s h e r y Research"; Journal of F i s h e r i e s Research Board Canada: Vol. 30; pp. 409-434.
R i c k l e f s , R .E. , 1979. Ecology; Second Edi t ion; Chiron Press .
R u b i n s t e i n , N . I . , 1989. Personal communication with N. Richardson of E.C. Jordan Co. , Portland, Maine; May 2 5 , 1989.
Schimmel, S .C. , and R.L. Garnas, 1985. "Interlaboratory Comparison of the ASTM Bioconcentration Test Method Using t h e E a s t e r n Oys ter"; In: Aquatic Toxicology and Hazard Assessment: Eighth Symposium; R.C. Bahner and D.L. Hansen ( E d s . ) ; Amer ican S o c i e t y f o r T e s t i n g and M a t e r i a l s S p e c i a l T e c h n i c a l P u b l i c a t i o n s ; p . 8 9 1 .
Shaw, G.R., and D.W. Connell , 1982. "Factors Inf luencing P o l y c h l o r i n a t e d Biphenyls in Organisms from an Estuarine Ecosystem"; Austral ian Journal of Marine and Freshwater Research: Vol. 33; pp. 1057-1070.

REFERENCES (Continued)
S p i e s , R . B . , D.W. R i c e s , J r . , P.A. Hontagna, and R.R. I r e l a n d , 1 9 8 5 . " R e p r o d u c t i v e S u c c e s s , X e n o b i o t i c Contaminants and Hepat i c Mixed-Funct ion Oxidase (MFO) A c t i v i t y i n P l a t i c h t h v s s t e l l a t u s P o p u l a t i o n s from San Francisco Bay"; Marine Environmental Research; Vol . 17; pp. 117-121.
S u t e r , 6.W. I I , A . E . R o s e n , and E. L i n d e r , 1986 . "Analysis of Extrapolat ion Error"; In: User ' s Manual for E c o l o g i c a l Risk Assessment? L.W. Barnthouse and G.W. Suter I I (Eds . ) ; Oak Ridge N a t i o n a l Laboratory (ORNL); ORNL-G251, Oak Ridge, Tennessee.
S u t e r , G.W. I I , and A.E. Rosen, 1986 . "Comparative Toxicology of Marine Fishes and Crus taceans"; N a t i o n a l O c e a n i c and A t m o s p h e r i c A d m i n i s t r a t i o n ; T e c h n i c a l Memorandum NOS OMA 30 .
Swartz, R.C. , and H. Lee I I , 1980. "Bio log ica l Processes A f f e c t i n g t h e D i s t r i b u t i o n o f P o l l u t a n t s i n Marine S e d i m e n t s . Part I : A c c u m u l a t i o n , T r o p h i c T r a n s f e r , B i o d e g r a d a t i o n , and Migra t ion"; I n : Contaminants and Sediments. Vol . I ; ed i t ed by R.A. Baker; Ann Arbor Science Publ i shers ; Ann Arbor, Michigan; pp. 553-555.
Thomann, R . V . , 1 9 7 8 . "A S i z e - d e p e n d e n t Model o f Hazardous S u b s t a n c e s i n A q u a t i c Food C h a i n s " ; U . S . Environmental P r o t e c t i o n Agency; Environmental Research Laboratory; EPA 600/3-78-036; Duluth, Minnesota.
Thomann, R.V., and J . P . Connolly, 1984. "Age-Dependent Model o f PCBs i n a Lake Michigan Food Chain"; prepared for U.S. Environmental P r o t e c t i o n Agency; Environmental Research Laboratory; Off ice of Research and Development; EPA 600/3-84-026; Duluth, Minnesota.
Thurberg, F . , 1985. " E f f e c t s of PCB Contaminat ion on E g g s and L a r v a e o f t h e Amer ican L o b s t e r , Homarus Americanus"; National Marine F i s h e r i e s S e r v i c e ; M i l f o r d , Connecticut; unpublished report .
U.S. Army Corps of Engineers, 1986. "Macrobenthic Survey for New Bedford Harbor."
U.S. Army Corps of Engineers, 1988a. "A Wetland Analyses i n a High ly Po l lu ted Harbor, New Bedford, Massachusetts , USA"; f i n a l report .

REFERENCES (Continued)
U .S . Army Corps of E n g i n e e r s , 1988b. "Wetland S t u d y Report f o r t h e New Bedford Superfund S i t e " ; prepared by IEP, I n c . ; f i n a l report .
U.S. Army Corps of Engineers, 1988c. "Hot Spot Sediment Sampling Program for New Bedford Harbor."
U .S . Environmental P r o t e c t i o n Agency, 1980a. "Water Q u a l i t y C r i t e r i a " ; F e d e r a l R e g i s t e r : V o l . 5 0 ; p p . 3 0 7 8 4 - 3 0 7 9 6 .
U .S . Environmental P r o t e c t i o n Agency, 1980b. "Ambient Water Quality Cr i t er ia for PCBs"; Off ice of Research and Development; EPA PB81-117798.
U . S . Environmental P r o t e c t i o n Agency, 1980c. "Ambient Water Quality C r i t e r i a for Lead"; Environmental C r i t e r i a and Assessment O f f i c e ; EPA 4 4 0 / 5 - 8 0 - 0 5 7 ; C i n c i n n a t i , Ohio.
U . S . E n v i r o n m e n t a l P r o t e c t i o n A g e n c y , 1 9 8 2 . "Environmental E f f e c t s Test Guidel ines"; EPA-560-82-002 ; Washington, DC.
U.S. Environmental Protect ion Agency, 1985a. "Ambient Water Q u a l i t y C r i t e r i a for Copper"; Off ice of Research and Development; EPA PB85-227023.
U.S. Environmental Protect ion Agency, 1985b. "Ambient Water Q u a l i t y Cr i t er ia for Cadmium"; Off ice of Research and Development; EPA 440/5085-031.
U .S . Environmental P r o t e c t i o n Agency, 1988 . " I n t e r i m Sediment C r i t e r i a Values for Nonpolar Hydrophobic Organic Contaminants"; Off ice of Water Regulat ions and Standards D i v i s i o n ; SCD #17; May 1988.
Von Westernhagen, H.H. Rosenthal, V. Dethle fsen , W. Ernst, U. Harms, and P.D. Hansen, 1 9 8 1 . " B i o a c c u m u l a t i n g S u b s t a n c e s and Reproduct ive Success in B a l t i c Flounder, P l a t i c h t h y s f l e s u s " ; Aquat ic T o x i c o l o g y ; V o l . 1 ; p p . 85-99.

APPENDIX A
EXPECTED EXPOSURE CONCENTRATIONS
FOR
COPPER, CADMIUM, AND LEAD

TABLE A-l EXPECTED EXPOSURE CONCENTRATIONS FOR COPPER (1)
NEW BEDFORD HARBOR ECOLOGICAL RISK ASSESSMENT
TRANSFORMED VALUES (2) HARBOR ZONE
MEAN (ug/1)
HARBOR ZONE
MEAN (ug/1) MEAN ST. DEV. VARIANCE
1, Water Column 2.218 0.346 0.067 0.004
2, Water Column 3.406 0.532 0.134 0.018
3, Water Column 3.486 0.542 0.131 0.017
4, Water Column 2.180 0.338 0.247 0.061
5, Water Column 0.710 -0.149 0.340 0.115
1. Pore Water 0.317 -0.499 0.836 0.698
2, Pore Water 0.112 -0.953 1.137 1.129
3, Pore Water 0.340 -0.468 0.818 0.670
4, Pore Water 0.191 -0.719 0.695 0.483
5, Pore Water 0.047 -1.327 0.687 0.472
Notes:
(1) Estimates derived from the program data base maintained by Battelle Ocean Sciences.
(2) Log (base 10) transformed values, with standard deviations and variances.

TABLE A-2 EXPECTED EXPOSURE CONCENTRATIONS FOR CADMIUM (1)
NEW BEDFORD HARBOR ECOLOGICAL RISK ASSESSMENT
TRANSFORMED VALUES (2) HARBOR ZONE
MEAN (ug/1)
HARBOR ZONE
MEAN (ug/1) MEAN ST. DEV. VARIANCE
1, Water Column 2.460 -0.709 0.391 0.153
2, Water Column 2.404 -0.508 0.381 0.145
3, Water Column 1.560 -0.735 0.193 0.037
4, Water Column 2.198 -0.971 0.342 0.117
5, Water Column 2.477 -1.359 0.394 0.155
I-I Pore Water 2.985 -0.694 0.475 0.226
2, Pore Water 8.810 -0.866 0.945 0.893
3, Pore Water 2.924 -0.907 0.466 0.217
4, Pore Water 3.597 -1.281 0.556 0.309
5, Pore Water 5.957 -1.963 0.775 0.601
Notes:
(1) Estimates derived from the program data base maintained by Battelle Ocean Sciences.
(2) Log (base 10) transformed values, with standard deviations and variances.

TABLE A-3 EXPECTED EXPOSURE CONCENTRATIONS FOR LEAD (1)
NEW BEDFORD HARBOR ECOLOGICAL RISK ASSESSMENT
TRANSFORMED VALUES (2) HARBOR ZONE
MEAN (ug/1)
HARBOR ZONE
MEAN (ug/1) MEAN ST. DEV. VARIANCE
1, Water Column 1.259 0.100 0.412 0.170
2, Water Column 1.183 0.073 0.088 0.008
3, Water Column 0.560 -0.251 0.482 0.233
4, Water Column 0.212 -0.673 0.520 0.270
5, Water Column 0.052 -1.280 0.957 0.916
r-i Pore Water 1.005 0.002 0.785 0.617
2, Pore Water 0.287 -0.541 1.009 1.018
3, Pore Water 0.583 -0.235 0.677 0.458
4, Pore Water 0.103 -0.988 0.577 0.333
5, Pore Water 0.245 -0.611 0.675 0.456
Notes:
(1) Estimates derived from the program data base maintained by Battelle Ocean Sciences.
(2) Log (base 10) transformed values, with standard deviations and variances.

ZONE 3
5̂
1.0
0.8
>» o § 0.6 XT <D v .
u. I °-4 '•p JO 3 E O 0.2
0.0
ZONE 1
ZONE 2
I
-2
ZONE 5
ZONE 4
ZONE 3 ± ZONE 4-
u ZONE 1 *
Log Copper Concentration, ( ug/l)
EECS BY ZONE FOR COPPER, NEW BEDFORD, M

1.0
0.8
u S 0.6 cr <u k. u_
I °'4
3 E d 0.2
0.0
ZONE 5
ZONE 4
ZONE 1
ZONE 2
ZONE 3
I
-2 0 2 Log Cadmium Concentration, ( ug/l)
EECS BY ZONE FOR CADMIUM, NEW BEDFORD, M

<£
1.0
0.8
ZONE 2
o> 0.6 3 cr 0)
I °'4
3 E O 0.2
0.0
ZONE 5 •*
*-—'ZONE 1
* - / ZONE 2
I
-2 0 2
Log Lead Concentration, ( ug/l )
EECS BY ZONE FOR LEAD, NEW BEDFORD, M

35
1.0
0.8
o c «, ~ $ 0.6 o~ Q) v.
u. > 0.4 (0 3 E O 0.2
0.0 -4
ZONE 5 *
ZONE 2
ZONE 1
ZONE 3
-2 0 2 Log Copper Concentration, ( ug/l)
EECs BY ZONE FOR COPPE NEW BEDFORD, M

<£
>» o c <D 3 KT 0)
<D > CO 3 E o
1.0
0.8 -
0.6 -
0.4
0.2
0.0
ZONE 3 ZONE 1
I
-2 0 2 Log Cadmium Concentration, ( ug/l)
EECS BY ZONE FOR CADMI NEW BEDFORD, M
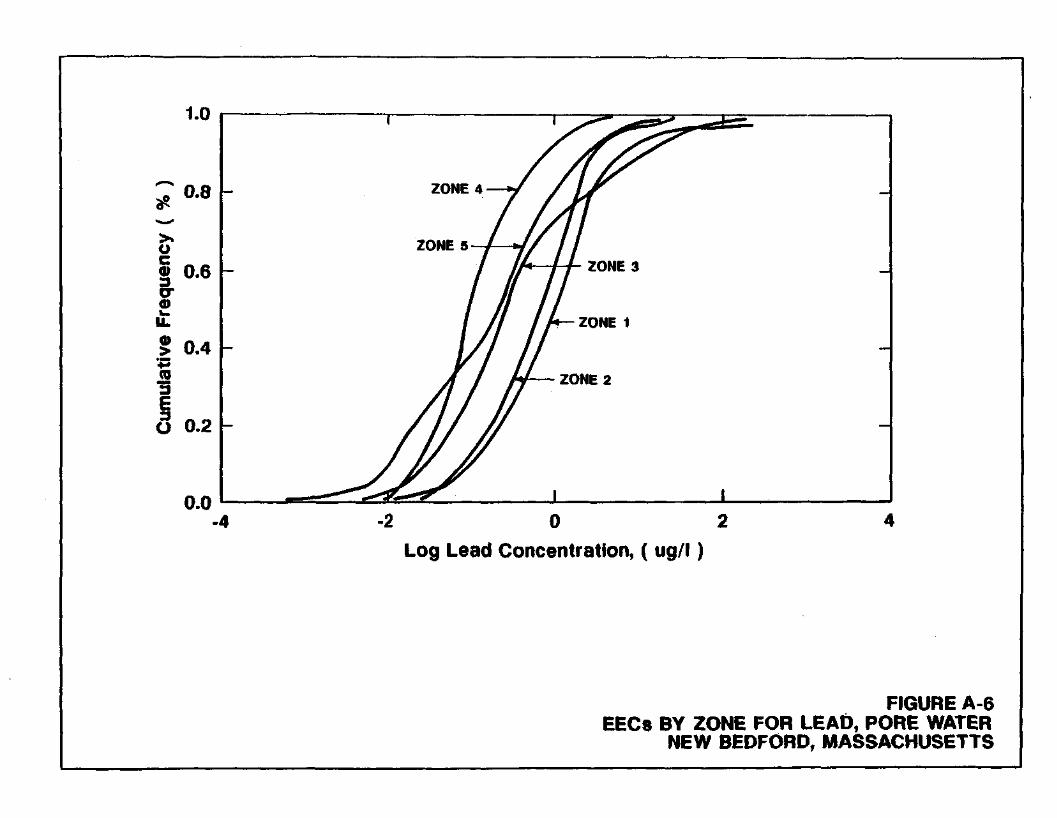
<£
1.0
0.8 -
5 0.6
I °'4
CO "5 E O 0.2
0.0
I
7 H M F A
I ^ ^ " " ^ ^ - ^
ZONE 5-f — * 1 /
— lr*~ -+4- ZONE 3
h— ZONE 1
7f"fcMe o £ U N t Z
I I -4 -2 0 2
Log Lead Concentration, ( ug/l)
EECs BY ZONE FOR LE NEW BEDFORD,

APPENDIX B
TOXICITY DATA
FOR
PCBs, COPPER, CADMIUM, AND LEAD

TABLE B-1 PCB ACUTE TOXICITY DATA FOR MARINE ORGANISMS
NEW BEDFORD HARBOR ECOLOGICAL RISK ASSESSMENT
LC50
SPECIES CHEMICAL or EC50 (ug/l) REFERENCE
HABITAT GROUP
Brown shrimp Penaeus aztecus
Aroclor 1016 10.5 Hansen et al., 1974a Demersal
Grass shrimp Palaemonetes pugio
Aroclor 1016 12.5 Hansen et aI., 1974a Demersal
Grass shrimp Palaemonetes pugio
Aroclor 1254 6.1 to 7.8 Ernst, 1984 Demersal
Pink shrimp Penaeus duorarum
Aroclor 1248 32 Lowe, undated Oemersal
Pink shrimp Penaeus duorarum
Aroclor 1254 1 Nimno & Bahner, 1976 Demersal
Pink shrimp Penaeus duorarum
Aroclor 1254 32 Lowe, undated Demersal
Shrimp, Crangon septemspinosa
Aroclor 1242 13 McLeese & Metcalf, 1980 Demersal
Shrimp, Crangon septemspinosa
Aroclor 1254 12 McLeese & Metcalf, 1980 Demersal
Sheepshead minnow (embyros and fry) Cyprinodon variegatus
Aroclor 1254 0.93 Schitimet et al., 1974 Demersal
Sheepshead minnow (fry) Cyprinodon variegatus
Aroclor 1254 0.1 to 0.32 Ernst, 1984 Demersal
Eastern oyster Crassostrea virginica
Aroclor 1016 10.2 Hansen et a I., 1974a Benthic
Eastern oyster Crassostrea virginica
Aroclor 1248 17 Lowe, undated Benthic
Eastern oyster Crassostrea virginica
Aroclor 1260 60 Lowe, undated Benthic
Eastern oyster Crassostrea virginica
Aroclor 1254 14 Lowe, undated Benthic
Pinfish Lagodon rhomboides
Aroclor 1254 0.5 Ernst, 1984 Demersal

TABLE B"1 PCB ACUTE TOXICITY DATA FOR MARINE ORGANISMS
(continued)
NEW BEDFORD HARBOR ECOLOGICAL RISK ASSESSMENT
Spot Lejostomus xanthurus
Aroclor 1254 0.5
Cladoceran, Aroclor 1254 1.8 Daphnia magna
Cladoceran, Daphnia magna
Aroclor 1254 1.3
Cladoceran, Daphnia magna
Aroclor 1254 24
Cladoceran, Daphnia magna
Aroclor 1248 2.6
Cladoceran, Daphnia magna
Aroclor 1221 180
Cladoceran, Daphnia magna
Aroclor 1232 72
Cladoceran, Daphnia magna
Aroclor 1242 67
Cladoceran, Daphnia magna
Aroclor 1260 36
Ernst, 1984
Nebeker & Puglisi, 1974
Nebeker & Puglisi, 1974
Maki & Johnson, 1975
Nebeker & Puglisi, 1974
Nebeker & Puglisi, 1974
Nebeker & Puglisi, 1974
Nebeker & Puglisi, 1974
Nebeker & Puglisi, 1974
Demersal
Nekton/Plankton
Nekton/Plankton
Nekton/Plankton
Nekton/Plankton
Nekton/Plankton
Nekton/Plankton
Nekton/Plankton
Nekton/Plankton
Table taken from USEPA, 1980, and Eisler, 1985.
Toxicity data for the cladoceran, Daphnia magna, are included because these values were used during the extrapolation process.

TABLE B-2 OTHER DATA ON EFFECTS OF PCBs ON MARINE ORGANISMS
NEW BEDFORD HARBOR ECOLOGICAL RISK ASSESSMENT
SPECIES CHEMICAL DURATION EFFECT RESULT (ug/l) REFERENCE
100 Harding & Phillips, 1978
10 Harding & Phillips, 1978
1 Harding & Phillips, 1978
10 Mosser et aI.,1972a
0.1 Fisher & Wurster, 1973
25 to 100 Mosser et aI.,1972b
100 Harding & Phillips, 1978
10 Harding & Phillips, 1978
100 Kell et al., 1971
1 Mosser et aI.,1972a
1 Harding & Phillips, 1978
100 Laird, 1973
6.5 Moore & Hariss, 1972
15 Moore & Hariss, 1972
10 Fisher et al., 1973
Chlorophyceae Dunallella tertiolecta
Chrysophyceae Monochrysis lutheri
Diatom Thalassiosira pseudonana
Diatom Skeletonema costatun
Diatom Rhizosolenia setiger
Diatom Thalassiosira pseudonana
Diatom Nitzschia lonsissima
Diatom Skeletoma costatun
Diatom Cylindortheca closterium
Diatom, Thalassiosira pseudonana and green alga
Haptophyceae Isoch rys i sgaIbana
Natural phytoplankton communi ty
Phytoplankton populations
Phytoplankton populations
Diatoms Thalassiosira pseudonana and Sketetomema costatun
Aroclor 1254 - Increased cell division
Aroclor 1254 - Reduced cell division
Aroclor 1254 - Reduced cell division
Aroclor 1254 - Reduced growth
Aroclor 1254 48 hours No growth in 48
Aroclor 1254 Reduced growth
Aroclor 1254 - No effect on cell
Aroclor 1254 - Reduced cell division
Aroclor 1254 - Reduced growth
Aroclor 1254 - Species ratio change
Aroclor 1254 - Reduced cell division
Aroclor 1254 - Decreased diversity,
Aroclor 1254 - Toxicity in 24 hours
Aroclor 1254 - Toxicity in 24 hours
Aroclor 1254 - Reduced growth and carbon

TABLE B-2 OTHER DATA ON EFFECTS OF PCBs ON MARINE ORGANISMS
(continued)
NEW BEDFORD HARBOR ECOLOGICAL RISK ASSESSMENT
Diatom, Thalassiosira pseudonana and green alga Dunallella tertiolecta
Diatom Chaetoceros social is
Eastern Oyster Crassostrea virginica
Amphipod, Gammarus oceanicus
Grass shrimp, Pa Iaemonetes pugio
Grass shrimp, PaIaemonetes pugio
Grass shrimp, PaIaemonetes pugio
Pink shrimp, Penaeus deorarum
Pink shrimp, Penaeus deorarum
Pink shrimp, Penaeus deorarum
Pink shrimp, Penaeus deorarum
Ciliate protozoans, Tetrahymena pyriformis
Ciliate protozoans, Tetrahymena pyriformis
Ciliate protozoans, Tetrahymena pyriformis
Fiddler crab, Uca pugilator
Fiddler crab, Uca pugilator
Communities of organisms
Aroclor 1254
Aroclor 1254
Aroclor 1254
Aroclor 1254
Aroclor 1254
Aroclor 1254
Aroclor 1254
Aroclor 1248
Aroclor 1254
Ardor 1254
Aroclor 1254
Aroclor 1248
Aroclor 1254
Aroclor 1260
Aroclor 1254
Aroclor 1242
Aroclor 1254
Species ratio change
Reduced cell divsion 10
24 weeks Reduced growth 5
30 days Mortality >= 10
1 hour Avoidance 10
4 days Water efflux affected 25 to 45 and altered metabolic state
96 hours LC50 6.1 to 7.8
48 hours LC50 32
48 hours LC50 32
48 hours 51X Mortality 0.94
48 hours LC50 1
96 hours Reduced growth 1000
96 hours Reduced growth 1
96 hours Reduced growth 1000
38 days Inhibited molting 8
4 days Greater dispersion 2000 of melanin
4 months Affected composition 0.6
0.1 Fisher et al., 1974
Harding & Phillips, 1
Lowe et al., 1972
Wildish, 1970
Hansen et al., 1974b
Roesljadl et al.,1976
Ernst, 1984
Lowe, undated
Lowe, undated
Nimmo et al., 1971
Nimmo & Bahner, 1976
Cooley et al., 1973
Cooley et al., 1973
Cooley et al., 1973
Fingerman & Fingerman
Fingerman & Fingerman
Hansen, 1974

TABLE B-2 OTHER DATA ON EFFECTS OF PCBs ON MARINE ORGANISMS
(continued)
NEW BEDFORD HARBOR ECOLOGICAL RISK ASSESSMENT
Spot, Leiostonus xanthurus
Spot, Leiostomus xanthurus
Spot, Leiostomus xanthurus
Pinfish, Lagodon rhomboides
Pinfish, Lagodon rhomboides
Pinfish, Lagodon rhomboides
Pinfish, Lagodon rhomboides
Sheepshead minnow (adult) Cyprinodon variegatus
Aroclor 1254
Aroclor 1254
Aroclor 1254
Aroclor 1254
Aroclor 1254
Aroclor 1254
Aroclor 1016
Aroclor 1254
Sheepshead minnow (juvenile) Aroclor 1254 Cyprinodon variegatus
Sheepshead minnow (embryos and fry) Cyprinodon variegatus
Sheepshead minnow (fry) Cyprinodon variegatus
Sheepshead minnow Cyprinodon variegatus
Sheepshead minnow Cyprinodon variegatus
Sheepshead minnow Cyprinodon variegatus
Atlantic cod, Sadus morhua
Aroclor 1254
Aroclor 1254
Aroclor 1254
Aroclor 1016
Aroclor 1254
Aroclor 1254
Liver pathogenesis
20 to 45 days51 to 62% mortality
96 hours LC50
1 hour Avoidance
96 hours LC50
14 to 35 days41 to 66% mortality
42 days 50% mortality
28 days Lethaargy, reduced feeding, fin rot, mortality
21 days Mortality
21 days LC50
21 days LC50
28 days Significantly affected hatching of embryos or the survival of fry
Chronic value
Chronic value
Impaired bone development and abnormalities in
5 Nimmo et al., 1975
5 Hansen et al., 1971
0.5 Ernst, 1984
10 Hansen et al., 1974b
0.5 Ernst, 1984
5 Hansen et al., 1971
21 Hansen et al., 1974a
10 Hansen et al., 1973
10 Schimmel et al., 1974
0.93 Schimmel et al., 1974
0.1 to 0.32 Ernst, 1984
0.14 Hansen et al., 1973
3.4 to 15.0 Hansen et al.f 1975
0.06 to 0.16 Hansen et aI., 1974
0.4 Sangalang et al., 1981
Table taken from USEPA, 1980.

TABLE B-3 BIOCONCENTRATION DATA FOR PCBs - MARINE ORGANISMS
NEW BEDFORD HARBOR ECOLOGICAL RISK ASSESSMENT
SPECIES TISSUE LIPID CHEMICAL X
BIOCONCENTRATION DURATION FACTOR (days)
REFERENCE
Diatom, Cylindrotheca closterium
Polychaete, Nereis diversicolor
Eastern oyster, Crassostrea virginica
Eastern oyster, Crassostrea virginica
Eastern oyster, Crassostrea virginica
Grass shrimp, Palaemonetes pugio
Blue crab, Ca11inectes sapi dus
Spot, Leiostomus xanthurum
Sheepshead minnow (adult) Cyprinodon variegatus
Sheepshead minnow (juvenile) Cyprinodon variegatus
Sheepshead minnow (fry) Cyprinodon variegatus
Sheepshead minnow (adult) Cyprinodon variegatus
Pinfish, Lagodon rhomboides
Speckled trout, Cynoscion nebulosus
Fishes
Invertebrates
Whole organism
Aroclor 1242 1,000 14
Whole body Pnenochlor DP-5
800 14
Edible portion Aroclor 1016 13,000 84
Edible portion Aroclor 1254 101,000 245
Edible portion Aroclor 1254 >100,000 Field data
Whole body Aroclor 1254 27,000 16
Whole body Aroclor 1254 >230,000 Field data
Whole body 1.1 Aroclor 1254 37,000 28
Whole body 3.6 Aroclor 1016 25,000 28
Whole body Aroclor 1016 43,100 28
Whole body Aroclor 1016 14,400 28
Uhole body 3.6 Aroclor 1254 30,000 28
Whole body Aroclor 1016 17,000 21-28
Uhole body Aroclor 1254 >670,000 Field data
Uhole body Aroclor 1254 >133,000 Field data
Whole body Aroclor 1254 >27,000 Field data
Kell et al., 1971
Fowler, et al., 1978
Parrish et al., 1974
Lowe et al., 1972
Duke et aI., 1979; Nimmo et al., 1975
Nimmo et al., 1974
Nimmo et al., 1975
Hansen et al., 1971
Hansen et al., 1975
Hansen et al., 1975
Hansen et al., 1975
Hansen et al., 1973
Hansen et aI., 1974a
Duke et al., 1970; Nimmo et al., 1975
Nimmo et al., 1975
Nimmo et al., 1975
Table taken from USEPA, 1980.

TABLE B-4 COPPER ACUTE TOXICITY DATA FOR MARINE ORGANISMS
NEW BEDFORD HARBOR ECOLOGICAL RISK ASSESSMENT
SPECIES METHOD CHEMICAL
LC50 SPECIES MEAN or EC50 ACUTE VALUE (ug/l) (ug/l) REFERENCE
Polychaete worm, Phyllodoce maculata
Polychaete worm, Neanthes arenaceodentata
Polychaete worm, Neanthes arenaceodentata
Polychaete worm, Neanthes arenaceodentata
Polychaete worm, Nereis diversicolor
Polychaete worm, Nereis diversicolor
Polychaete worm, Nereis diversicolor
Polychaete worm, Nereis diversicolor
Blue mussel (embryo) Mytilus edulis
Pacific oyster (embryo), Crassostrea gigas
Pacific oyster (embryo), Crassostrea gigas
Pacific oyster (adult), Crassostrea gigas
Eastern oyster (embryo), Crassostrea virginica
Eastern oyster (embryo), Crassostrea virginica
Eastern oyster (embryo), Crassostrea virginica
Eastern oyster (embryo), Crassostrea virginica
S, U Copper sulfate
FT, M Copper nitrate
FT, M Copper nitrate
FT, M Copper nitrate
S, U Copper sulfate
S, U Copper sulfate
S, U Copper sulfate
S, U Copper sulfate
S, U Copper sulfate
S, U Copper sulfate
S, U Copper sulfate
FT, M Copper sulfate
S, U Copper chloride
S, U Copper chloride
S, U Copper chloride
S, U Copper chloride
120.00
77.00
200.00
222.00 150.60
200.00
445.00
480.00
410.00 363.80
5.80
5.30
11.50
560.00
128.00
15.10
18.70
18.30
5.80
7.80
HABITAT GROUP
120.00 McLusky & Phillips, 1975 Benthic
Pesch & Morgan, 1978 Benthic
Pesch & Morgan, 1978 Benthic
Pesch & Hoffman, 1982 Benthic
Jones et al., 1976 Benthic
Jones et al., 1976 Benthic
Jones et al., 1976 Benthic
Jones et aI., 1976 Benthic
Martin et al., 1981 Benthic
Martin et al., 1981 Benthic
Cogilanese & Martin, 1981 Benthic
Okazaki, 1976 Benthic
Calabrese et al., 1973 Benthic
Macinnes & Calabrese, 1978 Benthic
Macinnes & Calabrese, 1978 Benthic
28.52 Macinnes & Calabrese, 1978 Benthic

TABLE B-4 COPPER ACUTE TOXICITY DATA FOR MARINE ORGANISMS
(continued)
NEW BEDFORD HARBOR ECOLOGICAL RISK ASSESSMENT
Wedge clam, Rangia cuneata
Wedge clam, Rangia cuneata
Soft-shelled clam, Mya arenaria
Copepod, Pseudodiaptomus coronatus
Copepod, Eurytemora affinis
Copepod, Acartia clausi
Copepod, Acartia tonsa
Copepod, Acartia tonsa
Copepod, Acartia tonsa
Mysid, Mysidopsis bahia
Mysid, Mysidopsis bigelowi
American lobster (larva), Homarus americanus
American lobster (adult), Homarus americanus
Dungeness crab (larva), Cancer magister
Green crab (larva), Carcinus maenas
Sheepshead minnow, Cyprinondon variegatus
Atlantic silverside (larva), Menidia menidia
S, U - 8000.00 - Olson & Harrel, 1973 Benthic
S, U - 7400.00 7694.00 Olson & Harrel, 1973 Benthic
s, u Copper chloride 39.00 39.00 Eisler, 1977 Benthic
S. U Copper chloride 138.00 138.00 Gentile, 1982 Nekton/Pla
S, U Copper chloride 526.00 526.00 Gentile, 1982 Nekton/Pl
s, u Copper chloride 52.00 52.00 Gentile, 1982 Nekton/Pl
s, u Copper chloride 17.00 - Sosnowski & Gentile, 1978 Nekton/Pla
s, u Copper chloride 55.00 • - Sosnowski & Gentile, 1978 Nekton/Pla
s, u Copper chloride 31.00 30.72 Sosnowski & Gentile, 1978 Nekton/Pla
FT, M Copper nitrate 181.00 181.00 Lussler et al., Manuscript
Demersal
FT, M Copper nitrate 141.00 141.00 Gentile, 1982 Demersal
s, u Copper sulfate 48.00 - Johnson & Gentile, 1979 Demersal
s, u Copper sulfate 100.00 69.28 McLeese, 1974 Demersal
s, u Copper sulfate 49.00 49.00 Martin, et al., 1981 Demersal
s, u Copper nitrate 600.00 600.00 Conner, 1972 Demersal
s, u Copper nitrate 280.00 280.00 Hansen, 1983 Demersal
FT; M Copper nitrate 66.60 - Cardin, 1982 Demersal
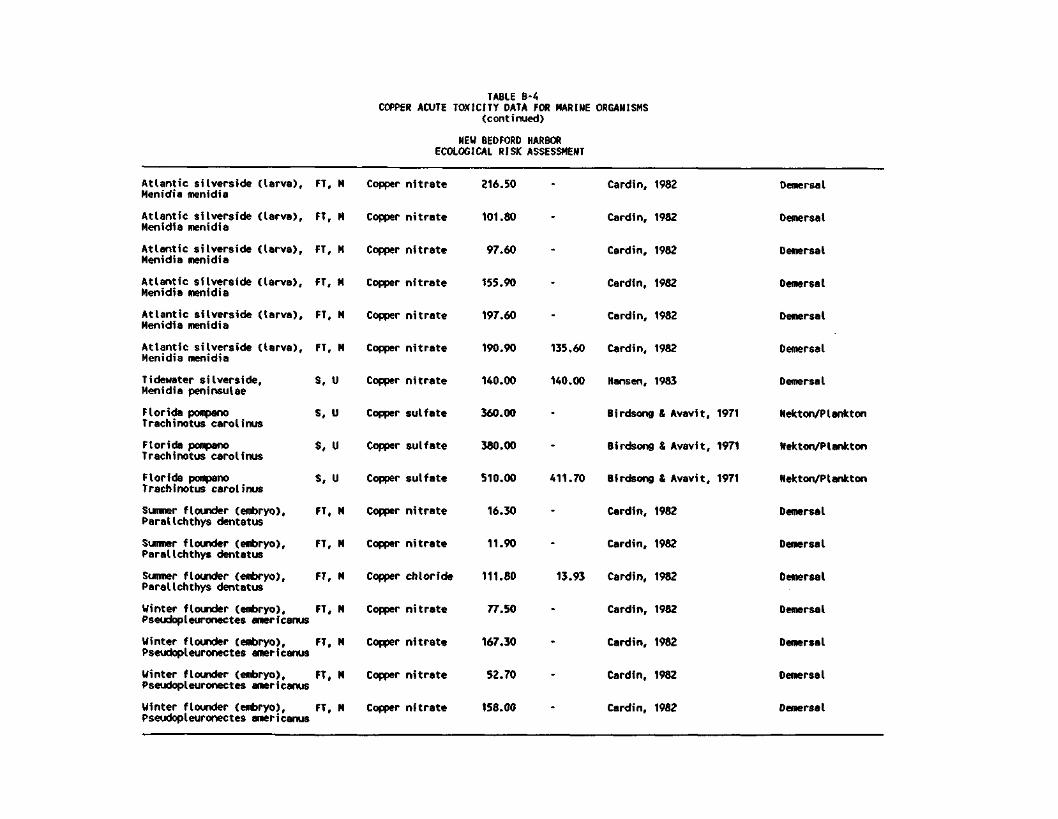
TABLE B-4 COPPER ACUTE TOXICITY DATA FOR MARINE ORGANISMS
(continued)
NEU BEDFORD HARBOR ECOLOGICAL RISK ASSESSMENT
Atlantic silverside (larva), Menidia menidia
Atlantic silverside (larva), Menidia menidia
Atlantic silverside (larva), Menidia menidia
Atlantic silverside (larva), Menidia menidia
Atlantic silverside (larva), Menidia menidia
Atlantic silverside (larva), Menidia menidia
Tidewater silverside, Menidia peninsulae
Florida pompano Trachinotus carolinus
Florida pompano Trachinotus carolinus
Florida pompano Trachinotus carolinus
Summer flounder (embryo), Parallchthys dentatus
Summer flounder (embryo), Parallchthys dentatus
Sumner flounder (embryo), Parallchthys dentatus
Winter flounder (embryo), Pseudopleuronectes americanus
Winter flounder (embryo), Pseudopleuronectes americanus
Winter flounder (embryo), Pseudopleuronectes americanus
Winter flounder (embryo), Pseudopleuronectes americanus
FT, M Copper nitrate 216.50 - Cardin, 1982 Demersa
FT, M Copper nitrate 101.80 - Cardin, 1982 Demersa
FT, M Copper nitrate 97.60 - Cardin, 1982 Demersa
FT, M Copper nitrate 155.90 - Cardin, 1982 Demersa
FT, M Copper nitrate 197.60 - Cardin, 1982 Demersa
FT, M Copper nitrate 190.90 135 .60 Cardin, 1982 Demersa
S, U Copper nitrate 140.00 140 .00 Hansen, 1983 Demersa
s. u Copper sulfate 360.00 - Birdsong & Avavit, 1971 Nekton/
S, U Copper sulfate 380.00 - Birdsong & Avavit, 1971 Nekton/
S, U Copper sulfate 510.00 411 .70 Birdsong & Avavit, 1971 Nekton/
FT. M Copper nitrate 16.30 - Cardin, 1982 Demersa
FT, M Copper nitrate 11.90 - Cardin, 1982 Demersa
FT, M Copper chloride 111.80 13.93 Cardin, 1982 Demersa
FT, M Copper nitrate 77.50 - Cardin, 1982 Demersa
FT, M Copper nitrate 167.30 - Cardin, 1982 Demersa
FT, M Copper nitrate 52.70 - Cardin, 1982 Demersa
FT, M Copper nitrate 158.00 - Cardin, 1982 Demersa
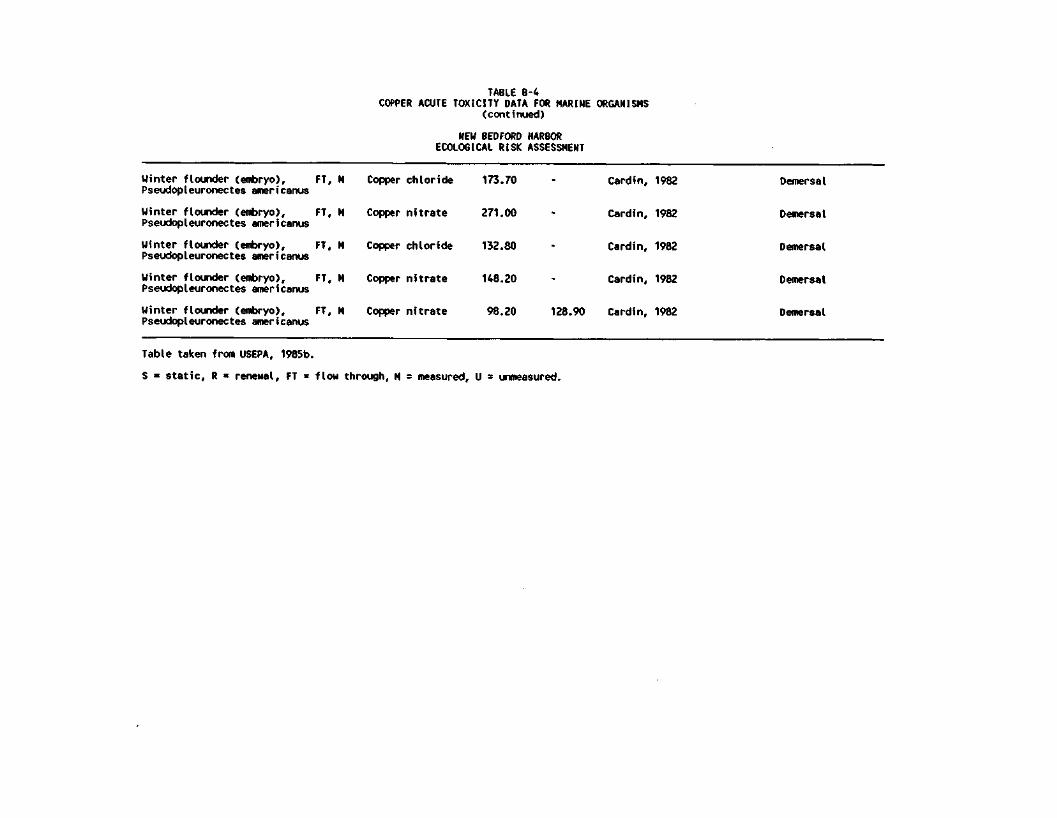
TABLE B-4 COPPER ACUTE TOXICITY DATA FOR MARINE ORGANISMS
(continued)
NEW BEDFORD HARBOR ECOLOGICAL RISK ASSESSMENT
Winter flounder (embryo), FT, M Pseudopleuronectes americanus
Winter flounder (embryo), FT, M Pseudopleuronectes americanus
Winter flounder (embryo), FT, M Pseudopleuronectes americanus
Winter flounder (embryo), FT, M Pseudopleuronectes americanus
Winter flounder (embryo), FT, M Pseudopleuronectes americanus
Copper chloride 173.70 • Cardin, 1982
Copper nitrate 271.00 - Cardin, 1982
Copper chloride 132.80 - Cardin, 1982
Copper nitrate 148.20 - Cardin, 1982
Copper nitrate 98.20 128.90 Cardin, 1982
Demersa
Demersa
Demersa
Demersa
Demersa
Table taken from USEPA, 1985b.
S = static, R = renewal, FT = flow through, M = measured, U = unmeasured.

TABLE B~5 OTHER DATA ON EFFECTS OF COPPER ON MARINE ORGANISMS
NEW BEDFORD HARBOR ECOLOGICAL RISK ASSESSMENT
SPECIES CHEMICAL DURATION EFFECT RESULT (ug/D REFERENCE
Alga, Amphidinium carteri
Copper 14 Days EC50 Growth rate
<50
Diatom, Skeletonema costatum
Copper 14 day EC50
Growth rate 5.00
Diatom, Thatasstosira aestevallis
Copper - Reduced chlorophyll a 19.00
Diatom, Thatasstosira aestevallis
Copper 3 day EC50
Growth rate 5.00
Diatom, Asterionella japonica
Copper 3 day EC50
Growth rate 12.70
Alga, Olisthodiscus luteus
Copper 14 days EC50 Growth rate
<50
Alga, Nitschia closterium
Copper 4 days EC50 Growth rate
33.00
Alga, Scrippsiella faeroense
Copper 5 days EC50 Growth rate
5.00
Alga, Prorocentrun micans
Copper 5 days EC50 Growth rate
10.00
Alga, Gymnodinium splendons
Copper 5 days EC50 Growth rate
20.00
Red alga, Champia parvula
Copper - Reduced growth
I tetrasporophyte 4.60
Red alga, Champia parvula
Copper - Reduced product
I tetrasporangia :ion
13.30
Red alga, Champia parvula
Copper - Reduced female growth
4.70
Red alga, Champia parvula
Copper - Stopped sexual reproduction
7.30
Natural phytoplankton population
Copper 5 days Reduced chlorophyll a 19.00
Natural phytoplankton population
Copper 4 days Reduced biomass 6.40
Erickson et al., 19
Erickson et al., 19
HoUibaugh et at.,
Erickson, 1972
Fisher & Jones, 198
Erickson et al., 197
Rosko & Rachlin, 197
Salfullah, 1978
Salfullah, 1978
Salfullah, 1978
Steele & Thursby, 19
Steele & Thursby, 19
Steele & Thursby, 19
Steele & Thursby, 19
HoUibaugh et al.,
HoUibaugh et al.,

TABLE B-5 OTHER DATA ON EFFECTS OF COPPER ON MARINE ORGANISMS
(continued)
NEW BEDFORD HARBOR ECOLOGICAL RISK ASSESSMENT
Hydroid, Campanularia flexuosa
Copper 11 days Growth inhibit
rate ion
10-13 Stebbing, 1976
Hydroid, Campanularia flexuosa
Copper - Enzyme inhibition 1.43 Moore & Stebbing, 19
Hydromedusa, Phalaltdium spp.
Copper 1 day LC50 36.00 Reeve et aI., 1976
Ctenophore, Pleurobrachia pileus
Copper 1 day LC50 33.00 Reeve et al., 1976
Ctenophore, Mnemiopsis mccrdayl
Copper 1 day LC50 17-29 Reeve et aI., 1976
Rotifer, Brachionus plicatillis
Copper 1 day LC50 100.00 Reeve et al., 1976
Polychaete worm, Phyllodoce maculata
Copper 9 days LC50 80.00 McLusky & Phillips,
Polychaete worm, Neanthes arenaceodentata
Copper 28 days LC50 44.00 Pesch & Morgan, 1978
Polychaete worm, Neanthes arenaceodentata
Copper 28 days LC50 100.00 Pesch & Morgan, 1978
Polychaete worm, Neanthes arenaceodentata
Copper 7 days LC50 137.00 Pesch & Morgan, 1982
Polychaete worm, Neanthes arenaceodentata
Copper 10 days LC50 98.00 Pesch & Morgan, 1982
Polychaete worm, Neanthes arenaceodentata
Copper 28 days LC50 56.00 Pesch & Morgan, 1982
Polychaete worm, Cirriformia spirabranchia
Copper 26 days LC50 40.00 Milanovich et at., 1
Larval annelids, Mixed species
Copper 1 day LC50 89.00 Reeve et al., 1976
Channeled whelk, Busycon canal Iiculaturn
Copper 77 days LC50 470.00 Betzer & Yevich, 197
Mud snail, Nassarius obsoletus
Copper 3 days Decrease in oxygen consumption
100.00 Macinnes ft Thurberg,
Blue mussel, Mytilus edulis
Copper 7 days LC50 200.00 Scott & Major, 1972

TABLE B*5 OTHER DATA ON EFFECTS OF COPPER ON MARINE ORGANISMS
(continued)
NEW BEDFORD HARBOR ECOLOGICAL RISK ASSESSMENT
Bay scallop, Argopecton irradians
Copper 42 days EC50 (growth) 5.80
Bay scallop, Argopecton irradians
Copper 119 days 100% mortality 5.00
Eastern oyster, Crassostrea virginica
Copper 12 days LC50 46.00
Wedge clam, Rangia cuneata
Copper 4 days LC50 (<1 g/kg salinity)
210.00
Clam, Macoma inquinata
Copper 30 days LC50 15.70
Clam, Macoma inquinata
Copper 30 days LC50 20.70
Quahog clam (larva), Mercenaria mercenaria
Copper 8-10 days LC50 30.00
Quahog clam (larva), Mercenaria mercenaria
Copper 77 days LC50 25.00
Common Pacific littleneck, Protothaca staminea
Copper 17 days LC50 39.00
Soft-shelled clam, Mya arenaria
Copper 7 days LC50 35.00
Copepod, Undinula vulgaris
Copper 1 day LC50 192.00
Copepod, Euchaeta marina
Copper 1 day LC50 188.00
Copepod, Metridia pacifica
Copper 1 day LC50 176.00
Copepod, Labidocera scotti
Copper 1 day LC50 132.00
Copepod, Acartia clausi
Copper 2 days LC50 34-82
Copepod, Acartia tonsa
Copper 6 days LC50 9-73
Pesch et al., 1979
Zaroogian & Johnson, 19
Calabrese et al., 1977
Olson & Harrel, 1973
Crecellus et al., 1982
Crecellus et al., 1982
Calabrese et al., 1977
Shuster & Pringle, 1968
Roesijadi, 1980
Eisler, 1977
Reeve et al., 1976
Reeve et al., 1976
Reeve et al., 1976
Reeve et aI., 1976
Moraltou-Apostolopoulou
Sosnouski et al., 1979
Table taken from USEPA, 1985b.

TABLE B-6 CADMIUM ACUTE TOXICITY DATA FOR MARINE ORGANISMS
NEW BEDFORD HARBOR ECOLOGICAL RISK ASSESSMENT
SPECIES METHOD CHEMICAL
LC50 or EC50 (ug/l)
SPECIES MEAN ACUTE VALUE
(ug/l) REFERENCE HAB GRO
Polychaete worm (adult), Neanthes arenaceodentata
S, U Cadmium chloride 12000 - Relsh, et al., 1976 Ben
Polychaete worm (juvenile), Neanthes arenaceodentata
S, U Cadmium chloride 12500 12250 Relsh, et al., 1976 Ben
Sand Worm Nereis virens
S. U Cadmium chloride 9300 - Eisler & Hemekey, 1977 Ben
Polychaete worm Nereis virens
S, U Cadmium chloride 11000 10110 Eisler, 1971 Ben
Polychaete worm (adult) Capitella capitella
S, U Cadmium chloride 7500 - Relsh, et al., 1976 Ben
Polychaete worm (larvae) Capitella capitella
S, U Cadmium chloride 200 200 Relsh, et al., 1976 Ben
Oligochaete worm Limnodriloides verrucosus
R, U Cadmium sulfate 10000 10000 Chapman, et al., 1982a Ben
Oligochaete worm Monophylephorus cuticalatus
R,U Cadmium sulfate 135000 135000 Chapman, et al., 1982a Ben
Oligochaete worm Tubificoides gabriellae
R. U Cadmium sulfate 24000 24000 Chapman, et at., 1982a Ben
Oyster drill Urosalpinx cinerea
S, U Cadmium chloride 6600 6600 Eisler, 1971 Ben
Mud snail Nassarius oboletus
S. U Cadmium chloride 35000 - Eisler & Hemekey, 1977 Ben
Mud snail Nassarius oboletus
S, U Cadmium chloride 10500 19170 Eisler, 1971 Ben
Blue mussel Mytilus edulis
S, U Cadmium chloride 25000 - Eisler, 1971 Ben
Blue mussel (embryo), Mytilus edulis
S, U Cadmium chloride 1200 - Martin, et al., 1981 Ben
Blue mussel Mytilus edulis
S, M Cadmium chloride 1620 - Ahsanullah, 1976 Ben
Blue mussel S, M Cadmium chloride 3600 - Ahsanullah, 1976 Ben Mytilus edulis

TABLE B-6 CADMIUM ACUTE TOXICITY DATA FOR MARINE ORGANISMS
(continued)
NEW BEDFORD HARBOR ECOLOGICAL RISK ASSESSMENT
Blue mussel MytiIus edulis
Bay Scallop (juvenile) Argopecten irradiens
Pacific Oyster Crassostrea glgas
Pacific Oyster Crassostrea glgas
Atlantic Oyster Crassostrea virginica
Soft-shell clam Mya arenaria
Soft-shell clam Mya arenaria
Soft-shell clam, Mya arenaria
Copepod, Pseudolaptomus coronatus
Copepod, Eurytemora affinis
Copepod (naupilus), Eurytemora affinis
Copepod, Acartia clausi
Copepod, Acarti tonsa
Copepod, Acarti tonsa
Copepod, Acarti tonsa
Copepod, Acarti tonsa
Copepod, Nitocra spinipes
FT, M Cadmium chloride
FT, M Cadmium chloride
S, U Cadmium chloride
S, U Cadmium chloride
S, U Cadmium chloride
S, U Cadmium chloride
S, U Cadmium chloride
S, U Cadmium chloride
S, U Cadmium chloride
S, U Cadmium chloride
S, U Cadmium chloride
S, U Cadmium chloride
S, U Cadmium chloride
S, U Cadmium chloride
S, U Cadmium chloride
S, U Cadmium chloride
S, U Cadmium chloride
4300 3934
1480 1480
611 -
85 227.9
3800 3800
2500 -
2200 -
850 1672
1708 1708
1080 -
I47.7 399.4
144 144
90 -
122 -
220 -
337 168.9
1800 1800
Ahsanullah, 1976
Nelson, et at., 1976
Martin, et al., 1981
Wat ling, 1982
Calabrese, et al., 1973
Eisler & Hennekey, 1977
Eisler, 1971
Eisler, 1977
Gentile, 1982
Gentile, 1982
Sullivan et al., 1983
Gentile, 1982
Sosnowski & Gentile, 1978
Sosnowski & Gentile, 1978
Sosnowski & Gentile, 1978
Sosnowski & Gentile, 1978
Bengtsson, 1978
Benthi
Benthi
Benthi
Benthi
Benthi
Benthi
Benthi
Benthi
Nekton
Nekton
Nekton
Nekton
Nekton
Nekton
Nekton
Nekton
Nekton

TABLE B-6 CADMIUM ACUTE TOXICITY DATA FOR MARINE ORGANISMS
(continued)
NEW BEDFORD HARBOR ECOLOGICAL RISK ASSESSMENT
Mysid, Mysidopsis bahia
FT, M
Mysid, Mysidopsis bahia
FT, M
Mysid, Mysidopsis bigelowi
FT. M
Amphipod (adult), Ampeilsca abdita
s, M
Amphipod (young), Marinogammarus obtusatus
s, M
Amphipod (adult), Marinogammarus obtusatus
s, M
Pink Shrimp Penaeus duorarum
FT, M
Grass shrimp, Palaemonetes vulgaris
s. U
Grass shrimp, Palaemonetes vulgaris
FT, M
Sand shrimp, Crangon septemspinosa
s, U
American lobster (larvae), Homarus americanus
s, U
Hermit crab, Pagurus Iongicarpus
s. U
Hermit crab, Pagurus longicarpus
s, U
Rock crab (zoea), Cancer irroratus
FT, M
Dungeness crab (zoea), Cancer magister
s, U
Blue crab (juvenile), Callinectes sapidus
s. U
Blue crab (juvenile), s, U Callinectes sapidus
Cadmium chloride
Cadmium chloride
Cadmium chloride
Cadmium chloride
Cadmium chloride
Cadmium chloride
Cadmium chloride
Cadmium chloride
Cadmium chloride
Cadmium chloride
Cadmium chloride
Cadmium chloride
Cadmium chloride
Cadmium chloride
Cadmium chloride
Cadmium chloride
Cadmium chloride
15.5 " Nimmo, et at., 1977a
110
110
41.29
110
Gentile, et al., 1982 Lussler, et al., Manuscript Gentile, et al., 1982
2900 2900 Scott, et al., Manuscript
3500 - Wright & Frain, 1981
13000 3500 Wright & Frain, 1981
3500 3500 Nimmo, et at., 1977b
420 - Eisler, 1971
760 760 Nimmo, et at., 1977b
320 320 Eisler, 1971
78 78 Johnson & Gentile, 1979
320 - Eisler, 1971
1300 645 Eisler & Hennekey, 1977
250 250 Johns & Miller, 1982
247 247 Martin, et al., 1981
11600 - Frank & Robertson, 1979
4700 7384 Frank & Robertson, 1979
Dem
Dem
Dem
Ben
Ben
Ben
Dem
Dem
Dem
Ben
Dem
Ben
Ben
Dem
Dem
Dem
Dem
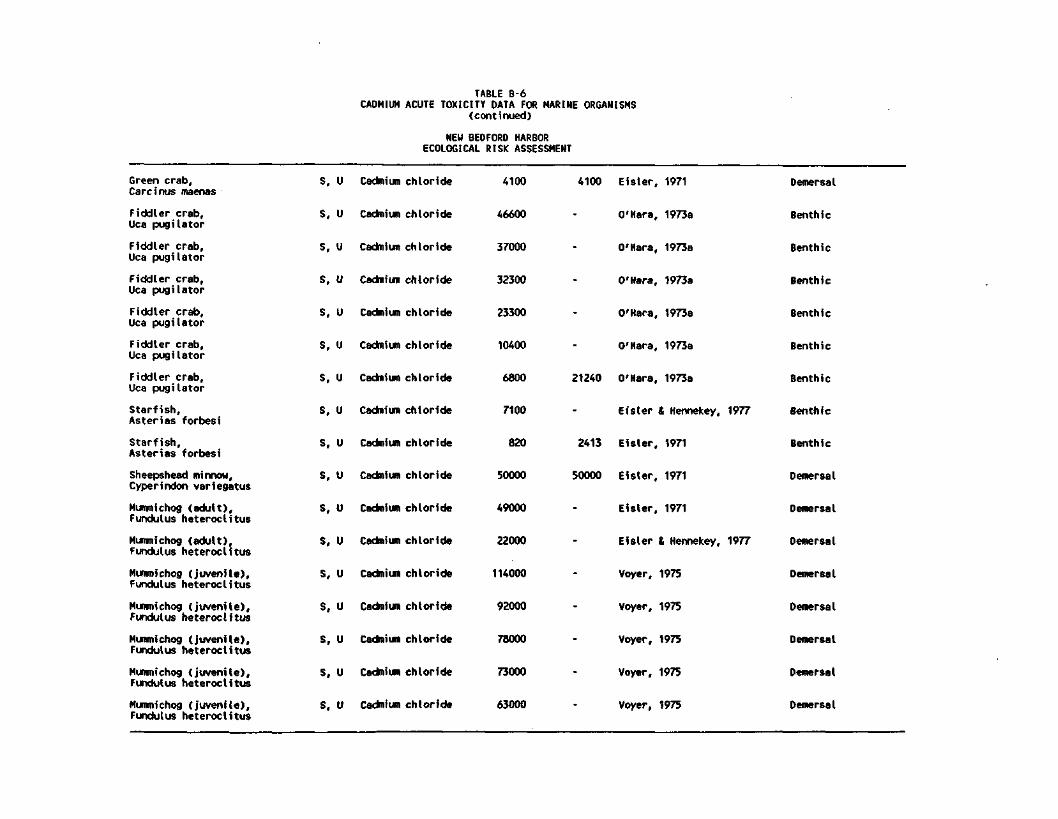
TABLE B-6 CADMIUM ACUTE TOXICITY DATA FOR MARINE ORGANISMS
(continued)
NEU BEDFORD HARBOR ECOLOGICAL RISK ASSESSMENT
Green crab, Carcinus maenas
Fiddler crab, Uca pug H a tor
Fiddler crab, Uca pugilator
Fiddler crab, Uca pugilator
Fiddler crab, Uca pugilator
Fiddler crab, Uca pugilator
Fiddler crab, Uca pugilator
Starfish, Asterias forbesi
Starfish, Asterias forbesi
Sheepshead minnow, Cyperindon variegatus
Mummichog (adult), Fundulus heteroclitus
Mummichog (adult), Fundulus heteroclitus
Mummichog (juvenile), Fundulus heteroclitus
Mummichog (juvenile), Fundulus heteroclitus
Mummichog (juvenile), Fundulus heteroclitus
Mummichog (juvenile), Fundulus heteroclitus
Mummichog (juvenile), Fundulus heteroclitus
S, U Cadmium chloride 4100
S, U Cadmium chloride 46600
S, U Cadmium chloride 37000
S, U Cadmium chloride 32300
S, U Cadmium chloride 23300
S, U Cadmium chloride 10400
S, U Cadmium chloride 6800
S, U Cadmium chloride 7100
S, U Cadmium chloride 820
S, U Cadmium chloride 50000
S, U Cadmium chloride 49000
S, U Cadmium chloride 22000
S, U Cadmium chloride 114000
S, U Cadmium chloride 92000
S, U Cadmium chloride 78000
S, U Cadmium chloride 73000
S, U Cadmium chloride 63000
4100 Eisler, 1971 Demer
0'Hara, 1973a Benth
O'Hara, 1973a Benth
O'Hara, 1973a Benth
O'Hara, 1973a Benth
O'Hara, 1973a Benth
21240 O'Hara, 1973a Benth
Eisler & Hennekey, 1977 Benth
2413 Eisler, 1971 Benth
50000 Eisler, 1971 Demers
Eisler, 1971 Demers
Eisler & Hennekey, 1977 Demers
Voyer, 1975 Demer
Voyer, 1975 Demers
Voyer, 1975 Demers
Voyer, 1975 Demers
Voyer, 1975 Demers

TABLE B-6 CADMIUM ACUTE TOXICITY DATA FOR MARINE ORGANISMS
(continued)
NEW BEDFORD HARBOR ECOLOGICAL RISK ASSESSMENT
Muntnichog (juvenile), Fundulus heteroclitus
Muntnichog (juvenile), Fundulus heteroclitus
Mummichog (juvenile), Fundulus heteroclitus
Stripped killfish (adult), Fundelus majallis
Atlantic silverside, Menidia menidia
Atlantic silverside, Menidia menidia
Atlantic silverside, Menidia menidia
Atlantic silverside (larvae), Menidia menidia
Atlantic silverside (larvae), Menidia menidia
Winter flounder (larvae), Pseudopleuronectes americanus
Winter flounder (larvae), Pseudopleuronectes americanus
S, U Cadmium chloride 31000
S, U Cadmium chloride 30000
S, U Cadmium chloride 29000
S, U Cadmium chloride 21000
S, u Cadmium chloride 2032
S, U Cadmium chloride 28532
S, U Cadmium chloride 13652
S, U Cadmium chloride 1054
S, U Cadmium chloride 577
S, U Cadmium chloride 602
S, U Cadmium chloride H297
Voyer, 1975
Voyer, 1975
50570 Voyer, 1975
21000 Eisler, 1971
Cardin, 1982
Cardin, 1982
Cardin, 1982
Cardin, 1982
779.8 Cardin, 1982
Cardin, 1982
K297 Cardin, 1982
Demer
Demer
Demer
Demer
Demer
Demer
Demer
Demer
Demer
Benth
Benth
Table taken from USEPA, 1985a.
S = static, R - renewal, FT = flow-through, M = measured, U = unmeasured.

TABLE B-7 OTHER DATA ON EFFECTS OF CADMIUM ON MARINE ORGANISMS
NEW BEDFORD HARBOR ECOLOGICAL RISK ASSESSMENT
SPECIES
Natural phytoplankton population
Diatom, Asterionella japonica
Diatom, Ditylum brightweilli
Diatom, Thalaaaiosira pseudonana
Diatom, Skeletoma costatum
Red alga, Champia parvula
Red alga, Champia parvula
Red alga, Champia parvula
Red alga, Champia parvula
Hydroid, Campanularia flexuosa
Hydroid, Campanularia flexuosa
Polychaete worm, Neanthes arenaceodentata
Polychaete worm, Capitella capitate
Polychaete worm, Capitella capitata
Blue mussel Mytilus edulis
Blue mussel Mytilus edulis
CHEMICAL DURATION EFFECT RESULT (ug/l) REFERENCE
Cadmium chloride 4 days
Cadmium chloride 3 days
Cadmium chloride 5 Days
Cadmium chloride 4 days
Cadmium chloride 4 days
Cadmium chloride
Cadmium chloride
Cadmium chloride
Cadmium chloride
Reduced biomass
72-hr EC50 growth rate
EC50 Growth
EC50 Growth rate
EC50 Growth rate
Reduced tetrasporophyte growth
Reduced tetrasporangia production
Reduced female growth
Stopped sexual reproduction
Enzyme inhibition
- 11 days Growth Rate
Cadmium chloride 28 days LC50
Cadmium chloride 28 days LC50
Cadmium chloride 28 days LC50
Cadmium EDTA 28 days BCF=252
Cadmium alginate 28 days BCF=252
112 Hollibaugh et al., 19
224.8 Fisher & Jones, 1981
60 Centerford &
Centerford, 1980
160 Gentile & Johnson, 19
175 Gentile & Johnson, 19
24.9 Steele & Thursby, 198
>189 Steele & Thursby, 198
22.8 Steele & Thursby, 198
22.8 Steele & Thursby, 198
40-75 Moore & Stebbling, 19
110-280 Stebbling, 1976
3000 Relsh et al., 1976
630 Relsh et al., 1976
700 Relsh et al., 1976
George & Coambs, 1977
George & Coambs, 1977

TABLE B-7 OTHER DATA ON EFFECTS OF CADMIUM ON MARINE ORGANISMS
(continued)
NEW BEDFORD HARBOR ECOLOGICAL RISK ASSESSMENT
Blue mussel Mytilus edulis
Blue mussel Mytilus edulis
Blue mussel Mytilus edulis
Bay scallop, Argopecton irradians
Bay scallop, Argopecton irradians
Eastern oyster, Crassostrea virginica
Eastern oyster, Crassostrea virginica
Eastern oyster, Crassostrea virginica
Pacific oyster, Crassostrea gigas
Pacific oyster, Crassostrea gigas
Pacific oyster, Crassostrea gigas
Soft-shell clam, Mya arenaria
Soft-shell clam, Mya arenaria
Copepod (naupilus), Eurytemora affinis
Copepod, (naupilus), Eurytemora affinis
Copepod, Tisbe holothuriae
Mysid, Mysidopsis bahia
Cadmium humate
Cadmium pectate
Cadmium chloride
Cadmium chloride
Cadmium chloride
Cadmium iodide
Cadmium chloride
Cadmium chloride
Cadmium chloride
Cadmium chloride
Cadmium chloride
Cadmium chloride
Cadmium chloride
Cadmium chloride
Cadmium chloride
Cadmium chloride
28 days BCF=252
28 days BCF=252
21 days BCF=710
42 days EC50 (growth reduction )
21 days BCF=168
40 days BCF=677
21 days BCF=149
2 days Reduction in embryonic development
6 days 50X reduction in settlement
14 days Growth reduction
23 days LC50
7 days LC50
7 days LC50
1 day Reduction in swimming speed
2 days Reduction in development rate
2 days LC50
17 days LC50 (15-23 g/kg salinity)
George & Coambs, 1977
George & Coambs, 1977
Janssen & Scholz, 1979
78 Pesch & Stewart, 1980
Eisler et al., 1972
Kerfoot & Jacobs, 1976
Eisler et al., 1972
IS Zarooglan & Morrison,
20-25 Wat ling, 1983b
10 Wat ling, 1983b
50 Wat ling, 1983b
150 Eisler, 1977
700 Eisler & Hennekey, 197
130 Sulivan et al., 1983
116 Sulivan et al., 1983
970 Moraltou-Apostolopoulo & Verriopoulos, 1982
11 Nimmo et al., 1977a

TABLE B-7 OTHER DATA ON EFFECTS OF CADMIUM ON MARINE ORGANISMS
(continued)
NEW BEDFORD HARBOR ECOLOGICAL RISK ASSESSMENT
Mysid, Mysidopsis bahia
Mysid, Mysidopsis bahia
Mysid, Mysidopsis bigelowi
Mysid, Mysidopsis bigelowi
Isopod, Idotea baltica
Isopod, Idotea baltica
Isopod, Idotea baltica
Pink shrimp, Penaeus duorarum
Grass shrimp, Palaemonetes pugio
Grass shrimp, Palaemonetes pugio
Grass shrimp, Palaemonetes pugio
Grass shrimp, Palaemonetes pugio
Grass shrimp, Palaemonetes pugio
Grass shrimp, Palaemonetes pugio
Grass shrimp, Palaemonetes pugio
Grass shrimp, Palaemonetes pugio
Grass shrimp, Palaemonetes vulgaris
Cadmium chloride
Cadmium chloride
Cadmium chloride
Cadmium chloride
Cadmium sulfate
Cadmium sulfate
Cadmium sulfate
Cadmium chloride
Cadmium chloride
Cadmium chloride
Cadmium chloride
Cadmium chloride
Cadmium chloride
Cadmium chloride
Cadmium chloride
Cadmium chloride
Cadmium chloride
16 days
8 days
8 days
LC50 (30 g/kg salinity)
LC50
LC50
28 days LC50
5 days LC50 (3 g/kg salinity)
3 days LC50 (21 g/kg salintiy)
1.5 days LC50 (14 g/kg salintiy)
30 days LC50
42 days LC50
21 days LC25 (5 g/kg salinity)
21 days LC10 (10 g/kg salinity)
21 days LC5 (20 g/kg salinity)
6 days LC75 (10 g/kg salintiy)
6 days LC50 (15 g/kg salinity)
6 days LC25 (30 g/kg salinity)
21 days BCF=140
29 days LC50
28 Gentile et al., 1982
60 Gentile et al., 1982
70 Gentile et al., 1982
18 Gentile et al., 1982
10000 Jones, 1975
10000 Jones, 1975
10000 Jones, 1975
720 Nimmo et al., 1977b
300 Pesch & Stewart, 1980
50 Vernberg et al., 1977
50 Vernberg et al., 1977
50 Vernberg et al., 1977
300 Middaugh & Floyd, 1978
300 Middaugh & Floyd, 1978
300 Middaugh & Floyd, 1978
Vernberg et al., 1977
120 Nimmo et al., 1977b

TABLE B-7 OTHER DATA ON EFFECTS OF CADMIUM ON MARINE ORGANISMS
(continued)
NEW BEDFORD HARBOR ECOLOGICAL RISK ASSESSMENT
American lobster, Homarus americanus
American lobster, Homarus americanus
Hermit crab, Pagurus Iongicarpus
Hermit crab, Pagurus tongicarpus
Rock crab, Cancer irroratus
Rock crab (larvae), Cancer irroratus
Blue crab, Callinectes sapidus
Blue crab, Callinectes sapidus
Blue crab (juvenile), Callinectes sapidus
Mud crab (larva), Eurypanopeus depressus
Mud crab (larva), Eurypanopeus depressus
Mud crab, Rhithropanopeus harrisii
Mud crab, Rhithropanopeus harrisii
Mud crab, Rhithropanopeus harrisii
Fiddler crab, Uca puilator
Fiddler crab, Uca puilator
Starfish, Asterias forbesi
Cadmium chloride 21 days BCF=25
Cadmium chloride 30 days Increase in ATPase activity
Cadmium chloride 7 days 25% mortality
Cadmium chloride 60 days LC56
Cadmium chloride 4 days Enzyme activity
Cadmium chloride 28 days Delayed developr
Cadmium chloride 7 days LC50 (10 g/kg salinity)
Cadmium nitrate 7 days LC50 (30 g/kg salinity)
Cadmium nitrate 4 days LC50 (1 g/kg salinity)
Cadmium chloride 8 days LC50
Cadmium chloride 44 days Delay in metamorphysis
Cadmium nitrate 11 days LC80 (10 g/kg salinity)
Cadmium nitrate 11 days LC75 (20 g/kg salinity)
Cadmium nitrate 11 days LC40 (30 g/kg salinity)
- 10 days LC50
Cadmium chloride - Effect on respiration
Cadmium chloride 7 days 25X mortality
Eisler et al., 1972
6 Tucker, 1979
270 Eisler & Hermekey, 197
70 Pesch & Stewart, 1980
1000 Gould et al., 1976
50 Johns & Miller, 1982
50 Rosenberg & Costlow, 1
150 Rosenberg & Costlow, 1
320 Frank & Robertson, 197
10 Mirkes, et al., 1978
10 Mirkes, et al., 1978
50 Rosenberg ft Costlow, 1
50 Rosenberg & Costlow, 1
50 Rosenberg ft Costlow, 1
2900 O'Hara, 1973a
1 Vernburg, et al., 1974
270 Eisler ft Hermekey, 197

TABLE B-7 OTHER DATA ON EFFECTS OF CADMIUM ON MARINE ORGANISMS
(continued)
NEW BEDFORD HARBOR ECOLOGICAL RISK ASSESSMENT
Herring (larvae), Clupea harengus
Pacific Herring (embryo), Clupea harengus pallasi
Pacific Herring (embryo), Clupea harengus pallasi
Pacific Herring (embryo), Clupea harengus pallasi
Mummichog (adult), Fundulus heteroclitus
Mummichog (adult), Fundulus heteroclitus
Mummichog, Fundulus heteroclitus
Mummichog (larva), Fundulus heteroclitus
Mummichog (larva), Fundulus heteroclitus
Atlantic silverside, Menidia menidia
Atlantic silverside, Menidia menidia
Atlantic silverside, Menidia menidia
Atlantic silverside, Menidia menidia
Atlantic silverside, Menidia menidia
Atlantic silverside (larvae), Menidia menidia
Atlantic silverside (larvae), Menidia menidia
Stripped bass (juvenile), Morone saxatilis
Cadmium chloride
Cadmium chloride
Cadmium chloride
Cadmium chloride
Cadmium chloride
Cadmium chloride
Cadmium chloride
Cadmium chloride
Cadmium chloride
Cadmium chloride
Cadmium chloride
Cadmium chloride
Cadmium chloride
Cadmium chloride
Cadmium chloride
Cadmium chloride
Cadmium chloride
" 100% embryonic survival
5000
< 1 day 17% reduction in volume
10000
A days Decrease in capsule strength
1000
2 days Reduced osmolality of periviteline fluid
1000
2 days LC50 (20 g/kg salinity)
60000
2 days LCSO (30 g/kg salinity)
43000
21 days BCF=48 -
2 days LC50 (20 g/kg salinity)
32000
2 days LC50 (30 g/kg salinity)
7800
2 days LC50 (20 g/kg salinity)
13000
2 days LCSO (30 g/kg salinity)
12000
19 days LC50 (12 g/kg salinity)
160
19 days LCSO (20 g/kg salinity)
540
19 days LC50 (30 g/kg salinity)
970
2 days LC50 (20 g/kg salinity)
2200
2 days LCSO (30 g/kg salinity)
1600
90 days Significant decrease in enzyme activity
5
Westernhagen et al.,
Alderdice et al., 19
Alderdice et al., 19
Alderdice et al., 19
Middaugh & Dean, 1977
Middaugh & Dean, 1977
Eisler, et al., 1972
Middaugh & Dean, 1977
Middaugh & Dean, 1977
Middaugh & Dean, 1977
Middaugh & Dean, 197
Voyer et al., 1979
Voyer et al., 1979
Voyer et al., 1979
Middaugh & Dean, 197
Middaugh & Dean, 1977
Dawson et al., 1977

TABLE B-7 OTHER DATA ON EFFECTS OF CADMIUM ON MARINE ORGANISMS
(continued)
NEW BEDFORD HARBOR ECOLOGICAL RISK ASSESSMENT
Stripped bass (juvenile), Morone saxatilis
Spot (larva), Leiostomus xanthurus
Cunner (adult), Tautogolabrus adspersus
Cunner (adult), Tautogolabrus adspersus
Cunner (adult), Tautogolabrus adspersus
Winter flounder, Pseudopleuronectes americanus
Winter flounder, Pseudopleuronectes americanus
Winter flounder, Pseudopleuronectes americanus
Diatom, Skeletonema costatum
Crab, Pontoporeia affinis
Mysid shrimp, Mysidopsis spp.
Mysid shrimp, Mysidopsis spp.
Cadmium chloride
Cadmium chloride
Cadmium chloride
Cadmium chloride
Cadmium chloride
Cadmium chloride
Cadmium chloride
Cadmium chloride
30 days Significant decrease in oxygen consumption
9 days Incipient LC50
60 days 37.5% mortalIity
30 days Depresses gill tissue oxygen consumption
4 days Decreased enzyme activity
8 days 50X viable hatch
60 days Increased gill tissue oxygen respiration
17 days Reduction of viable hatch
Decreased growth
265 days
23-27 days
23-27 days No effect
Reduced F1 life span
Molt inhibition
0.5-5.0 Dawson et al., 1977
200 Middaugh et al., 1975
100 Maclnnes et al., 1977
50 Maclnnes et al., 1977
3000 Gould & Karolus, 1974
300 Voyer et al., 1977
5 Calabrese et al., 1975
586 Voyer et aI., 1982
10-25 Berland et al., 1977
6.5 Sundelin, 1983
10 Gentile et al., 1982
5.1 Gentile et al., 1982
Table taken from USEPA, 1985a, and Eisler, 1985.

TABLE B-8 LEAD ACUTE TOXICITY DATA FOR MARINE ORGANISMS
NEU BEDFORD HARBOR ECOLOGICAL RISK ASSESSMENT
SPECIES METHOD CHEMICAL
Amphipod, Ampelisca abdita
R, U Lead nitrate
Atlantic silverside, Menidia menidia
S, U Lead nitrate
Copepod, Acarti clausi
S, U Lead nitrate
Dungeness crab, Cancer magister
- Lead
Inland silverside, Menidia beryllina
FT, M Lead nitrate
Mummichog, Fundulus heteroclitus
S, U Lead nitrate
Mysid, Mysidopsis bahia
FT, M Lead nitrate
Plaice, Pleuronectes platessa
- Diethyl Pb
LC50 SPECIES MEAN or EC50 ACUTE VALUE (ug/l) (ug/l) REFERENCE
HABITAT GROUP
547
Sheepshead minnow, Cyperinodon variegatus
Shrimp, Crangon crangon
Alga, Phaeodactylun tricornutum
Alga, Phaeodactylun tricornutum
Alga, Phaeodactylum tricornutum
Alga, Phaeodactylun tricornutum
Alga, Phaeodactylun tricornutum
575 575
3140 >3,140
315 315
3130
75000
FT, M Lead nitrate 3140
Trimethyl Pb 8800
Trimethyl Pb 800
Pb+2 >5000
Triethyl Pb 100
Tetraethyl Pb 100
Tetramethyl Pb 1300
547 Scott et al. Manuscript
DO Berry, 1981
Gentile, 1982
Reish & Gerlinger, 1984
Cardin, 1981
Dorfman, 1977
3130 Lussier, et al. Manuscript
Maddock and Taylor, 1980
Cardin, 1981
Maddock and Taylor, 1980
Maddock and Taylor, 1980
Maddock and Taylor, 1980
Maddock and Taylor, 1980
Maddock and Taylor, 1980
Maddock and Taylor, 1980
Benthic
Demersal
Nekton/Plankton
Demersal
Demersal
Demersal
Demersal
Demersal
Demersal
Demersal
Nekton/Plankton
Nekton/Plankton
Nekton/Plankton
Nekton/Plankton
Nekton/Plankton
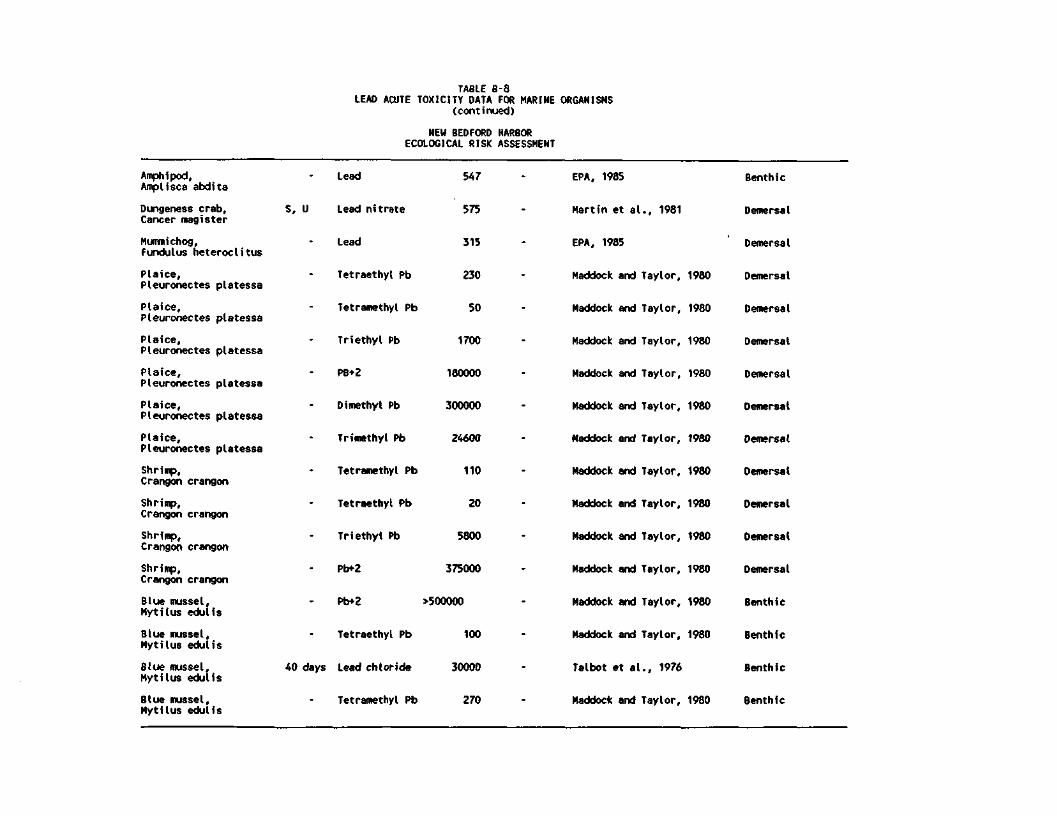
TABLE B-8 LEAD ACUTE TOXICITY DATA FOR MARINE ORGANISMS
(continued)
NEW BEDFORD HARBOR ECOLOGICAL RISK ASSESSMENT
Amphipod, Amptisca abdita
Dungeness crab, Cancer magister
Mummichog, Fundulus heteroclitus
Plaice, Pleuronectes platessa
Plaice, Pleuronectes platessa
Plaice, Pleuronectes platessa
Plaice, Pleuronectes platessa
Plaice, Pleuronectes platessa
Plaice, Pleuronectes platessa
Shrimp, Crangon crangon
Shrimp, Crangon crangon
Shrimp, Crangon crangon
Shrimp, Crangon crangon
Blue mussel, Mytilus edulis
Blue mussel, Mytilus edulis
Blue mussel, Mytilus edulis
Blue mussel, Mytilus edulis
Lead
S, U Lead nitrate
Lead
547
575
315
Tetraethyl Pb 230
Tetramethyl Pb 50
Triethyl Pb 1700
PB+2 180000
Dimethyl Pb 300000
Trimethyl Pb 24600
Tetramethyl Pb 110
Tetraethyl Pb 20
Triethyl Pb 5800
Pb+2 375000
Pb+2 >500000
Tetraethyl Pb 100
40 days Lead chloride 30000
Tetramethyl Pb 270
EPA, 1985 Benthic
Martin et al., 1981 Demersal
EPA, 1985 ' Demersal
Maddock and Taylor, 1980 Demersal
Maddock and Taylor, 1980 Demersal
Maddock and Taylor, 1980 Demersal
Maddock and Taylor, 1980 Demersal
Maddock and Taylor, 1980 Demersal
Maddock and Taylor, 1980 Demersal
Maddock and Taylor, 1980 Demersal
Maddock and Taylor, 1980 Demersal
Maddock and Taylor, 1980 Demersal
Maddock and Taylor, 1980 Demersal
Maddock and Taylor, 1980 Benthic
Maddock and Taylor, 1980 Benthic
Talbot et al., 1976 Benthic
Maddock and Taylor, 1980 Benthic

TABLE B-8 LEAD ACUTE TOXICITY DATA FOR MARINE ORGANISMS
(continued)
NEW BEDFORD HARBOR ECOLOGICAL RISK ASSESSMENT
Blue mussel, Mytilus edulis
150 days Lead nitrate 500
Blue mussel, Mytilus edulis
- Triethyl Pb 1100
Blue mussel, Mytilus edulis
- Trimethyl Pb 500
Blue mussel, Mytilus edulis
S, U Lead nitrate 476
Blue mussel (larva), Mytilus edulis
- Pb+2 476
Eastern oyster, Crassostrea viginica
s, u Lead nitrate 2450
Pacific oyster, Crassostrea gigas
s, u Lead nitrate 758
Polychaete worm, Ophryotrocha diadema
4 days Lead acetate 14100
Polychaete worm, Ophryotrocha diadema
2 days Lead acetate 100000
Polychaete worm, Capitella capitata
4 days Lead acetate 1200
Quahog clam (larva), Mercenaria mercenaria
s, u Lead nitrate 780
Sandworm, Neanthes arenaceodentata
- Lead 7700
Sandworm, Neanthes arenaceodentata
- Lead 10700
Soft-shell clam, s, u Lead nitrate 27000 Mya arenaria
Soft-shell clam, 7 days Lead nitrate 8800 Mya arenaria
Schultz-Baldes, 1972 Benthic
Maddock and Taylor, 1980 Benthic
Maddock and Taylor, 1980 Benthic
Martin et al., 1981 Benthic
EPA, 1985 Benthic
Calabrese et al., 1973 Benthic
Martin et al., 1981 Benthic
Relsh et al., 1976 Benthic
Parker, 1984 Benthic
Relsh et al., 1976 Benthic
Calabrese & Nelson, 1974 Benthic
Reish & Gerlinger, 1984 Benthic
Reish & Gerlinger, 1984 Benthic
Eisler, 1977 Benthic
Eisler, 1977 Benthic
Table taken from USEPA, 1980, and Eisler, 1988.
S = static, R = renewal, FT = flow through, M = measured, U = unmeasured.

TABLE B-9 OTHER DATA ON EFFECTS OF LEAD ON MARINE ORGANISMS
NEW BEDFORD HARBOR ECOLOGICAL RISK ASSESSMENT
SPECIES CHEMICAL DURATION EFFECT RESULT (ug/l) REFERENCE
Alga, Dunaliella salina
Lead - 65X growth reduction
900 Pace et al., 1977
Alga, Dundaliella tertiolecta
Tetramethyl lead 4 days EC50 1650 Marchetti, 1978
Alga, Dundaliella tertiolecta
Tetraethyl lead 4 days EC50 150 Marchetti, 1978
Alga, Chorella stigmatophora
Lead 21 days 50% growth inhibition 700 Christensen, et a
Alga, Champia parvula
Lead - Reduced tetrasporophyte growth
23.3 Steele & Thursby,
Diatom, Phaeodactylum tricornutum
Lead 3 days No growth inhibition
1000 Hannan & Patoulli
Diatom, Asterionella japonica
Lead - EC50 207 Fisher & Jones, 1
Diatom, Ditylum brightwelli
Lead - EC50 40 Centerford & Cent 1980
Diatom, Phaeodactylum tricornutum
Lead 1 day Completely inhibited photosynthis
10000 Uoolery & Lewin,
Diatom, Skeletonema costatum
Lead 12 days EC50 (growth rate) 3.7 Rivkin, 1979
Diatom, Phaeodactylum tricornutum
Lead 2-3 days Reduced photosynthesis and respiration
100 Woolery & Lewin,
Natural phytoplankton populations
Lead 4 days Reduced biomass 21 Hollibaugh, et al
Natural phytoplankton populations
Lead 5 days Reduced chlrophyll a 207 Hollibaugh, et al
Phytoplankton, Platymonas subcordiformes
Lead 3 days Retarded population growth 2500 Hessler, 1974
Eastern oyster Crassostera virginica
Lead 1 yr BCF = 326 - Kopfler & Mayer,

TABLE B-9 OTHER DATA ON EFFECTS OF LEAD ON MARINE ORGANISMS
(continued)
NEW BEDFORD HARBOR ECOLOGICAL RISK ASSESSMENT
Polychaete worm, Lead Ophryotrocha diadema
Polychaete worm, Lead Ctenodrilus serratus
American lobster Lead Homarus americanus
Mud crab, Lead Rhithropanopeus harrisii
Mummtchog (eatoyro), Lead Fundulus heterociltus
Mummichog (embyro). Lead Fundulus heterociltus
21 days Suppressed reproduction
21 days Suppressed reproduction
30 days Reduced enzyme activity
- Delayed larval development
- Depressed axis formation
Retarded hatching
1000 Relsh & Cam, 1978
1000 Relsh & Carr, 1978
50 Gould & Greig, 1983
50 Benijts-Claus & Benijts, 1975
100 Weis & Weis, 1977
10000 Weis & Weis, 1982
Table taken from USEPA, 1980.

TABLE B-10 COPPER MATC ESTIMATES FOR ORGANISMS AT NEW BEDFORD HARBOR
NEW BEDFORD HARBOR ECOLOGICAL RISK ASSESSMENT
TOTAL TAXON SLOPE INTERCEPT MATC VARIANCE
Marine Fish 1.02 0.75 2.517 1.319
Crustacea 0.8 0.43 1.816 2.708
Mollusca 0.98 -0.6 1.223 0.420
Polychaeta 1.0 -0.88 1.480 0.210
Alga 1.081 0.069
Notes:
(1) The basic regression equation that defines the extrapolation is Y -' Intercept + (X * Slope), where X is the acute toxicological estimate and Y the extrapolated MATC value.
(2) No extrapolation was done for the alga, rather chronic data were used to estimate the benchmark value for the taxon.
(3) All units expressed as Log (base 10) ug/1.
/

TABLE B-ll CADMIUM MATC ESTIMATES FOR ORGANISMS AT NEW BEDFORD HARBOR
NEW BEDFORD HARBOR ECOLOGICAL RISK ASSESSMENT
TOTAL TAXON SLOPE INTERCEPT MATC VARIANCE
Marine Fish 1.02 0.75 1.505 0.698
Crustacea 0.8 0.43 1.022 1.824
Mollusca 0.98 -0.6 2.757 0.424
Polychaeta 1.0 -0.88 3.106 0.212
Alga 1.997 0.115
Notes:
(1) The basic regression equation that defines the extrapolation is Y -Intercept + (X * Slope), where X is the acute toxicological estimate and Y the extrapolated MATC value.
(2) No extrapolation was done for the alga, rather chronic data were used to estimate the benchmark value for the taxon.
(3) All units expressed as Log (base 10) ug/1.

TABLE B-12 LEAD MATC ESTIMATES FOR ORGANISMS AT NEW BEDFORD HARBOR
NEW BEDFORD HARBOR ECOLOGICAL RISK ASSESSMENT
TOTAL TAXON SLOPE INTERCEPT MATC VARIANCE
Marine Fish 1.02 0.75 2.176 1.028
Crustacea 0.8 0.43 1.548 2.317
Mollusca 0.98 -0.6 2.433 0.421
Polychaeta 1.0 -0.88 3.149 0.210
Alga 2.370 0.909
Notes:
(1) The basic regression equation that defines the extrapolation is Y - Intercept + (X * Slope), where X is the acute toxicological estimate and Y the extrapolated MATC value.
(2) No extrapolation was done for the alga, rather chronic data were used to estimate the benchmark value for the taxon.
(3) All units expressed as Log (base 10) ug/1.

POLYCHAETE
#
O c 0) a
<D > CO
E 3
o
1.0
0.8
0.6 -
0.4
0.2
0.0
MARINE FISH
CRUSTACEAN
-2 0 2
Log Copper Concentration, ( ug/l)
MATC CURVES NEW BEDFORD, MAS

#
>> u c <D 3 tr o> *_ UL > '•3 CO 3
E 3
o
1.0
0.8
0.6
0.4
0.2
0.0
CRUSTACEAN
POLYCHA
-4 •2 0 2
Log Cadmium Concentration, ( ug/l)
MATC CURVES NEW BEDFORD, MA

#
1.0
0.8 -
o § 0.6 cr <D k. U.
| 0.4 jo a E O 0.2
0.0 -4
MARINE FI8H
CRUSTACEANS
POLYCH
-2 0 2
Log Lead Concentration, ( ug/l)
MATC CUR NEW BEDFORD, MA

APPENDIX C
MATCs, EECs, and CHRONIC EFFECTS PROBABILITIES
FOR
COPPER, CADMIUM, AND LEAD

TABLE C-l CUMULATIVE PROBABILITY THAT THE EXPECTED EXPOSURE CONCENTRATION
WILL EXCEED THE COPPER MATC FOR THE PARTICULAR TAXON.
NEW BEDFORD HARBOR ECOLOGICAL RISK ASSESSMENT
HARBOR MARINE ZONE FISH CRUSTACEA MOLLUSCA POLYCHAETA ALGA
t-l Water Column 0.03 0.19 0.09 0.01 0.00
2, Water Column 0.04 0.22 0.15 0.02 0.03
3, Water Column 0.04 0.22 0.15 0.02 0.03
4, Water Column 0.03 0.19 0.10 0.01 0.02
5, Water Column 0.01 0.12 0.03 0.00 0.00
1. Pore Water 0.02 0.11 0.05 0.02 0.04
2, Pore Water 0.01 0.08 0.04 0.02 0.03
3, Pore Water 0.02 0.11 0.05 0.02 0.04
4, Pore Water 0.01 0.08 0.02 0.00 0.01
5, Pore Water 0.00 0.04 0.00 0.00 0.00
Notes:
Probabilities calculated as the area under a normally-distributed curve defined by a particular Z score, where Z - (Mean EEC - BM) / (Var EEC + Var BM)A2. Equation presented by Suter et al., 1986.
EEC - Expected Environmental Concentration
BM - Bench Mark, which in this application are the MATCs developed by extrapolation, in the case of Marine Fish, Crustaceans, Mollusks, and Polychaetes. For Alga, the bench mark was based on available chronic toxicity data.

TABLE C-2 CUMULATIVE PROBABILITY THAT THE EXPECTED EXPOSURE CONCENTRATION
WILL EXCEED THE CADMIUM MATC FOR THE PARTICULAR TAXON.
NEW BEDFORD HARBOR ECOLOGICAL RISK ASSESSMENT
HARBOR MARINE ZONE FISH CRUSTACEA MOLLUSCA POLYCHAETA ALGA
l-l Water Column 0.01 0.11 0.00 0.00 0.00
2, Water Column 0.01 0.14 0.00 0.00 0.00
3, Water Column 0.00 0.10 0.00 0.00 0.00
4, Water Column 0.00 0.08 0.00 0.00 0.00
5, Water Column 0.00 0.05 0.00 0.00 0.00
1, Pore Water 0.01 0.12 0.00 0.00 0.00
2, Pore Water 0.03 0.13 0.00 0.00 0.00
3, Pore Water 0.01 0.09 0.00 0.00 0.00
4, Pore Water 0.00 0.06 0.00 0.00 0.00
5, Pore Water 0.00 0.03 0.00 0.00 0.00
Notes:
Probabilities calculated as the area under a normally-distributed curve defined by a particular Z score, where Z - (Mean EEC - BM) / (Var EEC + Var BM)A2. Equation presented by Suter et al., 1986.
EEC - Expected Environmental Concentration
BM - Bench Mark, which in this application are the MATCs developed by extrapolation, in the case of Marine Fish, Crustaceans, Mollusks, and Polychaetes. For Alga, the bench mark was based on available chronic toxicity data.

TABLE C-3 CUMULATIVE PROBABILITY THAT THE EXPECTED EXPOSURE CONCENTRATION
WILL EXCEED THE LEAD MATC FOR THE PARTICULAR TAXON.
NEW BEDFORD HARBOR ECOLOGICAL RISK ASSESSMENT
HARBOR MARINE ZONE FISH • CRUSTACEA MOLLUSCA POLYCHAETA ALGA
1. Water Column 0.03 0.18 0.00 0.00 0.01
2, Water Column 0.02 0.17 0.00 0.00 0.01
3, Water Column 0.02 0.13 0.00 0.00 0.01
4, Water Column 0.01 0.08 0.00 0.00 0.00
5, Water Column 0.01 0.06 0.00 0.00 0.00
1, Pore Water 0.04 0.18 0.01 0.00 0.03
2, Pore Water 0.03 0.13 0.01 0.00 0.02
3, Pore Water 0.02 0.14 0.00 0.00 0.01
4, Pore Water 0.00 0.06 0.00 0.00 0.00
5, Pore Water 0.01 0.10 0.00 0.00 0.01
Notes:
Probabilities calculated as the area under a normally-distributed curve defined by a particular Z score, where Z - (Mean EEC - BM) / (Var EEC + Var BM)A2. Equation presented by Suter et al., 1986.
EEC - Expected Environmental Concentration
BM - Bench Mark, which in this application are the MATCs developed by extrapolation, in the case of Marine Fish, Crustaceans, Mollusks, and Polychaetes. For Alga, the bench mark was based on available chronic toxicity data.

"lit
<2<oco
lLn
.UK
o<
co
oo
-U
J W
CD
I* OL
U
NZ
QC
O
u. (0
o U
J LU
( % ) A
ou
anb
ajj aA&
einuino

ZONE 3
©^
1.0
0.8
>» o © 0.6 a-
I °4
3 E O 0.2
0.0 ±
ZONE 1
ZONE 2
ZONE 5 POLYCHAETES
ZONE 4' ZONE 1
Log Copper Concentration, ( ug/l)
MATC FOR POLYC EECs FOR ALL ZONES, COPPER, WA
NEW BEDFORD, MAS

ZONE 3
1.0
0.8
o § 0.6 cr
u.
I 0.4 '•P
J2
E O 0.2
0.0 J_
ZONE 1
ZONE 2
ZONE 5 MOLLUSKS
ZONE 3 ZONE 4
ZONE 1
Log Copper Concentration, ( ug/l)
MATC FOR MO EECS FOR ALL ZONES, COPPER, WA
NEW BEDFORD, MAS

ZONE 3
>» O c a cr <u k. u.
>
to
3 E 3 o
1.0
0.8
0.6
0.4
0.2
0.0
ZONE 1
ZONE 2
CRUSTACEANS
ZONE 3 ZONE 4
w ZONE 1
Log Copper Concentration, ( ug/l)
MATC FOR CRUS EEC8 FOR ALL ZONES, COPPER, W
NEW BEDFORD, MA

ZONE 3
O
c <D 3 O" 0) h.
UL 0)
1.0
0.8
0.6
0.4 jo a E O 0.2
0.0
ZONE 1
ZONE 2
± •4
ZONE 5
MARINE F
'ZONE 3 ZONE 4'
u ZONE 1
Log Copper Concentration, ( ug/l)
MATC FOR MA EECS FOR ALL ZONES, COPPER, W
NEW BEDFORD, MA

1.0
0.8
>» o c 0) 0.6 3 cr <D k . IL 0> > 0.4 • * (0 3 E 3 O 0.2
0.0
ZONE 5
ZONE 4
ZONE 1
ZONE 2
ZONE 3
ALGA
-2 0 2 Log Cadmium Concentration, ( ug/l)
MATC F EECs FOR ALL ZONES, CADMIUM, W
NEW BEDFORD, MA
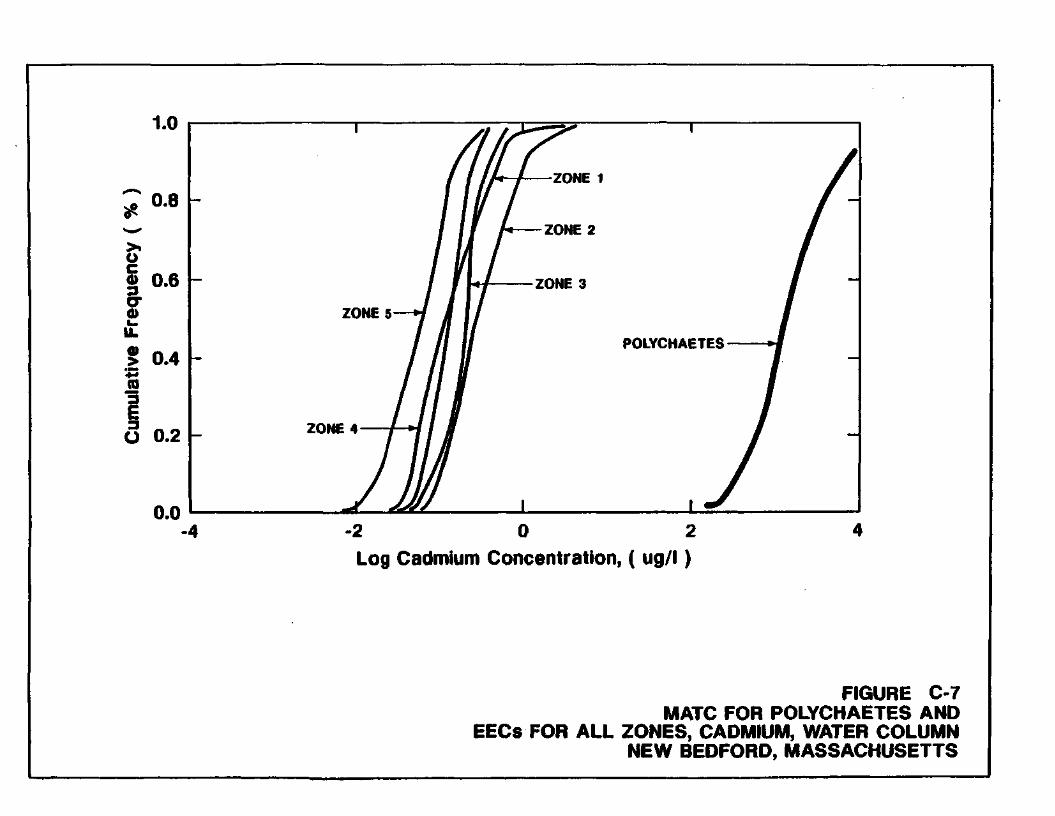
£ >» o c <D 3 O" <D
0) > n 3 E 3 o
1.0
0.8 -
0.6
0.4
0.2
ZONE 1
ZONE 2
ZONE 3
ZONE 4
0.0
ZONE 5
POLYCHAETES
1 -2 0 2
Log Cadmium Concentration, ( ug/l)
MATC FOR POLY EECs FOR ALL ZONES, CADMIUM, W
NEW BEDFORD, MAS

1.0
0.8
o § 0.6 cr o> k.
u. | 0.4 •3 JO a E O 0.2
0.0
ZONE 5
ZONE 4
ZONE 1
« ZONE 2
ZONE 3
MOLLUSKS
-4 -2 0 2 Log Cadmium Concentration, ( ug/l)
MATC FOR M EECs FOR ALL ZONES, CADMIUM, W
NEW BEDFORD, MA
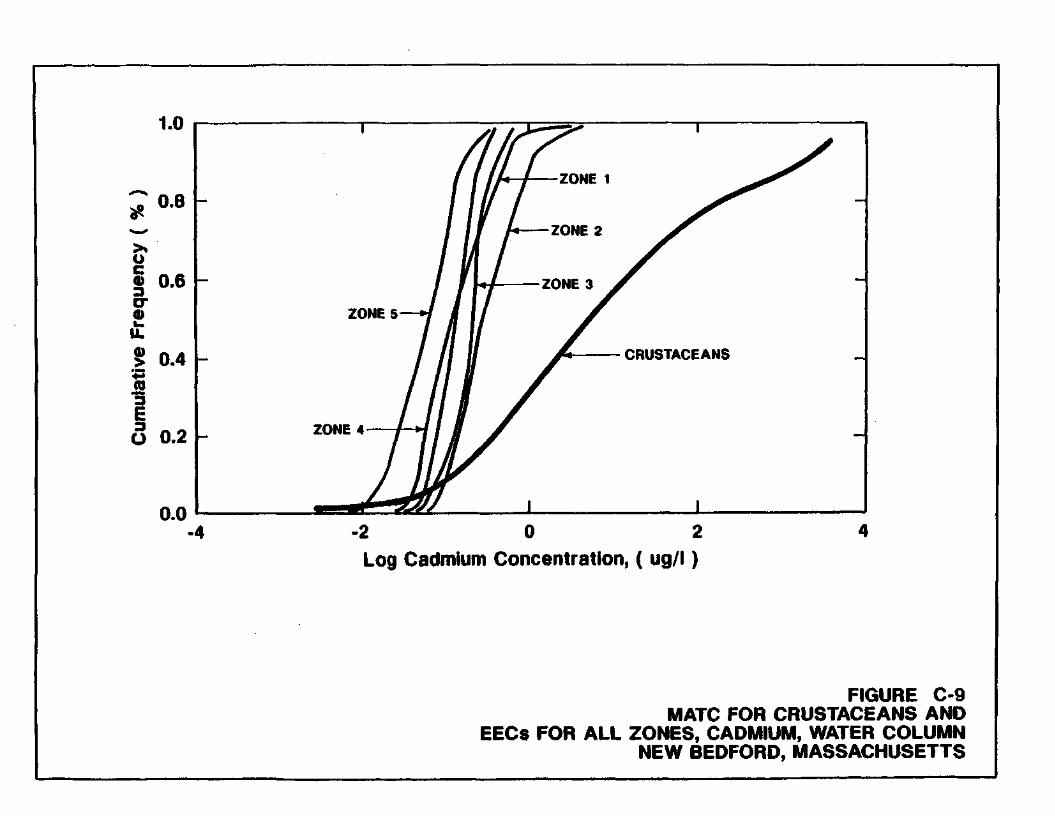
<*
o c a cr
> •5 «
"3 E o
1.0
0.8 -
0.6
0.4
0.2
0.0
ZONES
CRUSTACEANS
ZONE 4
-2 0 2 Log Cadmium Concentration, ( ug/l)
MATC FOR CRUS EECs FOR ALL ZONES, CADMIUM, W
NEW BEDFORD, MA

1.0
0.8
o | 0.6 cr
u.
I °-4
(0 3 E O 0.2
0.0
ZONE 4
ZONE 5
MARINE FISH
-2 0 2 Log Cadmium Concentration, ( ug/i)
MATC FOR MA EECs FOR ALL ZONES, CADMIUM, W
NEW BEDFORD, MA
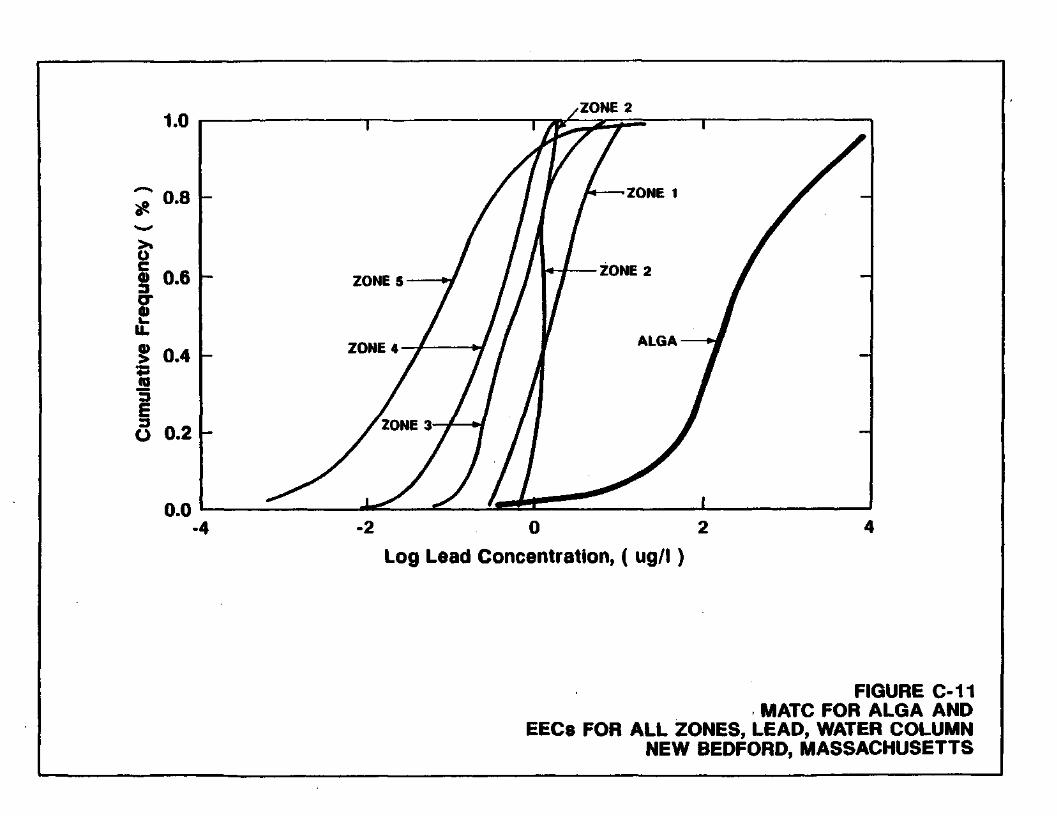
Log Lead Concentration, ( ug/l)
MATC EECs FOR ALL ZONES, LEAD, W
NEW BEDFORD, MA

/ZONE 2 1.0 1.0
jf7~T~ T 0.8 / / A ^ -ZONE 1 | 0^ / I I I 1 N - * t i k i 1 >» / 1 l\ 1 1 u c
/ / / L l TfktilF T I 3> 0.6 ZONES y / / 1 / 1 mm
a- / f / \ f 1 Qi / / / 1 / 1 k. u. „^.„. / / / If POLYCHAETES »-f | 0.4 ZONE 4—^ * / / / r v i - . « . m t i u » -
*3 / / I n M (0 / / I I I m 3 / / I l\ m E 3
r~f(\tXT *l r fc f r I •
O 0.2
0.0
X £UNC ** / f / 1 # O 0.2
0.0 • 4 - 2 0 2
Log Lead Concentration, ( ug/l)
MATC FOR POL EECs FOR ALL ZONES, LEAD,
NEW BEDFORD, M

1.0 ZONE 2
0.8 as >» u c a 0.6 3 cr 0) w. U. CD > 0.4 • ^ (0 3 E n O 0.2
0.0 -4
ZONE 5
* ZONE 1
*-f ZONE 2
MOLLUSKS
•2 0 2
Log Lead Concentration, ( ug/l)
MATC FOR MO EECs FOR ALL ZONES, LEAD, WA
NEW BEDFORD, MAS

Log Lead Concentration, ( ug/l)
MATC FOR CRU ECCS FOR ALL ZONES, LEAD,
NEW BEDFORD, M

1.0
* °-8
>» O
© 0.6 3 O" <D k.
u. > 0.4 +3 JO 3 E O 0.2
ZONE 2
0.0 -4
ZONE 5 ^
•2 0 2
Log Lead Concentration, ( ug/l)
MARINE FI
MATC FOR MA EECs FOR ALL ZONES, LEAD, W
NEW BEDFORD, MA

© (NOTE: REFER TO FIGURE 2.1 FOR ZONE LOCATIONS)
AEROVOX
FA1RHAVEN
NEW BEDFORD
DARTMOUTH
^
NOT TO SCALE
MtSHAUM POINT
NEGRO LEDGE
FIGURE C-16 MAP OF
CHRONIC EFFECTS PROBABILITIES FOR ALGA, COPPER, WATER COLUMN
NEW BEDFORD, MASSACHUSETTS

© (NOTE: REFER TO FIGURE 2.1 FOR ZONE LOCATIONS)
AEROVOX
FAIRHAVEN
NEW BEDFORD
DARTMOUTH
. v MtSHAUM POINT
NEGRO LEDGE
NOT TO SCALE
FIGURE C-17 MAP OF
CHRONIC EFFECTS PROBABILITIES FOR POLYCHAETES, COPPER, WATER COLUMN
NEW BEDFORD, MASSACHUSETTS

© (NOTE: REFER TO FIGURE 2.1 FOR ZONE LOCATIONS)
AEROVOX
0.09
FAIRHAVEN
NEW BEDFORD
DARTMOUTH
^
NOT TO SCALE
MtSHAUM POINT
NEGRO LEDGE
FIGURE C-18 MAP OF
CHRONIC EFFECTS PROBABILITIES FOR MOLLUSKS, COPPER, WATER COLUMN
NEW BEDFORD, MASSACHUSETTS

© (NOTE: REFER TO FIGURE 2.1 FOR ZONE LOCATIONS)
AEROVOX
0.19 —
FAIRHAVEN
NEW BEDFORD 0.22-
COGGESHALL STREET BRIDGE
0.22
DARTMOUTH
. VB, RICKETSONS \ ^ POINT
SMITH NECK
NEGRO LEDGE
. V MISHAUM POINT
NOT TO SCALE
FIGURE C-19 MAP OF
CHRONIC EFFECTS PROBABILITIES FOR CRUSTACEANS, COPPER, WATER COLUMN
NEW BEDFORD, MASSACHUSETTS

© (NOTE: REFER TO FIGURE 2.1 FOR ZONE LOCATIONS)
AEROVOX
0.03'
FAIRHAVEN
NEW BEDFORD 0.04-
COGGESHALL STREET BRIDGE
DARTMOUTH
0.04
0.03 Q s CORNELL , J k 7UBILIER
xVi, RICKETSONS W POINT
LARKS OINT
SMITH NECK
NEGRO LEDGE
^S
NOT TO SCALE
MISHAUM POINT FIGURE C-20
MAP OF CHRONIC EFFECTS PROBABILITIES FOR MARINE FISH, COPPER, WATER COLUMN
NEW BEDFORD, MASSACHUSETTS

© (NOTE: REFER TO FIGURE 2.1 FOR ZONE LOCATIONS)
AEROVOX
0.00
FAIRHAVEN
NEW BEDFORD
DARTMOUTH
. w MISHAUM POINT
NEGRO LEDGE
NOT TO SCALE
FIGURE C-21 MAP OF
CHRONIC EFFECTS PROBABILITIES FOR ALGA, CADMIUM, WATER COLUMN NEW BEDFORD, MASSACHUSETTS

© (NOTE: REFER TO FIGURE 2.1 FOR ZONE LOCATIONS)
AEROVOX
0.00 ~ -
FAIRHAVEN
NEW BEDFORD . ti?j%i'"/- COGGESHALL I • T f SSiV- STREET BRIDGE
DARTMOUTH
. w ' MISHAUM POINT
NEGRO LEDGE
NOT TO* SCALE
FIGURE C-22 MAP OF
CHRONIC EFFECTS PROBABILITIES FOR POLYCHAETES, CADMIUM, WATER COLUMN
NEW BEDFORD, MASSACHUSETTS
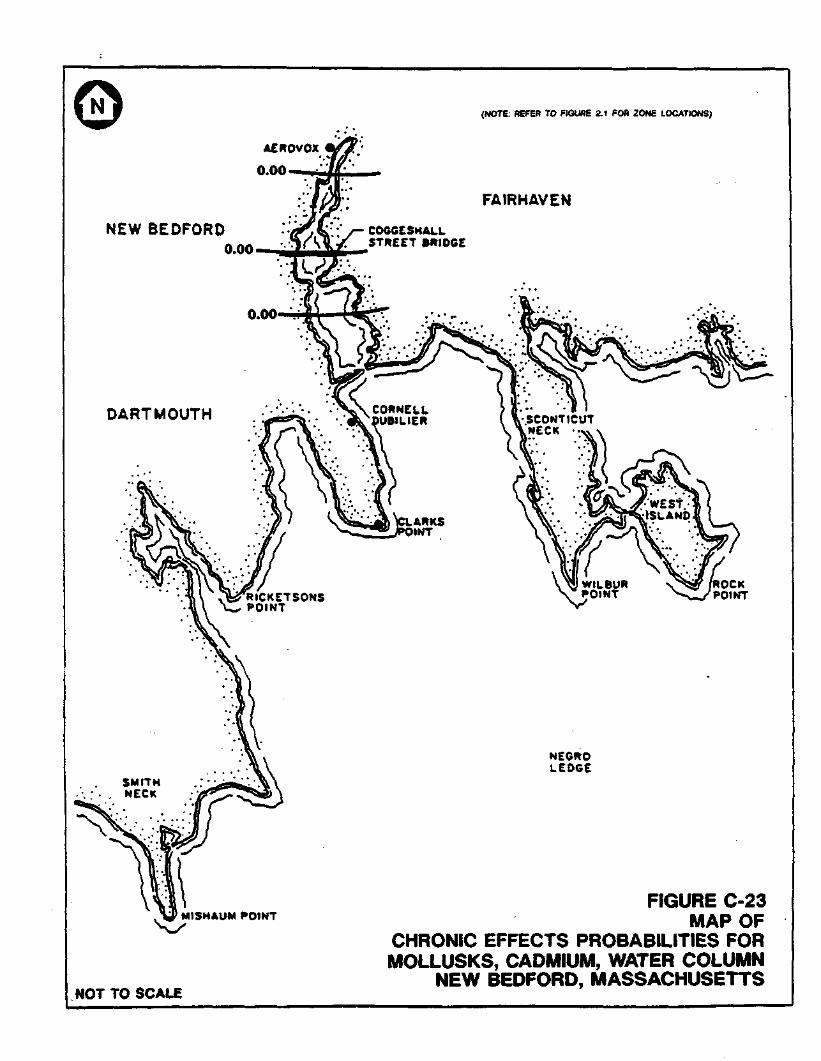
© (NOTE. REFER TO FIGURE 2.1 FOR ZONE LOCATIONS)
AEROVOX
0.00—*
FAIRHAVEN
NEW BEDFORD 0.00-
COGGESHALL STREET BRIDGE
0.00
DARTMOUTH
- — RICKETSONS \ w POINT
SMITH . NECK
. y MISHAUM POINT
NEGRO LEDGE
NOT TO SCALE
FIGURE C-23 MAP OF
CHRONIC EFFECTS PROBABILITIES FOR MOLLUSKS, CADMIUM, WATER COLUMN
NEW BEDFORD, MASSACHUSETTS

© (NOTE: REFER TO FIGURE 2.1 FOR ZONE LOCATIONS)
AEROVOX
0.11-
FAIRHAVEN
NEW BEDFORD 0.14*
COGGESHALL STREET BRIDGE
0.10
0.08
DARTMOUTH s X CORNELL - * "UBILIEH
s>
NOT TO SCALE
MISHAUM POINT
LARKS OINT
NEGRO LEDGE
FIGURE C-24 MAP OF
CHRONIC EFFECTS PROBABILITIES FOR CRUSTACEANS, CADMIUM, WATER COLUMN
NEW BEDFORD, MASSACHUSETTS

© (NOTE. BEFEB TO FIGURE 2.1 FOB ZONE LOCATIONS)
AEROVOX
0.01 —
FAIRHAVEN
NEW BEDFORD
DARTMOUTH
. w ' MISHAUM POINT X_/
NEGRO LEDGE
NOT TO SCALE
FIGURE C-25 MAP OF
CHRONIC EFFECTS PROBABILITIES FOR MARINE FISH, CADMIUM, WATER COLUMN
NEW BEDFORD, MASSACHUSETTS

© (NOTE: REFER TO FIGURE 2.1 FOR ZONE LOCATIONS)
AEROVOX
0.01 —
FAIRHAVEN
COGGESHALL STREET BRIDGE
NEW BEDFORD - < ^ / V / - '
» : ^ 0.00
DARTMOUTH
.. ss, RICKETSONS V _ POINT
SMITH NECK
NEGRO LEDGE
. ^ MISHAUM POINT
NOT TO SCALE
FIGURE C-26 MAP OF
CHRONIC EFFECTS PROBABILITIES FOR ALGA, LEAD, WATER COLUMN
NEW BEDFORD, MASSACHUSETTS

© (NOTE: REFER TO FIGURE 2.1 FOR ZONE LOCATIONS)
AEROVOX
0.00—
FAIRHAVEN
NEW BEDFORD . (jr. ^ • ' / - COGGESHALL •• I f SX/. STREET BRIDGE
0.00
DARTMOUTH > W \ CORNELL - J k OUBILIER
^ss , RICKETSONS Y _ POINT
SMITH NECK
LARKS OINT
f a x - * W E S T
ISLAND
NEGRO LEDGE
. V MISHAUM POINT X_/
NOT TO SCALE
FIGURE C-27 MAP OF
CHRONIC EFFECTS PROBABILITIES FOR POLYCHAETES, LEAD, WATER COLUMN
NEW BEDFORD, MASSACHUSETTS

© (NOTE: REFER TO FIGURE 2.1 FOR ZONE LOCATIONS)
AEROVOX
0.00 —
FAIRHAVEN
NEW BEDFORD 0 n n • • • l A i y STREET BRIDGE
0.00
DARTMOUTH
- ss, RlCKETSONS \ w POINT
SMITH NECK
NEGRO LEDGE
S^
NOT TO SCALE
MISHAUM POINT FIGURE C-28
MAP OF CHRONIC EFFECTS PROBABILITIES FOR
MOLLUSKS, LEAD, WATER COLUMN NEW BEDFORD, MASSACHUSETTS

© (NOTE: REFER TO FIGURE 2.1 FOR ZONE LOCATIONS)
AEROVOX
0.18
FAIRHAVEN
NEW BEDFORD
DARTMOUTH
^
NOT TO SCALE
MISHAUM POINT
NEGRO LEDGE
FIGURE C-29 MAP OF
CHRONIC EFFECTS PROBABILITIES FOR CRUSTACEANS, LEAD, WATER COLUMN
NEW BEDFORD, MASSACHUSETTS

© (NOTE: REFER TO FIGURE 2.1 FOR ZONE LOCATIONS)
AEROVOX
0.03
FAIRHAVEN
NEW BEDFORD
DARTMOUTH
NEGRO LE06E
. w MfSHAUM POINT
NOT TO SCALE
FIGURE C-30 MAP OF
CHRONIC EFFECTS PROBABILITIES FOR MARINE FISH, LEAD, WATER COLUMN
NEW BEDFORD, MASSACHUSETTS

#
1.0
0.8 -
>» u S 0.6 0) u. 0) > 0.4 (0 "3 E O 0.2
0.0
ZONE 5 *
ZONE 2 / - ^ POLYCHAET
-2 0 2
Log Copper Concentration, ( ug/l)
MATC FOR POL EECs FOR ALL ZONES, COPPE
NEW BEDFORD, MA

Log Copper Concentration, ( ug/l)
MATC FOR MO EECs FOR ALL ZONES, COPPER
NEW BEDFORD, MAS

Log Copper Concentration, ( ug/l)
MATC FOR CRUS EECs FOR ALL ZONES, COPPER
NEW BEDFORD, MA

Log Copper Concentration, ( ug/l)
MATC FOR MA EECS FOR ALL ZONES, COPPE
NEW BEDFORD, MA

Log Cadmium Concentration, ( ug/l)
MATC FOR POLYC EECS FOR ALL ZONES, CADMIUM,
NEW BEDFORD, MAS

Log Cadmium Concentration, ( ug/l)
MATC FOR M EECS FOR ALL ZONES, CADMIUM
NEW BEDFORD, MA
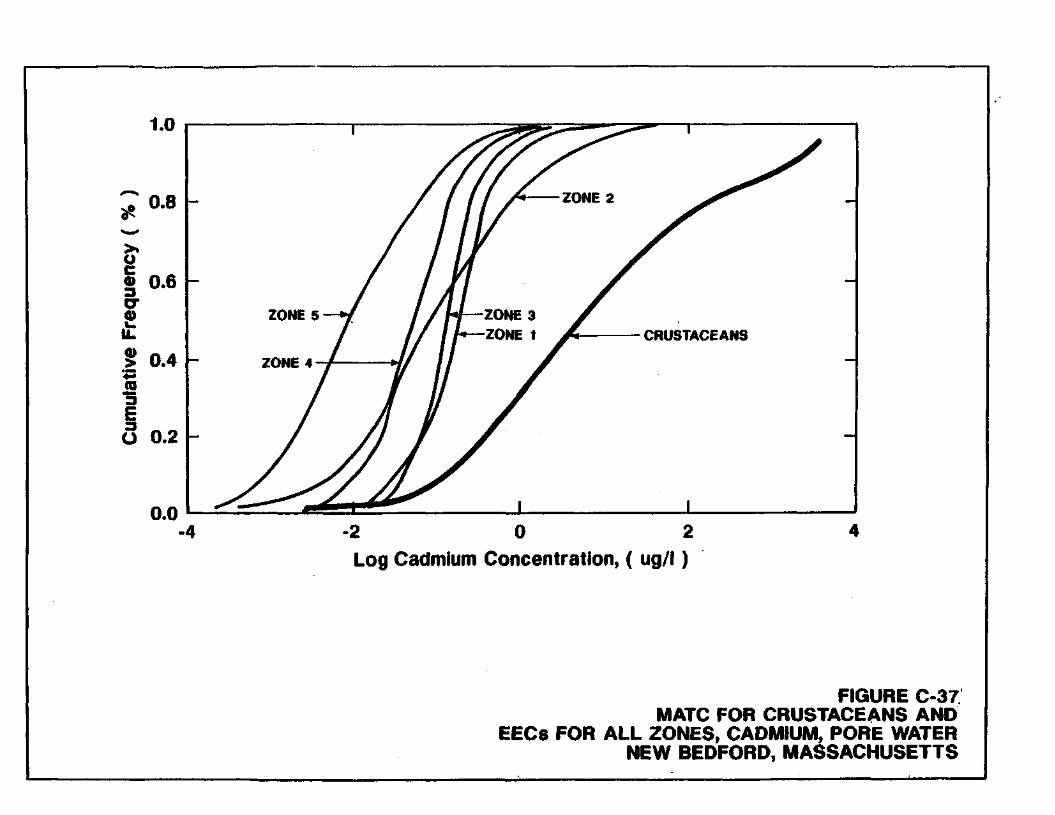
Log Cadmium Concentration, ( ug/l)
MATC FOR CRUS EECs FOR ALL ZONES, CADMIUM
NEW BEDFORD, MAS

Log Cadmium Concentration, ( ug/l)
MATC FOR MA EECS FOR ALL ZONES, CADMIUM
NEW BEDFORD, MA
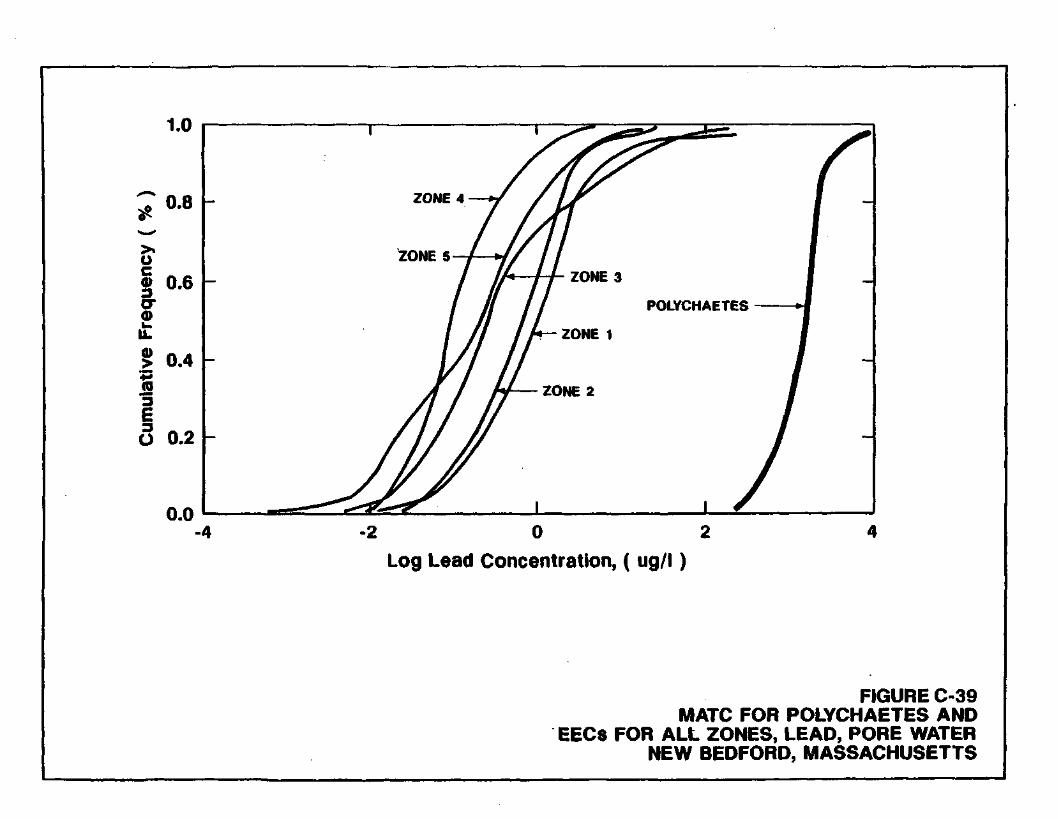
Log Lead Concentration, ( ug/l)
MATC FOR POL EECS FOR ALL ZONES, LEA
NEW BEDFORD, M

1.0
0.8
u | 0.6 cr a> u. u. >
(0 3 E a O
0.4
0.2
0.0
ZONE 4
ZONES
-2 0 2
Log Lead Concentration, ( ug/l )
MATC FOR M EECs FOR ALL ZONES, LEAD
NEW BEDFORD, MA

Log Lead Concentration, ( ug/l)
MATC FOR CRUS EECs FOR ALL ZONES, LEAD
NEW BEDFORD, MA

1.0
0.8
o § 0.6
> 0.4 (0 3 E O 0.2
0.0 -4
ZONE 4
ZONE 5
•2 0 2
Log Lead Concentration, ( ug/l)
MATC FOR MAR EECs FOR ALL ZONES, LEAD
NEW BEDFORD, MAS

(NOTE: REFER TO FIGURE 2.1 FOR ZONE LOCATIONS)
AEROVOX
0.02
FAIRHAVEN
NEW BEDFORD
DARTMOUTH
. V MISHAUM POINT
NEGRO LEDGE
NOT TO SCALE
FIGURE C-43 MAP OF
CHRONIC EFFECTS PROBABILITIES FOR POLYCHAETES, COPPER, PORE WATER
NEW BEDFORD, MASSACHUSETTS

© (NOTE: REFER TO FIGURE 2.1 FOR ZONE LOCATIONS)
AEROVOX
0.05
FAIRHAVEN
NEW BEDFORD
DARTMOUTH
. w M1SHAUM POINT
NEGRO LEDGE
NOT TO SCALE
FIGURE C-44 MAP OF
CHRONIC EFFECTS PROBABILITIES FOR MOLLUSKS, COPPER, PORE WATER NEW BEDFORD, MASSACHUSETTS

© (NOTE: REFER TO FIGURE 2.1 FOR ZONE LOCATIONS)
AEROVOX
0.11
FAIRHAVEN
NEW BEDFORD C0G6ESHALL STREET BRIDGE
DARTMOUTH C \ CORNELL - J k OUBILIER
. VB, RICKETSONS \ w POINT
SMITH . NECK
LARKS OINT
NEGRO LEDGE
. w MISHAUM POINT
NOT TO SCALE
FIGURE C-45 MAP OF
CHRONIC EFFECTS PROBABILITIES FOR CRUSTACEANS, COPPER, PORE WATER
NEW BEDFORD, MASSACHUSETTS

© (NOTE: REFER TO FIGURE 2.1 FOR ZONE LOCATIONS)
AEROVOX
0.02
FAIRHAVEN
NEW BEDFORD
DARTMOUTH
. ^ , MISHAUM POINT
ROCK POINT
NEGRO LEDGE
NOT TO SCALE
FIGURE C-46 MAP OF
CHRONIC EFFECTS PROBABILITIES FOR MARINE FISH, COPPER, PORE WATER
NEW BEDFORD, MASSACHUSETTS

© (NOTE: REFER TO FIGURE 2.1 FOR ZONE LOCATIONS)
AEROVOX
0.00— , J
FAIRHAVEN
NEW BEDFORD 0.00 •
- . « /- COGGESHALL If \%JT. STREET BRIDGE
0.00
DARTMOUTH • > * \ CORNELL • ' - * "JUBILIER
^^, RICKETSONS X ^ POINT
LARKS ©INT
SMITH NECK
NEGRO LEDGE
. w ' MISHAUM POINT
NOT TO SCALE
FIGURE C-47 MAP OF
CHRONIC EFFECTS PROBABILITIES FOR POLYCHAETES, CADMIUM, PORE WATER
NEW BEDFORD, MASSACHUSETTS

© (NOTE: REFER TO FIGURE 2.1 FOR ZONE LOCATIONS)
AEROVOX
0.00-
FAIRHAVEN
NEW BEDFORD
DARTMOUTH
. ^ , MISHAUM POINT
NEGRO LEDGE
NOT TO SCALE
FIGURE C-48 ZONE MAP OF
CHRONIC EFFECTS PROBABILITIES FOR MOLLUSKS, CADMIUM, PORE WATER
NEW BEDFORD, MASSACHUSETTS

© (NOTE: REFER TO FIGURE 2.1 FOR ZONE LOCATIONS)
AEROVOX
0.12-
FAIRHAVEN
NEW BEDFORD 0.013-
COGGESHALL STREET BRIDGE
0.09
0.06
DARTMOUTH . ' ^ O v CORNELL - '-*N~UBILIER
. v MISHAUM POINT
LARKS OINT
NEGRO LEOGE
NOT TO SCALE
FIGURE C-49 MAP OF
CHRONIC EFFECTS PROBABILITIES FOR CRUSTACEANS, CADMIUM, PORE WATER
NEW BEDFORD, MASSACHUSETTS

© (NOTE: REFER TO FIGURE 2.1 FOR ZONE LOCATIONS)
AEROVOX
0.01
FAIRHAVEN
NEW BEDFORD
DARTMOUTH
. y MISHAUM POINT
ROCK POINT
NEGRO LEDGE
NOT TO SCALE
FIGURE C-50 MAP OF
CHRONIC EFFECTS PROBABILITIES FOR MARINE FISH, CADMIUM, PORE WATER
NEW BEDFORD, MASSACHUSETTS

FIGURE C-51 MAP OF
CHRONIC EFFECTS PROBABILITIES FOR POLYCHAETES, LEAD, PORE WATER
NEW BEDFORD, MASSACHUSETTS

© (NOTE: REFER TO FIGURE 2.1 FOR ZONE LOCATIONS)
AEROVOX
0 .01—,
FAIRHAVEN
NEW BEDFORD
DARTMOUTH
. ^ MISHAUM POINT
X_/
ROCK POINT
NEGRO LEDGE
NOT TO SCALE
FIGURE C-52 MAP OF
CHRONIC EFFECTS PROBABILITIES FOR MOLLUSKS, LEAD, PORE WATER
NEW BEDFORD, MASSACHUSETTS
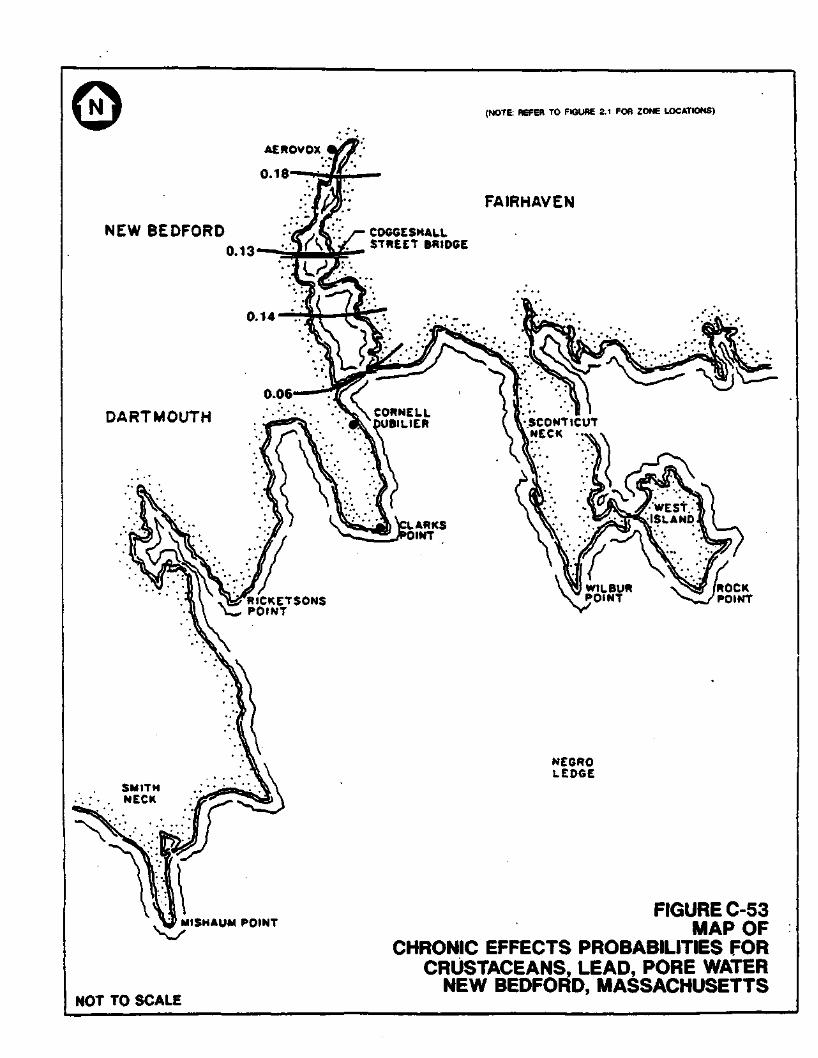
© (NOTE: REFER TO FIGURE 2.1 FOR ZONE LOCATIONS)
AEROVOX
0.18
FAIRHAVEN
NEW BEDFORD
DARTMOUTH
. w ' MISHAUM POINT
NEGRO LEDGE
NOT TO SCALE
FIGURE C-53 MAP OF
CHRONIC EFFECTS PROBABILITIES FOR CRUSTACEANS, LEAD, PORE WATER
NEW BEDFORD, MASSACHUSETTS

© (NOTE: REFER TO FIGURE 2.1 FOR ZONE LOCATIONS)
AEROVOX
0.04 —
FAIRHAVEN
NEW BEDFORD (f,K : ' / - COGGESHALL I • • T r V i y : STREET BRIDGE
DARTMOUTH
. w MISHAUM POINT
NEGRO LEDGE
NOT TO SCALE
FIGURE C-54 MAP OF
CHRONIC EFFECTS PROBABILITIES FOR MARINE FISH, LEAD, PORE WATER NEW BEDFORD, MASSACHUSETTS


