
3 0 T H a n n u a l
S a l a r yBudgetSurve y
2003-2004
About WorldatWork®
WorldatWork is the world’s leading not-for-profit professional association dedicated to knowledge
leadership in compensation, benefits and total rewards. Founded in 1955, WorldatWork focuses on
disciplines associated with attracting, retaining and motivating employees. In addition to providing
professional affiliation, WorldatWork offers highly acclaimed certifications (CCP®, CBPTM and GRP®)
and education programs, the monthly workspan® magazine, online information resources, surveys,
publications, conferences, research and networking opportunities.
WorldatWork Association Headquarters14040 N. Northsight Blvd., Scottsdale, AZ 85260-3601, U.S.A.
• Phone: 480/922-2020 • Toll free: 877/951-9191 • Fax: 480/483-8352ISBN 1-57963-125-8 © 2003 WorldatWork
Structure of the Report ........................................................1Methodology ........................................................................1Industry Data ........................................................................2Respondent Demographics ..................................................3
UNITED STATES – SURVEY HIGHLIGHTS Executive Summary of Trends ..............................................7Salary Budget Increases ........................................................8Percentage of Employees
Receiving a Base Salary Increase......................................11Salary Structure Adjustments ............................................12Promotional Increases ........................................................15Variable Pay, Incentives and Bonuses ................................16Stock/Equity Based Compensation....................................20Attraction and Retention Practices ....................................21Global Comparison – Salary Increases vs.
Rates of Inflation ..............................................................21
National Data
Nonexempt Hourly Nonunion Employees ................25Nonexempt Salaried Employees..................................26Exempt Salaried Employees ........................................27Officer/Executive Level ................................................28Salary Structure Adjustments ......................................29
Central Region
Nonexempt Hourly Nonunion Employees ................30Nonexempt Salaried Employees ..................................31Exempt Salaried Employees ........................................32Officer/Executive Level ................................................33Salary Structure Adjustments ......................................34
Eastern Region
Nonexempt Hourly Nonunion Employees ................35Nonexempt Salaried Employees..................................36Exempt Salaried Employees ........................................37Officer/Executive Level ................................................38Salary Structure Adjustments ......................................39
Southern Region
Nonexempt Hourly Nonunion Employees ................40Nonexempt Salaried Employees ..................................41Exempt Salaried Employees ........................................42Officer/Executive Level ................................................43Salary Structure Adjustments ......................................44
Western Region
Nonexempt Hourly Nonunion Employees ................45Nonexempt Salaried Employees..................................46Exempt Salaried Employees ........................................47Officer/Executive Level ................................................48Salary Structure Adjustments ......................................49
Budgeted Promotional Increases for 2002
As a Percentage of Total Base Salaries ........................50As a Percentage of Total Employee Population ..........51As a Percentage of Promoted Employees’ Base Salary..52
Variable Pay
Nonexempt Hourly Nonunion....................................53Nonexempt Salaried ....................................................54Exempt Salaried ............................................................55Officer/Executive ..........................................................56
CANADA – SURVEY HIGHLIGHTS Executive Summary of Trends............................................57
Salary Budget Increases ......................................................58
Percentage of Employees Receiving a Base Salary Increase ....................................61
Salary Structure Adjustments ............................................62Promotional Increases ........................................................64Variable Pay, Incentives and Bonuses ................................64Stock/Equity-Based Compensation ..................................65Attraction and Retention Practices ....................................66
National Data
Nonmanagement Hourly Nonunion Employees ..........67Nonmanagement Salaried Employees ........................68Management Salaried Employees ................................69Officer/Executive Level ................................................70Salary Structure Adjustments ......................................71
Regional Data......................................................................72
PARTICIPANT LISTINGU.S. Firms ............................................................................75Canadian Firms ..................................................................88
Survey Definitions ..............................................................90
2003-04 Salary Budget Survey questionnaire ......................91
Table of Contents
Table of Figures
Figure A: Industries with Reported Data ............................2
Figure B: Number of Responses ..........................................3
Figure C: 2003 Responses by U.S. Region ..........................3
Figure D: 2003 Responses by Canadian Region ................3
Figure E: U.S. Responses by Industry Classifications..........4
Figure F: Canadian Responses by Industry Classifications......5
UNITED STATES – SURVEY HIGHLIGHTSFigure 1: Salary Budget Increases ........................................8
Figure 2: Salary Budget Trends ............................................9
Figure 3: Salary Budget Increases by Region......................10
Figure 4: Salary Increase Data for Major Industry Groupings, Exempt Employees – Historical ......10
Figure 5: Percent of Employees Receiving a Base Salary Increase ......................................11
Figure 6: Percent of Employees Receiving a Base Salary Increase by Region ....................11
Figure 7: Salary Structure Increases....................................12
Figure 8: Percent of Companies Reporting No (0%) Salary Structure Increase ..................................12
Figure 9: Salary Structure Trends ......................................13
Figure 10: Salary Structure Increases by Region ................13
Figure 11: 10-Year Perspective – Salary and Structure Increases..........................................14
Figure 12: Promotional Increase Budgets ........................15
Figure 13: Promotional Increases ......................................15
Figure 14: Use of Variable Pay ..........................................16
Figure 15: Types of Variable Pay Programs ......................16
Figure 16: 2002-2004 Variable Pay Programs ..................17
Figure 17: 2002-2004 Variable Pay Programs by Region..........................................................18
Figure 18: Types of Stock-Based Incentive Programs Offered by Employee Category ......20
Figure 19: Public Companies: Types of Stock-Based Incentive Programs Offered by Employee Category ......20
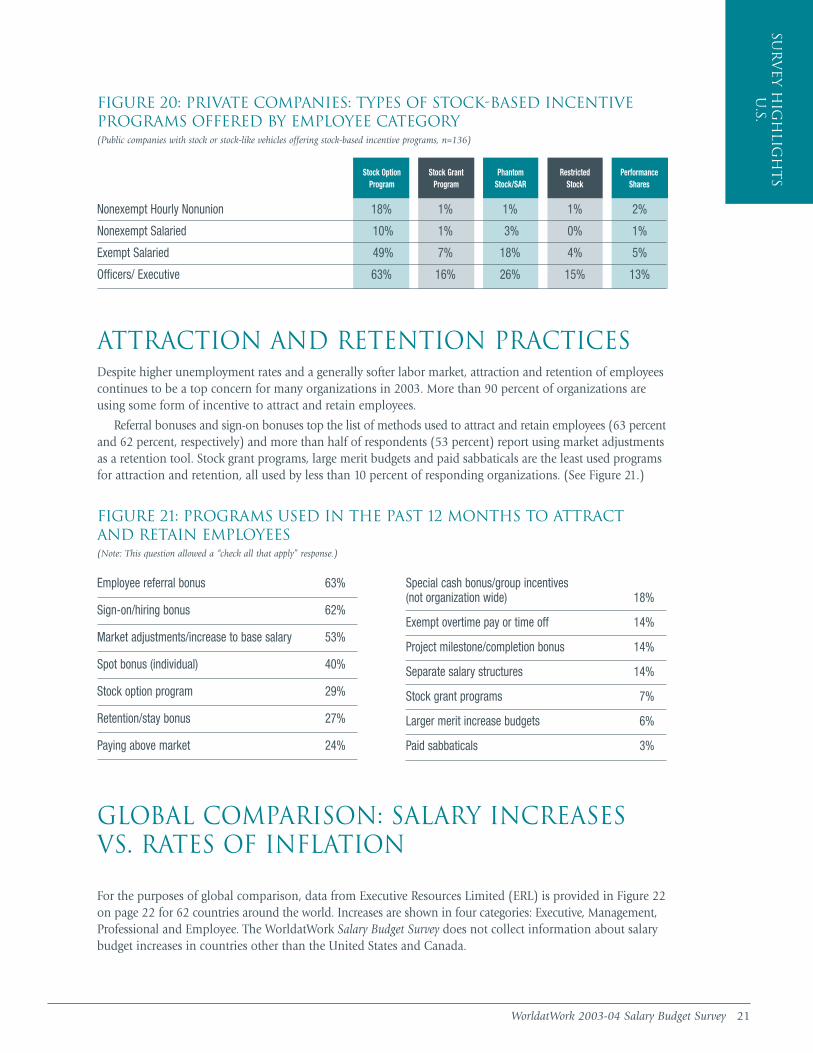
Figure 20: Private Companies: Types of Stock-Based Incentive Programs Offered by Employee Category ......21
Figure 21: Programs Used in the Past 12 Months to Attract and Retain Employees ......................................21
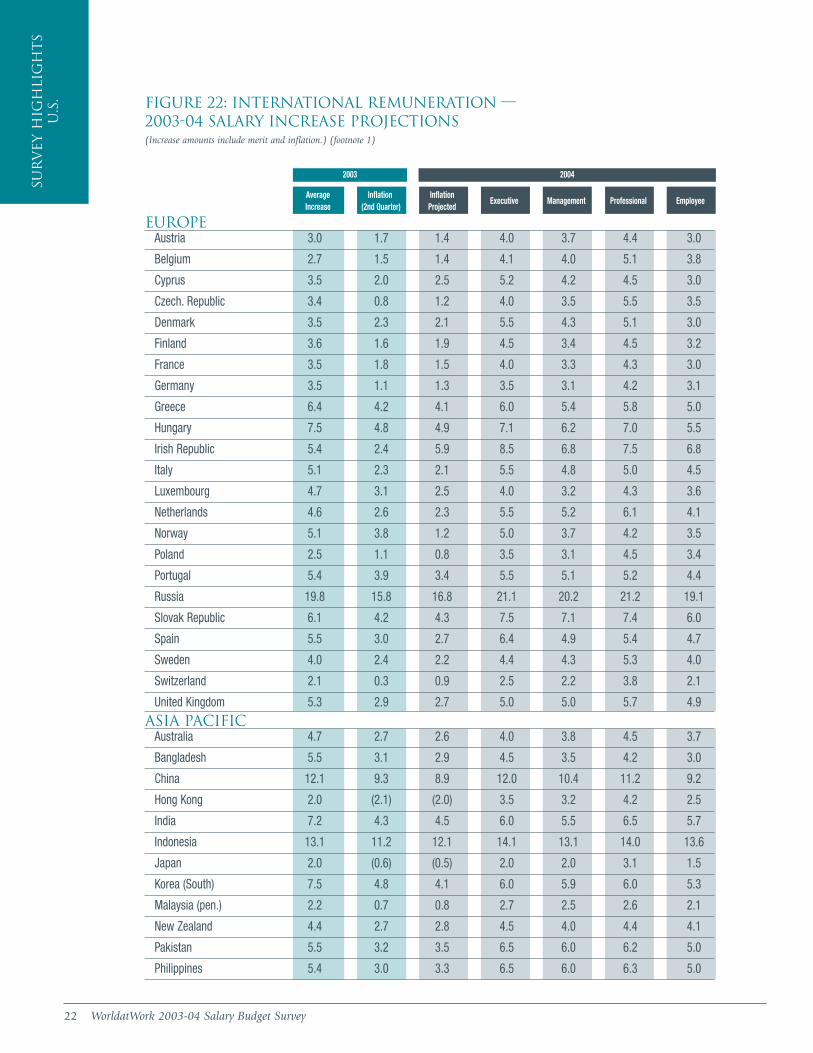
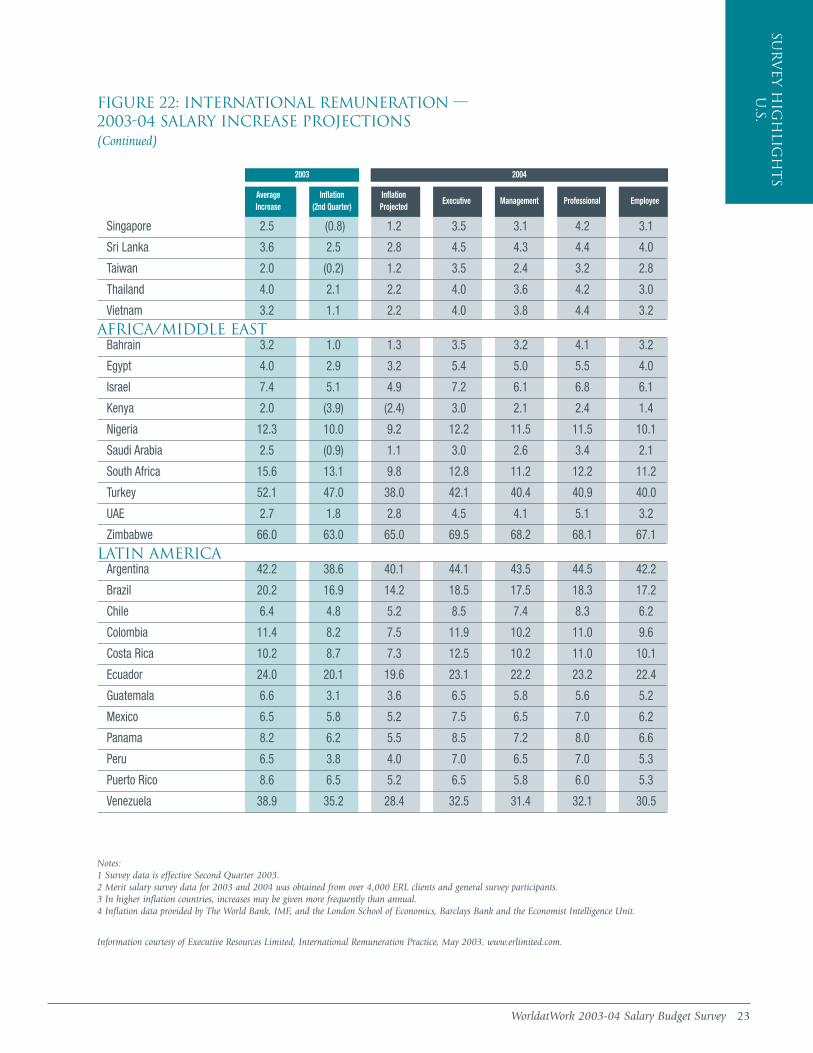
Figure 22: International Remuneration: 2003-04 Salary Increase Projections................................22
CANADA – SURVEY HIGHLIGHTS
Figure C1: Salary Budget Increases ....................................58
Figure C2: Salary Budget Trends ........................................59
Figure C3: Salary Budget Increases by Province................60
Figure C4: Salary Increase Data for Major Industry Groupings, Management Employees – Historical ..........60
Figure C5: Percent of Employees Receiving a Base Salary Increase ......................................61
Figure C6: Percent of Employees Receiving a Base Salary Increase by Province ..................61
Figure C7: Salary Structure Increases ................................62
Figure C8: Salary Structure Trends ....................................62
Figure C9: 10-Year Perspective — Salary and Structure Increases ............................................................63
Figure C10: Promotional Increases....................................64
Figure C11: Types of Variable Pay Programs ....................64
Figure C12: 2002-2004 Variable Pay Programs ................65
Figure C13: Types of Stock-Based Incentive Programs Offered by Employee Category ......................65
Figure C14: Programs Used in the Past 12 Months to Attract and Retain Employees......................................66
WorldatWork 2003-04 Salary Budget Survey 1
Structure of the Report
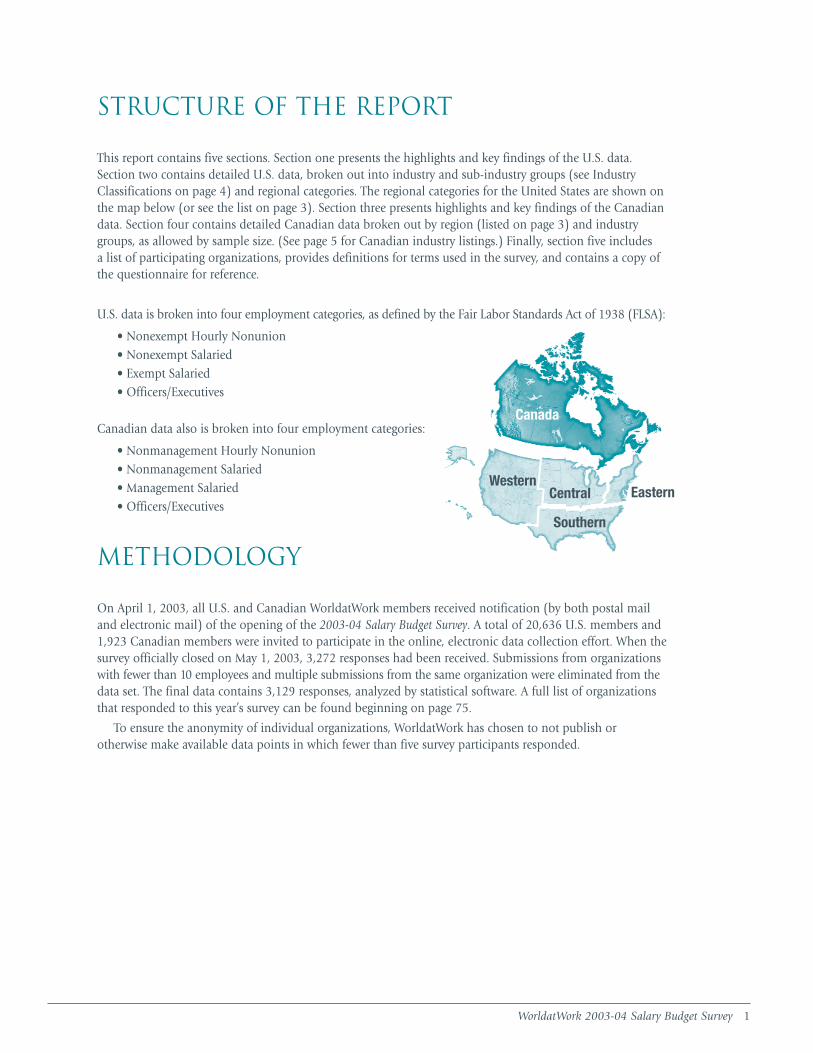
This report contains five sections. Section one presents the highlights and key findings of the U.S. data.Section two contains detailed U.S. data, broken out into industry and sub-industry groups (see Industry Classifications on page 4) and regional categories. The regional categories for the United States are shown onthe map below (or see the list on page 3). Section three presents highlights and key findings of the Canadiandata. Section four contains detailed Canadian data broken out by region (listed on page 3) and industrygroups, as allowed by sample size. (See page 5 for Canadian industry listings.) Finally, section five includes a list of participating organizations, provides definitions for terms used in the survey, and contains a copy ofthe questionnaire for reference.
U.S. data is broken into four employment categories, as defined by the Fair Labor Standards Act of 1938 (FLSA):
• Nonexempt Hourly Nonunion• Nonexempt Salaried• Exempt Salaried• Officers/Executives
Canadian data also is broken into four employment categories:
• Nonmanagement Hourly Nonunion• Nonmanagement Salaried• Management Salaried• Officers/Executives
Methodology
On April 1, 2003, all U.S. and Canadian WorldatWork members received notification (by both postal mailand electronic mail) of the opening of the 2003-04 Salary Budget Survey. A total of 20,636 U.S. members and1,923 Canadian members were invited to participate in the online, electronic data collection effort. When thesurvey officially closed on May 1, 2003, 3,272 responses had been received. Submissions from organizationswith fewer than 10 employees and multiple submissions from the same organization were eliminated from thedata set. The final data contains 3,129 responses, analyzed by statistical software. A full list of organizations that responded to this year’s survey can be found beginning on page 75.
To ensure the anonymity of individual organizations, WorldatWork has chosen to not publish or otherwise make available data points in which fewer than five survey participants responded.
Canada
Central Eastern
Southern
Western
2 WorldatWork 2003-04 Salary Budget Survey
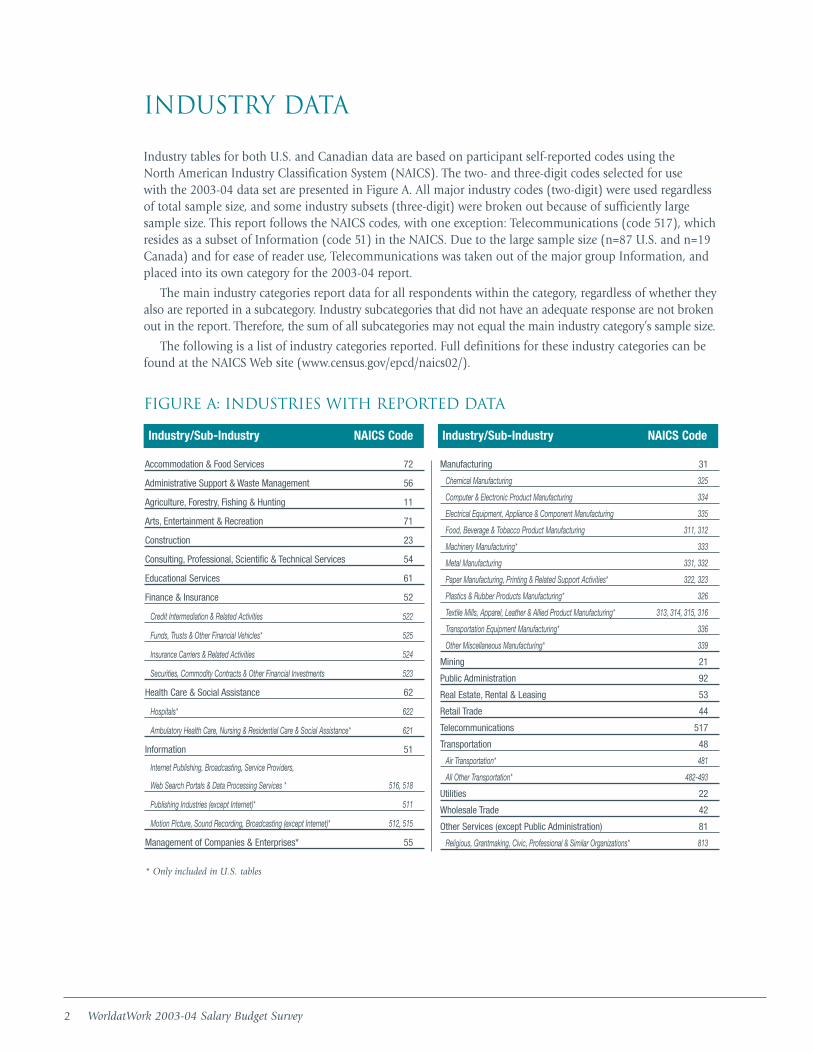
Industry Data
Industry tables for both U.S. and Canadian data are based on participant self-reported codes using the North American Industry Classification System (NAICS). The two- and three-digit codes selected for use with the 2003-04 data set are presented in Figure A. All major industry codes (two-digit) were used regardlessof total sample size, and some industry subsets (three-digit) were broken out because of sufficiently large sample size. This report follows the NAICS codes, with one exception: Telecommunications (code 517), whichresides as a subset of Information (code 51) in the NAICS. Due to the large sample size (n=87 U.S. and n=19Canada) and for ease of reader use, Telecommunications was taken out of the major group Information, andplaced into its own category for the 2003-04 report.
The main industry categories report data for all respondents within the category, regardless of whether theyalso are reported in a subcategory. Industry subcategories that did not have an adequate response are not brokenout in the report. Therefore, the sum of all subcategories may not equal the main industry category’s sample size.
The following is a list of industry categories reported. Full definitions for these industry categories can befound at the NAICS Web site (www.census.gov/epcd/naics02/).
FIGURE A: INDUSTRIES WITH REPORTED DATA
Accommodation & Food Services 72
Administrative Support & Waste Management 56
Agriculture, Forestry, Fishing & Hunting 11
Arts, Entertainment & Recreation 71
Construction 23
Consulting, Professional, Scientific & Technical Services 54
Educational Services 61
Finance & Insurance 52
Credit Intermediation & Related Activities 522
Funds, Trusts & Other Financial Vehicles* 525
Insurance Carriers & Related Activities 524
Securities, Commodity Contracts & Other Financial Investments 523
Health Care & Social Assistance 62
Hospitals* 622
Ambulatory Health Care, Nursing & Residential Care & Social Assistance* 621
Information 51
Internet Publishing, Broadcasting, Service Providers,
Web Search Portals & Data Processing Services * 516, 518
Publishing Industries (except Internet)* 511
Motion Picture, Sound Recording, Broadcasting (except Internet)* 512, 515
Management of Companies & Enterprises* 55
* Only included in U.S. tables
Manufacturing 31
Chemical Manufacturing 325
Computer & Electronic Product Manufacturing 334
Electrical Equipment, Appliance & Component Manufacturing 335
Food, Beverage & Tobacco Product Manufacturing 311, 312
Machinery Manufacturing* 333
Metal Manufacturing 331, 332
Paper Manufacturing, Printing & Related Support Activities* 322, 323
Plastics & Rubber Products Manufacturing* 326
Textile Mills, Apparel, Leather & Allied Product Manufacturing* 313, 314, 315, 316
Transportation Equipment Manufacturing* 336
Other Miscellaneous Manufacturing* 339
Mining 21
Public Administration 92
Real Estate, Rental & Leasing 53
Retail Trade 44
Telecommunications 517
Transportation 48
Air Transportation* 481
All Other Transportation* 482-493
Utilities 22
Wholesale Trade 42
Other Services (except Public Administration) 81
Religious, Grantmaking, Civic, Professional & Similar Organizations* 813
Industry/Sub-Industry NAICS Code Industry/Sub-Industry NAICS Code
WorldatWork 2003-04 Salary Budget Survey 3
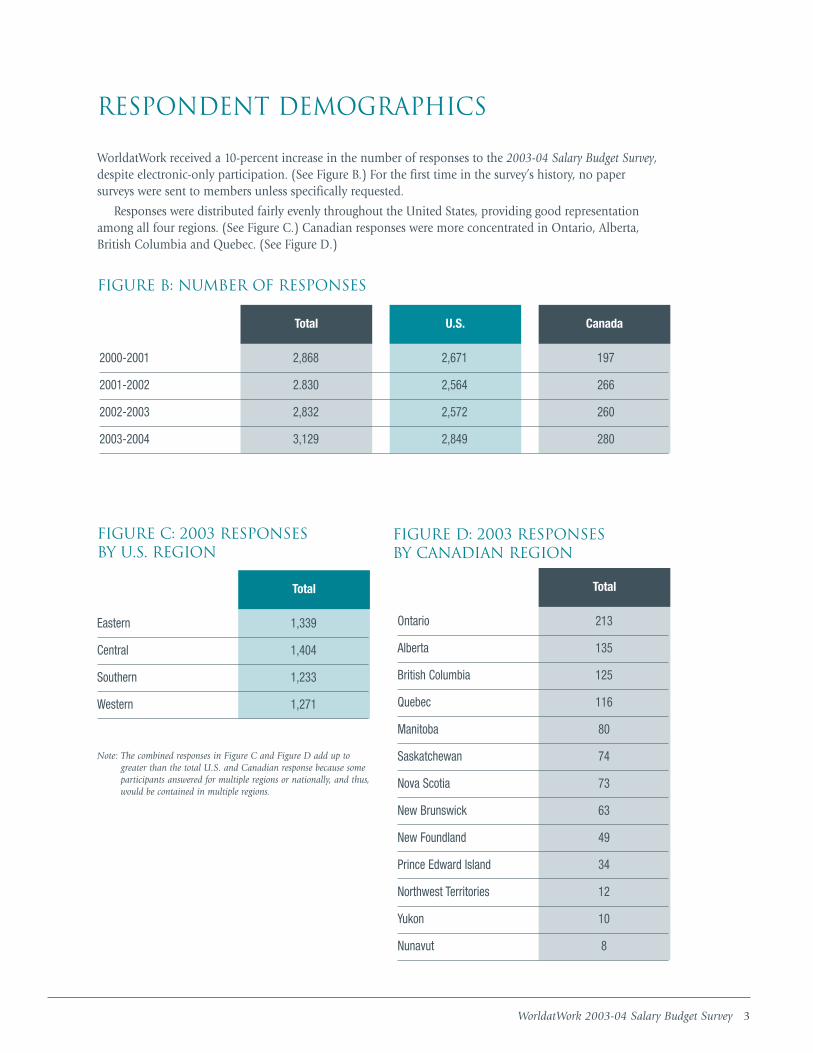
Respondent Demographics
WorldatWork received a 10-percent increase in the number of responses to the 2003-04 Salary Budget Survey,despite electronic-only participation. (See Figure B.) For the first time in the survey’s history, no paper surveys were sent to members unless specifically requested.
Responses were distributed fairly evenly throughout the United States, providing good representationamong all four regions. (See Figure C.) Canadian responses were more concentrated in Ontario, Alberta,British Columbia and Quebec. (See Figure D.)
FIGURE B: NUMBER OF RESPONSES
2000-2001 2,868 2,671 197
2001-2002 2.830 2,564 266
2002-2003 2,832 2,572 260
2003-2004 3,129 2,849 280
Total U.S. Canada
FIGURE C: 2003 RESPONSES BY U.S. REGION
Eastern 1,339
Central 1,404
Southern 1,233
Western 1,271
Total
FIGURE D: 2003 RESPONSES BY CANADIAN REGION
Ontario 213
Alberta 135
British Columbia 125
Quebec 116
Manitoba 80
Saskatchewan 74
Nova Scotia 73
New Brunswick 63
New Foundland 49
Prince Edward Island 34
Northwest Territories 12
Yukon 10
Nunavut 8
Total
Note: The combined responses in Figure C and Figure D add up togreater than the total U.S. and Canadian response because someparticipants answered for multiple regions or nationally, and thus,would be contained in multiple regions.

4 WorldatWork 2003-04 Salary Budget Survey
IndustryNAICS nPercent
of Respondents
Respondents self-classified using the North American Industry Classification System (NAICS).
FIGURE E: U.S. RESPONSES BY INDUSTRY CLASSIFICATIONS
31 Manufacturing 819 28.7%
52 Finance & Insurance 416 14.6%
51 Information (including Telecommunications) 255 9.0%
62 Health Care & Social Assistance 248 8.7%
54 Consulting, Professional, Scientific & Technical Services 236 8.3%
44 Retail Trade 131 4.6%
92 Public Administration 127 4.5%
61 Educational Services 104 3.7%
22 Utilities 103 3.6%
48 Transportation 79 2.8%
42 Wholesale Trade 75 2.6%
81 Other Services (except Public Administration) 49 1.7%
56 Administrative & Support & Waste Management & Remediation 38 1.3%
53 Real Estate & Rental & Leasing 35 1.2%
21 Mining 30 1.1%
72 Accommodation & Food Services 26 0.9%
23 Construction 24 0.8%
71 Arts, Entertainment & Recreation 23 0.8%
55 Management of Companies & Enterprises 18 0.6%
11 Agriculture, Forestry, Fishing & Hunting 13 0.5%
WorldatWork 2003-04 Salary Budget Survey 5
IndustryNAICS nPercent
of Respondents
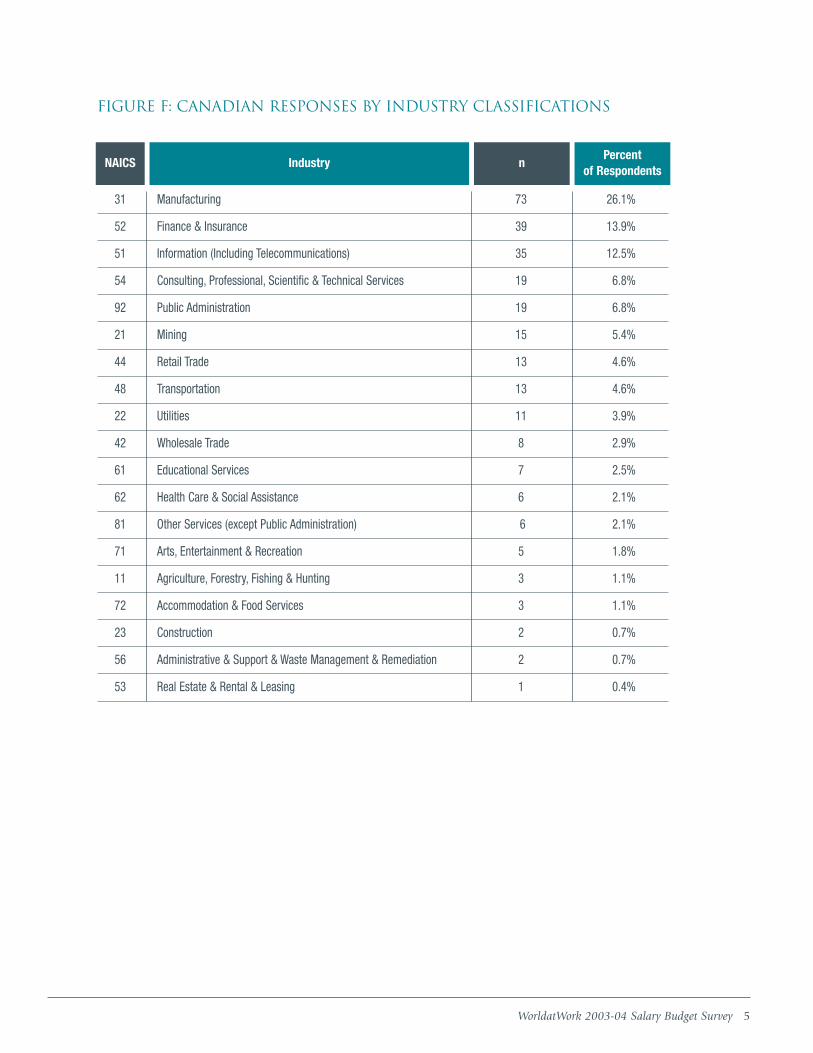
FIGURE F: CANADIAN RESPONSES BY INDUSTRY CLASSIFICATIONS
31 Manufacturing 73 26.1%
52 Finance & Insurance 39 13.9%
51 Information (Including Telecommunications) 35 12.5%
54 Consulting, Professional, Scientific & Technical Services 19 6.8%
92 Public Administration 19 6.8%
21 Mining 15 5.4%
44 Retail Trade 13 4.6%
48 Transportation 13 4.6%
22 Utilities 11 3.9%
42 Wholesale Trade 8 2.9%
61 Educational Services 7 2.5%
62 Health Care & Social Assistance 6 2.1%
81 Other Services (except Public Administration) 6 2.1%
71 Arts, Entertainment & Recreation 5 1.8%
11 Agriculture, Forestry, Fishing & Hunting 3 1.1%
72 Accommodation & Food Services 3 1.1%
23 Construction 2 0.7%
56 Administrative & Support & Waste Management & Remediation 2 0.7%
53 Real Estate & Rental & Leasing 1 0.4%

6 WorldatWork 2003-04 Salary Budget Survey
WorldatWork 2003-04 Salary Budget Survey 7
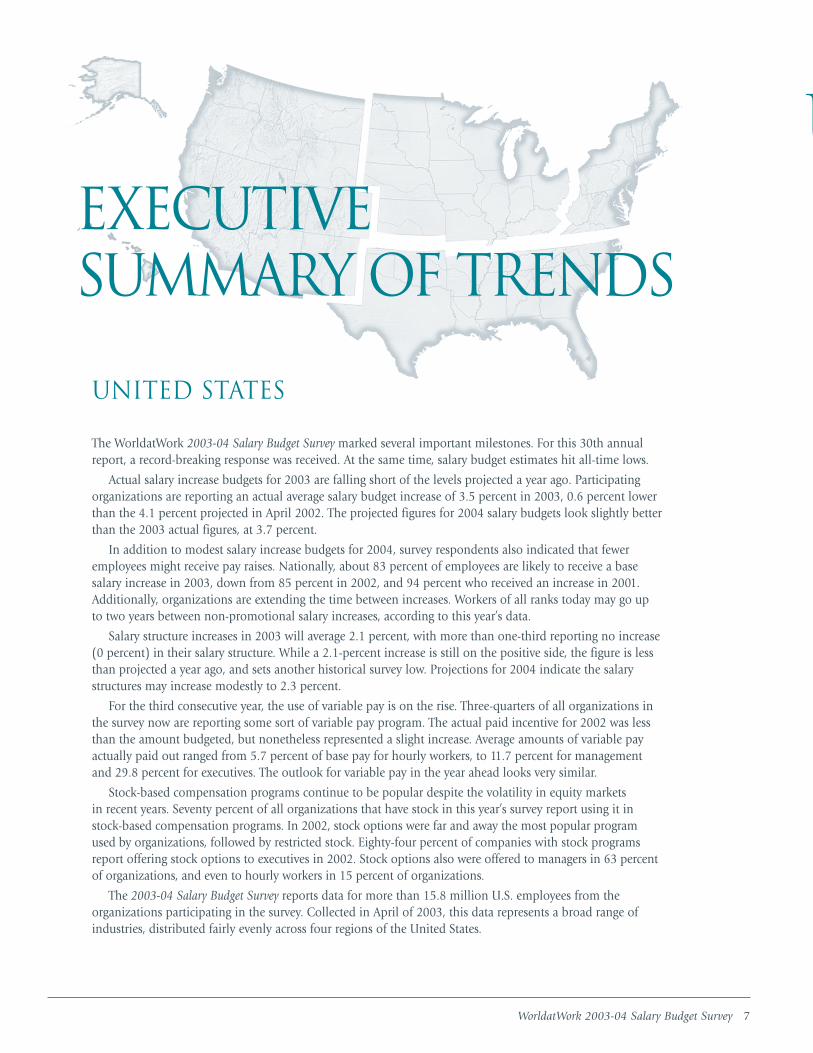
Executive Summary of Trends
United States
The WorldatWork 2003-04 Salary Budget Survey marked several important milestones. For this 30th annualreport, a record-breaking response was received. At the same time, salary budget estimates hit all-time lows.
Actual salary increase budgets for 2003 are falling short of the levels projected a year ago. Participatingorganizations are reporting an actual average salary budget increase of 3.5 percent in 2003, 0.6 percent lowerthan the 4.1 percent projected in April 2002. The projected figures for 2004 salary budgets look slightly betterthan the 2003 actual figures, at 3.7 percent.
In addition to modest salary increase budgets for 2004, survey respondents also indicated that feweremployees might receive pay raises. Nationally, about 83 percent of employees are likely to receive a basesalary increase in 2003, down from 85 percent in 2002, and 94 percent who received an increase in 2001.Additionally, organizations are extending the time between increases. Workers of all ranks today may go up to two years between non-promotional salary increases, according to this year’s data.
Salary structure increases in 2003 will average 2.1 percent, with more than one-third reporting no increase(0 percent) in their salary structure. While a 2.1-percent increase is still on the positive side, the figure is lessthan projected a year ago, and sets another historical survey low. Projections for 2004 indicate the salary structures may increase modestly to 2.3 percent.
For the third consecutive year, the use of variable pay is on the rise. Three-quarters of all organizations inthe survey now are reporting some sort of variable pay program. The actual paid incentive for 2002 was lessthan the amount budgeted, but nonetheless represented a slight increase. Average amounts of variable payactually paid out ranged from 5.7 percent of base pay for hourly workers, to 11.7 percent for management and 29.8 percent for executives. The outlook for variable pay in the year ahead looks very similar.
Stock-based compensation programs continue to be popular despite the volatility in equity markets in recent years. Seventy percent of all organizations that have stock in this year’s survey report using it in stock-based compensation programs. In 2002, stock options were far and away the most popular program used by organizations, followed by restricted stock. Eighty-four percent of companies with stock programsreport offering stock options to executives in 2002. Stock options also were offered to managers in 63 percentof organizations, and even to hourly workers in 15 percent of organizations.
The 2003-04 Salary Budget Survey reports data for more than 15.8 million U.S. employees from the organizations participating in the survey. Collected in April of 2003, this data represents a broad range ofindustries, distributed fairly evenly across four regions of the United States.
U
8 WorldatWork 2003-04 Salary Budget Survey
Salary Budget Increases
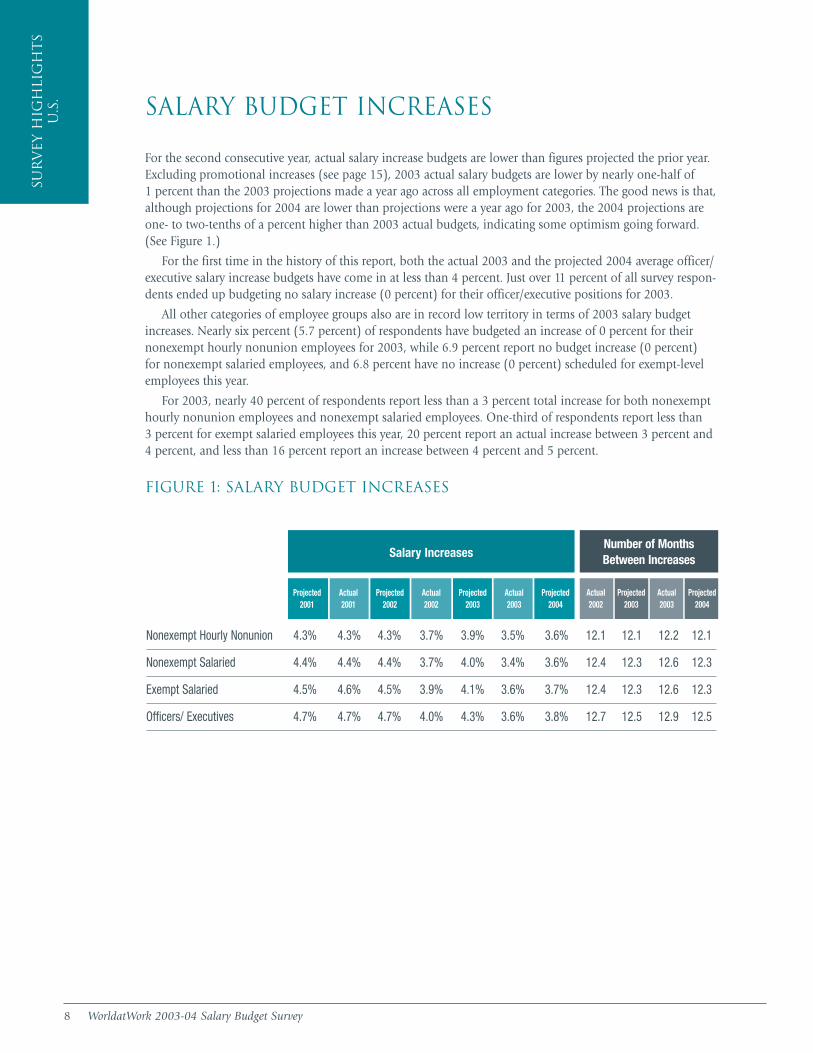
For the second consecutive year, actual salary increase budgets are lower than figures projected the prior year.Excluding promotional increases (see page 15), 2003 actual salary budgets are lower by nearly one-half of 1 percent than the 2003 projections made a year ago across all employment categories. The good news is that,although projections for 2004 are lower than projections were a year ago for 2003, the 2004 projections areone- to two-tenths of a percent higher than 2003 actual budgets, indicating some optimism going forward.(See Figure 1.)
For the first time in the history of this report, both the actual 2003 and the projected 2004 average officer/executive salary increase budgets have come in at less than 4 percent. Just over 11 percent of all survey respon-dents ended up budgeting no salary increase (0 percent) for their officer/executive positions for 2003.
All other categories of employee groups also are in record low territory in terms of 2003 salary budgetincreases. Nearly six percent (5.7 percent) of respondents have budgeted an increase of 0 percent for theirnonexempt hourly nonunion employees for 2003, while 6.9 percent report no budget increase (0 percent) for nonexempt salaried employees, and 6.8 percent have no increase (0 percent) scheduled for exempt-levelemployees this year.
For 2003, nearly 40 percent of respondents report less than a 3 percent total increase for both nonexempthourly nonunion employees and nonexempt salaried employees. One-third of respondents report less than 3 percent for exempt salaried employees this year, 20 percent report an actual increase between 3 percent and4 percent, and less than 16 percent report an increase between 4 percent and 5 percent.
Figure 1: Salary Budget Increases
Nonexempt Hourly Nonunion 4.3% 4.3% 4.3% 3.7% 3.9% 3.5% 3.6% 12.1 12.1 12.2 12.1
Nonexempt Salaried 4.4% 4.4% 4.4% 3.7% 4.0% 3.4% 3.6% 12.4 12.3 12.6 12.3
Exempt Salaried 4.5% 4.6% 4.5% 3.9% 4.1% 3.6% 3.7% 12.4 12.3 12.6 12.3
Officers/ Executives 4.7% 4.7% 4.7% 4.0% 4.3% 3.6% 3.8% 12.7 12.5 12.9 12.5
Number of MonthsBetween IncreasesSalary Increases
Projected2001
Actual 2001
Projected2002
Actual 2002
Projected2003
Actual 2003
Projected2004
Actual2002
Projected2003
Actual2003
Projected2004
Sur
vey H
igh
lig
ht
sU
.S.

The 2003-04 Salary Budget Survey is the 30th annual WorldatWork salary budget survey, and marks the lowesttotal salary budget increase levels in the history of the survey. It also should be noted that inflation (measuredby Consumer Price Index, or CPI) is at some of the lowest levels in many years. Figure 2 shows the 30-year his-tory of salary budget trends, and Figure 11 on page 14 puts these trends into context with the CPI.
FIGURE 2: SALARY BUDGET TRENDS
Nonexempt HourlyNonunion
WorldatWork 2003-04 Salary Budget Survey 9
1974 - 10.1 9.9 9.0
1975 - 9.4 8.9 8.6
1976 - 8.4 8.2 8.2
1977 - 8.4 8.2 8.4
1978 - 8.5 8.4 8.5
1979 - 8.2 8.0 7.8
1980 - 10.1 9.9 9.7
1981 - 10.6 10.5 10.6
1982 - 9.1 9.1 8.9
1983 - 6.8 6.9 6.9
1984 - 6.4 6.5 6.8
1985 - 6.2 6.4 6.7
1986 - 5.7 5.9 6.3
1987 - 5.0 5.2 5.5
1988 - 5.1 5.2 5.6
1989 - 5.2 5.4 5.7
1990 - 5.4 5.5 5.8
1991 - 5.0 5.0 5.1
1992 - 4.6 4.7 4.8
1993 - 4.2 4.3 4.4
1994 - 4.0 4.0 4.1
1995 - 3.9 4.0 4.1
1996 3.8 4.0 4.1 4.3
1997 4.1 4.1 4.3 4.5
1998 4.1 4.2 4.5 4.6
1999 4.1 4.2 4.4 4.5
2000 4.3 4.4 4.6 4.8
2001 4.3 4.4 4.6 4.7
2002 3.7 3.7 3.9 4.0
2003 3.5 3.4 3.6 3.6
2004 Projected 3.6 3.6 3.7 3.8
Nonexempt Salaried Exempt Salaried Officers/ Executives
Sur
vey H
igh
ligh
ts
U.S.
10 WorldatWork 2003-04 Salary Budget Survey
Sur
vey H
igh
lig
ht
sU
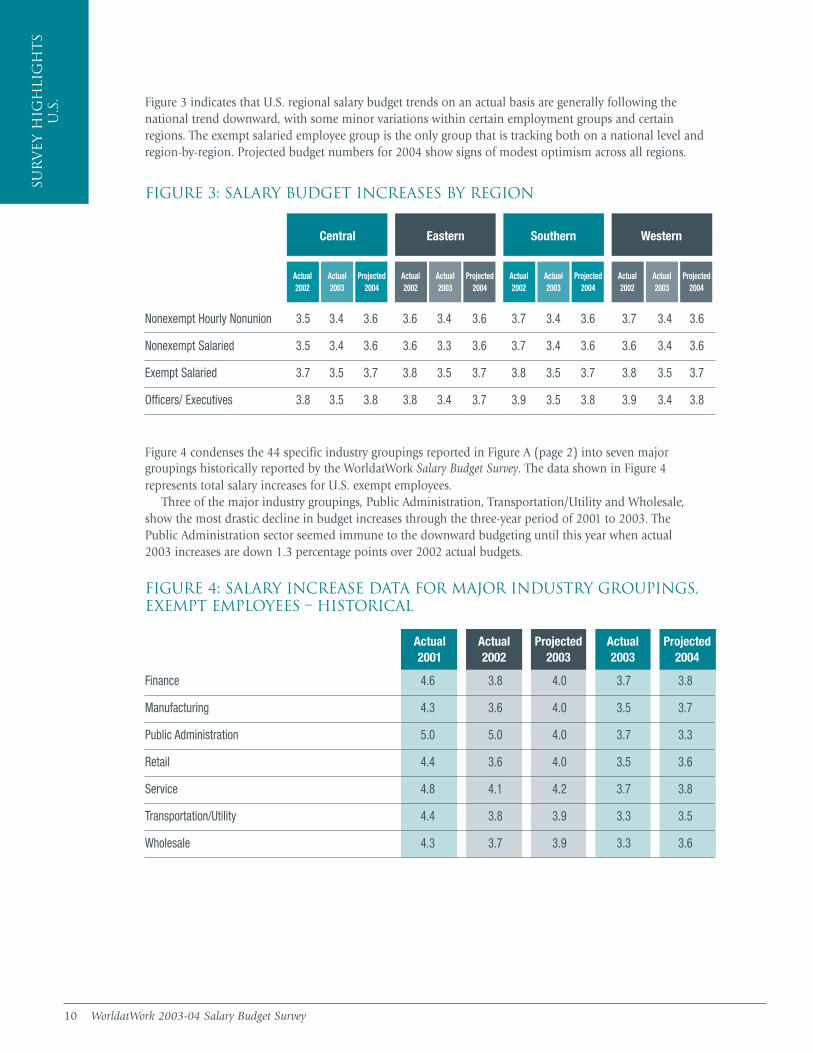
.S. Figure 3 indicates that U.S. regional salary budget trends on an actual basis are generally following the
national trend downward, with some minor variations within certain employment groups and certainregions. The exempt salaried employee group is the only group that is tracking both on a national level andregion-by-region. Projected budget numbers for 2004 show signs of modest optimism across all regions.
FIGURE 3: SALARY BUDGET INCREASES BY REGION
Nonexempt Hourly Nonunion 3.5 3.4 3.6 3.6 3.4 3.6 3.7 3.4 3.6 3.7 3.4 3.6
Nonexempt Salaried 3.5 3.4 3.6 3.6 3.3 3.6 3.7 3.4 3.6 3.6 3.4 3.6
Exempt Salaried 3.7 3.5 3.7 3.8 3.5 3.7 3.8 3.5 3.7 3.8 3.5 3.7
Officers/ Executives 3.8 3.5 3.8 3.8 3.4 3.7 3.9 3.5 3.8 3.9 3.4 3.8
Central Eastern Southern Western
Actual2002
Actual2003
Projected2004
Actual2002
Actual2003
Projected2004
Actual2002
Actual2003
Projected2004
Actual2002
Actual2003
Projected2004
Figure 4 condenses the 44 specific industry groupings reported in Figure A (page 2) into seven major groupings historically reported by the WorldatWork Salary Budget Survey. The data shown in Figure 4 represents total salary increases for U.S. exempt employees.
Three of the major industry groupings, Public Administration, Transportation/Utility and Wholesale,show the most drastic decline in budget increases through the three-year period of 2001 to 2003. The Public Administration sector seemed immune to the downward budgeting until this year when actual 2003 increases are down 1.3 percentage points over 2002 actual budgets.
FIGURE 4: SALARY INCREASE DATA FOR MAJOR INDUSTRY GROUPINGS,EXEMPT EMPLOYEES – HISTORICAL
Finance 4.6 3.8 4.0 3.7 3.8
Manufacturing 4.3 3.6 4.0 3.5 3.7
Public Administration 5.0 5.0 4.0 3.7 3.3
Retail 4.4 3.6 4.0 3.5 3.6
Service 4.8 4.1 4.2 3.7 3.8
Transportation/Utility 4.4 3.8 3.9 3.3 3.5
Wholesale 4.3 3.7 3.9 3.3 3.6
Actual2001
Actual2002
Projected2003
Actual2003
Projected2004
WorldatWork 2003-04 Salary Budget Survey 11
Percent of Employees Receiving a Base Salary Increase
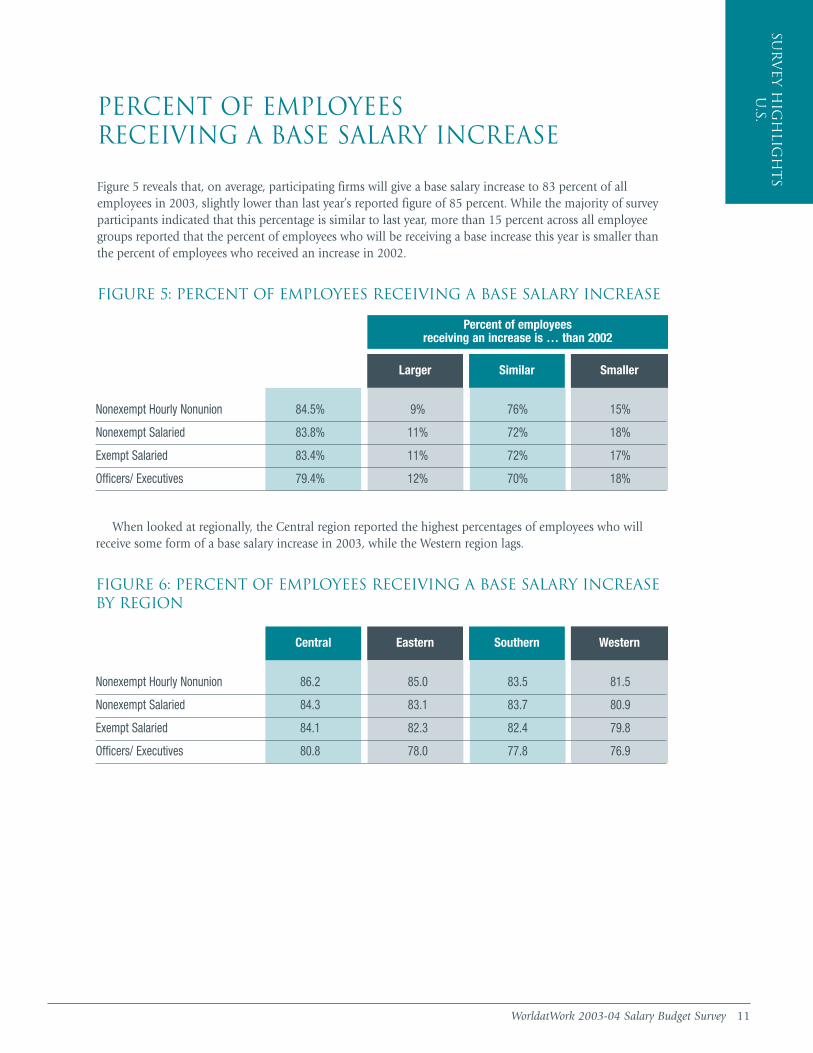
Figure 5 reveals that, on average, participating firms will give a base salary increase to 83 percent of allemployees in 2003, slightly lower than last year’s reported figure of 85 percent. While the majority of surveyparticipants indicated that this percentage is similar to last year, more than 15 percent across all employeegroups reported that the percent of employees who will be receiving a base increase this year is smaller thanthe percent of employees who received an increase in 2002.
FIGURE 5: PERCENT OF EMPLOYEES RECEIVING A BASE SALARY INCREASE
Sur
vey H
igh
ligh
ts
U.S.
Percent of employees receiving an increase is … than 2002
Larger Similar Smaller
Nonexempt Hourly Nonunion 84.5% 9% 76% 15%
Nonexempt Salaried 83.8% 11% 72% 18%
Exempt Salaried 83.4% 11% 72% 17%
Officers/ Executives 79.4% 12% 70% 18%
When looked at regionally, the Central region reported the highest percentages of employees who willreceive some form of a base salary increase in 2003, while the Western region lags.
FIGURE 6: PERCENT OF EMPLOYEES RECEIVING A BASE SALARY INCREASEBY REGION
Eastern Southern Western
Nonexempt Hourly Nonunion 86.2 85.0 83.5 81.5
Nonexempt Salaried 84.3 83.1 83.7 80.9
Exempt Salaried 84.1 82.3 82.4 79.8
Officers/ Executives 80.8 78.0 77.8 76.9
Central

12 WorldatWork 2003-04 Salary Budget Survey
Sur
vey H
igh
lig
ht
sU
.S. Salary Structure Adjustments
Salary structures refer to a schedule of formal salary ranges with established minimums and maximums.Organizations frequently have a control point (often the midpoint) within each salary range. As a general rule,the numbers displayed below refer to the percentage increase in the salary structure pay line encompassing all salary range control points.
Figure 7 shows that 2003 actual salary structure increases are not only down from the projections made a year ago, but mark record lows across all employment categories. A significant number of organizations(including 28 percent in nonexempt salaried and 37 percent in officers/executives) reported 0 increase to theirstructure in 2003. (See Figure 8.) The average structure adjustments kept nearly identical pace with the U.S.CPI, which increased 2.2 percent in the 12 months ending April 2003. Projections for 2004 suggest a slightincrease in structure movement compared to actual 2003. (See Figure 9 on page 13.)
Noteworthy among major industry groups is the Accommodation and Food Services industry, which reportedsignificantly higher structure adjustments (2.7 percent to 3.4 percent) for 2003. The Air Transportation industryreported very low structure adjustments (0.9 percent to 1.4 percent).
FIGURE 7: SALARY STRUCTURE INCREASES
Nonexempt Hourly Nonunion 2.9% 3.0% 3.0% 2.3% 2.6% 2.0% 2.2%
Nonexempt Salaried 3.0% 3.1% 3.0% 2.4% 2.7% 2.3% 2.4%
Exempt Salaried 3.1% 3.2% 3.1% 2.5% 2.8% 2.1% 2.4%
Officers/Executive 3.1% 3.0% 3.1% 2.4% 2.7% 2.2% 2.3%
2001 Projected
2001 Actual
2002 Projected
2002 Actual
2003 Projected
2003 Actual
2004 Projected
FIGURE 8: PERCENT OF COMPANIES REPORTING NO (0%) SALARY STRUCTURE INCREASE
2003 Projected 2003 Actual 2004 Projected
Nonexempt Hourly Nonunion 29% 15% 34% 21%
Nonexempt Salaried 25% 11% 28% 17%
Exempt Salaried 25% 12% 31% 18%
Officers/Executive 31% 15% 37% 22%
2002 Actual

FIGURE 9: SALARY STRUCTURE TRENDS
WorldatWork 2003-04 Salary Budget Survey 13
Sur
vey H
igh
ligh
ts
U.S.
Nonexempt Salaried Exempt Salaried Officers/Executives
1992 - 3.0% 3.2% 3.1%
1993 - 2.7% 2.8% 2.7%
1994 - 2.4% 2.5% 2.5%
1995 - 2.3% 2.4% 2.4%
1996 2.7% 2.8% 2.9% 3.0%
1997 2.5% 2.5% 2.7% 2.6%
1998 2.6% 2.7% 2.9% 2.7%
1999 2.6% 2.7% 2.9% 2.7%
2000 2.8% 2.8% 3.0% 2.9%
2001 3.0% 3.1% 3.2% 3.0%
2002 2.3% 2.4% 2.5% 2.4%
2003 2.0% 2.3% 2.1% 2.2%
2004 Projected 2.2% 2.4% 2.4% 2.3%
NonexemptHourly Nonunion
Year
FIGURE 10: SALARY STRUCTURE INCREASES BY REGION
Nonexempt Hourly Nonunion 1.9 2.3 1.9 2.2 1.9 2.2 1.8 2.2
Nonexempt Salaried 2.1 2.4 2.2 2.4 2.1 2.4 2.1 2.4
Exempt Salaried 2.1 2.4 2.1 2.4 2.1 2.4 2.0 2.4
Officers/ Executives 2.1 2.4 2.1 2.3 2.0 2.3 2.0 2.3
Central Eastern Southern Western
Actual2003
Projected 2004
Actual2003
Projected 2004
Actual2003
Projected 2004
Actual2003
Projected 2004
14 WorldatWork 2003-04 Salary Budget Survey
Sur
vey H
igh
lig
ht
sU
.S. FIGURE 11: 10-YEAR PERSPECTIVE — SALARY AND STRUCTURE INCREASES
1994 1995 1996 1997 1998 1999 2000 2001 2002 2003 2004projected
0
1.0
2.0
3.0
4.0
5.0
0.5
1.5
2.5
3.5
4.5
1994 1995 1996 1997 1998 1999 2000 2001 2002 2003 2004 Projected
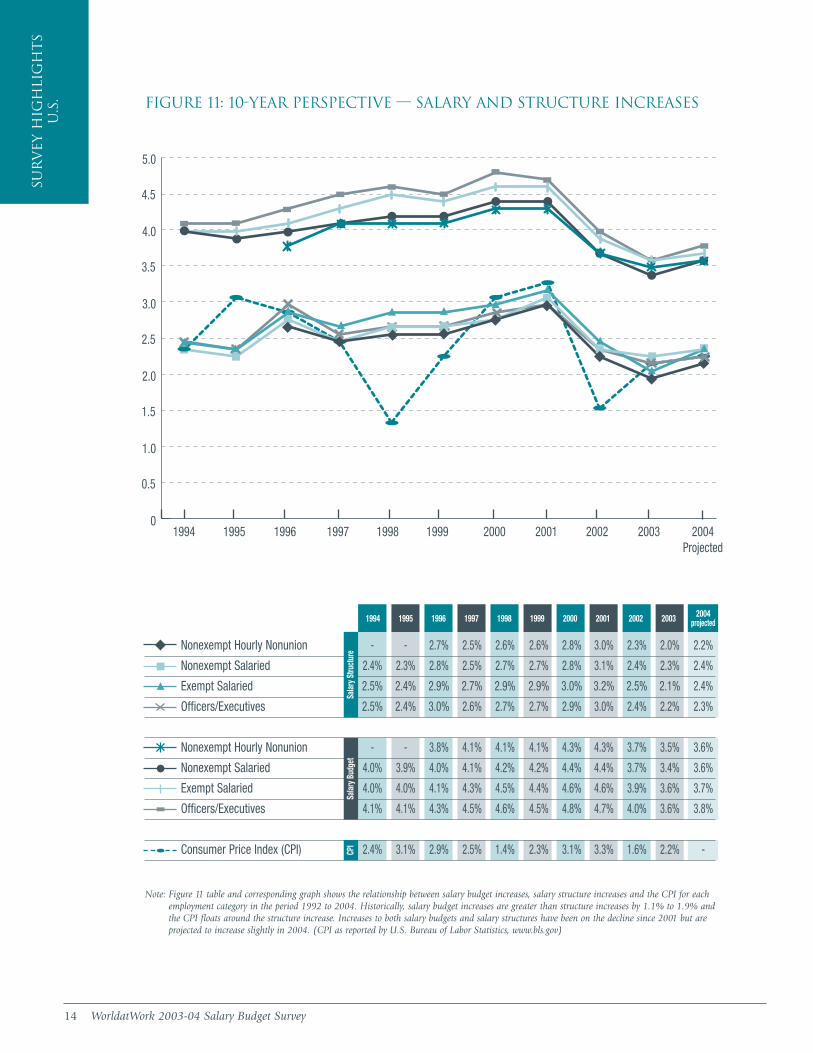
Nonexempt Hourly Nonunion - - 2.7% 2.5% 2.6% 2.6% 2.8% 3.0% 2.3% 2.0% 2.2%
Nonexempt Salaried 2.4% 2.3% 2.8% 2.5% 2.7% 2.7% 2.8% 3.1% 2.4% 2.3% 2.4%
Exempt Salaried 2.5% 2.4% 2.9% 2.7% 2.9% 2.9% 3.0% 3.2% 2.5% 2.1% 2.4%
Officers/Executives 2.5% 2.4% 3.0% 2.6% 2.7% 2.7% 2.9% 3.0% 2.4% 2.2% 2.3%
Nonexempt Hourly Nonunion - - 3.8% 4.1% 4.1% 4.1% 4.3% 4.3% 3.7% 3.5% 3.6%
Nonexempt Salaried 4.0% 3.9% 4.0% 4.1% 4.2% 4.2% 4.4% 4.4% 3.7% 3.4% 3.6%
Exempt Salaried 4.0% 4.0% 4.1% 4.3% 4.5% 4.4% 4.6% 4.6% 3.9% 3.6% 3.7%
Officers/Executives 4.1% 4.1% 4.3% 4.5% 4.6% 4.5% 4.8% 4.7% 4.0% 3.6% 3.8%
Consumer Price Index (CPI) 2.4% 3.1% 2.9% 2.5% 1.4% 2.3% 3.1% 3.3% 1.6% 2.2% -
Note: Figure 11 table and corresponding graph shows the relationship between salary budget increases, salary structure increases and the CPI for eachemployment category in the period 1992 to 2004. Historically, salary budget increases are greater than structure increases by 1.1% to 1.9% andthe CPI floats around the structure increase. Increases to both salary budgets and salary structures have been on the decline since 2001 but areprojected to increase slightly in 2004. (CPI as reported by U.S. Bureau of Labor Statistics, www.bls.gov)
Salar
y Stru
ctur
e Sa
lary B
udge
t CP
I

WorldatWork 2003-04 Salary Budget Survey 15
Sur
vey H
igh
ligh
ts
U.S.Promotional Increases
While still not a common practice, an increasing percentage of organizations are setting up separate budget poolsfor promotions. (See Figure 12) Twenty-nine percent of organizations report promotional increases as a separatebudget item, an increase of 8 percent over 2002.
FIGURE 12: PROMOTIONAL INCREASE BUDGETS
* The 2003-04 survey asked participants to provide 2002 actual data in retrospect, instead of forward-looking estimates for end-of-year data at the time ofsurvey administration in April, as was the case in previous years. This change should provide more accurate and reliable data going forward.
Percentage of Employees Receiving Promotional Increases 9.3% 7.0% 7.0% 9.0% 9.4% 10.4% 8.4%
Budgeted Percent of Total Base Salaries 0.8% 1.0% 1.0% 0.9% 0.9% 1.0% 2.5% (a)1.0% (b)
Percentage of Promoted Employee’s Base Salary - - - - 7.7% 7.7% 7.3%
(a) Mean (b) Median
Respondents reported that 8.4 percent of employees received a promotional increase in 2002, lower than the number of internal promotions as in 2000 and 2001 (9.4 percent and 10.4 percent respectively in the United States). (See Figure 13.)
The median budgeted percent of total base salaries was 1 percent in 2002, with 0.5 percent and 1 percentbeing the most common responses reported.
The average salary increase for a promotion (as a percent of promoted employee’s prior base salary) wentdown for the first time in the survey, by 0.4 percent, to 7.3 percent in 2002.
It should be noted that for the 2003-04 survey, WorldatWork changed several of the questions regarding promotional increases to improve both the quality and usability of information. Instead of asking participants inApril to, in effect, estimate their promotional data through the end of the year (as Salary Budget Survey questionsin previous years did), the new questions asked participants to provide actual data for the prior year. Because of this change in methodology, caution should be used when comparing this year’s 2002 data to figures from previous years.
FIGURE 13: PROMOTIONAL INCREASES
Percent of organizations with a separate promotional increase budget 19% 21% 29%
Percent without a separate promotional increase budget 81% 79% 71%
2001 2002 2003
1996 1997 1998 1999 2000 2001 2002*
16 WorldatWork 2003-04 Salary Budget Survey
Sur
vey H
igh
lig
ht
s –
U.S
. Su
rv
ey H
igh
lig
ht
sU
.S. Variable Pay, Incentives and Bonuses
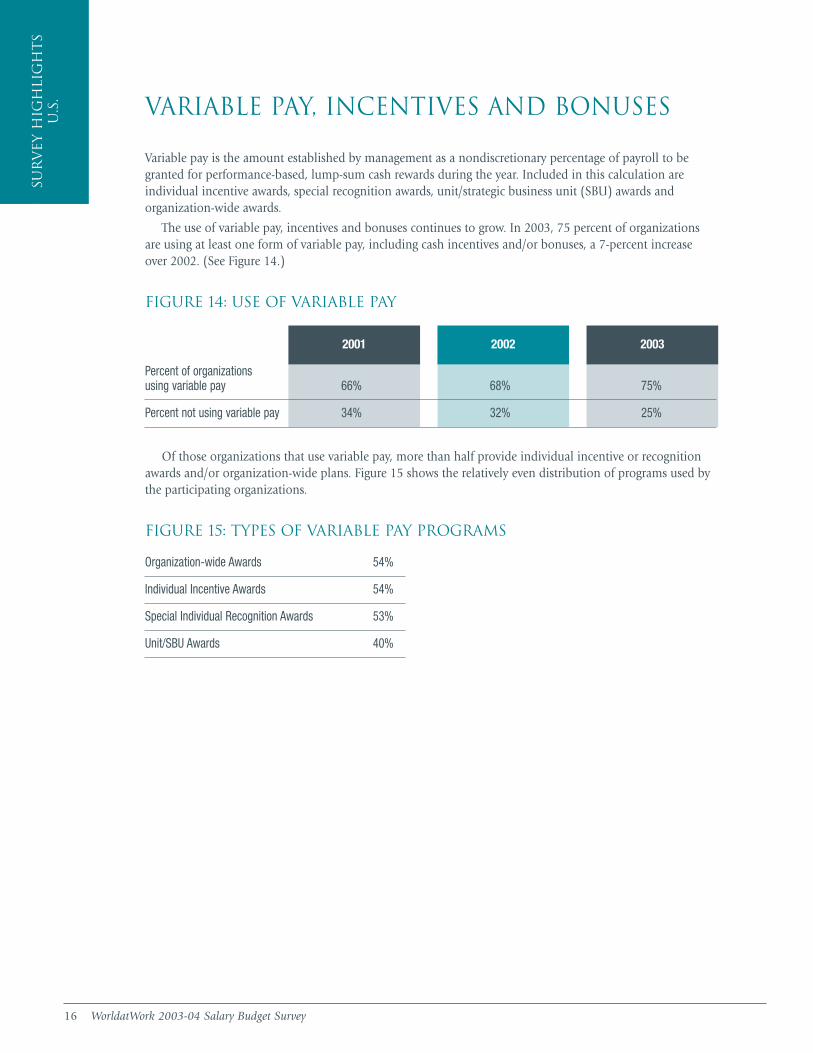
Variable pay is the amount established by management as a nondiscretionary percentage of payroll to begranted for performance-based, lump-sum cash rewards during the year. Included in this calculation are individual incentive awards, special recognition awards, unit/strategic business unit (SBU) awards and organization-wide awards.
The use of variable pay, incentives and bonuses continues to grow. In 2003, 75 percent of organizationsare using at least one form of variable pay, including cash incentives and/or bonuses, a 7-percent increaseover 2002. (See Figure 14.)
FIGURE 14: USE OF VARIABLE PAY
Organization-wide Awards 54%
Individual Incentive Awards 54%
Special Individual Recognition Awards 53%
Unit/SBU Awards 40%
Percent of organizations using variable pay 66% 68% 75%
Percent not using variable pay 34% 32% 25%
2001 2002 2003
Of those organizations that use variable pay, more than half provide individual incentive or recognitionawards and/or organization-wide plans. Figure 15 shows the relatively even distribution of programs used bythe participating organizations.
FIGURE 15: TYPES OF VARIABLE PAY PROGRAMS
WorldatWork 2003-04 Salary Budget Survey 17
Sur
vey H
igh
ligh
ts
U.S.
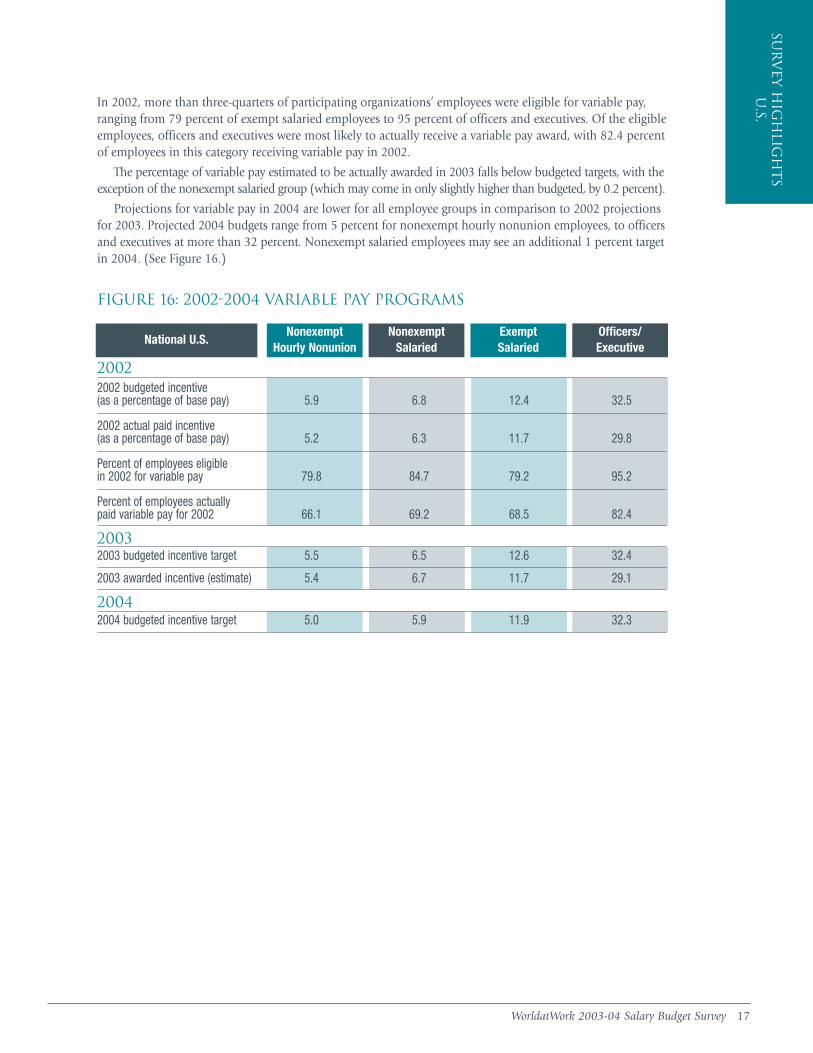
In 2002, more than three-quarters of participating organizations’ employees were eligible for variable pay,ranging from 79 percent of exempt salaried employees to 95 percent of officers and executives. Of the eligibleemployees, officers and executives were most likely to actually receive a variable pay award, with 82.4 percentof employees in this category receiving variable pay in 2002.
The percentage of variable pay estimated to be actually awarded in 2003 falls below budgeted targets, with theexception of the nonexempt salaried group (which may come in only slightly higher than budgeted, by 0.2 percent).
Projections for variable pay in 2004 are lower for all employee groups in comparison to 2002 projectionsfor 2003. Projected 2004 budgets range from 5 percent for nonexempt hourly nonunion employees, to officersand executives at more than 32 percent. Nonexempt salaried employees may see an additional 1 percent targetin 2004. (See Figure 16.)
FIGURE 16: 2002-2004 VARIABLE PAY PROGRAMS
NonexemptSalaried
Exempt Salaried
Officers/Executive
Nonexempt Hourly Nonunion
National U.S.
2002 2002 budgeted incentive (as a percentage of base pay) 5.9 6.8 12.4 32.5
2002 actual paid incentive (as a percentage of base pay) 5.2 6.3 11.7 29.8
Percent of employees eligible in 2002 for variable pay 79.8 84.7 79.2 95.2
Percent of employees actually paid variable pay for 2002 66.1 69.2 68.5 82.4
2003 2003 budgeted incentive target 5.5 6.5 12.6 32.4
2003 awarded incentive (estimate) 5.4 6.7 11.7 29.1
2004 2004 budgeted incentive target 5.0 5.9 11.9 32.3
18 WorldatWork 2003-04 Salary Budget Survey
Sur
vey H
igh
lig
ht
sU
.S.
NonexemptSalaried
Exempt Salaried
Officers/Executive
Nonexempt Hourly Nonunion
Eastern
2002 2002 budgeted incentive (as a percentage of base pay) 6.3 6.9 13.5 34.8
2002 actual paid incentive (as a percentage of base pay) 5.0 5.6 12.1 31.1
Percent of employees eligible in 2002 for variable pay 77.8 83.5 79.1 95.8
Percent of employees actually paid variable pay for 2002 65.4 66.4 68.4 82.8
2003 2003 budgeted incentive target 5.3 6.5 13.0 33.9
2003 awarded incentive (estimate) 5.3 6.6 12.3 30.4
2004 2004 budgeted incentive target 4.8 6.1 12.7 34.1
NonexemptSalaried
Exempt Salaried
Officers/Executive
Nonexempt Hourly Nonunion
Central
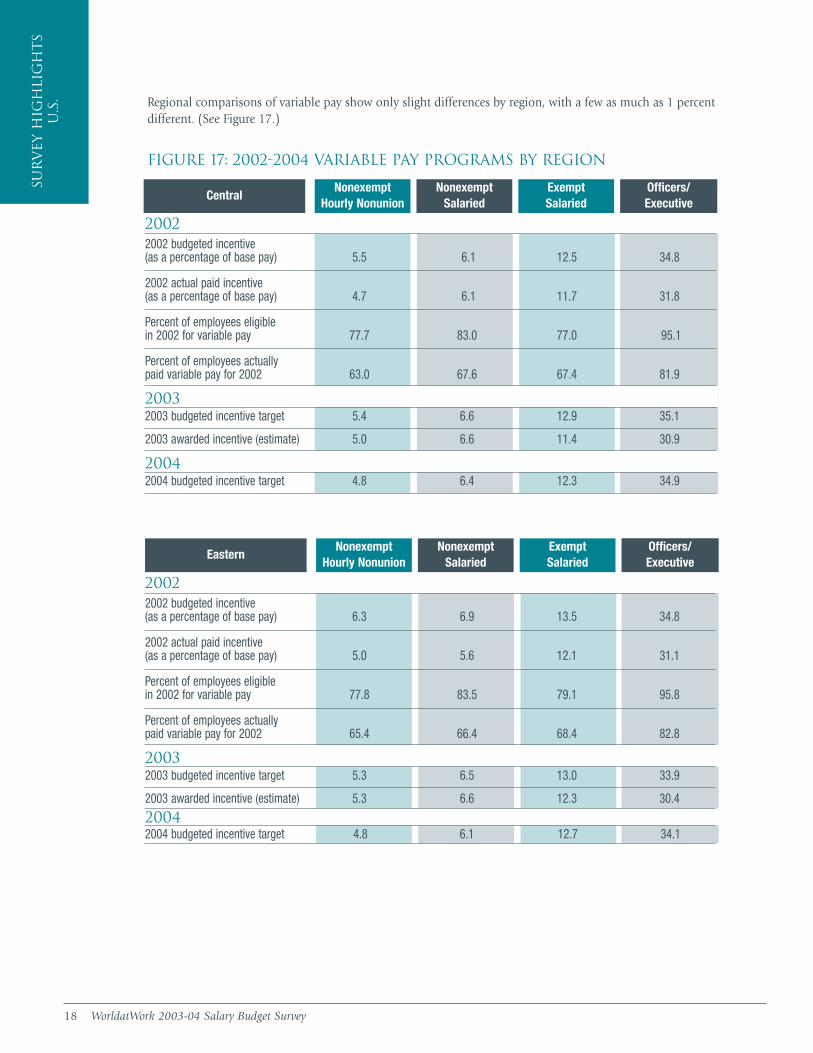
Regional comparisons of variable pay show only slight differences by region, with a few as much as 1 percentdifferent. (See Figure 17.)
FIGURE 17: 2002-2004 VARIABLE PAY PROGRAMS BY REGION
2002 2002 budgeted incentive (as a percentage of base pay) 5.5 6.1 12.5 34.8
2002 actual paid incentive (as a percentage of base pay) 4.7 6.1 11.7 31.8
Percent of employees eligible in 2002 for variable pay 77.7 83.0 77.0 95.1
Percent of employees actually paid variable pay for 2002 63.0 67.6 67.4 81.9
2003 2003 budgeted incentive target 5.4 6.6 12.9 35.1
2003 awarded incentive (estimate) 5.0 6.6 11.4 30.9
2004 2004 budgeted incentive target 4.8 6.4 12.3 34.9

WorldatWork 2003-04 Salary Budget Survey 19
Sur
vey H
igh
ligh
ts
U.S.
NonexemptSalaried
Exempt Salaried
Officers/Executive
2002 002
2002 budgeted incentive (as a percentage of base pay) 5.8 6.2 13.3 35.4
2002 actual paid incentive (as a percentage of base pay) 5.3 6.2 12.3 32.7
Percent of employees eligible in 2002 for variable pay 77.0 84.3 78.6 96.1
Percent of employees actually paid variable pay for 2002 64.1 68.3 68.1 83.3
2003 2003 budgeted incentive target 5.1 6.0 13.1 35.5
2003 awarded incentive (estimate) 4.8 5.7 11.6 31.0
2004 2004 budgeted incentive target 4.8 6.1 12.9 35.2
Nonexempt Hourly Nonunion
Southern
FIGURE 17: 2002-2004 VARIABLE PAY PROGRAMS BY REGION(Continued)
NonexemptSalaried
Exempt Salaried
Officers/Executive
2002 2002 budgeted incentive (as a percentage of base pay) 6.2 7.2 12.9 34.2
2002 actual paid incentive (as a percentage of base pay) 5.4 6.4 12.1 31.7
Percent of employees eligible in 2002 for variable pay 79.1 84.3 79.5 95.7
Percent of employees actually paid variable pay for 2002 62.3 68.3 67.4 82.2
2003 2003 budgeted incentive target 5.4 6.4 12.8 33.9
2003 awarded incentive (estimate) 5.5 7.5 12.2 31.0
2004 2004 budgeted incentive target 4.7 6.3 12.4 34.3
Nonexempt Hourly Nonunion
Western
20 WorldatWork 2003-04 Salary Budget Survey
Sur
vey H
igh
lig
ht
sU
.S.
Nonexempt Hourly Nonunion 15% 2% 0% 2% 1%
Nonexempt Salaried 14% 2% 1% 1% 1%
Exempt Salaried 66% 10% 2% 13% 5%
Officers/ Executive 87% 17% 6% 40% 18%
Stock OptionProgram
Stock GrantProgram
PhantomStock/SAR
Restricted Stock
PerformanceShares
FIGURE 19: PUBLIC COMPANIES: TYPES OF STOCK-BASED INCENTIVE PROGRAMS OFFERED BY EMPLOYEE CATEGORY (Public companies offering stock-based incentive programs, n=950)
Stock/Equity-Based Compensation Programs
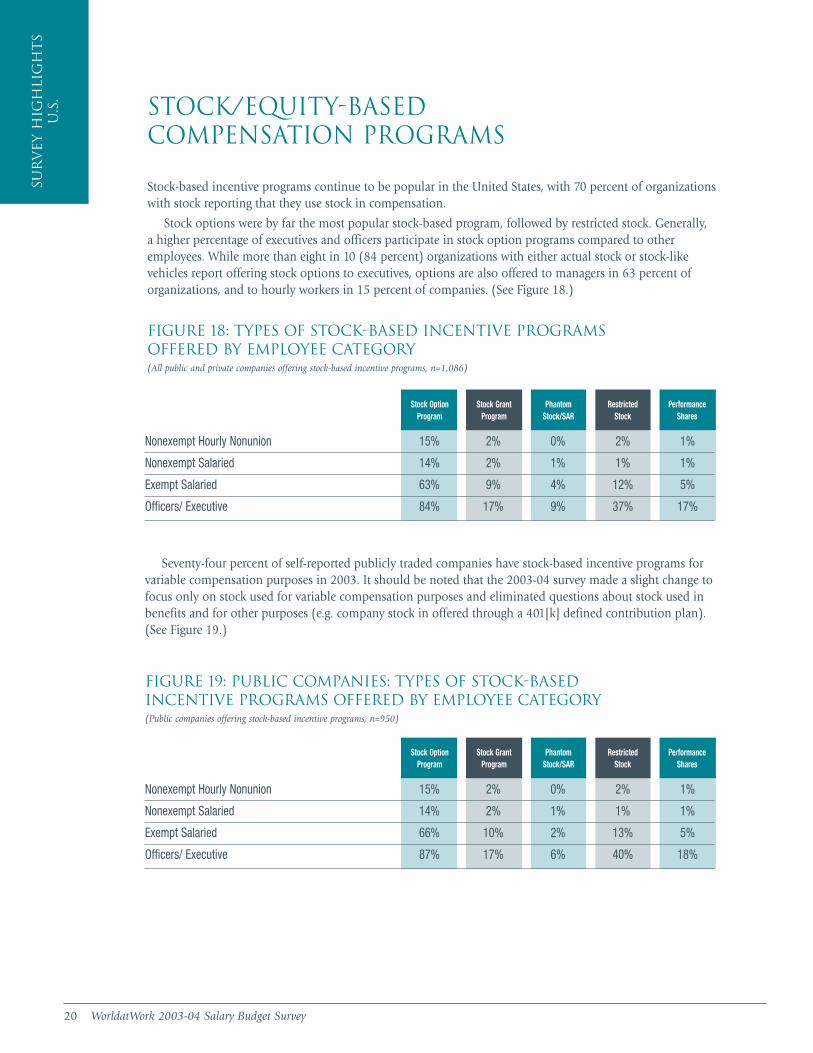
Stock-based incentive programs continue to be popular in the United States, with 70 percent of organizationswith stock reporting that they use stock in compensation.
Stock options were by far the most popular stock-based program, followed by restricted stock. Generally, a higher percentage of executives and officers participate in stock option programs compared to otheremployees. While more than eight in 10 (84 percent) organizations with either actual stock or stock-likevehicles report offering stock options to executives, options are also offered to managers in 63 percent oforganizations, and to hourly workers in 15 percent of companies. (See Figure 18.)
FIGURE 18: TYPES OF STOCK-BASED INCENTIVE PROGRAMS OFFERED BY EMPLOYEE CATEGORY (All public and private companies offering stock-based incentive programs, n=1,086)
Nonexempt Hourly Nonunion 15% 2% 0% 2% 1%
Nonexempt Salaried 14% 2% 1% 1% 1%
Exempt Salaried 63% 9% 4% 12% 5%
Officers/ Executive 84% 17% 9% 37% 17%
Stock OptionProgram
Stock GrantProgram
PhantomStock/SAR
Restricted Stock
PerformanceShares
Seventy-four percent of self-reported publicly traded companies have stock-based incentive programs forvariable compensation purposes in 2003. It should be noted that the 2003-04 survey made a slight change tofocus only on stock used for variable compensation purposes and eliminated questions about stock used inbenefits and for other purposes (e.g. company stock in offered through a 401[k] defined contribution plan).(See Figure 19.)
WorldatWork 2003-04 Salary Budget Survey 21
Sur
vey H
igh
ligh
ts
U.S.
Nonexempt Hourly Nonunion 18% 1% 1% 1% 2%
Nonexempt Salaried 10% 1% 3% 0% 1%
Exempt Salaried 49% 7% 18% 4% 5%
Officers/ Executive 63% 16% 26% 15% 13%
Stock OptionProgram
Stock GrantProgram
PhantomStock/SAR
Restricted Stock
PerformanceShares
FIGURE 20: PRIVATE COMPANIES: TYPES OF STOCK-BASED INCENTIVEPROGRAMS OFFERED BY EMPLOYEE CATEGORY (Public companies with stock or stock-like vehicles offering stock-based incentive programs, n=136)
Attraction and Retention Practices Despite higher unemployment rates and a generally softer labor market, attraction and retention of employeescontinues to be a top concern for many organizations in 2003. More than 90 percent of organizations areusing some form of incentive to attract and retain employees.
Referral bonuses and sign-on bonuses top the list of methods used to attract and retain employees (63 percentand 62 percent, respectively) and more than half of respondents (53 percent) report using market adjustmentsas a retention tool. Stock grant programs, large merit budgets and paid sabbaticals are the least used programsfor attraction and retention, all used by less than 10 percent of responding organizations. (See Figure 21.)
FIGURE 21: PROGRAMS USED IN THE PAST 12 MONTHS TO ATTRACT AND RETAIN EMPLOYEES (Note: This question allowed a “check all that apply” response.)
Employee referral bonus 63%
Sign-on/hiring bonus 62%
Market adjustments/increase to base salary 53%
Spot bonus (individual) 40%
Stock option program 29%
Retention/stay bonus 27%
Paying above market 24%
Special cash bonus/group incentives (not organization wide) 18%
Exempt overtime pay or time off 14%
Project milestone/completion bonus 14%
Separate salary structures 14%
Stock grant programs 7%
Larger merit increase budgets 6%
Paid sabbaticals 3%
Global Comparison: Salary Increasesvs. Rates of Inflation
For the purposes of global comparison, data from Executive Resources Limited (ERL) is provided in Figure 22on page 22 for 62 countries around the world. Increases are shown in four categories: Executive, Management,Professional and Employee. The WorldatWork Salary Budget Survey does not collect information about salarybudget increases in countries other than the United States and Canada.
22 WorldatWork 2003-04 Salary Budget Survey
Sur
vey H
igh
lig
ht
sU
.S.
AverageIncrease
Inflation (2nd Quarter)
InflationProjected
Executive Management Professional Employee
FIGURE 22: INTERNATIONAL REMUNERATION — 2003-04 SALARY INCREASE PROJECTIONS (Increase amounts include merit and inflation.) (footnote 1)
2003 2004
EUROPEAustria 3.0 1.7 1.4 4.0 3.7 4.4 3.0
Belgium 2.7 1.5 1.4 4.1 4.0 5.1 3.8
Cyprus 3.5 2.0 2.5 5.2 4.2 4.5 3.0
Czech. Republic 3.4 0.8 1.2 4.0 3.5 5.5 3.5
Denmark 3.5 2.3 2.1 5.5 4.3 5.1 3.0
Finland 3.6 1.6 1.9 4.5 3.4 4.5 3.2
France 3.5 1.8 1.5 4.0 3.3 4.3 3.0
Germany 3.5 1.1 1.3 3.5 3.1 4.2 3.1
Greece 6.4 4.2 4.1 6.0 5.4 5.8 5.0
Hungary 7.5 4.8 4.9 7.1 6.2 7.0 5.5
Irish Republic 5.4 2.4 5.9 8.5 6.8 7.5 6.8
Italy 5.1 2.3 2.1 5.5 4.8 5.0 4.5
Luxembourg 4.7 3.1 2.5 4.0 3.2 4.3 3.6
Netherlands 4.6 2.6 2.3 5.5 5.2 6.1 4.1
Norway 5.1 3.8 1.2 5.0 3.7 4.2 3.5
Poland 2.5 1.1 0.8 3.5 3.1 4.5 3.4
Portugal 5.4 3.9 3.4 5.5 5.1 5.2 4.4
Russia 19.8 15.8 16.8 21.1 20.2 21.2 19.1
Slovak Republic 6.1 4.2 4.3 7.5 7.1 7.4 6.0
Spain 5.5 3.0 2.7 6.4 4.9 5.4 4.7
Sweden 4.0 2.4 2.2 4.4 4.3 5.3 4.0
Switzerland 2.1 0.3 0.9 2.5 2.2 3.8 2.1
United Kingdom 5.3 2.9 2.7 5.0 5.0 5.7 4.9
ASIA PACIFIC Australia 4.7 2.7 2.6 4.0 3.8 4.5 3.7
Bangladesh 5.5 3.1 2.9 4.5 3.5 4.2 3.0
China 12.1 9.3 8.9 12.0 10.4 11.2 9.2
Hong Kong 2.0 (2.1) (2.0) 3.5 3.2 4.2 2.5
India 7.2 4.3 4.5 6.0 5.5 6.5 5.7
Indonesia 13.1 11.2 12.1 14.1 13.1 14.0 13.6
Japan 2.0 (0.6) (0.5) 2.0 2.0 3.1 1.5
Korea (South) 7.5 4.8 4.1 6.0 5.9 6.0 5.3
Malaysia (pen.) 2.2 0.7 0.8 2.7 2.5 2.6 2.1
New Zealand 4.4 2.7 2.8 4.5 4.0 4.4 4.1
Pakistan 5.5 3.2 3.5 6.5 6.0 6.2 5.0
Philippines 5.4 3.0 3.3 6.5 6.0 6.3 5.0
WorldatWork 2003-04 Salary Budget Survey 23
Sur
vey H
igh
ligh
ts
U.S.
AverageIncrease
Inflation (2nd Quarter)
InflationProjected
Executive Management Professional Employee
2003 2004
FIGURE 22: INTERNATIONAL REMUNERATION — 2003-04 SALARY INCREASE PROJECTIONS (Continued)
Singapore 2.5 (0.8) 1.2 3.5 3.1 4.2 3.1
Sri Lanka 3.6 2.5 2.8 4.5 4.3 4.4 4.0
Taiwan 2.0 (0.2) 1.2 3.5 2.4 3.2 2.8
Thailand 4.0 2.1 2.2 4.0 3.6 4.2 3.0
Vietnam 3.2 1.1 2.2 4.0 3.8 4.4 3.2
AFRICA/MIDDLE EAST Bahrain 3.2 1.0 1.3 3.5 3.2 4.1 3.2
Egypt 4.0 2.9 3.2 5.4 5.0 5.5 4.0
Israel 7.4 5.1 4.9 7.2 6.1 6.8 6.1
Kenya 2.0 (3.9) (2.4) 3.0 2.1 2.4 1.4
Nigeria 12.3 10.0 9.2 12.2 11.5 11.5 10.1
Saudi Arabia 2.5 (0.9) 1.1 3.0 2.6 3.4 2.1
South Africa 15.6 13.1 9.8 12.8 11.2 12.2 11.2
Turkey 52.1 47.0 38.0 42.1 40.4 40.9 40.0
UAE 2.7 1.8 2.8 4.5 4.1 5.1 3.2
Zimbabwe 66.0 63.0 65.0 69.5 68.2 68.1 67.1
LATIN AMERICA Argentina 42.2 38.6 40.1 44.1 43.5 44.5 42.2
Brazil 20.2 16.9 14.2 18.5 17.5 18.3 17.2
Chile 6.4 4.8 5.2 8.5 7.4 8.3 6.2
Colombia 11.4 8.2 7.5 11.9 10.2 11.0 9.6
Costa Rica 10.2 8.7 7.3 12.5 10.2 11.0 10.1
Ecuador 24.0 20.1 19.6 23.1 22.2 23.2 22.4
Guatemala 6.6 3.1 3.6 6.5 5.8 5.6 5.2
Mexico 6.5 5.8 5.2 7.5 6.5 7.0 6.2
Panama 8.2 6.2 5.5 8.5 7.2 8.0 6.6
Peru 6.5 3.8 4.0 7.0 6.5 7.0 5.3
Puerto Rico 8.6 6.5 5.2 6.5 5.8 6.0 5.3
Venezuela 38.9 35.2 28.4 32.5 31.4 32.1 30.5
Notes:1 Survey data is effective Second Quarter 2003.2 Merit salary survey data for 2003 and 2004 was obtained from over 4,000 ERL clients and general survey participants.3 In higher inflation countries, increases may be given more frequently than annual.4 Inflation data provided by The World Bank, IMF, and the London School of Economics, Barclays Bank and the Economist Intelligence Unit.
Information courtesy of Executive Resources Limited, International Remuneration Practice, May 2003. www.erlimited.com.

24 WorldatWork 2003-04 Salary Budget Survey

WorldatWork 2003-04 Salary Budget Survey 25
2003 Actual Increases 2004 Projected Increases
NONEXEMPT HOURLY NONUNION EMPLOYEES
GENERALINCREASE/
COLA
MERITINCREASE
OTHERINCREASE
TOTALINCREASE
MONTHSBETWEEN
INCREASES
% OF EERECEIVINGINCREASE IN 2003
% n % n % n % n Mo. n % n
GENERALINCREASE/
COLA
MERITINCREASE
OTHERINCREASE
TOTALINCREASE
MONTHSBETWEEN
INCREASES
% n % n % n % n Mo. n
INDUSTRY
Nat
ion
al D
ata
U.S.
* Fewer than five survey respondents ** Total line reflects all data submitted – No DataMining = Industry Group
Metal Mfg = Industry Subgroup
Key:
Accommodation & Food Services
Administrative Support & Waste Mgmt.
Agriculture, Forestry, Fishing & Hunting
Arts, Entertainment & Recreation
Construction
Consulting, Prof., Scientific & Tech. Svcs.
Educational Services
Finance & Insurance
Credit Intermediation & Related Act.
Funds, Trusts & Other Financial Vehicles
Insurance Carriers & Related Act.
Securities, Commodities & Other Investments
Health Care & Social Assistance
Hospitals
Nursing, Ambulatory & Residential Care
Information
Internet Industries
Publishing Industries
Motion Picture, Sound Recording, Broadcasting
Mgmt of Companies & Enterprises
Manufacturing
Chemical Mfg.
Computer & Electronic Product Mfg.
Electrical Equip., Appliance & Component Mfg.
Food, Beverage & Tobacco Product Mfg.
Machinery Mfg.
Metal Mfg.
Paper Mfg., Printing & Related Act.
Plastics & Rubber Products Mfg.
Textile, Apparel, Leather & Allied Product Mfg.
Transportation Equipment Mfg.
Other Misc. Mfg.
Mining
Public Administration
Real Estate, Rental & Leasing
Retail Trade
Telecommunications
Transportation
Air Transportation
All Other Transportation
Utilities
Wholesale Trade
Other Services (except Public Admin.)
Religious, Grantmaking, Civic, Prof. & Similar Org.
Total
3.4 2 3.8 17 1.4 3 3.7 20 11.7 20 82.8 20 3.0 1 3.4 17 0.8 4 3.6 18 11.1 19
2.2 7 3.0 22 0.3 2 3.3 25 12.1 25 88.2 23 1.9 7 3.5 21 0.5 1 3.5 25 12.0 23
3.0 1 2.9 7 – – 2.9 8 12.0 8 84.0 8 4.0 1 3.0 5 – – 3.2 6 12.0 7
0.8 3 3.3 20 2.1 5 3.6 22 12.6 22 87.4 21 – – 3.2 17 2.7 4 3.4 19 12.1 17
2.8 2 3.6 16 0.2 2 3.9 16 12.8 16 75.5 14 2.5 1 3.7 11 0.5 1 3.7 12 12.0 14
2.2 17 3.4 109 0.7 35 3.7 117 12.2 117 85.6 113 1.8 15 3.6 100 0.8 30 3.9 107 12.1 106
1.5 30 2.6 53 0.7 18 2.9 69 12.4 69 69.0 66 1.6 22 2.5 40 0.5 9 2.6 54 12.2 52
1.1 25 3.5 242 1.1 47 3.7 252 11.9 252 85.8 229 2.1 19 3.6 209 1.2 38 3.8 221 12.0 216
1.2 9 3.5 74 1.0 15 3.7 77 11.9 77 82.3 70 2.6 7 3.6 65 1.3 11 3.8 69 12.2 70
0.7 6 3.6 53 2.2 8 3.9 55 12.0 55 88.4 49 1.1 4 3.7 48 2.1 10 4.0 50 12.0 50
0.8 7 3.6 95 0.9 21 3.7 98 11.9 98 88.2 88 2.1 7 3.7 77 0.8 15 3.8 82 12.0 79
2.0 3 3.3 16 0.6 3 3.4 18 11.9 18 80.4 18 2.0 1 3.5 15 0.4 2 3.4 16 11.5 13
2.6 74 3.3 174 2.0 88 4.1 228 12.0 228 92.1 217 2.5 53 3.3 160 2.0 69 3.9 205 12.0 197
2.5 61 3.3 135 2.1 76 4.2 180 12.0 180 92.3 171 2.5 44 3.3 126 2.1 61 4.0 164 11.9 158
3.0 13 3.2 39 1.4 12 3.8 48 12.1 48 91.1 46 2.7 9 3.3 34 1.2 8 3.6 41 12.3 39
2.2 6 3.3 98 1.2 26 3.6 104 12.8 104 82.6 100 2.8 5 3.6 88 1.1 19 3.8 92 12.4 88
3.0 2 3.1 18 1.4 2 3.3 20 13.4 20 72.8 20 3.5 2 3.4 16 1.3 2 3.8 17 12.7 18
1.8 2 3.5 32 0.6 8 3.6 33 13.0 33 93.5 32 1.8 2 3.5 31 0.8 7 3.7 32 12.2 30
1.8 2 3.3 48 1.5 16 3.7 51 12.4 51 79.5 48 3.5 1 3.7 41 1.3 10 3.9 43 12.5 40
1.8 2 2.4 8 0.0 1 2.5 9 12.7 9 71.7 9 3.5 1 3.2 6 1.0 1 3.4 7 15.8 8
2.4 149 3.1 434 1.1 116 3.3 553 12.4 553 85.7 535 2.7 125 3.4 371 1.3 94 3.5 486 12.0 487
2.4 14 3.3 62 0.5 15 3.3 74 12.4 74 90.6 74 2.3 11 3.4 63 0.6 20 3.5 71 12.1 70
2.1 8 2.7 79 1.0 26 3.1 85 13.2 85 68.6 84 2.6 7 3.5 59 1.2 18 3.5 69 12.7 69
1.1 7 3.2 33 1.0 13 3.5 36 14.0 36 84.6 34 1.7 4 3.5 29 1.3 8 3.9 31 12.1 33
2.7 13 3.5 33 0.5 5 3.6 43 11.9 43 96.4 41 3.1 8 3.5 30 0.4 3 3.5 37 11.9 38
2.8 3 2.6 20 0.7 3 2.8 23 11.3 23 83.6 23 3.0 4 2.7 16 0.6 2 2.8 20 11.1 20
1.7 10 3.1 25 0.5 2 3.0 32 12.3 32 84.5 31 2.2 10 3.2 20 1.0 1 3.1 28 12.0 26
2.3 7 2.9 22 0.6 3 3.1 26 12.0 26 87.1 26 3.5 5 3.3 20 1.5 1 3.4 25 12.3 24
2.8 14 2.8 17 0.9 5 3.4 27 12.8 27 86.1 27 3.3 13 3.1 15 1.6 4 3.8 25 12.4 25
2.8 8 3.4 10 1.0 1 3.1 18 12.0 18 84.6 16 2.7 8 3.4 9 1.0 1 3.1 17 11.6 17
2.9 14 3.1 14 1.3 4 3.2 28 12.4 28 93.5 28 3.2 13 3.3 14 1.9 4 3.5 27 11.3 27
2.4 51 3.2 119 1.6 39 3.5 161 11.9 161 89.0 151 2.6 42 3.4 96 1.8 32 3.7 136 11.6 138
3.3 6 3.3 16 2.6 3 3.8 21 11.8 21 90.6 20 3.8 4 3.3 15 * * 3.4 19 12.0 18
2.0 38 3.1 63 1.9 21 3.9 80 12.2 80 74.8 78 1.7 27 3.2 55 1.4 17 3.7 67 12.7 58
2.8 2 3.3 20 0.7 5 3.6 21 12.4 21 93.0 20 2.8 2 3.4 17 0.6 5 3.7 18 12.2 18
2.0 12 3.2 111 1.0 13 3.3 119 12.0 119 87.2 112 2.6 6 3.5 98 1.5 9 3.5 105 12.0 99
1.1 12 2.6 49 1.3 13 2.9 56 13.2 56 68.3 51 1.4 7 3.3 43 1.5 8 3.3 49 11.8 48
1.9 17 2.6 39 1.5 14 3.1 50 12.7 50 66.9 50 2.3 13 2.9 35 1.4 10 3.2 46 12.4 41
1.3 6 2.4 9 1.3 5 3.0 12 12.8 12 46.2 12 2.0 4 3.5 7 1.6 4 3.5 11 13.3 9
2.2 11 2.7 30 1.6 9 3.1 38 12.6 38 73.5 38 2.5 9 2.8 28 1.3 6 3.1 35 12.2 32
2.6 20 3.1 51 1.4 10 3.5 64 11.7 64 90.6 62 2.9 17 3.3 43 1.8 7 3.7 56 11.8 56
2.5 7 3.2 50 1.5 4 3.4 55 12.0 55 90.9 53 3.1 6 3.5 48 0.9 3 3.6 53 12.1 51
1.6 7 3.1 27 1.0 8 3.5 30 12.2 30 76.5 30 2.3 6 3.3 23 1.6 7 3.5 29 12.4 29
1.7 5 3.1 22 1.1 6 3.5 24 11.8 24 76.4 24 2.2 5 3.3 19 1.8 6 3.5 24 12.5 23
2.2 439 3.2 1626 1.3 434 3.5 1919 12.2 1919 84.5 1831 2.4 338 3.4 1422 1.4 336 3.6 1694 12.1 1652

Nat
ion
al
Data
U.S
.
2003 Actual Increases 2004 Projected Increases
NONEXEMPT SALARIED EMPLOYEES
INDUSTRY
26 WorldatWork 2003-04 Salary Budget SurveyMining = Industry Group
Metal Mfg = Industry Subgroup
GENERALINCREASE/
COLA
MERITINCREASE
OTHERINCREASE
TOTALINCREASE
MONTHSBETWEEN
INCREASES
% OF EERECEIVINGINCREASE IN 2003
% n % n % n % n Mo. n % n
GENERALINCREASE/
COLA
MERITINCREASE
OTHERINCREASE
TOTALINCREASE
MONTHSBETWEEN
INCREASES
% n % n % n % n Mo. n
Accommodation & Food Services
Administrative Support & Waste Mgmt.
Agriculture, Forestry, Fishing & Hunting
Arts, Entertainment & Recreation
Construction
Consulting, Prof., Scientific & Tech. Svcs.
Educational Services
Finance & Insurance
Credit Intermediation & Related Act.
Funds, Trusts & Other Financial Vehicles
Insurance Carriers & Related Act.
Securities, Commodities & Other Investments
Health Care & Social Assistance
Hospitals
Nursing, Ambulatory & Residential Care
Information
Internet Industries
Publishing Industries
Motion Picture, Sound Recording, Broadcasting
Mgmt of Companies & Enterprises
Manufacturing
Chemical Mfg.
Computer & Electronic Product Mfg.
Electrical Equip., Appliance & Component Mfg.
Food, Beverage & Tobacco Product Mfg.
Machinery Mfg.
Metal Mfg.
Paper Mfg., Printing & Related Act.
Plastics & Rubber Products Mfg.
Textile, Apparel, Leather & Allied Product Mfg.
Transportation Equipment Mfg.
Other Misc. Mfg.
Mining
Public Administration
Real Estate, Rental & Leasing
Retail Trade
Telecommunications
Transportation
Air Transportation
All Other Transportation
Utilities
Wholesale Trade
Other Services (except Public Admin.)
Religious, Grantmaking, Civic, Prof. & Similar Org.
Total
* Fewer than five survey respondents ** Total line reflects all data submitted – No DataKey:
- - 3.7 12 3.5 1 4.0 12 12.5 12 86.0 12 - - 3.6 11 1.8 2 3.9 11 12.2 11
3.0 3 3.2 15 0.5 4 3.3 18 12.7 18 84.6 16 3.4 2 3.6 15 0.6 4 3.7 17 12.8 15
3.0 1 2.9 8 – – 2.9 9 13.3 9 83.0 9 4.0 1 3.4 8 - - 3.4 9 12.0 9
1.5 2 3.9 8 0.9 3 4.6 8 12.0 8 91.9 8 3.0 1 4.0 7 0.9 2 4.7 7 12.0 7
0.0 1 3.5 13 1.0 3 3.7 13 13.4 13 81.1 12 0.0 1 3.7 10 0.5 1 3.7 10 12.0 11
2.0 15 3.5 101 0.8 35 3.9 105 12.7 105 85.0 99 2.3 11 3.6 86 0.9 31 4.0 91 12.1 86
1.3 21 2.8 47 0.5 12 2.8 59 12.4 59 71.6 57 1.1 16 2.7 40 0.6 9 2.8 48 12.3 44
1.9 20 3.4 222 0.9 35 3.6 233 12.1 233 84.4 222 1.7 17 3.6 194 0.9 29 3.7 203 12.1 196
1.9 7 3.6 54 1.5 13 3.9 58 11.9 58 86.6 56 1.8 6 3.7 50 1.4 11 4.0 53 11.9 53
2.5 2 3.0 32 1.4 5 3.2 34 12.1 34 76.2 33 2.5 2 3.4 27 1.8 2 3.6 28 11.8 27
1.4 7 3.6 104 0.4 13 3.7 107 12.2 107 89.3 103 1.7 8 3.7 90 0.4 11 3.7 95 12.1 93
2.3 4 2.3 21 0.2 3 2.6 23 12.5 23 61.9 19 0.0 1 3.2 17 0.7 4 3.3 17 12.9 13
2.4 18 3.4 31 1.3 9 3.8 43 12.1 43 82.4 42 2.4 15 3.6 25 1.5 7 3.5 39 12.5 36
2.6 12 3.3 18 1.3 7 3.9 26 12.2 26 87.7 25 2.7 9 3.5 14 1.6 5 3.5 23 12.2 21
2.1 6 3.6 13 1.0 2 3.6 17 12.0 17 74.8 17 2.1 6 3.7 11 1.0 2 3.4 16 12.8 15
0.0 4 3.0 69 0.6 13 3.1 69 12.4 69 81.3 64 - - 3.4 56 0.6 5 3.5 56 12.8 53
0.0 1 2.3 10 0.4 3 2.5 10 12.1 10 64.7 10 - - 3.3 9 0.5 1 3.3 9 14.8 9
0.0 1 3.1 20 0.7 3 3.2 20 12.6 20 91.6 17 - - 3.5 18 0.5 1 3.5 18 12.8 16
0.0 2 3.1 39 0.6 7 3.2 39 12.4 39 81.1 37 - - 3.4 29 0.7 3 3.5 29 12.1 28
- - 2.9 6 - - 2.9 6 13.0 6 78.3 6 * * * * * * * * * *
1.5 45 3.3 526 0.8 103 3.4 547 12.7 547 88.0 534 2.4 36 3.5 478 0.9 81 3.6 505 12.3 497
1.5 4 3.4 76 0.6 16 3.5 78 12.3 78 92.6 78 2.0 3 3.6 70 0.7 14 3.7 72 12.3 70
0.3 6 3.0 58 0.6 20 3.2 59 13.5 59 71.6 57 0.0 1 3.6 48 1.1 13 3.7 50 12.7 48
– – 3.5 27 1.5 9 4.0 27 13.3 27 82.3 24 3.0 1 3.5 24 1.7 7 3.9 25 12.3 25
2.4 2 3.5 54 2.1 6 3.7 56 12.5 56 92.4 54 * * 3.5 50 0.8 5 3.6 50 12.2 51
3.5 1 3.3 21 0.3 2 3.3 22 12.1 22 94.2 22 4.0 3 3.1 19 0.5 1 3.2 22 11.4 21
1.8 4 3.1 39 0.5 4 3.3 40 13.2 40 86.2 39 2.3 3 3.4 38 2.5 4 3.7 39 12.4 35
0.0 2 2.7 28 0.3 2 2.6 29 12.6 29 82.1 29 * * 3.3 25 0.9 3 3.2 26 12.4 28
0.8 3 2.7 22 0.2 3 2.7 23 13.1 23 76.1 22 1.8 4 3.5 19 0.3 2 3.3 22 13.5 22
2.7 2 3.3 16 1.0 1 3.3 18 13.2 18 84.5 17 2.9 2 3.2 15 1.0 1 3.2 17 13.2 17
2.6 6 3.4 31 1.1 8 3.7 35 12.6 35 90.8 34 3.4 6 3.5 29 0.6 6 3.7 34 12.4 34
1.5 15 3.5 154 0.6 32 3.6 160 12.5 160 93.3 158 2.0 13 3.5 141 0.7 25 3.7 148 12.1 146
- - 3.5 23 1.3 6 3.8 23 12.6 23 90.4 21 * * 3.4 19 0.7 3 3.5 19 12.0 17
1.8 37 2.7 51 0.7 16 3.3 66 12.7 66 68.3 62 1.3 33 2.6 45 1.0 14 3.1 56 12.1 45
2.5 2 3.3 20 0.7 6 3.6 21 12.2 21 93.2 21 2.5 2 3.4 17 0.8 3 3.6 18 12.2 18
1.0 2 3.2 36 0.7 7 3.3 37 12.4 37 88.7 35 1.0 2 3.3 34 0.9 6 3.4 35 12.5 35
1.5 2 3.1 31 0.8 10 3.1 34 13.5 34 66.5 29 * * 3.4 25 0.7 5 3.6 25 12.0 23
1.3 6 2.2 37 0.3 6 2.4 38 14.9 38 58.1 37 2.4 7 2.8 31 0.9 5 3.2 34 12.8 31
1.0 3 1.2 9 0.0 3 1.4 10 14.8 10 21.6 9 1.0 3 2.6 8 0.7 3 2.9 9 14.7 9
1.5 3 2.6 28 0.5 3 2.8 28 15.0 28 69.8 28 3.4 4 2.9 23 1.3 2 3.3 25 12.0 22
2.5 13 3.1 51 1.6 8 3.3 61 12.0 61 89.1 59 3.0 10 3.3 47 1.9 6 3.6 55 11.9 56
1.8 2 3.1 35 1.4 8 3.4 36 12.1 36 83.6 35 3.3 2 3.5 32 0.5 2 3.5 34 12.1 32
1.0 3 3.4 14 1.3 3 3.4 16 12.0 16 82.3 16 1.0 3 3.3 14 1.9 2 3.3 16 12.0 16
0.0 2 3.4 14 1.3 3 3.4 15 12.0 15 81.8 15 0.0 2 3.3 14 1.9 2 3.3 15 12.0 15
1.8 197 3.2 1356 0.8 288 3.4 1454 12.6 1454 83.8 1396 2.0 159 3.4 1198 0.9 217 3.6 1292 12.3 1242

WorldatWork 2003-04 Salary Budget Survey 27
2003 Actual Increases 2004 Projected Increases
EXEMPT SALARIED EMPLOYEES
GENERALINCREASE/
COLA
MERITINCREASE
OTHERINCREASE
TOTALINCREASE
MONTHSBETWEEN
INCREASES
% OF EERECEIVINGINCREASE IN 2003
% n % n % n % n Mo. n % n
GENERALINCREASE/
COLA
MERITINCREASE
OTHERINCREASE
TOTALINCREASE
MONTHSBETWEEN
INCREASES
% n % n % n % n Mo. n
INDUSTRY
Nat
ion
al D
ata
U.S.
* Fewer than five survey respondents ** Total line reflects all data submitted – No DataMining = Industry Group
Metal Mfg = Industry Subgroup
Key:
Accommodation & Food Services
Administrative Support & Waste Mgmt.
Agriculture, Forestry, Fishing & Hunting
Arts, Entertainment & Recreation
Construction
Consulting, Prof., Scientific & Tech. Svcs.
Educational Services
Finance & Insurance
Credit Intermediation & Related Act.
Funds, Trusts & Other Financial Vehicles
Insurance Carriers & Related Act.
Securities, Commodities & Other Investments
Health Care & Social Assistance
Hospitals
Nursing, Ambulatory & Residential Care
Information
Internet Industries
Publishing Industries
Motion Picture, Sound Recording, Broadcasting
Mgmt of Companies & Enterprises
Manufacturing
Chemical Mfg.
Computer & Electronic Product Mfg.
Electrical Equip., Appliance & Component Mfg.
Food, Beverage & Tobacco Product Mfg.
Machinery Mfg.
Metal Mfg.
Paper Mfg., Printing & Related Act.
Plastics & Rubber Products Mfg.
Textile, Apparel, Leather & Allied Product Mfg.
Transportation Equipment Mfg.
Other Misc. Mfg.
Mining
Public Administration
Real Estate, Rental & Leasing
Retail Trade
Telecommunications
Transportation
Air Transportation
All Other Transportation
Utilities
Wholesale Trade
Other Services (except Public Admin.)
Religious, Grantmaking, Civic, Prof. & Similar Org.
Total
3.0 1 3.7 25 1.2 6 4.0 26 12.2 26 92.6 25 - - 3.6 24 1.1 6 3.8 24 11.8 24
2.1 6 3.1 32 1.8 6 3.6 34 12.6 34 84.4 32 1.6 6 3.6 30 1.4 4 3.9 32 12.6 30
3.0 1 3.1 12 - - 3.1 13 12.9 13 88.4 13 4.0 1 3.2 10 - - 3.3 11 12.0 12
2.6 4 3.7 22 3.7 4 4.6 23 12.6 23 89.1 22 3.0 2 3.5 20 0.9 2 3.9 20 12.1 18
1.8 3 3.7 23 0.8 6 3.9 24 13.5 24 81.8 22 1.3 2 3.7 17 0.5 2 3.7 18 12.0 21
1.8 33 3.6 210 1.1 68 4.1 220 12.8 220 85.4 209 1.9 26 3.8 188 1.1 55 4.2 195 12.4 192
1.7 36 2.7 87 0.8 25 3.1 104 12.2 104 73.1 101 1.9 30 2.5 67 0.5 14 2.8 83 12.0 77
1.3 34 3.5 393 1.2 69 3.7 409 12.1 409 86.6 383 1.7 25 3.7 343 1.3 57 3.8 358 12.2 349
1.5 10 3.6 96 1.2 17 3.8 101 12.0 101 86.9 97 1.9 7 3.7 90 1.6 17 3.9 94 12.1 94
1.4 9 3.5 74 1.9 15 3.8 79 12.1 79 84.0 73 1.6 6 3.6 66 2.0 13 4.0 69 12.1 69
1.0 11 3.6 179 0.9 30 3.8 184 12.1 184 91.0 170 1.8 11 3.8 148 0.7 21 3.8 156 12.1 152
0.8 4 2.7 32 0.5 6 2.8 33 12.7 33 66.6 31 0.0 1 3.4 28 0.6 5 3.5 28 12.8 23
2.4 69 3.4 196 1.9 71 4.0 244 12.1 244 91.6 232 2.4 49 3.5 177 1.9 58 3.9 219 12.0 207
2.4 57 3.4 147 2.0 61 4.0 188 12.1 188 93.0 178 2.5 39 3.4 135 2.0 51 3.9 171 12.0 161
2.4 12 3.4 49 1.5 10 3.7 56 12.1 56 87.0 54 2.3 10 3.5 42 1.2 7 3.7 48 12.3 46
1.3 14 3.2 160 1.0 43 3.5 166 12.8 166 79.8 158 2.9 8 3.5 137 1.0 28 3.7 141 12.7 135
0.8 4 2.7 30 0.7 7 2.9 31 13.7 31 67.1 31 3.0 2 3.3 25 1.0 4 3.6 26 13.8 27
1.2 3 3.4 44 0.6 9 3.5 45 13.0 45 90.8 41 1.8 2 3.5 41 0.8 7 3.6 42 12.5 39
1.7 7 3.4 86 1.2 27 3.7 90 12.5 90 79.1 86 3.5 4 3.5 71 1.0 17 3.8 73 12.4 69
1.8 2 3.3 14 0.0 1 3.3 15 12.4 15 75.6 15 3.5 1 3.6 10 1.0 1 3.7 11 14.6 12
1.5 74 3.3 782 0.8 189 3.5 809 12.7 809 84.3 786 2.3 53 3.5 681 1.0 132 3.7 717 12.4 709
1.6 6 3.5 98 0.6 30 3.7 100 12.3 100 90.6 100 1.6 4 3.6 92 0.6 23 3.7 94 12.2 89
0.2 10 2.9 127 0.8 42 3.1 129 13.3 129 67.0 126 1.6 4 3.6 99 1.2 26 3.7 106 12.8 104
0.0 4 3.2 47 1.1 17 3.6 47 13.7 47 80.0 45 1.0 3 3.5 42 1.6 11 3.9 43 12.4 45
2.9 3 3.6 73 1.3 11 3.8 75 12.3 75 93.0 73 4.0 1 3.6 66 0.8 7 3.7 66 12.2 66
4.0 1 2.9 29 0.4 5 3.0 30 12.6 30 85.2 30 4.0 3 2.9 24 0.4 3 3.0 27 11.9 27
1.6 8 3.1 51 0.5 6 3.3 54 13.2 54 83.5 52 2.2 6 3.2 47 1.9 6 3.5 50 12.3 44
1.8 4 2.7 41 0.4 3 2.8 42 12.5 42 77.8 42 7.0 1 3.4 38 1.2 3 3.6 39 12.9 40
1.9 5 3.0 33 1.1 6 3.2 36 12.8 36 82.7 35 2.0 5 3.6 29 1.2 5 3.6 33 13.1 33
2.7 2 3.4 20 1.0 1 3.4 22 13.0 22 89.2 20 2.9 2 3.3 19 1.0 1 3.3 21 13.0 21
2.3 4 3.5 42 1.2 14 3.7 46 12.7 46 85.4 44 3.6 4 3.6 41 1.4 10 3.9 45 12.6 45
1.5 27 3.5 221 0.6 54 3.7 228 12.5 228 90.2 219 2.0 20 3.6 184 0.9 37 3.8 193 12.2 195
5.0 1 3.6 27 1.7 7 3.9 29 12.5 29 88.4 27 5.0 1 3.5 23 0.8 4 3.7 24 12.0 23
1.8 61 3.1 100 1.5 31 3.7 127 12.5 127 70.2 121 1.4 51 3.0 85 1.2 25 3.3 107 12.8 89
2.7 4 3.5 33 0.7 9 3.9 34 13.6 34 91.1 33 2.6 4 3.5 28 0.5 5 3.8 29 12.5 29
1.6 10 3.3 122 1.4 20 3.5 128 12.6 128 86.8 122 2.0 5 3.5 109 1.3 14 3.6 114 12.6 108
1.1 15 2.7 80 0.8 22 2.9 87 13.4 87 67.7 80 1.1 6 3.4 70 0.9 12 3.5 73 12.2 69
1.2 14 2.5 77 0.7 19 2.8 78 14.0 78 62.9 77 1.7 10 2.9 66 0.8 15 3.1 70 12.7 65
0.5 6 1.4 19 0.6 7 1.7 19 14.6 19 35.4 19 1.1 4 2.7 16 1.0 6 3.0 18 13.9 16
1.8 8 2.8 58 0.8 12 3.2 59 13.8 59 71.9 58 2.0 6 3.0 50 0.7 9 3.2 52 12.3 49
2.3 20 3.3 88 1.4 16 3.6 101 12.0 101 90.5 97 2.8 16 3.4 80 1.6 11 3.7 91 11.9 93
2.1 6 3.2 71 1.0 10 3.3 75 12.5 75 85.0 73 3.2 5 3.5 67 1.5 6 3.6 72 12.3 69
1.2 9 3.0 43 2.4 13 3.6 47 12.1 47 79.0 46 1.6 7 3.2 41 2.8 12 3.8 46 12.3 45
0.8 6 3.0 38 2.5 11 3.6 40 11.9 40 78.8 39 1.3 6 3.3 36 3.0 10 3.9 40 12.4 39
1.8 417 3.3 2597 1.1 635 3.6 2793 12.6 2793 83.4 2674 2.0 308 3.5 2273 1.2 463 3.7 2455 12.3 2376
Nat
ion
al
Data
U.S
.
2003 Actual Increases 2004 Projected Increases
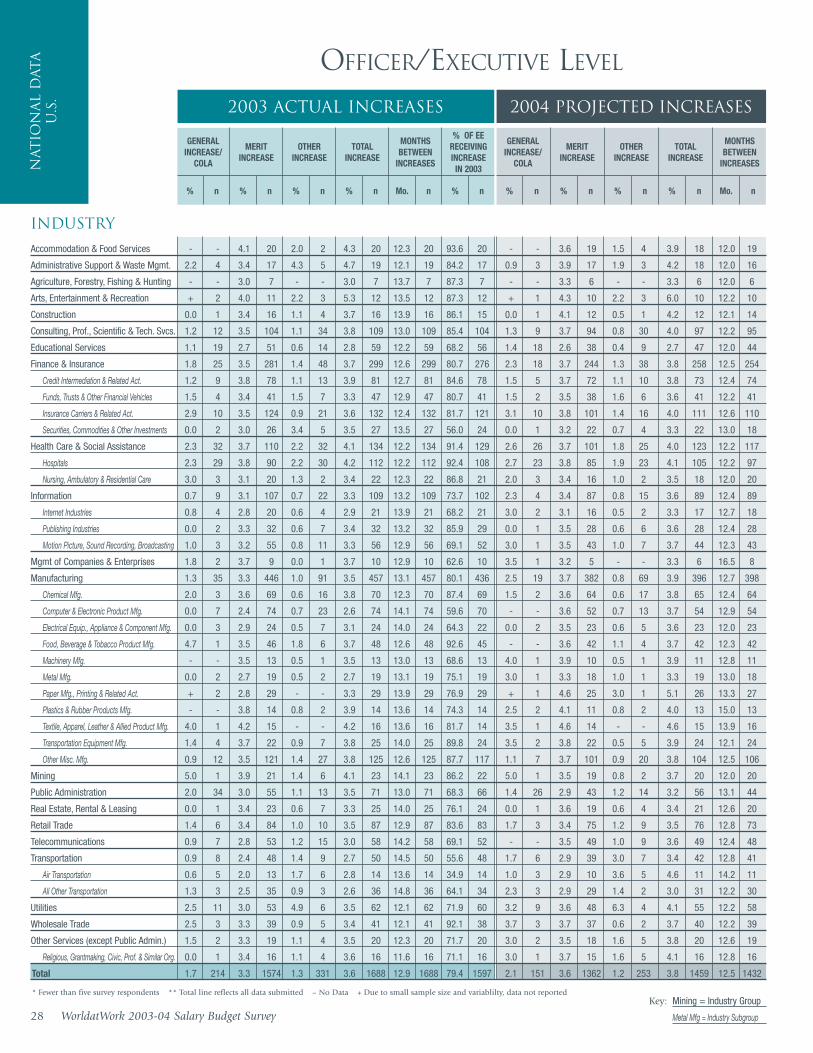
OFFICER/EXECUTIVE LEVEL
INDUSTRY
28 WorldatWork 2003-04 Salary Budget SurveyMining = Industry Group
Metal Mfg = Industry Subgroup
GENERALINCREASE/
COLA
MERITINCREASE
OTHERINCREASE
TOTALINCREASE
MONTHSBETWEEN
INCREASES
% OF EERECEIVINGINCREASE IN 2003
% n % n % n % n Mo. n % n
GENERALINCREASE/
COLA
MERITINCREASE
OTHERINCREASE
TOTALINCREASE
MONTHSBETWEEN
INCREASES
% n % n % n % n Mo. n
Accommodation & Food Services
Administrative Support & Waste Mgmt.
Agriculture, Forestry, Fishing & Hunting
Arts, Entertainment & Recreation
Construction
Consulting, Prof., Scientific & Tech. Svcs.
Educational Services
Finance & Insurance
Credit Intermediation & Related Act.
Funds, Trusts & Other Financial Vehicles
Insurance Carriers & Related Act.
Securities, Commodities & Other Investments
Health Care & Social Assistance
Hospitals
Nursing, Ambulatory & Residential Care
Information
Internet Industries
Publishing Industries
Motion Picture, Sound Recording, Broadcasting
Mgmt of Companies & Enterprises
Manufacturing
Chemical Mfg.
Computer & Electronic Product Mfg.
Electrical Equip., Appliance & Component Mfg.
Food, Beverage & Tobacco Product Mfg.
Machinery Mfg.
Metal Mfg.
Paper Mfg., Printing & Related Act.
Plastics & Rubber Products Mfg.
Textile, Apparel, Leather & Allied Product Mfg.
Transportation Equipment Mfg.
Other Misc. Mfg.
Mining
Public Administration
Real Estate, Rental & Leasing
Retail Trade
Telecommunications
Transportation
Air Transportation
All Other Transportation
Utilities
Wholesale Trade
Other Services (except Public Admin.)
Religious, Grantmaking, Civic, Prof. & Similar Org.
Total
* Fewer than five survey respondents ** Total line reflects all data submitted – No Data + Due to small sample size and variablilty, data not reportedKey:
- - 4.1 20 2.0 2 4.3 20 12.3 20 93.6 20 - - 3.6 19 1.5 4 3.9 18 12.0 19
2.2 4 3.4 17 4.3 5 4.7 19 12.1 19 84.2 17 0.9 3 3.9 17 1.9 3 4.2 18 12.0 16
- - 3.0 7 - - 3.0 7 13.7 7 87.3 7 - - 3.3 6 - - 3.3 6 12.0 6
+ 2 4.0 11 2.2 3 5.3 12 13.5 12 87.3 12 + 1 4.3 10 2.2 3 6.0 10 12.2 10
0.0 1 3.4 16 1.1 4 3.7 16 13.9 16 86.1 15 0.0 1 4.1 12 0.5 1 4.2 12 12.1 14
1.2 12 3.5 104 1.1 34 3.8 109 13.0 109 85.4 104 1.3 9 3.7 94 0.8 30 4.0 97 12.2 95
1.1 19 2.7 51 0.6 14 2.8 59 12.2 59 68.2 56 1.4 18 2.6 38 0.4 9 2.7 47 12.0 44
1.8 25 3.5 281 1.4 48 3.7 299 12.6 299 80.7 276 2.3 18 3.7 244 1.3 38 3.8 258 12.5 254
1.2 9 3.8 78 1.1 13 3.9 81 12.7 81 84.6 78 1.5 5 3.7 72 1.1 10 3.8 73 12.4 74
1.5 4 3.4 41 1.5 7 3.3 47 12.9 47 80.7 41 1.5 2 3.5 38 1.6 6 3.6 41 12.2 41
2.9 10 3.5 124 0.9 21 3.6 132 12.4 132 81.7 121 3.1 10 3.8 101 1.4 16 4.0 111 12.6 110
0.0 2 3.0 26 3.4 5 3.5 27 13.5 27 56.0 24 0.0 1 3.2 22 0.7 4 3.3 22 13.0 18
2.3 32 3.7 110 2.2 32 4.1 134 12.2 134 91.4 129 2.6 26 3.7 101 1.8 25 4.0 123 12.2 117
2.3 29 3.8 90 2.2 30 4.2 112 12.2 112 92.4 108 2.7 23 3.8 85 1.9 23 4.1 105 12.2 97
3.0 3 3.1 20 1.3 2 3.4 22 12.3 22 86.8 21 2.0 3 3.4 16 1.0 2 3.5 18 12.0 20
0.7 9 3.1 107 0.7 22 3.3 109 13.2 109 73.7 102 2.3 4 3.4 87 0.8 15 3.6 89 12.4 89
0.8 4 2.8 20 0.6 4 2.9 21 13.9 21 68.2 21 3.0 2 3.1 16 0.5 2 3.3 17 12.7 18
0.0 2 3.3 32 0.6 7 3.4 32 13.2 32 85.9 29 0.0 1 3.5 28 0.6 6 3.6 28 12.4 28
1.0 3 3.2 55 0.8 11 3.3 56 12.9 56 69.1 52 3.0 1 3.5 43 1.0 7 3.7 44 12.3 43
1.8 2 3.7 9 0.0 1 3.7 10 12.9 10 62.6 10 3.5 1 3.2 5 - - 3.3 6 16.5 8
1.3 35 3.3 446 1.0 91 3.5 457 13.1 457 80.1 436 2.5 19 3.7 382 0.8 69 3.9 396 12.7 398
2.0 3 3.6 69 0.6 16 3.8 70 12.3 70 87.4 69 1.5 2 3.6 64 0.6 17 3.8 65 12.4 64
0.0 7 2.4 74 0.7 23 2.6 74 14.1 74 59.6 70 - - 3.6 52 0.7 13 3.7 54 12.9 54
0.0 3 2.9 24 0.5 7 3.1 24 14.0 24 64.3 22 0.0 2 3.5 23 0.6 5 3.6 23 12.0 23
4.7 1 3.5 46 1.8 6 3.7 48 12.6 48 92.6 45 - - 3.6 42 1.1 4 3.7 42 12.3 42
- - 3.5 13 0.5 1 3.5 13 13.0 13 68.6 13 4.0 1 3.9 10 0.5 1 3.9 11 12.8 11
0.0 2 2.7 19 0.5 2 2.7 19 13.1 19 75.1 19 3.0 1 3.3 18 1.0 1 3.3 19 13.0 18
+ 2 2.8 29 - - 3.3 29 13.9 29 76.9 29 + 1 4.6 25 3.0 1 5.1 26 13.3 27
- - 3.8 14 0.8 2 3.9 14 13.6 14 74.3 14 2.5 2 4.1 11 0.8 2 4.0 13 15.0 13
4.0 1 4.2 15 - - 4.2 16 13.6 16 81.7 14 3.5 1 4.6 14 - - 4.6 15 13.9 16
1.4 4 3.7 22 0.9 7 3.8 25 14.0 25 89.8 24 3.5 2 3.8 22 0.5 5 3.9 24 12.1 24
0.9 12 3.5 121 1.4 27 3.8 125 12.6 125 87.7 117 1.1 7 3.7 101 0.9 20 3.8 104 12.5 106
5.0 1 3.9 21 1.4 6 4.1 23 14.1 23 86.2 22 5.0 1 3.5 19 0.8 2 3.7 20 12.0 20
2.0 34 3.0 55 1.1 13 3.5 71 13.0 71 68.3 66 1.4 26 2.9 43 1.2 14 3.2 56 13.1 44
0.0 1 3.4 23 0.6 7 3.3 25 14.0 25 76.1 24 0.0 1 3.6 19 0.6 4 3.4 21 12.6 20
1.4 6 3.4 84 1.0 10 3.5 87 12.9 87 83.6 83 1.7 3 3.4 75 1.2 9 3.5 76 12.8 73
0.9 7 2.8 53 1.2 15 3.0 58 14.2 58 69.1 52 - - 3.5 49 1.0 9 3.6 49 12.4 48
0.9 8 2.4 48 1.4 9 2.7 50 14.5 50 55.6 48 1.7 6 2.9 39 3.0 7 3.4 42 12.8 41
0.6 5 2.0 13 1.7 6 2.8 14 13.6 14 34.9 14 1.0 3 2.9 10 3.6 5 4.6 11 14.2 11
1.3 3 2.5 35 0.9 3 2.6 36 14.8 36 64.1 34 2.3 3 2.9 29 1.4 2 3.0 31 12.2 30
2.5 11 3.0 53 4.9 6 3.5 62 12.1 62 71.9 60 3.2 9 3.6 48 6.3 4 4.1 55 12.2 58
2.5 3 3.3 39 0.9 5 3.4 41 12.1 41 92.1 38 3.7 3 3.7 37 0.6 2 3.7 40 12.2 39
1.5 2 3.3 19 1.1 4 3.5 20 12.3 20 71.7 20 3.0 2 3.5 18 1.6 5 3.8 20 12.6 19
0.0 1 3.4 16 1.1 4 3.6 16 11.6 16 71.1 16 3.0 1 3.7 15 1.6 5 4.1 16 12.8 16
1.7 214 3.3 1574 1.3 331 3.6 1688 12.9 1688 79.4 1597 2.1 151 3.6 1362 1.2 253 3.8 1459 12.5 1432

INDUSTRY
2003 Actual Increases
SALARY STRUCTURE ADJUSTMENTS
NonexemptHourly
Nonunion
NonexemptSalaried
ExemptSalaried
Officer/Executive
% n % n % n % n
2004 Projected Increases
NonexemptHourly
Nonunion
NonexemptSalaried
ExemptSalaried
Officer/Executive
% n % n % n % n
Accommodation & Food Services
Administrative Support & Waste Mgmt.
Agriculture, Forestry, Fishing & Hunting
Arts, Entertainment & Recreation
Construction
Consulting, Prof., Scientific & Tech. Svcs.
Educational Services
Finance & Insurance
Credit Intermediation & Related Act.
Funds, Trusts & Other Financial Vehicles
Insurance Carriers & Related Act.
Securities, Commodities & Other Investments
Health Care & Social Assistance
Hospitals
Nursing, Ambulatory & Residential Care
Information
Internet Industries
Publishing Industries
Motion Picture, Sound Recording, Broadcasting
Mgmt of Companies & Enterprises
Manufacturing
Chemical Mfg.
Computer & Electronic Product Mfg.
Electrical Equip., Appliance & Component Mfg.
Food, Beverage & Tobacco Product Mfg.
Machinery Mfg.
Metal Mfg.
Paper Mfg., Printing & Related Act.
Plastics & Rubber Products Mfg.
Textile, Apparel, Leather & Allied Product Mfg.
Transportation Equipment Mfg.
Other Misc. Mfg.
Mining
Public Administration
Real Estate, Rental & Leasing
Retail Trade
Telecommunications
Transportation
Air Transportation
All Other Transportation
Utilities
Wholesale Trade
Other Services (except Public Admin.)
Religious, Grantmaking, Civic, Prof. & Similar Org.
Total
2.9 14 2.7 11 3.1 22 3.4 15 1.7 13 2.0 11 2.1 22 2.1 15
1.8 19 2.1 14 1.8 26 1.7 16 2.6 19 2.3 12 2.7 26 2.4 15
1.8 6 2.1 8 2.1 11 2.5 7 * * 3.1 7 2.8 8 3.2 6
1.1 15 1.8 5 1.5 15 0.8 8 2.0 14 * * 2.7 14 2.4 7
2.1 12 1.3 9 1.9 17 2.1 7 2.3 9 2.4 7 2.6 13 2.7 6
2.1 89 2.4 79 2.3 153 2.1 69 2.3 84 2.5 71 2.5 143 2.4 65
1.8 56 1.5 47 2.5 84 1.8 30 1.4 43 1.7 43 2.2 71 1.8 33
2.2 201 2.3 182 2.3 324 2.7 208 2.5 175 2.3 157 2.5 282 2.4 184
1.9 65 2.2 46 2.0 85 2.1 62 2.7 59 2.3 41 2.7 78 2.6 57
2.0 43 1.7 27 1.9 60 2.0 35 2.2 36 2.0 19 2.2 49 2.1 29
2.4 78 2.5 87 2.5 148 2.5 92 2.5 66 2.4 76 2.5 126 2.4 80
3.1 11 2.3 11 2.0 19 2.6 11 2.3 11 2.1 12 2.4 19 2.2 10
2.1 204 2.0 38 2.1 215 2.2 100 2.2 186 2.3 31 2.3 192 2.4 93
2.1 165 2.5 21 2.2 169 2.2 84 2.3 148 2.5 19 2.3 151 2.4 79
1.9 39 1.3 17 2.0 46 2.4 16 2.2 38 2.0 12 2.3 41 2.2 14
1.6 78 2.0 50 1.6 121 2.0 75 2.2 65 2.4 42 2.2 99 2.1 60
0.9 16 1.4 8 0.8 25 1.6 16 1.6 14 2.6 7 1.9 20 2.0 12
1.8 26 1.7 14 1.9 35 1.8 22 2.4 22 2.2 11 2.3 27 2.3 16
1.7 36 2.2 28 1.8 61 2.3 37 2.4 29 2.5 24 2.3 52 2.0 32
2.3 7 1.4 5 2.3 11 1.4 7 2.1 6 * * 2.2 8 1.0 5
2.0 402 2.2 453 2.2 644 2.1 322 2.4 352 2.6 413 2.6 574 2.5 287
2.1 56 2.1 64 2.4 83 2.3 56 2.2 51 2.5 59 2.5 74 2.5 48
1.6 68 1.6 47 1.7 99 1.5 50 2.2 54 2.5 40 2.5 79 2.2 38
1.8 23 2.2 22 1.9 31 1.2 14 2.6 18 2.6 20 2.7 27 2.2 12
2.0 28 2.3 46 2.3 58 2.5 30 2.3 26 2.4 40 2.5 53 2.5 28
1.2 20 1.9 19 1.4 25 0.9 7 1.8 16 2.6 18 2.3 21 3.0 6
2.1 24 2.5 34 2.4 46 2.8 17 2.8 21 3.0 31 3.0 42 2.8 17
2.1 20 1.8 27 1.8 40 1.5 25 2.7 19 2.3 25 2.5 38 2.6 22
2.3 16 1.8 20 2.0 30 1.5 10 2.3 16 2.9 20 2.5 31 2.0 11
1.3 11 2.1 16 1.9 18 1.9 11 2.3 10 2.8 15 2.9 17 3.3 11
2.4 25 2.4 26 2.6 35 2.3 16 2.6 24 2.7 27 2.9 35 2.7 16
2.1 111 2.6 132 2.5 179 2.5 86 2.4 97 2.7 118 2.7 157 2.5 78
1.3 11 2.1 20 1.9 23 1.9 14 1.7 10 2.3 16 2.4 19 2.6 13
2.1 70 1.8 61 2.0 114 1.9 60 1.8 56 1.5 53 1.8 97 1.6 52
2.0 14 2.5 19 3.3 28 2.5 17 2.6 12 2.7 15 2.6 23 2.7 13
2.0 85 1.8 29 2.1 96 2.0 55 2.2 74 2.3 28 2.4 85 2.4 47
1.0 44 1.5 28 1.2 67 1.3 36 1.6 39 2.2 22 1.8 60 1.8 33
1.4 37 2.0 32 1.6 65 1.8 35 1.8 33 2.6 24 2.1 55 2.1 28
0.9 10 0.9 8 1.0 16 1.4 8 1.9 8 2.6 6 2.3 13 1.6 6
1.6 27 2.3 24 1.7 49 1.9 27 1.8 25 2.6 18 2.0 42 2.3 22
2.2 51 2.6 52 2.4 83 1.8 35 2.4 46 2.8 46 2.6 77 2.3 34
1.9 38 2.6 29 2.3 56 2.0 26 2.4 36 2.5 26 2.4 51 2.2 27
3.4 23 2.6 11 2.1 35 2.7 15 1.7 24 1.7 11 1.9 35 2.3 14
3.6 17 2.5 10 1.9 29 2.1 12 1.8 18 1.6 10 2.0 29 2.3 11
2.0 1476 2.3 1182 2.1 2210 2.2 1157 2.2 1299 2.4 1043 2.4 1954 2.3 1037
WorldatWork 2003-04 Salary Budget Survey 29
* Fewer than five survey respondents ** Total line reflects all data submittedMining = Industry Group
Metal Mfg = Industry Subgroup
Key:
Nat
ion
al D
ata
U.S.
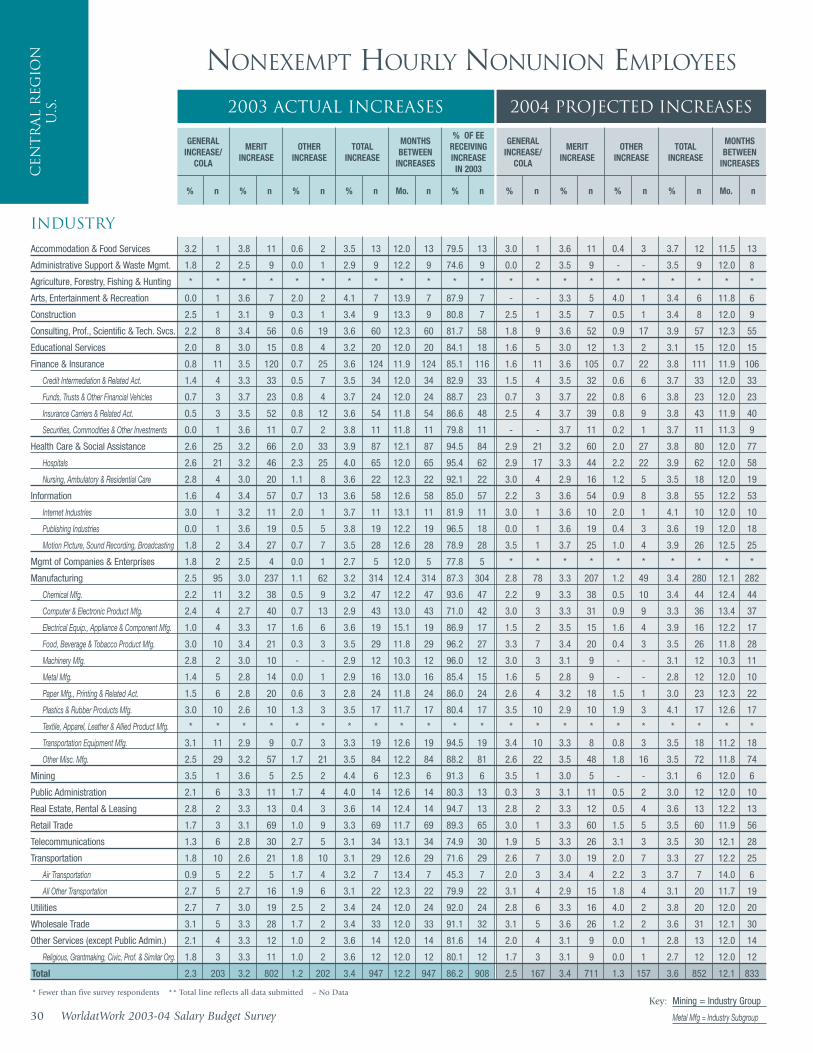
Cen
tr
al
Reg
ion
U.S
.
2003 Actual Increases 2004 Projected Increases
NONEXEMPT HOURLY NONUNION EMPLOYEES
INDUSTRY
30 WorldatWork 2003-04 Salary Budget SurveyMining = Industry Group
Metal Mfg = Industry Subgroup
GENERALINCREASE/
COLA
MERITINCREASE
OTHERINCREASE
TOTALINCREASE
MONTHSBETWEEN
INCREASES
% OF EERECEIVINGINCREASE IN 2003
% n % n % n % n Mo. n % n
GENERALINCREASE/
COLA
MERITINCREASE
OTHERINCREASE
TOTALINCREASE
MONTHSBETWEEN
INCREASES
% n % n % n % n Mo. n
Accommodation & Food Services
Administrative Support & Waste Mgmt.
Agriculture, Forestry, Fishing & Hunting
Arts, Entertainment & Recreation
Construction
Consulting, Prof., Scientific & Tech. Svcs.
Educational Services
Finance & Insurance
Credit Intermediation & Related Act.
Funds, Trusts & Other Financial Vehicles
Insurance Carriers & Related Act.
Securities, Commodities & Other Investments
Health Care & Social Assistance
Hospitals
Nursing, Ambulatory & Residential Care
Information
Internet Industries
Publishing Industries
Motion Picture, Sound Recording, Broadcasting
Mgmt of Companies & Enterprises
Manufacturing
Chemical Mfg.
Computer & Electronic Product Mfg.
Electrical Equip., Appliance & Component Mfg.
Food, Beverage & Tobacco Product Mfg.
Machinery Mfg.
Metal Mfg.
Paper Mfg., Printing & Related Act.
Plastics & Rubber Products Mfg.
Textile, Apparel, Leather & Allied Product Mfg.
Transportation Equipment Mfg.
Other Misc. Mfg.
Mining
Public Administration
Real Estate, Rental & Leasing
Retail Trade
Telecommunications
Transportation
Air Transportation
All Other Transportation
Utilities
Wholesale Trade
Other Services (except Public Admin.)
Religious, Grantmaking, Civic, Prof. & Similar Org.
Total
* Fewer than five survey respondents ** Total line reflects all data submitted – No DataKey:
3.2 1 3.8 11 0.6 2 3.5 13 12.0 13 79.5 13 3.0 1 3.6 11 0.4 3 3.7 12 11.5 13
1.8 2 2.5 9 0.0 1 2.9 9 12.2 9 74.6 9 0.0 2 3.5 9 - - 3.5 9 12.0 8
* * * * * * * * * * * * * * * * * * * * * *
0.0 1 3.6 7 2.0 2 4.1 7 13.9 7 87.9 7 - - 3.3 5 4.0 1 3.4 6 11.8 6
2.5 1 3.1 9 0.3 1 3.4 9 13.3 9 80.8 7 2.5 1 3.5 7 0.5 1 3.4 8 12.0 9
2.2 8 3.4 56 0.6 19 3.6 60 12.3 60 81.7 58 1.8 9 3.6 52 0.9 17 3.9 57 12.3 55
2.0 8 3.0 15 0.8 4 3.2 20 12.0 20 84.1 18 1.6 5 3.0 12 1.3 2 3.1 15 12.0 15
0.8 11 3.5 120 0.7 25 3.6 124 11.9 124 85.1 116 1.6 11 3.6 105 0.7 22 3.8 111 11.9 106
1.4 4 3.3 33 0.5 7 3.5 34 12.0 34 82.9 33 1.5 4 3.5 32 0.6 6 3.7 33 12.0 33
0.7 3 3.7 23 0.8 4 3.7 24 12.0 24 88.7 23 0.7 3 3.7 22 0.8 6 3.8 23 12.0 23
0.5 3 3.5 52 0.8 12 3.6 54 11.8 54 86.6 48 2.5 4 3.7 39 0.8 9 3.8 43 11.9 40
0.0 1 3.6 11 0.7 2 3.8 11 11.8 11 79.8 11 - - 3.7 11 0.2 1 3.7 11 11.3 9
2.6 25 3.2 66 2.0 33 3.9 87 12.1 87 94.5 84 2.9 21 3.2 60 2.0 27 3.8 80 12.0 77
2.6 21 3.2 46 2.3 25 4.0 65 12.0 65 95.4 62 2.9 17 3.3 44 2.2 22 3.9 62 12.0 58
2.8 4 3.0 20 1.1 8 3.6 22 12.3 22 92.1 22 3.0 4 2.9 16 1.2 5 3.5 18 12.0 19
1.6 4 3.4 57 0.7 13 3.6 58 12.6 58 85.0 57 2.2 3 3.6 54 0.9 8 3.8 55 12.2 53
3.0 1 3.2 11 2.0 1 3.7 11 13.1 11 81.9 11 3.0 1 3.6 10 2.0 1 4.1 10 12.0 10
0.0 1 3.6 19 0.5 5 3.8 19 12.2 19 96.5 18 0.0 1 3.6 19 0.4 3 3.6 19 12.0 18
1.8 2 3.4 27 0.7 7 3.5 28 12.6 28 78.9 28 3.5 1 3.7 25 1.0 4 3.9 26 12.5 25
1.8 2 2.5 4 0.0 1 2.7 5 12.0 5 77.8 5 * * * * * * * * * *
2.5 95 3.0 237 1.1 62 3.2 314 12.4 314 87.3 304 2.8 78 3.3 207 1.2 49 3.4 280 12.1 282
2.2 11 3.2 38 0.5 9 3.2 47 12.2 47 93.6 47 2.2 9 3.3 38 0.5 10 3.4 44 12.4 44
2.4 4 2.7 40 0.7 13 2.9 43 13.0 43 71.0 42 3.0 3 3.3 31 0.9 9 3.3 36 13.4 37
1.0 4 3.3 17 1.6 6 3.6 19 15.1 19 86.9 17 1.5 2 3.5 15 1.6 4 3.9 16 12.2 17
3.0 10 3.4 21 0.3 3 3.5 29 11.8 29 96.2 27 3.3 7 3.4 20 0.4 3 3.5 26 11.8 28
2.8 2 3.0 10 - - 2.9 12 10.3 12 96.0 12 3.0 3 3.1 9 - - 3.1 12 10.3 11
1.4 5 2.8 14 0.0 1 2.9 16 13.0 16 85.4 15 1.6 5 2.8 9 - - 2.8 12 12.0 10
1.5 6 2.8 20 0.6 3 2.8 24 11.8 24 86.0 24 2.6 4 3.2 18 1.5 1 3.0 23 12.3 22
3.0 10 2.6 10 1.3 3 3.5 17 11.7 17 80.4 17 3.5 10 2.9 10 1.9 3 4.1 17 12.6 17
* * * * * * * * * * * * * * * * * * * * * *
3.1 11 2.9 9 0.7 3 3.3 19 12.6 19 94.5 19 3.4 10 3.3 8 0.8 3 3.5 18 11.2 18
2.5 29 3.2 57 1.7 21 3.5 84 12.2 84 88.2 81 2.6 22 3.5 48 1.8 16 3.5 72 11.8 74
3.5 1 3.6 5 2.5 2 4.4 6 12.3 6 91.3 6 3.5 1 3.0 5 - - 3.1 6 12.0 6
2.1 6 3.3 11 1.7 4 4.0 14 12.6 14 80.3 13 0.3 3 3.1 11 0.5 2 3.0 12 12.0 10
2.8 2 3.3 13 0.4 3 3.6 14 12.4 14 94.7 13 2.8 2 3.3 12 0.5 4 3.6 13 12.2 13
1.7 3 3.1 69 1.0 9 3.3 69 11.7 69 89.3 65 3.0 1 3.3 60 1.5 5 3.5 60 11.9 56
1.3 6 2.8 30 2.7 5 3.1 34 13.1 34 74.9 30 1.9 5 3.3 26 3.1 3 3.5 30 12.1 28
1.8 10 2.6 21 1.8 10 3.1 29 12.6 29 71.6 29 2.6 7 3.0 19 2.0 7 3.3 27 12.2 25
0.9 5 2.2 5 1.7 4 3.2 7 13.4 7 45.3 7 2.0 3 3.4 4 2.2 3 3.7 7 14.0 6
2.7 5 2.7 16 1.9 6 3.1 22 12.3 22 79.9 22 3.1 4 2.9 15 1.8 4 3.1 20 11.7 19
2.7 7 3.0 19 2.5 2 3.4 24 12.0 24 92.0 24 2.8 6 3.3 16 4.0 2 3.8 20 12.0 20
3.1 5 3.3 28 1.7 2 3.4 33 12.0 33 91.1 32 3.1 5 3.6 26 1.2 2 3.6 31 12.1 30
2.1 4 3.3 12 1.0 2 3.6 14 12.0 14 81.6 14 2.0 4 3.1 9 0.0 1 2.8 13 12.0 14
1.8 3 3.3 11 1.0 2 3.6 12 12.0 12 80.1 12 1.7 3 3.1 9 0.0 1 2.7 12 12.0 12
2.3 203 3.2 802 1.2 202 3.4 947 12.2 947 86.2 908 2.5 167 3.4 711 1.3 157 3.6 852 12.1 833

WorldatWork 2003-04 Salary Budget Survey 31
2003 Actual Increases 2004 Projected Increases
NONEXEMPT SALARIED EMPLOYEES
GENERALINCREASE/
COLA
MERITINCREASE
OTHERINCREASE
TOTALINCREASE
MONTHSBETWEEN
INCREASES
% OF EERECEIVINGINCREASE IN 2003
% n % n % n % n Mo. n % n
GENERALINCREASE/
COLA
MERITINCREASE
OTHERINCREASE
TOTALINCREASE
MONTHSBETWEEN
INCREASES
% n % n % n % n Mo. n
INDUSTRY
Cen
tr
al R
egio
nU
.S.
* Fewer than five survey respondents ** Total line reflects all data submitted – No DataMining = Industry Group
Metal Mfg = Industry Subgroup
Key:
Accommodation & Food Services
Administrative Support & Waste Mgmt.
Agriculture, Forestry, Fishing & Hunting
Arts, Entertainment & Recreation
Construction
Consulting, Prof., Scientific & Tech. Svcs.
Educational Services
Finance & Insurance
Credit Intermediation & Related Act.
Funds, Trusts & Other Financial Vehicles
Insurance Carriers & Related Act.
Securities, Commodities & Other Investments
Health Care & Social Assistance
Hospitals
Nursing, Ambulatory & Residential Care
Information
Internet Industries
Publishing Industries
Motion Picture, Sound Recording, Broadcasting
Mgmt of Companies & Enterprises
Manufacturing
Chemical Mfg.
Computer & Electronic Product Mfg.
Electrical Equip., Appliance & Component Mfg.
Food, Beverage & Tobacco Product Mfg.
Machinery Mfg.
Metal Mfg.
Paper Mfg., Printing & Related Act.
Plastics & Rubber Products Mfg.
Textile, Apparel, Leather & Allied Product Mfg.
Transportation Equipment Mfg.
Other Misc. Mfg.
Mining
Public Administration
Real Estate, Rental & Leasing
Retail Trade
Telecommunications
Transportation
Air Transportation
All Other Transportation
Utilities
Wholesale Trade
Other Services (except Public Admin.)
Religious, Grantmaking, Civic, Prof. & Similar Org.
Total
- - 3.4 7 3.5 1 3.9 7 12.9 7 80.0 7 - - 3.5 6 1.8 2 4.1 6 12.3 6
- - 2.8 4 0.5 2 2.4 5 14.4 5 57.1 5 - - 4.3 4 0.8 2 3.7 5 15.0 4
3.0 1 2.5 4 - - 2.6 5 12.0 5 72.3 5 4.0 1 4.0 4 - - 4.0 5 12.0 5
* * * * * * * * * * * * * * * * * * * * * *
0.0 1 3.5 8 0.5 2 3.6 8 13.5 8 88.9 7 0.0 1 3.6 7 0.5 1 3.7 7 12.0 7
1.9 8 3.3 52 1.0 14 3.7 55 12.9 55 78.3 52 2.0 5 3.6 44 0.8 13 3.7 48 12.2 44
2.9 2 3.6 11 2.0 1 3.7 13 12.0 13 94.0 11 2.0 1 3.8 8 2.0 1 3.8 9 12.0 9
1.8 12 3.3 119 1.0 17 3.5 124 12.3 124 84.5 118 1.8 9 3.6 104 1.1 14 3.7 109 12.2 107
2.1 5 3.5 28 1.6 8 4.1 30 12.1 30 87.4 29 1.5 4 3.7 28 1.6 7 4.1 29 12.0 29
- - 2.9 13 1.0 1 3.0 13 12.0 13 76.9 13 - - 3.3 11 1.0 1 3.4 11 12.3 11
1.6 4 3.5 63 0.4 7 3.6 65 12.4 65 87.7 62 2.1 5 3.7 52 0.4 5 3.6 56 12.3 56
1.7 3 2.3 13 - - 2.5 14 12.9 14 67.3 12 - - 3.4 11 - - 3.4 11 12.0 9
3.1 7 3.3 9 1.4 2 3.9 14 12.0 14 94.7 14 3.2 6 3.0 7 0.7 1 3.4 12 12.0 12
3.1 6 2.9 4 0.7 1 3.8 8 12.0 8 94.5 8 3.2 4 2.8 4 0.7 1 3.5 7 12.0 7
3.3 1 3.6 5 2.0 1 3.9 6 12.0 6 95.0 6 3.0 2 3.3 3 - - 3.2 5 12.0 5
0.0 3 2.9 42 0.4 8 3.0 42 12.8 42 78.3 39 - - 3.5 34 0.5 2 3.5 34 12.5 32
* * * * * * * * * * * * * * * * * * * * * *
- - 3.2 13 0.7 3 3.3 13 12.9 13 96.7 12 - - 3.6 13 0.5 1 3.6 13 12.0 11
0.0 2 3.0 25 0.3 4 3.0 25 12.8 25 74.7 23 - - 3.4 18 0.5 1 3.4 18 12.2 18
* * * * * * * * * * * * * * * * * * * * * *
1.4 24 3.2 337 0.8 69 3.4 347 12.7 347 87.5 339 2.6 19 3.5 305 0.9 55 3.6 321 12.4 315
1.0 3 3.2 53 0.7 11 3.4 54 12.4 54 90.2 54 1.5 2 3.4 49 0.8 10 3.6 50 12.6 48
0.0 4 2.9 32 0.4 14 3.1 32 14.3 32 64.5 32 - - 3.4 24 1.0 8 3.6 25 13.3 24
- - 3.4 17 2.1 6 4.1 17 13.3 17 80.4 15 3.0 1 3.4 15 2.2 5 4.0 16 12.4 16
0.0 1 3.5 38 0.9 4 3.6 38 12.4 38 93.0 36 - - 3.5 36 0.8 5 3.7 36 12.3 37
3.5 1 3.3 15 0.1 1 3.3 16 11.4 16 94.9 16 4.0 3 3.2 13 - - 3.4 16 11.1 15
0.0 1 3.2 23 0.5 2 3.2 23 13.6 23 86.7 22 - - 3.3 22 1.0 1 3.4 22 12.4 19
0.0 1 2.8 26 0.3 2 2.8 26 12.4 26 87.7 26 - - 3.3 23 0.9 3 3.3 24 12.5 25
0.0 1 2.6 17 0.3 2 2.6 17 12.3 17 69.2 17 1.7 3 3.5 15 0.3 2 3.4 17 13.9 17
* * * * * * * * * * * * * * * * * * * * * *
2.6 6 3.4 24 1.2 7 3.7 28 12.8 28 91.5 27 3.3 5 3.5 23 0.6 5 3.7 27 12.2 27
2.1 6 3.5 88 0.7 19 3.6 92 12.6 92 93.7 91 2.1 5 3.5 81 0.8 15 3.7 84 12.1 83
- - 3.7 8 1.8 3 4.3 8 12.9 8 93.6 8 - - 3.1 6 - - 3.1 6 12.0 6
2.2 11 2.7 14 1.3 7 3.5 20 12.4 20 63.6 20 1.0 10 2.4 12 1.4 5 2.7 17 12.0 13
3.0 1 3.5 14 0.5 3 3.6 15 12.3 15 93.8 15 3.0 1 3.5 13 0.8 2 3.6 14 12.3 14
1.0 2 3.0 27 0.7 7 3.2 28 12.5 28 86.6 27 1.0 2 3.2 26 0.9 6 3.3 27 12.7 27
1.5 2 3.1 16 0.9 7 3.3 18 14.9 18 66.2 14 - - 3.4 12 0.6 4 3.6 12 12.0 12
0.0 2 2.3 19 0.0 2 2.3 19 17.3 19 58.5 18 2.0 3 2.7 15 0.5 2 2.8 17 13.6 15
0.0 1 1.8 6 0.0 1 1.8 6 16.7 6 18.8 5 0.0 1 2.8 5 0.0 1 2.8 5 16.8 5
0.0 1 2.6 13 0.0 1 2.6 13 17.5 13 73.7 13 3.0 2 2.7 10 1.0 1 2.9 12 12.0 10
3.5 1 3.2 20 2.6 2 3.5 21 12.3 21 96.8 21 3.5 1 3.4 18 2.7 2 3.7 19 12.0 19
1.8 2 3.2 24 0.8 4 3.3 25 12.1 25 82.1 25 3.3 2 3.6 21 0.8 1 3.6 23 12.1 22
1.5 2 3.6 5 0.2 1 3.1 7 12.0 7 81.1 7 1.5 2 3.7 5 - - 3.1 7 12.0 7
0.0 1 3.6 5 0.2 1 3.1 6 12.0 6 79.7 6 0.0 1 3.7 5 - - 3.1 6 12.0 6
1.8 82 3.2 747 0.9 153 3.4 788 12.8 788 84.3 759 2.1 63 3.5 656 1.0 113 3.6 703 12.4 681

Cen
tr
al
Reg
ion
U.S
.
2003 Actual Increases 2004 Projected Increases
EXEMPT SALARIED EMPLOYEES
INDUSTRY
32 WorldatWork 2003-04 Salary Budget SurveyMining = Industry Group
Metal Mfg = Industry Subgroup
GENERALINCREASE/
COLA
MERITINCREASE
OTHERINCREASE
TOTALINCREASE
MONTHSBETWEEN
INCREASES
% OF EERECEIVINGINCREASE IN 2003
% n % n % n % n Mo. n % n
GENERALINCREASE/
COLA
MERITINCREASE
OTHERINCREASE
TOTALINCREASE
MONTHSBETWEEN
INCREASES
% n % n % n % n Mo. n
Accommodation & Food Services
Administrative Support & Waste Mgmt.
Agriculture, Forestry, Fishing & Hunting
Arts, Entertainment & Recreation
Construction
Consulting, Prof., Scientific & Tech. Svcs.
Educational Services
Finance & Insurance
Credit Intermediation & Related Act.
Funds, Trusts & Other Financial Vehicles
Insurance Carriers & Related Act.
Securities, Commodities & Other Investments
Health Care & Social Assistance
Hospitals
Nursing, Ambulatory & Residential Care
Information
Internet Industries
Publishing Industries
Motion Picture, Sound Recording, Broadcasting
Mgmt of Companies & Enterprises
Manufacturing
Chemical Mfg.
Computer & Electronic Product Mfg.
Electrical Equip., Appliance & Component Mfg.
Food, Beverage & Tobacco Product Mfg.
Machinery Mfg.
Metal Mfg.
Paper Mfg., Printing & Related Act.
Plastics & Rubber Products Mfg.
Textile, Apparel, Leather & Allied Product Mfg.
Transportation Equipment Mfg.
Other Misc. Mfg.
Mining
Public Administration
Real Estate, Rental & Leasing
Retail Trade
Telecommunications
Transportation
Air Transportation
All Other Transportation
Utilities
Wholesale Trade
Other Services (except Public Admin.)
Religious, Grantmaking, Civic, Prof. & Similar Org.
Total
* Fewer than five survey respondents ** Total line reflects all data submitted – No Data + Due to small sample size and variablilty, data not reportedKey:
- - 3.6 16 1.0 5 4.0 16 12.4 16 89.8 15 - - 3.6 15 0.9 5 3.9 15 12.1 15
1.8 2 2.4 11 0.3 2 2.7 11 13.8 11 66.8 11 0.0 2 3.6 11 0.5 1 3.7 11 13.8 10
3.0 1 2.9 6 - - 2.9 7 12.0 7 80.6 7 4.0 1 3.6 5 - - 3.7 6 12.0 6
2.5 2 4.1 7 + 2 6.7 7 13.9 7 94.3 7 3.0 1 3.6 6 - - 4.1 6 11.8 6
1.3 2 3.5 14 0.7 4 3.6 15 13.6 15 85.0 13 1.3 2 3.6 12 0.5 2 3.6 13 12.0 14
2.0 14 3.5 98 0.8 26 3.7 105 13.1 105 80.0 99 2.1 12 3.6 87 0.8 23 3.8 93 12.5 89
2.1 7 3.0 21 0.8 4 3.2 25 12.0 25 87.7 23 2.2 5 2.9 15 1.3 2 3.2 18 12.0 18
1.2 19 3.5 203 1.0 35 3.6 211 12.2 211 86.0 199 1.6 15 3.7 175 0.9 28 3.8 184 12.1 179
2.0 5 3.6 47 1.3 10 3.9 49 12.0 49 87.6 49 1.5 4 3.7 47 1.3 10 4.0 48 12.0 48
0.7 3 3.5 30 1.0 5 3.6 31 11.8 31 84.5 30 0.7 3 3.6 27 0.8 5 3.7 28 12.0 28
1.1 7 3.6 102 0.8 16 3.6 106 12.2 106 89.6 97 2.1 8 3.7 79 0.8 11 3.7 86 12.2 84
0.8 4 2.7 21 0.8 3 2.8 22 13.0 22 66.6 20 - - 3.5 19 0.2 1 3.5 19 12.4 16
2.6 21 3.3 71 2.0 26 3.8 89 12.1 89 94.5 87 2.9 18 3.4 63 1.9 21 3.8 81 11.9 77
2.6 19 3.4 48 2.2 20 3.9 65 12.0 65 95.6 63 2.9 15 3.4 46 2.0 18 3.8 62 11.9 57
2.7 2 3.2 23 1.5 6 3.7 24 12.3 24 91.4 24 3.0 3 3.2 17 1.3 3 3.5 19 12.0 20
0.5 6 3.2 87 0.6 19 3.4 87 13.0 87 80.5 83 1.5 2 3.6 77 0.8 11 3.7 77 12.7 74
1.0 3 2.6 16 0.8 3 3.0 16 13.6 16 67.0 16 3.0 1 3.5 14 1.5 2 4.0 14 13.8 14
0.0 1 3.5 24 0.6 6 3.6 24 12.6 24 95.8 22 0.0 1 3.6 24 0.4 3 3.6 24 12.0 22
0.0 2 3.3 47 0.6 10 3.4 47 13.1 47 77.9 45 - - 3.6 39 0.8 6 3.7 39 12.7 38
1.8 2 2.5 5 0.0 1 2.7 6 12.0 6 82.3 6 3.5 1 3.5 4 1.0 1 3.7 5 14.4 5
1.4 44 3.2 467 0.8 114 3.4 480 12.8 480 84.3 467 2.3 29 3.5 411 1.0 81 3.7 432 12.5 424
1.2 5 3.3 67 0.8 20 3.6 68 12.4 68 90.6 68 1.0 3 3.5 63 0.7 15 3.7 64 12.4 60
0.0 6 2.8 67 0.6 24 3.0 67 13.5 67 65.5 66 3.0 1 3.5 52 0.9 15 3.6 55 13.3 54
0.0 2 3.3 25 1.8 8 3.8 25 14.1 25 77.9 23 1.5 2 3.5 22 2.1 6 4.0 23 12.3 24
4.0 1 3.5 47 0.7 6 3.7 47 12.3 47 93.4 45 4.0 1 3.5 45 0.8 6 3.7 45 12.2 46
4.0 1 3.2 16 0.3 2 3.3 17 12.1 17 95.3 17 4.0 3 3.1 14 0.8 1 3.3 17 11.8 16
0.8 4 3.1 30 0.4 3 3.2 31 13.7 31 82.1 29 1.5 2 3.1 26 0.6 2 3.2 27 12.4 22
0.0 2 2.7 36 0.4 3 2.7 36 12.5 36 79.7 36 - - 3.4 33 1.2 3 3.4 34 13.1 34
2.3 3 2.7 22 1.5 4 3.0 24 12.2 24 75.9 24 2.0 4 3.6 20 1.4 4 3.7 23 13.6 23
- - 3.6 5 1.0 1 3.8 5 12.0 5 97.5 4 - - 3.5 5 1.0 1 3.7 5 12.0 5
2.3 4 3.4 31 1.1 12 3.8 34 12.9 34 85.8 32 3.5 3 3.6 30 1.1 8 3.9 33 11.9 33
1.6 16 3.4 121 0.5 31 3.6 126 12.6 126 90.1 123 2.1 10 3.6 101 0.9 20 3.8 106 12.1 107
- - 3.7 9 1.7 3 4.3 9 12.9 9 89.4 9 - - 3.3 7 - - 3.3 7 12.0 7
2.1 13 3.1 22 1.0 7 3.5 29 12.2 29 66.7 28 0.9 11 2.7 20 0.8 5 2.6 26 12.0 21
3.3 2 3.4 21 0.5 5 3.7 22 13.4 22 90.6 21 3.3 2 3.3 19 0.5 4 3.6 20 12.4 20
0.7 3 3.2 74 1.5 14 3.4 75 12.6 75 88.2 72 1.0 2 3.5 66 1.1 9 3.6 67 12.6 63
1.3 9 3.0 43 0.9 9 3.2 47 13.7 47 73.7 42 1.6 4 3.5 38 0.6 4 3.6 39 12.1 37
0.8 7 2.6 43 0.8 11 3.0 43 14.9 43 69.8 42 2.1 5 3.0 37 1.1 8 3.2 40 12.8 37
0.0 4 1.9 11 1.0 4 2.3 11 16.5 11 43.8 11 0.8 2 2.9 10 1.3 3 3.1 11 15.0 10
1.9 3 2.9 32 0.7 7 3.2 32 14.3 32 79.0 31 3.0 3 3.0 27 0.9 5 3.3 29 11.9 27
2.7 7 3.4 32 2.7 5 3.8 37 12.2 37 93.9 37 2.8 6 3.4 29 3.5 3 3.8 33 12.0 33
2.6 4 3.2 44 1.1 6 3.4 47 12.6 47 82.7 46 3.3 4 3.6 40 1.0 3 3.6 44 12.1 42
1.5 5 3.3 18 3.6 5 4.0 21 12.0 21 88.2 21 1.3 4 3.1 17 5.3 3 3.7 20 12.1 20
0.5 3 3.3 17 3.6 5 4.2 18 12.0 18 87.2 18 0.7 3 3.3 16 5.3 3 3.9 18 12.1 18
1.7 170 3.3 1312 1.0 303 3.5 1389 12.7 1389 84.1 1335 2.1 126 3.5 1154 1.1 214 3.7 1237 12.4 1197

WorldatWork 2003-04 Salary Budget Survey 33
2003 Actual Increases 2004 Projected Increases
OFFICER/EXECUTIVE LEVEL
GENERALINCREASE/
COLA
MERITINCREASE
OTHERINCREASE
TOTALINCREASE
MONTHSBETWEEN
INCREASES
% OF EERECEIVINGINCREASE IN 2003
% n % n % n % n Mo. n % n
GENERALINCREASE/
COLA
MERITINCREASE
OTHERINCREASE
TOTALINCREASE
MONTHSBETWEEN
INCREASES
% n % n % n % n Mo. n
INDUSTRY
Cen
tr
al R
egio
nU
.S.
* Fewer than five survey respondents ** Total line reflects all data submitted – No DataMining = Industry Group
Metal Mfg = Industry Subgroup
Key:
Accommodation & Food Services
Administrative Support & Waste Mgmt.
Agriculture, Forestry, Fishing & Hunting
Arts, Entertainment & Recreation
Construction
Consulting, Prof., Scientific & Tech. Svcs.
Educational Services
Finance & Insurance
Credit Intermediation & Related Act.
Funds, Trusts & Other Financial Vehicles
Insurance Carriers & Related Act.
Securities, Commodities & Other Investments
Health Care & Social Assistance
Hospitals
Nursing, Ambulatory & Residential Care
Information
Internet Industries
Publishing Industries
Motion Picture, Sound Recording, Broadcasting
Mgmt of Companies & Enterprises
Manufacturing
Chemical Mfg.
Computer & Electronic Product Mfg.
Electrical Equip., Appliance & Component Mfg.
Food, Beverage & Tobacco Product Mfg.
Machinery Mfg.
Metal Mfg.
Paper Mfg., Printing & Related Act.
Plastics & Rubber Products Mfg.
Textile, Apparel, Leather & Allied Product Mfg.
Transportation Equipment Mfg.
Other Misc. Mfg.
Mining
Public Administration
Real Estate, Rental & Leasing
Retail Trade
Telecommunications
Transportation
Air Transportation
All Other Transportation
Utilities
Wholesale Trade
Other Services (except Public Admin.)
Religious, Grantmaking, Civic, Prof. & Similar Org.
Total
- - 3.9 13 2.0 2 4.2 13 12.5 13 91.0 13 - - 3.7 12 1.3 3 4.0 12 12.5 12
1.8 2 2.4 7 0.3 2 3.0 7 12.3 7 79.7 7 0.0 2 3.6 7 0.5 1 3.6 7 12.0 6
* * * * * * * * * * * * * * * * * * * * * *
* * * * * * * * * * * * * * * * * * * * * *
0.0 1 3.5 10 0.8 3 3.7 10 13.3 10 91.2 9 0.0 1 3.7 8 0.5 1 3.8 8 12.1 9
1.5 9 3.5 57 1.1 15 3.7 61 13.4 61 80.9 58 1.9 6 3.7 52 0.8 14 3.9 55 12.3 53
2.1 4 3.5 16 2.0 1 3.7 18 12.0 18 91.4 16 2.7 4 2.8 12 2.0 1 3.3 14 12.0 14
2.8 12 3.4 150 1.7 25 3.6 161 13.0 161 80.7 149 3.1 10 3.7 132 1.4 20 3.8 142 12.8 139
2.0 4 3.5 35 1.5 7 3.8 37 13.0 37 86.2 37 1.0 3 3.7 36 1.5 7 3.9 37 12.6 37
- - 3.4 17 1.8 3 3.3 19 14.2 19 83.4 18 - - 3.5 16 1.5 4 3.6 17 13.0 18
4.3 6 3.4 77 0.8 11 3.6 83 12.4 83 81.1 75 4.0 7 3.8 62 1.6 7 3.9 70 12.9 69
0.0 2 3.3 18 5.5 3 4.0 19 14.1 19 59.6 16 - - 3.4 15 0.2 1 3.4 15 12.5 12
2.4 11 3.5 39 1.2 11 3.7 47 12.1 47 90.2 47 3.8 9 3.7 35 1.5 9 4.0 44 12.3 44
2.4 10 3.8 27 1.1 9 3.9 35 12.0 35 91.4 35 4.0 7 3.9 27 1.6 7 4.1 35 12.4 32
2.0 1 3.0 12 1.3 2 3.4 12 12.5 12 86.9 12 3.0 2 3.0 8 1.0 2 3.6 9 12.0 12
0.6 5 3.1 61 0.5 12 3.3 61 13.0 61 76.7 57 1.5 2 3.6 52 0.6 6 3.7 52 12.2 52
1.5 2 2.7 11 0.5 1 3.0 11 13.2 11 75.5 11 3.0 1 3.3 9 - - 3.7 9 12.1 9
0.0 1 3.4 18 0.6 5 3.6 18 13.2 18 94.8 16 0.0 1 3.6 18 0.4 3 3.7 18 12.0 18
0.0 2 3.1 32 0.4 6 3.2 32 12.9 32 67.5 30 - - 3.7 25 0.8 3 3.8 25 12.3 25
* * * * * * * * * * * * * * * * * * * * * *
0.8 26 3.2 299 0.7 56 3.3 306 13.2 306 81.6 295 2.1 14 3.7 262 0.9 42 3.7 274 12.8 270
2.0 3 3.4 51 0.8 9 3.6 52 12.4 52 86.9 52 1.5 2 3.4 48 0.8 10 3.6 49 12.6 47
0.0 5 2.6 44 0.8 14 2.8 44 14.0 44 62.2 42 - - 3.5 34 0.6 8 3.5 35 13.1 34
0.0 2 3.0 19 0.1 5 3.0 19 14.6 19 65.4 17 0.0 1 3.5 18 0.5 4 3.6 18 12.0 18
- - 3.6 31 0.3 3 3.7 31 12.9 31 94.1 29 - - 3.6 29 1.2 3 3.7 29 12.4 30
- - 4.1 6 - - 4.1 6 11.2 6 87.0 6 4.0 1 3.9 5 - - 3.9 6 11.4 5
0.0 2 2.5 13 0.5 2 2.6 13 13.8 13 72.8 13 3.0 1 3.3 12 1.0 1 3.3 13 13.5 12
0.0 1 2.6 26 - - 2.6 26 14.1 26 78.1 26 - - 4.2 23 3.0 1 4.1 24 13.5 24
- - 3.5 11 1.0 1 3.6 11 13.0 11 69.7 11 2.5 2 4.3 9 1.0 1 4.0 11 15.5 11
- - 3.4 5 - - 3.4 5 12.8 5 73.8 4 * * * * * * * * * *
1.4 4 3.7 19 1.0 6 3.8 22 14.2 22 88.6 21 3.5 2 3.8 19 0.6 4 3.9 21 12.1 21
1.2 9 3.4 74 0.8 16 3.6 77 12.4 77 90.2 74 1.5 5 3.7 61 1.2 10 3.8 64 12.4 63
- - 3.9 7 1.7 3 4.7 7 12.4 7 90.2 7 - - 3.2 6 - - 3.2 6 12.0 6
2.7 8 2.8 14 1.0 3 3.8 17 12.5 17 74.3 16 1.1 7 2.8 11 0.3 3 2.6 15 12.0 12
0.0 1 3.6 16 0.7 4 3.5 17 14.2 17 75.2 17 0.0 1 3.6 15 0.7 3 3.5 16 12.8 16
0.0 2 3.2 53 0.8 8 3.3 53 13.2 53 84.3 51 0.0 1 3.3 47 1.0 6 3.4 46 13.2 44
1.5 4 3.1 31 1.7 8 3.3 35 14.3 35 73.2 30 - - 3.7 29 0.6 4 3.7 29 12.0 28
0.0 4 2.4 26 2.2 5 2.8 27 15.9 27 55.4 25 2.3 3 3.1 21 3.7 3 3.4 24 13.3 23
0.0 3 2.8 7 3.3 3 3.7 8 14.8 8 48.5 8 0.0 1 3.4 6 5.0 2 4.3 7 15.4 7
0.0 1 2.3 19 0.6 2 2.4 19 16.4 19 58.6 17 3.5 2 2.9 15 1.2 1 3.1 17 12.4 16
2.6 5 3.0 21 - - 3.1 24 12.4 24 73.2 24 2.8 4 3.8 19 5.0 1 4.2 21 12.0 22
2.5 3 3.2 25 1.0 4 3.4 27 12.1 27 90.4 25 3.7 3 3.6 23 0.6 2 3.7 26 12.2 25
3.0 1 3.2 8 1.0 1 3.3 9 13.3 9 75.9 9 3.0 1 2.9 8 0.0 1 2.9 9 12.0 8
- - 3.7 7 1.0 1 3.8 7 12.0 7 84.0 7 - - 3.4 7 0.0 1 3.4 7 12.0 7
1.7 101 3.3 863 1.1 165 3.5 911 13.1 911 80.8 866 2.5 70 3.6 759 1.1 121 3.8 809 12.6 792
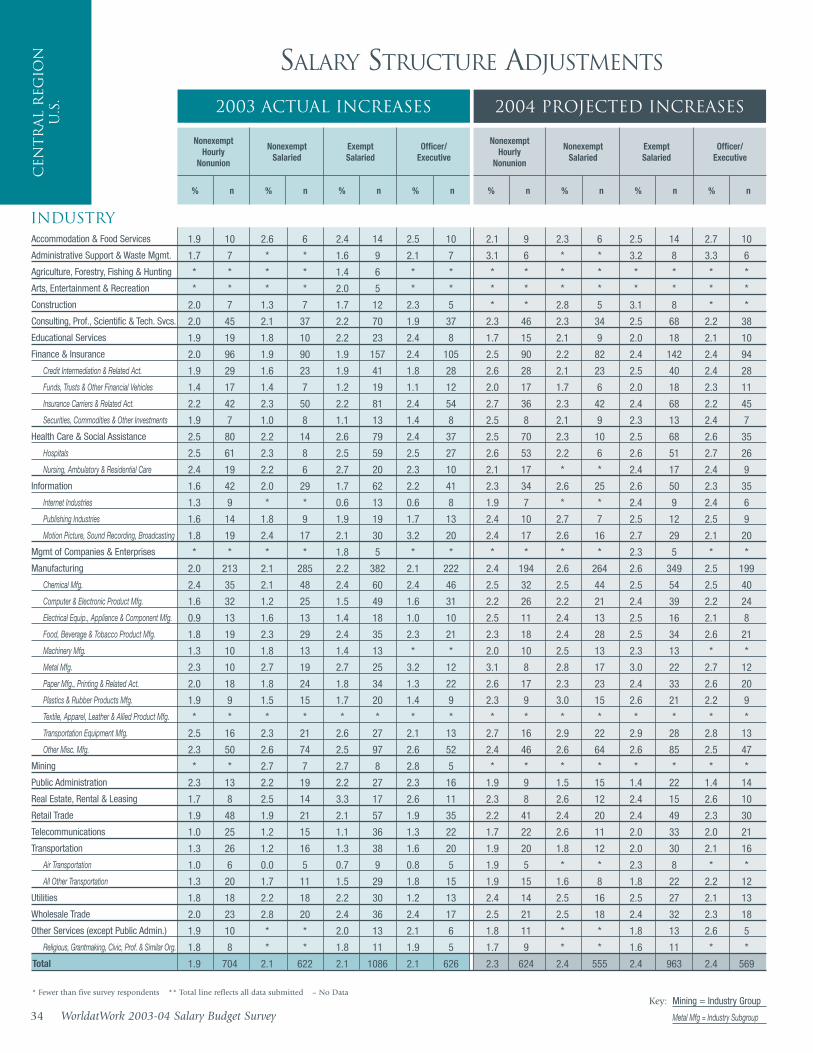
Cen
tr
al
Reg
ion
U.S
. 2003 Actual Increases
SALARY STRUCTURE ADJUSTMENTS
NonexemptHourly
Nonunion
NonexemptSalaried
ExemptSalaried
Officer/Executive
% n % n % n % n
2004 Projected Increases
NonexemptHourly
Nonunion
NonexemptSalaried
ExemptSalaried
Officer/Executive
% n % n % n % n
Accommodation & Food Services
Administrative Support & Waste Mgmt.
Agriculture, Forestry, Fishing & Hunting
Arts, Entertainment & Recreation
Construction
Consulting, Prof., Scientific & Tech. Svcs.
Educational Services
Finance & Insurance
Credit Intermediation & Related Act.
Funds, Trusts & Other Financial Vehicles
Insurance Carriers & Related Act.
Securities, Commodities & Other Investments
Health Care & Social Assistance
Hospitals
Nursing, Ambulatory & Residential Care
Information
Internet Industries
Publishing Industries
Motion Picture, Sound Recording, Broadcasting
Mgmt of Companies & Enterprises
Manufacturing
Chemical Mfg.
Computer & Electronic Product Mfg.
Electrical Equip., Appliance & Component Mfg.
Food, Beverage & Tobacco Product Mfg.
Machinery Mfg.
Metal Mfg.
Paper Mfg., Printing & Related Act.
Plastics & Rubber Products Mfg.
Textile, Apparel, Leather & Allied Product Mfg.
Transportation Equipment Mfg.
Other Misc. Mfg.
Mining
Public Administration
Real Estate, Rental & Leasing
Retail Trade
Telecommunications
Transportation
Air Transportation
All Other Transportation
Utilities
Wholesale Trade
Other Services (except Public Admin.)
Religious, Grantmaking, Civic, Prof. & Similar Org.
Total
1.9 10 2.6 6 2.4 14 2.5 10 2.1 9 2.3 6 2.5 14 2.7 10
1.7 7 * * 1.6 9 2.1 7 3.1 6 * * 3.2 8 3.3 6
* * * * 1.4 6 * * * * * * * * * *
* * * * 2.0 5 * * * * * * * * * *
2.0 7 1.3 7 1.7 12 2.3 5 * * 2.8 5 3.1 8 * *
2.0 45 2.1 37 2.2 70 1.9 37 2.3 46 2.3 34 2.5 68 2.2 38
1.9 19 1.8 10 2.2 23 2.4 8 1.7 15 2.1 9 2.0 18 2.1 10
2.0 96 1.9 90 1.9 157 2.4 105 2.5 90 2.2 82 2.4 142 2.4 94
1.9 29 1.6 23 1.9 41 1.8 28 2.6 28 2.1 23 2.5 40 2.4 28
1.4 17 1.4 7 1.2 19 1.1 12 2.0 17 1.7 6 2.0 18 2.3 11
2.2 42 2.3 50 2.2 81 2.4 54 2.7 36 2.3 42 2.4 68 2.2 45
1.9 7 1.0 8 1.1 13 1.4 8 2.5 8 2.1 9 2.3 13 2.4 7
2.5 80 2.2 14 2.6 79 2.4 37 2.5 70 2.3 10 2.5 68 2.6 35
2.5 61 2.3 8 2.5 59 2.5 27 2.6 53 2.2 6 2.6 51 2.7 26
2.4 19 2.2 6 2.7 20 2.3 10 2.1 17 * * 2.4 17 2.4 9
1.6 42 2.0 29 1.7 62 2.2 41 2.3 34 2.6 25 2.6 50 2.3 35
1.3 9 * * 0.6 13 0.6 8 1.9 7 * * 2.4 9 2.4 6
1.6 14 1.8 9 1.9 19 1.7 13 2.4 10 2.7 7 2.5 12 2.5 9
1.8 19 2.4 17 2.1 30 3.2 20 2.4 17 2.6 16 2.7 29 2.1 20
* * * * 1.8 5 * * * * * * 2.3 5 * *
2.0 213 2.1 285 2.2 382 2.1 222 2.4 194 2.6 264 2.6 349 2.5 199
2.4 35 2.1 48 2.4 60 2.4 46 2.5 32 2.5 44 2.5 54 2.5 40
1.6 32 1.2 25 1.5 49 1.6 31 2.2 26 2.2 21 2.4 39 2.2 24
0.9 13 1.6 13 1.4 18 1.0 10 2.5 11 2.4 13 2.5 16 2.1 8
1.8 19 2.3 29 2.4 35 2.3 21 2.3 18 2.4 28 2.5 34 2.6 21
1.3 10 1.8 13 1.4 13 * * 2.0 10 2.5 13 2.3 13 * *
2.3 10 2.7 19 2.7 25 3.2 12 3.1 8 2.8 17 3.0 22 2.7 12
2.0 18 1.8 24 1.8 34 1.3 22 2.6 17 2.3 23 2.4 33 2.6 20
1.9 9 1.5 15 1.7 20 1.4 9 2.3 9 3.0 15 2.6 21 2.2 9
* * * * * * * * * * * * * * * *
2.5 16 2.3 21 2.6 27 2.1 13 2.7 16 2.9 22 2.9 28 2.8 13
2.3 50 2.6 74 2.5 97 2.6 52 2.4 46 2.6 64 2.6 85 2.5 47
* * 2.7 7 2.7 8 2.8 5 * * * * * * * *
2.3 13 2.2 19 2.2 27 2.3 16 1.9 9 1.5 15 1.4 22 1.4 14
1.7 8 2.5 14 3.3 17 2.6 11 2.3 8 2.6 12 2.4 15 2.6 10
1.9 48 1.9 21 2.1 57 1.9 35 2.2 41 2.4 20 2.4 49 2.3 30
1.0 25 1.2 15 1.1 36 1.3 22 1.7 22 2.6 11 2.0 33 2.0 21
1.3 26 1.2 16 1.3 38 1.6 20 1.9 20 1.8 12 2.0 30 2.1 16
1.0 6 0.0 5 0.7 9 0.8 5 1.9 5 * * 2.3 8 * *
1.3 20 1.7 11 1.5 29 1.8 15 1.9 15 1.6 8 1.8 22 2.2 12
1.8 18 2.2 18 2.2 30 1.2 13 2.4 14 2.5 16 2.5 27 2.1 13
2.0 23 2.8 20 2.4 36 2.4 17 2.5 21 2.5 18 2.4 32 2.3 18
1.9 10 * * 2.0 13 2.1 6 1.8 11 * * 1.8 13 2.6 5
1.8 8 * * 1.8 11 1.9 5 1.7 9 * * 1.6 11 * *
1.9 704 2.1 622 2.1 1086 2.1 626 2.3 624 2.4 555 2.4 963 2.4 569
34 WorldatWork 2003-04 Salary Budget SurveyMining = Industry Group
Metal Mfg = Industry Subgroup
* Fewer than five survey respondents ** Total line reflects all data submitted – No DataKey:
INDUSTRY
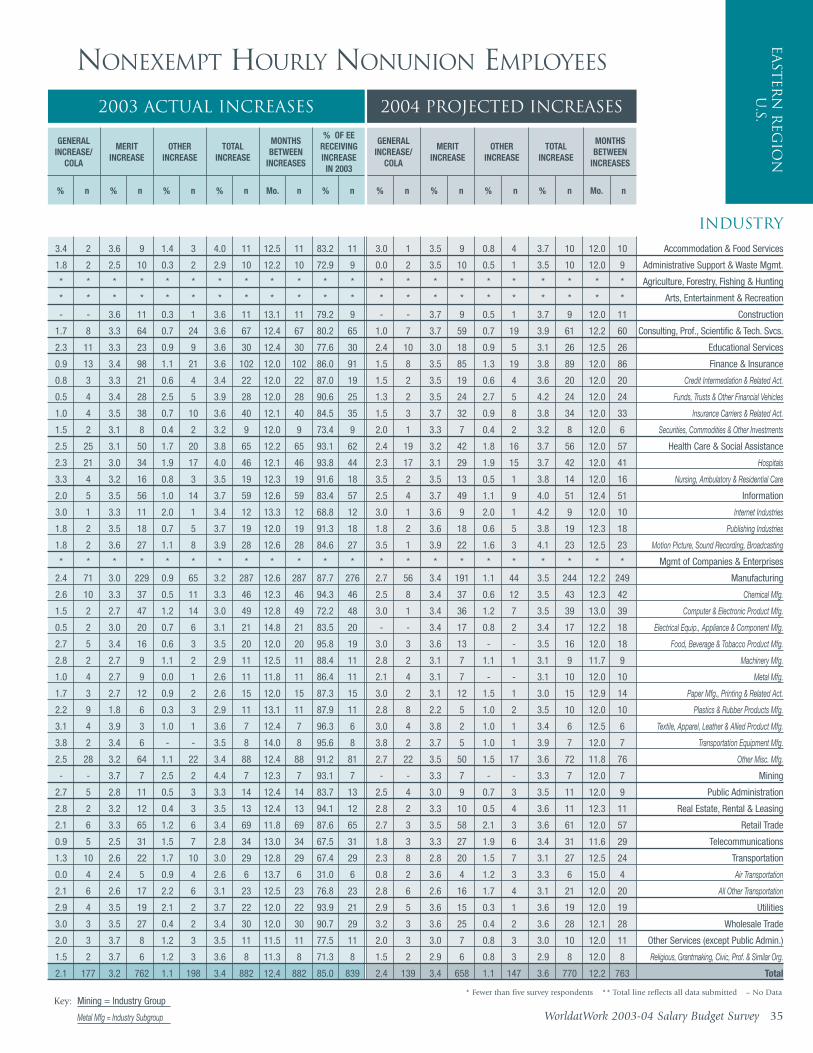
WorldatWork 2003-04 Salary Budget Survey 35
2003 Actual Increases 2004 Projected Increases
NONEXEMPT HOURLY NONUNION EMPLOYEES
GENERALINCREASE/
COLA
MERITINCREASE
OTHERINCREASE
TOTALINCREASE
MONTHSBETWEEN
INCREASES
% OF EERECEIVINGINCREASE IN 2003
% n % n % n % n Mo. n % n
GENERALINCREASE/
COLA
MERITINCREASE
OTHERINCREASE
TOTALINCREASE
MONTHSBETWEEN
INCREASES
% n % n % n % n Mo. n
INDUSTRY
East
ern
Reg
ion
U
.S.
* Fewer than five survey respondents ** Total line reflects all data submitted – No DataMining = Industry Group
Metal Mfg = Industry Subgroup
Key:
Accommodation & Food Services
Administrative Support & Waste Mgmt.
Agriculture, Forestry, Fishing & Hunting
Arts, Entertainment & Recreation
Construction
Consulting, Prof., Scientific & Tech. Svcs.
Educational Services
Finance & Insurance
Credit Intermediation & Related Act.
Funds, Trusts & Other Financial Vehicles
Insurance Carriers & Related Act.
Securities, Commodities & Other Investments
Health Care & Social Assistance
Hospitals
Nursing, Ambulatory & Residential Care
Information
Internet Industries
Publishing Industries
Motion Picture, Sound Recording, Broadcasting
Mgmt of Companies & Enterprises
Manufacturing
Chemical Mfg.
Computer & Electronic Product Mfg.
Electrical Equip., Appliance & Component Mfg.
Food, Beverage & Tobacco Product Mfg.
Machinery Mfg.
Metal Mfg.
Paper Mfg., Printing & Related Act.
Plastics & Rubber Products Mfg.
Textile, Apparel, Leather & Allied Product Mfg.
Transportation Equipment Mfg.
Other Misc. Mfg.
Mining
Public Administration
Real Estate, Rental & Leasing
Retail Trade
Telecommunications
Transportation
Air Transportation
All Other Transportation
Utilities
Wholesale Trade
Other Services (except Public Admin.)
Religious, Grantmaking, Civic, Prof. & Similar Org.
Total
3.4 2 3.6 9 1.4 3 4.0 11 12.5 11 83.2 11 3.0 1 3.5 9 0.8 4 3.7 10 12.0 10
1.8 2 2.5 10 0.3 2 2.9 10 12.2 10 72.9 9 0.0 2 3.5 10 0.5 1 3.5 10 12.0 9
* * * * * * * * * * * * * * * * * * * * * *
* * * * * * * * * * * * * * * * * * * * * *
- - 3.6 11 0.3 1 3.6 11 13.1 11 79.2 9 - - 3.7 9 0.5 1 3.7 9 12.0 11
1.7 8 3.3 64 0.7 24 3.6 67 12.4 67 80.2 65 1.0 7 3.7 59 0.7 19 3.9 61 12.2 60
2.3 11 3.3 23 0.9 9 3.6 30 12.4 30 77.6 30 2.4 10 3.0 18 0.9 5 3.1 26 12.5 26
0.9 13 3.4 98 1.1 21 3.6 102 12.0 102 86.0 91 1.5 8 3.5 85 1.3 19 3.8 89 12.0 86
0.8 3 3.3 21 0.6 4 3.4 22 12.0 22 87.0 19 1.5 2 3.5 19 0.6 4 3.6 20 12.0 20
0.5 4 3.4 28 2.5 5 3.9 28 12.0 28 90.6 25 1.3 2 3.5 24 2.7 5 4.2 24 12.0 24
1.0 4 3.5 38 0.7 10 3.6 40 12.1 40 84.5 35 1.5 3 3.7 32 0.9 8 3.8 34 12.0 33
1.5 2 3.1 8 0.4 2 3.2 9 12.0 9 73.4 9 2.0 1 3.3 7 0.4 2 3.2 8 12.0 6
2.5 25 3.1 50 1.7 20 3.8 65 12.2 65 93.1 62 2.4 19 3.2 42 1.8 16 3.7 56 12.0 57
2.3 21 3.0 34 1.9 17 4.0 46 12.1 46 93.8 44 2.3 17 3.1 29 1.9 15 3.7 42 12.0 41
3.3 4 3.2 16 0.8 3 3.5 19 12.3 19 91.6 18 3.5 2 3.5 13 0.5 1 3.8 14 12.0 16
2.0 5 3.5 56 1.0 14 3.7 59 12.6 59 83.4 57 2.5 4 3.7 49 1.1 9 4.0 51 12.4 51
3.0 1 3.3 11 2.0 1 3.4 12 13.3 12 68.8 12 3.0 1 3.6 9 2.0 1 4.2 9 12.0 10
1.8 2 3.5 18 0.7 5 3.7 19 12.0 19 91.3 18 1.8 2 3.6 18 0.6 5 3.8 19 12.3 18
1.8 2 3.6 27 1.1 8 3.9 28 12.6 28 84.6 27 3.5 1 3.9 22 1.6 3 4.1 23 12.5 23
* * * * * * * * * * * * * * * * * * * * * *
2.4 71 3.0 229 0.9 65 3.2 287 12.6 287 87.7 276 2.7 56 3.4 191 1.1 44 3.5 244 12.2 249
2.6 10 3.3 37 0.5 11 3.3 46 12.3 46 94.3 46 2.5 8 3.4 37 0.6 12 3.5 43 12.3 42
1.5 2 2.7 47 1.2 14 3.0 49 12.8 49 72.2 48 3.0 1 3.4 36 1.2 7 3.5 39 13.0 39
0.5 2 3.0 20 0.7 6 3.1 21 14.8 21 83.5 20 - - 3.4 17 0.8 2 3.4 17 12.2 18
2.7 5 3.4 16 0.6 3 3.5 20 12.0 20 95.8 19 3.0 3 3.6 13 - - 3.5 16 12.0 18
2.8 2 2.7 9 1.1 2 2.9 11 12.5 11 88.4 11 2.8 2 3.1 7 1.1 1 3.1 9 11.7 9
1.0 4 2.7 9 0.0 1 2.6 11 11.8 11 86.4 11 2.1 4 3.1 7 - - 3.1 10 12.0 10
1.7 3 2.7 12 0.9 2 2.6 15 12.0 15 87.3 15 3.0 2 3.1 12 1.5 1 3.0 15 12.9 14
2.2 9 1.8 6 0.3 3 2.9 11 13.1 11 87.9 11 2.8 8 2.2 5 1.0 2 3.5 10 12.0 10
3.1 4 3.9 3 1.0 1 3.6 7 12.4 7 96.3 6 3.0 4 3.8 2 1.0 1 3.4 6 12.5 6
3.8 2 3.4 6 - - 3.5 8 14.0 8 95.6 8 3.8 2 3.7 5 1.0 1 3.9 7 12.0 7
2.5 28 3.2 64 1.1 22 3.4 88 12.4 88 91.2 81 2.7 22 3.5 50 1.5 17 3.6 72 11.8 76
- - 3.7 7 2.5 2 4.4 7 12.3 7 93.1 7 - - 3.3 7 - - 3.3 7 12.0 7
2.7 5 2.8 11 0.5 3 3.3 14 12.4 14 83.7 13 2.5 4 3.0 9 0.7 3 3.5 11 12.0 9
2.8 2 3.2 12 0.4 3 3.5 13 12.4 13 94.1 12 2.8 2 3.3 10 0.5 4 3.6 11 12.3 11
2.1 6 3.3 65 1.2 6 3.4 69 11.8 69 87.6 65 2.7 3 3.5 58 2.1 3 3.6 61 12.0 57
0.9 5 2.5 31 1.5 7 2.8 34 13.0 34 67.5 31 1.8 3 3.3 27 1.9 6 3.4 31 11.6 29
1.3 10 2.6 22 1.7 10 3.0 29 12.8 29 67.4 29 2.3 8 2.8 20 1.5 7 3.1 27 12.5 24
0.0 4 2.4 5 0.9 4 2.6 6 13.7 6 31.0 6 0.8 2 3.6 4 1.2 3 3.3 6 15.0 4
2.1 6 2.6 17 2.2 6 3.1 23 12.5 23 76.8 23 2.8 6 2.6 16 1.7 4 3.1 21 12.0 20
2.9 4 3.5 19 2.1 2 3.7 22 12.0 22 93.9 21 2.9 5 3.6 15 0.3 1 3.6 19 12.0 19
3.0 3 3.5 27 0.4 2 3.4 30 12.0 30 90.7 29 3.2 3 3.6 25 0.4 2 3.6 28 12.1 28
2.0 3 3.7 8 1.2 3 3.5 11 11.5 11 77.5 11 2.0 3 3.0 7 0.8 3 3.0 10 12.0 11
1.5 2 3.7 6 1.2 3 3.6 8 11.3 8 71.3 8 1.5 2 2.9 6 0.8 3 2.9 8 12.0 8
2.1 177 3.2 762 1.1 198 3.4 882 12.4 882 85.0 839 2.4 139 3.4 658 1.1 147 3.6 770 12.2 763

East
ern
Reg
ion
U
.S.
2003 Actual Increases 2004 Projected Increases
NONEXEMPT SALARIED EMPLOYEES
INDUSTRY
36 WorldatWork 2003-04 Salary Budget SurveyMining = Industry Group
Metal Mfg = Industry Subgroup
GENERALINCREASE/
COLA
MERITINCREASE
OTHERINCREASE
TOTALINCREASE
MONTHSBETWEEN
INCREASES
% OF EERECEIVINGINCREASE IN 2003
% n % n % n % n Mo. n % n
GENERALINCREASE/
COLA
MERITINCREASE
OTHERINCREASE
TOTALINCREASE
MONTHSBETWEEN
INCREASES
% n % n % n % n Mo. n
Accommodation & Food Services
Administrative Support & Waste Mgmt.
Agriculture, Forestry, Fishing & Hunting
Arts, Entertainment & Recreation
Construction
Consulting, Prof., Scientific & Tech. Svcs.
Educational Services
Finance & Insurance
Credit Intermediation & Related Act.
Funds, Trusts & Other Financial Vehicles
Insurance Carriers & Related Act.
Securities, Commodities & Other Investments
Health Care & Social Assistance
Hospitals
Nursing, Ambulatory & Residential Care
Information
Internet Industries
Publishing Industries
Motion Picture, Sound Recording, Broadcasting
Mgmt of Companies & Enterprises
Manufacturing
Chemical Mfg.
Computer & Electronic Product Mfg.
Electrical Equip., Appliance & Component Mfg.
Food, Beverage & Tobacco Product Mfg.
Machinery Mfg.
Metal Mfg.
Paper Mfg., Printing & Related Act.
Plastics & Rubber Products Mfg.
Textile, Apparel, Leather & Allied Product Mfg.
Transportation Equipment Mfg.
Other Misc. Mfg.
Mining
Public Administration
Real Estate, Rental & Leasing
Retail Trade
Telecommunications
Transportation
Air Transportation
All Other Transportation
Utilities
Wholesale Trade
Other Services (except Public Admin.)
Religious, Grantmaking, Civic, Prof. & Similar Org.
Total
* Fewer than five survey respondents ** Total line reflects all data submitted – No DataKey:
- - 3.4 7 - - 3.4 7 12.9 7 81.9 7 - - 3.3 6 0.5 1 3.4 6 12.3 6
- - 3.0 8 0.5 3 2.8 9 13.3 9 70.6 8 - - 3.7 8 0.7 3 3.5 9 13.7 7
* * * * * * * * * * * * * * * * * * * * * *
* * * * * * * * * * * * * * * * * * * * * *
0.0 1 3.4 9 1.0 3 3.7 9 14.0 9 77.8 8 0.0 1 3.5 7 0.5 1 3.6 7 12.0 8
1.7 13 3.3 67 0.9 24 3.8 70 12.9 70 82.9 65 2.0 8 3.4 58 0.9 20 3.9 60 12.1 56
1.7 9 3.1 24 0.8 6 3.4 28 12.2 28 84.3 28 1.6 6 3.1 24 0.8 6 3.4 26 12.5 26
1.8 9 3.3 110 0.9 20 3.4 115 12.2 115 80.7 109 1.4 9 3.6 93 0.9 19 3.7 97 12.2 92
0.0 2 3.5 22 1.7 7 4.0 22 12.0 22 87.2 20 0.0 2 3.7 19 1.5 7 4.2 19 12.0 19
3.0 1 2.5 16 1.0 3 2.7 17 12.2 17 66.6 16 3.0 1 3.4 11 1.0 1 3.4 12 12.3 11
2.0 5 3.6 52 0.4 6 3.6 55 12.2 55 87.9 54 1.9 5 3.7 47 0.4 6 3.7 50 12.1 49
3.0 1 2.2 13 0.2 3 2.3 14 12.9 14 47.1 12 0.0 1 2.9 10 0.7 4 3.2 10 13.7 7
2.1 6 3.8 15 1.7 3 3.9 19 12.3 19 87.6 19 2.0 6 3.9 13 1.7 3 3.8 18 12.3 16
2.5 4 3.6 9 2.5 2 3.9 12 12.4 12 90.5 12 2.1 4 3.6 7 2.5 2 3.5 11 12.6 9
1.5 2 4.1 6 0.0 1 3.9 7 12.0 7 82.6 7 1.7 2 4.3 6 0.0 1 4.1 7 12.0 7
0.0 4 2.9 45 0.5 6 3.0 45 12.3 45 79.9 42 - - 3.6 34 0.5 1 3.6 34 12.8 33
0.0 1 2.3 6 0.5 1 2.4 6 12.2 6 60.8 6 - - 3.7 5 - - 3.7 5 14.6 5
0.0 1 3.0 14 0.8 2 3.1 14 12.9 14 90.1 12 - - 3.6 12 0.5 1 3.7 12 13.1 11
0.0 2 3.0 25 0.2 3 3.0 25 12.0 25 79.5 24 - - 3.5 17 - - 3.5 17 12.1 17
* * * * * * * * * * * * * * * * * * * * * *
1.0 22 3.2 276 0.6 63 3.3 284 12.7 284 87.3 276 2.0 15 3.4 246 0.8 47 3.6 255 12.4 254
1.0 2 3.4 51 0.6 14 3.5 52 12.4 52 90.3 52 1.5 2 3.6 48 0.7 12 3.7 49 12.2 47
0.0 4 2.8 33 0.5 12 3.0 33 13.7 33 66.5 31 - - 3.4 26 0.8 6 3.6 26 13.2 25
- - 3.4 18 0.7 7 3.7 18 13.2 18 88.0 17 3.0 1 3.4 16 0.6 5 3.5 17 12.4 17
0.0 1 3.6 27 2.0 4 3.7 28 12.0 28 96.8 28 - - 3.4 23 1.2 3 3.6 23 12.0 24
- - 3.0 10 0.5 1 3.1 10 13.2 10 92.4 10 - - 3.2 10 0.5 1 3.2 10 11.7 9
1.0 3 2.8 15 0.3 2 3.1 15 12.6 15 85.0 15 1.5 2 3.2 14 4.3 2 4.0 14 12.1 14
0.0 1 2.2 17 0.1 1 2.0 18 12.0 18 73.2 18 - - 3.1 16 1.1 2 3.0 17 12.7 18
0.8 3 2.5 10 0.0 2 2.5 11 13.0 11 78.7 10 1.7 3 3.4 8 0.0 1 3.2 10 13.2 10
- - 3.4 7 1.0 1 3.5 7 12.4 7 85.7 6 - - 3.2 6 1.0 1 3.3 6 12.5 6
1.8 2 3.5 10 0.0 1 3.5 11 12.9 11 95.6 10 3.0 1 3.7 9 - - 3.6 10 12.3 10
2.0 6 3.4 78 0.6 18 3.5 81 12.7 81 93.3 79 2.3 6 3.4 70 0.6 14 3.6 73 12.2 74
- - 3.7 8 1.8 3 4.3 8 12.4 8 92.2 8 - - 3.2 7 - - 3.2 7 12.0 7
1.8 7 3.0 18 0.4 4 3.2 21 12.6 21 76.0 20 1.5 8 2.7 16 0.5 3 3.2 18 11.8 14
3.0 1 3.4 13 0.5 3 3.5 14 12.4 14 93.0 14 3.0 1 3.5 12 0.8 2 3.6 13 12.3 13
1.0 2 3.0 21 0.8 5 3.2 22 12.7 22 84.5 21 1.0 2 3.1 21 1.0 5 3.3 22 12.8 22
1.5 2 3.1 24 0.3 6 3.2 25 14.1 25 67.8 21 - - 3.5 19 0.6 3 3.6 19 12.0 18
1.1 4 2.3 22 0.4 4 2.6 22 16.0 22 59.7 21 2.7 5 2.7 17 0.5 2 3.2 19 12.7 17
0.0 1 1.5 5 0.0 1 1.5 5 15.2 5 22.5 4 * * * * * * * * * *
1.5 3 2.6 17 0.5 3 2.9 17 16.2 17 68.4 17 3.4 4 2.7 13 1.0 1 3.3 15 12.0 13
2.3 4 2.8 12 0.5 1 2.9 15 12.4 15 90.1 15 3.1 4 3.2 9 - - 3.2 13 12.0 15
1.8 2 3.2 23 0.8 5 3.4 24 12.1 24 82.0 24 3.5 1 3.6 21 0.8 1 3.7 22 12.1 21
1.0 3 3.3 9 1.9 2 3.3 11 12.0 11 76.2 11 1.0 3 3.4 9 1.9 2 3.4 11 12.0 11
0.0 2 3.3 9 1.9 2 3.4 10 12.0 10 74.8 10 0.0 2 3.4 9 1.9 2 3.4 10 12.0 10
1.5 90 3.2 718 0.7 161 3.3 756 12.7 756 83.1 725 1.9 70 3.4 626 0.9 119 3.6 663 12.4 643

WorldatWork 2003-04 Salary Budget Survey 37
2003 Actual Increases 2004 Projected Increases
EXEMPT SALARIED EMPLOYEES
GENERALINCREASE/
COLA
MERITINCREASE
OTHERINCREASE
TOTALINCREASE
MONTHSBETWEEN
INCREASES
% OF EERECEIVINGINCREASE IN 2003
% n % n % n % n Mo. n % n
GENERALINCREASE/
COLA
MERITINCREASE
OTHERINCREASE
TOTALINCREASE
MONTHSBETWEEN
INCREASES
% n % n % n % n Mo. n
INDUSTRY
East
ern
Reg
ion
U
.S.
* Fewer than five survey respondents ** Total line reflects all data submitted – No DataMining = Industry Group
Metal Mfg = Industry Subgroup
Key:
Accommodation & Food Services
Administrative Support & Waste Mgmt.
Agriculture, Forestry, Fishing & Hunting
Arts, Entertainment & Recreation
Construction
Consulting, Prof., Scientific & Tech. Svcs.
Educational Services
Finance & Insurance
Credit Intermediation & Related Act.
Funds, Trusts & Other Financial Vehicles
Insurance Carriers & Related Act.
Securities, Commodities & Other Investments
Health Care & Social Assistance
Hospitals
Nursing, Ambulatory & Residential Care
Information
Internet Industries
Publishing Industries
Motion Picture, Sound Recording, Broadcasting
Mgmt of Companies & Enterprises
Manufacturing
Chemical Mfg.
Computer & Electronic Product Mfg.
Electrical Equip., Appliance & Component Mfg.
Food, Beverage & Tobacco Product Mfg.
Machinery Mfg.
Metal Mfg.
Paper Mfg., Printing & Related Act.
Plastics & Rubber Products Mfg.
Textile, Apparel, Leather & Allied Product Mfg.
Transportation Equipment Mfg.
Other Misc. Mfg.
Mining
Public Administration
Real Estate, Rental & Leasing
Retail Trade
Telecommunications
Transportation
Air Transportation
All Other Transportation
Utilities
Wholesale Trade
Other Services (except Public Admin.)
Religious, Grantmaking, Civic, Prof. & Similar Org.
Total
3.0 1 3.5 13 0.7 5 3.8 14 12.4 14 89.8 14 - - 3.5 12 0.7 5 3.7 12 12.2 12
1.8 2 2.4 14 1.5 4 3.0 14 13.4 14 67.4 13 1.0 3 3.6 14 0.5 2 3.8 14 13.5 12
* * * * * * * * * * * * * * * * * * * * * *
* * * * * * * * * * * * * * * * * * * * * *
0.0 1 3.7 17 1.0 5 4.0 17 14.2 17 84.2 15 0.0 1 3.7 14 0.5 2 3.7 14 12.1 16
1.6 17 3.5 122 1.1 41 3.9 126 13.0 126 81.8 118 0.8 12 3.7 108 1.1 34 4.1 109 12.4 107
2.4 15 3.2 42 0.8 12 3.6 49 12.0 49 81.2 49 2.7 14 3.1 34 0.7 8 3.5 42 12.0 42
1.3 18 3.4 172 1.1 37 3.6 180 12.2 180 84.2 169 1.5 12 3.6 150 1.2 33 3.9 156 12.2 149
0.6 4 3.4 30 1.5 8 3.8 31 12.0 31 88.7 30 1.0 3 3.6 28 1.4 8 4.0 29 12.0 29
1.5 6 3.1 38 1.8 10 3.6 40 12.2 40 79.0 37 1.8 3 3.5 32 2.1 8 4.1 33 12.5 32
1.6 6 3.7 79 0.7 13 3.7 83 12.1 83 90.5 77 1.9 5 3.8 69 0.8 11 3.8 73 12.0 71
1.5 2 2.5 18 0.4 5 2.6 19 12.6 19 55.3 18 0.0 1 3.2 15 0.6 5 3.4 15 13.1 11
2.4 25 3.2 61 1.5 18 3.8 76 12.3 76 92.6 72 2.2 18 3.5 54 1.5 14 3.7 67 12.1 66
2.4 20 3.2 40 1.7 15 3.9 52 12.3 52 94.9 49 2.2 15 3.4 36 1.7 12 3.6 48 12.2 45
2.6 5 3.3 21 0.5 3 3.5 24 12.3 24 87.8 23 2.3 3 3.7 18 0.3 2 3.9 19 12.0 21
1.4 10 3.2 97 1.0 20 3.5 100 12.7 100 79.0 96 2.8 6 3.6 80 1.2 13 3.9 83 12.8 82
1.0 3 2.8 18 1.3 2 2.9 19 14.1 19 62.0 19 3.0 2 3.6 14 1.5 2 4.0 15 13.6 16
1.2 3 3.3 28 0.8 6 3.4 29 12.4 29 89.4 26 1.8 2 3.6 26 0.6 5 3.7 27 12.7 25
1.8 4 3.4 51 1.1 12 3.7 52 12.4 52 80.0 51 3.5 2 3.7 40 1.5 6 4.0 41 12.5 41
0.0 1 3.5 9 0.0 1 3.5 9 12.7 9 62.6 9 - - 3.7 7 - - 3.7 7 16.4 7
1.1 34 3.2 401 0.7 107 3.3 412 12.8 412 84.3 399 2.1 17 3.5 346 0.9 68 3.6 359 12.5 358
1.7 3 3.5 65 0.7 25 3.8 66 12.3 66 91.0 66 1.5 2 3.6 62 0.6 18 3.8 63 12.2 58
0.0 6 2.8 71 0.8 26 3.0 72 13.4 72 67.1 69 - - 3.5 56 1.0 14 3.7 58 13.1 56
0.0 1 3.0 29 0.7 10 3.2 29 14.2 29 77.7 28 3.0 1 3.4 25 0.6 5 3.5 26 12.7 27
- - 3.6 35 1.4 6 3.7 36 12.0 36 96.9 36 - - 3.6 31 1.2 3 3.7 31 12.1 32
- - 2.8 14 0.8 2 2.9 14 13.3 14 86.8 14 - - 3.1 12 0.5 1 3.1 12 11.8 12
1.2 5 2.7 17 0.3 2 2.9 18 12.7 18 84.2 18 2.0 3 3.1 16 4.3 2 3.7 17 12.1 17
0.0 2 2.2 24 0.4 2 2.1 25 12.1 25 69.8 25 - - 3.3 23 1.6 2 3.3 24 13.5 24
1.9 5 2.6 12 0.3 3 2.8 15 12.7 15 81.5 14 2.0 4 3.5 10 0.5 2 3.4 13 12.9 13
- - 3.4 8 1.0 1 3.6 8 12.4 8 94.4 7 - - 3.3 7 1.0 1 3.4 7 12.4 7
0.0 1 3.6 13 0.0 1 3.6 13 13.5 13 94.1 12 - - 3.7 12 1.0 1 3.8 12 12.5 12
1.5 11 3.4 113 0.5 29 3.6 116 12.8 116 90.2 110 2.2 7 3.6 92 0.9 19 3.7 96 12.4 100
- - 3.8 10 1.7 3 4.3 10 12.4 10 88.3 10 - - 3.5 9 - - 3.5 9 12.0 9
2.2 9 3.3 22 0.7 7 3.7 26 12.6 26 79.8 24 1.8 10 3.0 19 0.7 5 3.5 22 11.8 17
2.9 3 3.4 21 0.5 5 3.7 22 13.4 22 90.0 21 2.8 3 3.4 18 0.5 4 3.8 19 12.4 19
1.9 7 3.2 68 1.9 9 3.5 72 12.6 72 86.4 69 2.0 5 3.6 61 1.4 6 3.6 65 12.6 61
1.4 8 2.8 52 0.7 12 3.0 56 13.6 56 67.2 51 2.3 2 3.5 44 1.0 7 3.6 46 11.7 44
0.4 8 2.5 41 0.7 11 2.7 41 14.7 41 61.5 40 1.9 7 2.7 34 0.5 8 3.0 37 12.5 33
0.0 4 1.5 10 0.3 4 1.6 10 15.7 10 37.6 10 0.8 2 2.5 9 0.3 3 2.5 10 14.3 8
0.8 4 2.8 31 0.9 7 3.1 31 14.3 31 69.5 30 2.4 5 2.8 25 0.6 5 3.1 27 12.0 25
2.2 5 3.2 26 0.4 2 3.3 29 12.0 29 86.9 28 3.1 6 3.3 20 0.3 1 3.4 25 11.8 27
2.5 3 3.3 42 0.6 7 3.4 44 12.8 44 79.3 43 3.5 2 3.6 39 0.5 3 3.7 41 12.5 40
1.8 5 3.4 17 1.4 5 3.5 21 11.7 21 76.4 20 1.5 4 3.1 17 1.2 5 3.2 20 12.0 20
1.0 3 3.3 15 1.4 5 3.5 17 11.6 17 71.5 16 1.0 3 3.2 15 1.2 5 3.4 17 12.0 17
1.7 173 3.2 1253 0.9 311 3.5 1325 12.7 1325 82.3 1267 2.0 123 3.5 1084 1.0 218 3.7 1152 12.4 1126

East
ern
Reg
ion
U
.S.
2003 Actual Increases 2004 Projected Increases
OFFICER/EXECUTIVE LEVEL
INDUSTRY
38 WorldatWork 2003-04 Salary Budget SurveyMining = Industry Group
Metal Mfg = Industry Subgroup
GENERALINCREASE/
COLA
MERITINCREASE
OTHERINCREASE
TOTALINCREASE
MONTHSBETWEEN
INCREASES
% OF EERECEIVINGINCREASE IN 2003
% n % n % n % n Mo. n % n
GENERALINCREASE/
COLA
MERITINCREASE
OTHERINCREASE
TOTALINCREASE
MONTHSBETWEEN
INCREASES
% n % n % n % n Mo. n
Accommodation & Food Services
Administrative Support & Waste Mgmt.
Agriculture, Forestry, Fishing & Hunting
Arts, Entertainment & Recreation
Construction
Consulting, Prof., Scientific & Tech. Svcs.
Educational Services
Finance & Insurance
Credit Intermediation & Related Act.
Funds, Trusts & Other Financial Vehicles
Insurance Carriers & Related Act.
Securities, Commodities & Other Investments
Health Care & Social Assistance
Hospitals
Nursing, Ambulatory & Residential Care
Information
Internet Industries
Publishing Industries
Motion Picture, Sound Recording, Broadcasting
Mgmt of Companies & Enterprises
Manufacturing
Chemical Mfg.
Computer & Electronic Product Mfg.
Electrical Equip., Appliance & Component Mfg.
Food, Beverage & Tobacco Product Mfg.
Machinery Mfg.
Metal Mfg.
Paper Mfg., Printing & Related Act.
Plastics & Rubber Products Mfg.
Textile, Apparel, Leather & Allied Product Mfg.
Transportation Equipment Mfg.
Other Misc. Mfg.
Mining
Public Administration
Real Estate, Rental & Leasing
Retail Trade
Telecommunications
Transportation
Air Transportation
All Other Transportation
Utilities
Wholesale Trade
Other Services (except Public Admin.)
Religious, Grantmaking, Civic, Prof. & Similar Org.
Total
* Fewer than five survey respondents ** Total line reflects all data submitted – No DataKey:
- - 3.9 10 0.5 1 4.0 10 12.6 10 88.4 10 - - 3.6 9 1.0 3 3.9 9 12.7 9
1.8 2 2.7 8 2.0 3 3.4 9 12.2 9 80.3 8 0.0 2 3.7 8 2.7 2 3.8 9 12.0 8
* * * * * * * * * * * * * * * * * * * * * *
* * * * * * * * * * * * * * * * * * * * * *
0.0 1 3.3 13 1.1 4 3.6 13 14.4 13 82.6 12 0.0 1 4.1 10 0.5 1 4.2 10 12.1 12
0.8 10 3.4 67 0.6 21 3.6 69 13.6 69 78.9 64 0.7 7 3.8 61 0.5 19 3.9 62 12.3 60
1.8 6 3.1 23 0.7 6 3.6 24 12.0 24 85.6 24 1.8 7 3.2 19 0.8 5 3.5 22 12.0 22
1.4 14 3.3 135 1.7 28 3.5 145 12.9 145 75.7 134 1.6 10 3.6 116 1.4 25 3.8 122 12.6 116
0.0 3 3.6 26 1.5 8 4.0 26 13.4 26 82.5 25 0.0 2 3.6 24 1.5 7 4.1 24 13.0 24
1.5 4 2.9 23 1.3 5 2.9 27 13.1 27 73.2 24 1.5 2 3.3 21 0.9 3 3.4 22 12.3 21
2.2 6 3.3 64 0.9 9 3.4 69 12.5 69 78.6 64 2.6 5 3.8 53 1.7 9 3.9 58 12.5 57
0.0 1 2.9 15 3.9 4 3.7 16 13.5 16 43.5 14 0.0 1 2.9 12 0.7 4 3.1 12 13.5 8
2.1 13 3.7 41 2.8 11 4.2 50 12.5 50 88.6 47 2.1 10 3.8 35 1.7 4 3.8 42 12.2 43
1.9 11 3.9 27 3.0 10 4.5 35 12.6 35 91.5 33 2.0 9 3.8 24 1.7 4 3.7 31 12.3 29
3.0 2 3.1 14 1.0 1 3.4 15 12.4 15 81.6 14 3.0 1 3.8 11 - - 4.1 11 12.0 14
0.8 8 3.1 68 0.6 13 3.2 70 13.0 70 71.3 66 2.3 4 3.6 52 0.5 6 3.7 54 12.6 56
1.0 3 2.8 12 0.5 1 2.8 13 14.2 13 58.9 13 3.0 2 3.4 9 - - 3.7 10 13.2 11
0.0 2 3.3 23 0.7 6 3.5 23 12.8 23 87.6 20 0.0 1 3.6 20 0.4 4 3.6 20 12.6 20
1.0 3 3.1 33 0.5 6 3.2 34 12.6 34 66.2 33 3.0 1 3.7 23 0.8 2 3.8 24 12.2 25
0.0 1 4.0 7 0.0 1 4.0 7 13.3 7 57.1 7 - - 3.2 5 - - 3.2 5 18.0 6
0.9 19 3.1 275 1.1 58 3.4 280 13.0 280 79.1 267 1.8 9 3.7 233 0.9 43 3.8 241 12.7 244
2.0 3 3.6 49 0.6 13 3.8 50 12.3 50 87.2 50 1.5 2 3.7 46 0.6 14 3.8 47 12.4 45
0.0 5 2.2 50 0.9 16 2.5 50 13.1 50 59.9 46 - - 3.5 37 0.7 8 3.6 38 12.9 38
0.0 1 2.7 17 0.7 5 2.9 17 14.9 17 63.2 16 - - 3.5 16 0.7 3 3.6 16 12.0 17
- - 3.7 27 1.6 3 3.7 28 12.0 28 98.1 27 - - 3.6 23 1.5 2 3.7 23 12.1 24
- - 3.5 8 0.5 1 3.6 8 14.3 8 62.8 8 - - 3.6 7 0.5 1 3.7 7 13.3 7
0.0 2 2.0 7 0.0 1 2.0 7 15.0 7 52.9 7 3.0 1 3.0 6 - - 3.0 7 13.7 7
- - 2.2 19 - - 2.2 19 14.3 19 65.9 19 - - 4.4 17 3.0 1 4.3 18 14.0 18
- - 3.3 7 1.0 1 3.4 7 11.9 7 84.7 7 3.0 1 3.6 6 1.0 1 3.6 7 13.7 7
- - 4.0 6 - - 4.0 6 13.2 6 61.0 5 - - 5.5 5 - - 5.5 5 14.5 6
0.0 1 3.9 10 0.0 1 3.9 10 14.7 10 91.0 9 - - 4.0 9 - - 4.0 9 12.3 9
1.5 7 3.4 75 2.0 17 3.9 78 12.5 78 89.2 73 1.5 5 3.6 61 1.1 13 3.7 64 12.5 66
- - 4.0 10 1.7 3 4.5 10 13.2 10 84.5 10 - - 3.5 9 - - 3.5 9 12.0 9
1.4 6 3.2 15 0.3 2 3.3 17 13.2 17 79.9 16 1.3 6 3.3 12 0.7 3 3.5 14 12.0 9
0.0 1 3.6 15 0.7 4 3.3 17 13.8 17 81.3 16 0.0 1 3.7 14 0.7 3 3.6 15 12.8 15
1.7 5 3.3 53 0.5 5 3.3 56 12.9 56 86.9 54 1.7 3 3.4 49 0.6 5 3.4 50 13.1 48
1.2 5 2.9 39 1.2 10 3.1 42 14.5 42 70.3 37 - - 3.6 37 0.7 6 3.7 37 12.0 36
0.0 5 2.4 31 0.3 5 2.4 31 14.9 31 55.6 30 1.8 4 2.8 25 0.0 2 2.9 27 12.8 25
0.0 3 2.4 8 0.0 3 2.4 8 13.3 8 47.8 8 0.0 1 2.9 7 0.0 2 2.9 7 14.0 6
0.0 2 2.3 23 0.8 2 2.4 23 15.5 23 58.4 22 2.3 3 2.8 18 - - 2.9 20 12.5 19
2.7 4 2.5 17 0.5 1 2.8 19 12.5 19 66.2 18 3.4 4 3.2 11 - - 3.5 14 12.7 17
2.3 2 3.2 25 0.4 4 3.3 26 12.1 26 88.3 24 4.5 1 3.5 24 0.6 2 3.6 25 12.2 25
3.0 1 3.1 9 0.8 2 3.3 10 12.6 10 66.0 10 3.0 1 3.0 9 0.3 3 3.1 10 12.0 9
- - 3.5 7 0.8 2 3.7 7 11.1 7 66.4 7 - - 3.4 7 0.3 3 3.5 7 12.0 7
1.3 103 3.2 866 1.1 182 3.4 910 13.1 910 78.0 859 1.7 70 3.6 741 0.9 132 3.7 780 12.6 772

INDUSTRY
East
ern
Reg
ion
U
.S.2003 Actual Increases
SALARY STRUCTURE ADJUSTMENTS
NonexemptHourly
Nonunion
NonexemptSalaried
ExemptSalaried
Officer/Executive
% n % n % n % n
2004 Projected Increases
NonexemptHourly
Nonunion
NonexemptSalaried
ExemptSalaried
Officer/Executive
% n % n % n % n
Accommodation & Food Services
Administrative Support & Waste Mgmt.
Agriculture, Forestry, Fishing & Hunting
Arts, Entertainment & Recreation
Construction
Consulting, Prof., Scientific & Tech. Svcs.
Educational Services
Finance & Insurance
Credit Intermediation & Related Act.
Funds, Trusts & Other Financial Vehicles
Insurance Carriers & Related Act.
Securities, Commodities & Other Investments
Health Care & Social Assistance
Hospitals
Nursing, Ambulatory & Residential Care
Information
Internet Industries
Publishing Industries
Motion Picture, Sound Recording, Broadcasting
Mgmt of Companies & Enterprises
Manufacturing
Chemical Mfg.
Computer & Electronic Product Mfg.
Electrical Equip., Appliance & Component Mfg.
Food, Beverage & Tobacco Product Mfg.
Machinery Mfg.
Metal Mfg.
Paper Mfg., Printing & Related Act.
Plastics & Rubber Products Mfg.
Textile, Apparel, Leather & Allied Product Mfg.
Transportation Equipment Mfg.
Other Misc. Mfg.
Mining
Public Administration
Real Estate, Rental & Leasing
Retail Trade
Telecommunications
Transportation
Air Transportation
All Other Transportation
Utilities
Wholesale Trade
Other Services (except Public Admin.)
Religious, Grantmaking, Civic, Prof. & Similar Org.
Total
3.8 7 2.0 6 3.4 10 4.5 6 1.4 6 2.3 6 1.9 10 1.8 6
1.5 9 1.6 7 1.6 12 1.5 9 2.6 8 2.0 6 2.8 12 2.4 8
* * * * * * * * * * * * * * * *
* * * * * * * * * * * * * * * *
2.2 9 1.3 8 1.9 13 2.1 7 2.0 6 2.3 6 2.4 9 2.7 6
2.0 52 2.0 47 2.1 86 1.8 42 2.2 51 2.3 44 2.4 83 2.2 42
2.1 23 1.8 23 3.5 39 2.3 13 1.7 19 2.2 22 2.9 36 2.7 14
2.4 73 2.6 85 2.4 132 2.9 91 2.3 63 2.2 68 2.3 113 2.1 78
2.0 17 1.9 19 1.9 25 2.0 20 2.4 15 2.2 14 2.3 21 2.1 16
2.4 19 1.8 13 2.1 29 2.2 18 2.5 15 2.2 6 2.2 22 1.8 14
2.1 30 2.9 42 2.6 63 2.2 44 2.2 26 2.3 38 2.3 56 2.3 39
* * * * 3.4 8 * * 1.8 5 1.0 5 1.9 9 * *
1.9 54 2.2 16 2.1 64 2.3 31 2.1 49 2.8 13 2.3 55 2.4 27
2.0 40 2.8 9 2.3 45 2.4 21 2.2 37 2.7 9 2.4 41 2.4 19
1.8 14 1.5 7 1.6 19 2.2 10 2.0 12 * * 2.1 14 2.3 8
1.6 43 1.6 33 1.5 73 2.2 45 2.2 34 2.4 26 2.3 57 2.0 35
0.9 10 1.0 5 0.7 15 2.2 9 1.1 7 * * 1.8 9 1.9 6
1.8 16 1.0 10 1.5 22 1.4 15 2.1 15 2.0 8 2.1 19 2.1 12
1.8 17 2.1 18 1.8 36 2.8 21 2.9 12 2.6 15 2.6 29 1.9 17
* * * * 2.2 7 0.4 5 * * * * 1.8 5 * *
1.7 201 2.2 233 2.1 325 1.9 196 2.2 173 2.5 209 2.5 283 2.4 169
2.0 34 2.0 44 2.3 55 2.3 40 2.3 31 2.4 40 2.4 49 2.6 34
1.2 38 1.6 26 1.7 55 1.4 37 2.1 28 2.3 22 2.3 42 2.2 27
1.3 15 2.1 15 1.8 21 1.1 10 2.5 12 2.8 14 2.7 18 2.2 8
2.4 14 2.8 22 2.7 29 2.9 15 2.0 12 2.5 18 2.4 25 2.8 13
1.4 11 2.1 10 1.7 13 1.2 5 2.2 9 2.7 10 2.6 11 * *
2.4 9 2.7 13 2.7 15 2.3 7 2.8 7 3.0 11 2.9 13 3.2 7
1.7 10 1.6 17 1.5 24 0.8 17 2.6 10 2.2 16 2.3 23 2.3 15
1.8 7 1.5 9 1.3 12 0.8 5 1.6 6 2.8 8 2.2 12 1.7 5
* * 2.2 5 2.2 5 * * * * * * * * * *
2.5 6 1.9 8 2.3 9 2.8 6 2.8 6 2.5 9 2.9 10 2.9 7
1.9 54 2.7 64 2.3 87 2.4 51 2.2 50 2.6 57 2.4 76 2.3 46
* * 2.3 7 2.2 7 2.3 6 * * 1.8 5 2.2 6 2.2 6
2.3 11 2.1 19 2.3 23 1.8 13 2.2 10 1.9 15 2.3 20 2.5 11
1.0 6 2.5 12 3.6 16 2.7 9 2.4 5 2.8 10 2.3 13 2.7 7
1.9 52 2.1 17 2.2 57 2.0 39 2.4 47 2.2 17 2.5 51 2.5 35
0.9 27 1.3 20 1.0 42 1.3 27 1.5 23 2.2 15 1.8 37 2.0 25
1.6 23 2.0 19 1.8 36 1.9 25 2.0 20 2.7 14 2.3 29 2.2 20
0.6 5 * * 1.0 8 1.8 5 1.3 5 * * 2.2 7 * *
1.9 18 2.1 15 2.0 28 1.9 20 2.2 15 2.6 11 2.4 22 2.3 16
2.5 17 2.7 11 2.2 22 2.4 11 2.4 17 2.7 9 2.5 21 2.2 10
1.8 20 2.7 18 2.3 33 1.8 15 2.2 18 2.5 16 2.2 29 1.9 16
3.7 6 2.4 8 2.8 15 4.0 6 2.2 6 2.0 8 2.2 15 2.5 6
* * 2.3 7 2.4 12 * * * * 1.9 7 2.2 12 * *
1.9 646 2.2 596 2.1 1018 2.1 601 2.2 565 2.4 514 2.4 887 2.3 528
WorldatWork 2003-04 Salary Budget Survey 39
* Fewer than five survey respondents ** Total line reflects all data submitted – No DataMining = Industry Group
Metal Mfg = Industry Subgroup
Key:

Sou
th
ern
Reg
ion
U
.S.
2003 Actual Increases 2004 Projected Increases
NONEXEMPT HOURLY NONUNION EMPLOYEES
INDUSTRY
40 WorldatWork 2003-04 Salary Budget SurveyMining = Industry Group
Metal Mfg = Industry Subgroup
GENERALINCREASE/
COLA
MERITINCREASE
OTHERINCREASE
TOTALINCREASE
MONTHSBETWEEN
INCREASES
% OF EERECEIVINGINCREASE IN 2003
% n % n % n % n Mo. n % n
GENERALINCREASE/
COLA
MERITINCREASE
OTHERINCREASE
TOTALINCREASE
MONTHSBETWEEN
INCREASES
% n % n % n % n Mo. n
Accommodation & Food Services
Administrative Support & Waste Mgmt.
Agriculture, Forestry, Fishing & Hunting
Arts, Entertainment & Recreation
Construction
Consulting, Prof., Scientific & Tech. Svcs.
Educational Services
Finance & Insurance
Credit Intermediation & Related Act.
Funds, Trusts & Other Financial Vehicles
Insurance Carriers & Related Act.
Securities, Commodities & Other Investments
Health Care & Social Assistance
Hospitals
Nursing, Ambulatory & Residential Care
Information
Internet Industries
Publishing Industries
Motion Picture, Sound Recording, Broadcasting
Mgmt of Companies & Enterprises
Manufacturing
Chemical Mfg.
Computer & Electronic Product Mfg.
Electrical Equip., Appliance & Component Mfg.
Food, Beverage & Tobacco Product Mfg.
Machinery Mfg.
Metal Mfg.
Paper Mfg., Printing & Related Act.
Plastics & Rubber Products Mfg.
Textile, Apparel, Leather & Allied Product Mfg.
Transportation Equipment Mfg.
Other Misc. Mfg.
Mining
Public Administration
Real Estate, Rental & Leasing
Retail Trade
Telecommunications
Transportation
Air Transportation
All Other Transportation
Utilities
Wholesale Trade
Other Services (except Public Admin.)
Religious, Grantmaking, Civic, Prof. & Similar Org.
Total
* Fewer than five survey respondents ** Total line reflects all data submitted – No DataKey:
3.2 1 3.5 8 0.6 2 3.6 9 12.7 9 80.7 9 3.0 1 3.4 8 0.4 3 3.5 9 11.3 9
2.5 5 2.8 13 0.0 1 3.3 15 12.2 15 83.3 15 2.0 5 3.5 13 - - 3.7 15 12.0 13
* * * * * * * * * * * * * * * * * * * * * *
- - 3.1 7 - - 3.1 7 12.0 7 94.9 7 - - 3.2 7 - - 3.2 7 12.0 7
3.0 1 3.7 12 0.2 2 4.0 12 13.0 12 80.4 10 - - 3.6 8 0.5 1 3.6 8 12.0 10
1.9 8 3.3 58 0.6 18 3.6 61 12.2 61 82.5 58 1.0 6 3.6 56 0.7 16 3.9 57 12.1 54
0.5 6 2.4 14 1.4 5 2.6 17 11.6 17 64.4 16 0.4 4 2.5 12 0.8 4 2.5 14 12.0 14
1.4 6 3.5 74 1.3 14 3.7 78 12.0 78 83.6 73 2.5 3 3.7 66 1.2 13 3.9 69 12.1 69
1.9 3 3.4 28 1.8 4 3.6 30 12.0 30 79.0 28 3.8 2 3.6 25 3.3 2 3.8 27 12.3 28
0.0 1 3.7 15 1.8 3 3.8 16 12.0 16 89.2 15 0.0 1 3.8 14 1.5 5 4.1 15 12.0 15
- - 3.5 27 0.8 6 3.7 27 12.0 27 84.2 25 - - 3.7 23 0.4 5 3.8 23 12.0 23
* * * * * * * * * * * * * * * * * * * * * *
2.1 11 3.5 48 1.9 17 4.0 55 12.0 55 89.7 52 1.8 7 3.6 45 2.1 12 4.0 50 11.9 48
2.0 9 3.5 34 1.9 16 4.2 40 11.9 40 88.6 37 1.9 5 3.6 34 2.1 12 4.1 38 11.8 35
2.5 2 3.3 14 1.0 1 3.5 15 12.4 15 92.3 15 1.5 2 3.7 11 - - 3.6 12 12.0 13
2.2 3 3.5 38 1.4 9 3.8 40 13.1 40 77.4 40 3.3 2 3.7 35 0.8 6 4.0 36 12.7 35
3.0 1 2.8 10 2.0 1 3.3 10 13.2 10 64.1 10 3.0 1 3.6 9 2.0 1 4.2 9 13.3 9
- - 4.0 8 0.8 2 4.2 8 13.5 8 96.5 8 - - 3.7 8 0.6 2 3.9 8 12.0 8
1.8 2 3.6 20 1.6 6 3.8 22 12.8 22 76.5 22 3.5 1 3.8 18 0.6 3 3.9 19 12.7 18
* * * * * * * * * * * * * * * * * * * * * *
2.5 75 3.0 214 1.0 57 3.2 281 12.5 281 86.0 273 2.8 61 3.3 184 1.4 43 3.4 247 12.1 251
2.5 11 3.2 37 0.5 8 3.2 47 12.4 47 91.7 47 2.4 8 3.3 38 0.7 11 3.4 44 12.2 44
2.8 4 2.5 40 0.9 13 2.8 44 12.7 44 65.0 43 2.8 3 3.4 28 1.0 7 3.2 34 13.0 35
1.6 3 3.3 14 0.8 5 3.5 16 15.2 16 86.8 15 3.8 1 3.5 12 0.6 3 3.6 13 12.3 14
2.6 4 3.5 15 0.3 2 3.5 18 12.0 18 96.4 17 3.2 3 3.6 12 - - 3.5 15 12.0 17
2.5 1 2.7 8 - - 2.7 9 12.0 9 84.1 9 2.5 1 2.7 8 - - 2.7 9 11.6 8
2.2 5 3.2 12 0.0 1 3.3 15 12.0 15 93.0 15 2.4 5 3.6 10 - - 3.4 14 12.0 14
3.0 4 3.0 15 0.9 2 3.2 18 12.3 18 89.4 18 4.3 3 3.2 14 1.5 1 3.5 17 12.7 17
2.9 5 2.9 7 1.0 1 3.3 11 13.3 11 98.3 11 3.1 5 2.9 6 1.0 1 3.4 10 12.0 10
2.6 7 3.3 6 - - 2.9 13 11.8 13 80.9 12 2.6 7 3.5 6 - - 3.0 13 11.3 13
2.9 6 3.1 4 3.0 1 3.0 11 13.5 11 87.5 11 3.0 5 3.1 5 3.0 2 3.7 10 11.6 10
2.5 25 3.0 56 1.4 24 3.3 79 12.1 79 88.6 75 2.7 20 3.4 45 2.0 18 3.6 68 11.9 69
3.6 5 3.5 11 2.6 3 4.0 16 12.1 16 95.0 15 3.8 4 3.4 10 - - 3.5 14 12.0 14
2.0 21 3.3 29 2.3 11 4.5 36 11.7 36 72.8 36 1.8 17 3.2 25 1.3 8 3.9 31 11.8 29
2.8 2 3.3 15 0.3 3 3.5 16 12.3 16 93.3 15 2.8 2 3.4 12 0.5 3 3.7 13 12.2 13
1.2 6 3.3 73 1.0 8 3.4 75 11.9 75 85.5 70 2.0 1 3.4 65 1.5 5 3.5 66 12.2 63
1.3 8 2.6 27 2.6 4 3.0 31 13.6 31 71.0 28 1.6 6 3.3 23 2.6 4 3.4 28 12.2 26
1.2 9 2.6 25 1.8 9 2.8 32 12.9 32 73.0 32 2.3 6 2.8 23 1.6 6 2.9 30 12.5 26
0.0 4 2.5 6 1.2 3 2.7 7 13.4 7 53.0 7 0.8 2 3.5 5 1.8 2 3.2 7 14.0 6
2.1 5 2.6 19 2.1 6 2.9 25 12.7 25 78.7 25 3.1 4 2.6 18 1.6 4 2.8 23 12.0 20
3.1 5 3.1 19 1.4 3 3.1 25 11.5 25 87.9 23 3.1 5 3.3 17 2.0 2 3.3 23 11.5 22
2.8 4 3.4 31 0.3 1 3.5 34 12.0 34 90.9 32 3.1 4 3.7 29 0.3 1 3.7 32 12.1 32
1.0 3 3.7 10 1.1 4 3.7 12 12.0 12 70.4 12 1.5 2 3.1 9 1.3 4 3.3 11 12.0 11
0.0 1 3.6 7 1.5 2 3.5 8 12.0 8 60.4 8 0.0 1 3.0 7 1.3 3 3.1 8 12.0 7
2.2 181 3.2 732 1.3 172 3.4 859 12.3 859 83.5 823 2.4 137 3.4 652 1.3 131 3.6 766 12.1 752

WorldatWork 2003-04 Salary Budget Survey 41
2003 Actual Increases 2004 Projected Increases
NONEXEMPT SALARIED EMPLOYEES
GENERALINCREASE/
COLA
MERITINCREASE
OTHERINCREASE
TOTALINCREASE
MONTHSBETWEEN
INCREASES
% OF EERECEIVINGINCREASE IN 2003
% n % n % n % n Mo. n % n
GENERALINCREASE/
COLA
MERITINCREASE
OTHERINCREASE
TOTALINCREASE
MONTHSBETWEEN
INCREASES
% n % n % n % n Mo. n
INDUSTRY
Sou
th
ern
Reg
ion
U
.S.
* Fewer than five survey respondents ** Total line reflects all data submitted – No DataMining = Industry Group
Metal Mfg = Industry Subgroup
Key:
Accommodation & Food Services
Administrative Support & Waste Mgmt.
Agriculture, Forestry, Fishing & Hunting
Arts, Entertainment & Recreation
Construction
Consulting, Prof., Scientific & Tech. Svcs.
Educational Services
Finance & Insurance
Credit Intermediation & Related Act.
Funds, Trusts & Other Financial Vehicles
Insurance Carriers & Related Act.
Securities, Commodities & Other Investments
Health Care & Social Assistance
Hospitals
Nursing, Ambulatory & Residential Care
Information
Internet Industries
Publishing Industries
Motion Picture, Sound Recording, Broadcasting
Mgmt of Companies & Enterprises
Manufacturing
Chemical Mfg.
Computer & Electronic Product Mfg.
Electrical Equip., Appliance & Component Mfg.
Food, Beverage & Tobacco Product Mfg.
Machinery Mfg.
Metal Mfg.
Paper Mfg., Printing & Related Act.
Plastics & Rubber Products Mfg.
Textile, Apparel, Leather & Allied Product Mfg.
Transportation Equipment Mfg.
Other Misc. Mfg.
Mining
Public Administration
Real Estate, Rental & Leasing
Retail Trade
Telecommunications
Transportation
Air Transportation
All Other Transportation
Utilities
Wholesale Trade
Other Services (except Public Admin.)
Religious, Grantmaking, Civic, Prof. & Similar Org.
Total
- - 3.5 7 - - 3.5 7 12.9 7 81.5 7 - - 3.6 6 0.5 1 3.7 6 12.3 6
3.1 2 3.4 5 0.5 1 3.4 7 12.0 7 82.0 7 3.4 2 3.4 5 1.0 1 3.5 7 12.0 6
* * * * * * * * * * * * * * * * * * * * * *
* * * * * * * * * * * * * * * * * * * * * *
0.0 1 3.5 12 1.0 3 3.8 12 13.5 12 80.2 11 0.0 1 3.7 9 0.5 1 3.8 9 12.0 10
1.6 7 3.4 55 0.8 19 3.7 58 12.9 58 81.1 54 2.7 3 3.7 45 0.6 16 3.8 48 12.2 44
0.0 3 3.4 11 2.0 1 3.0 13 12.0 13 73.7 13 0.0 2 3.3 10 2.0 1 3.2 11 12.0 13
3.4 6 3.4 82 1.2 12 3.5 88 12.2 88 83.2 84 4.3 2 3.7 75 1.3 10 3.8 77 12.2 75
3.6 2 3.6 22 2.2 5 4.1 24 12.0 24 85.4 23 4.5 1 3.8 23 1.9 5 4.2 24 12.0 24
2.0 1 2.4 10 1.0 2 2.6 11 12.3 11 73.1 11 - - 3.4 7 1.0 1 3.5 7 12.4 7
4.0 1 3.8 42 0.3 4 3.8 43 12.1 43 89.6 42 4.0 1 3.7 38 0.2 3 3.8 39 11.9 39
3.5 2 1.6 6 0.0 1 2.1 8 13.5 8 48.5 6 - - 3.0 5 2.0 1 3.4 5 16.0 3
3.0 3 3.9 6 0.3 2 3.7 9 12.0 9 91.1 9 1.7 3 4.0 6 0.5 1 3.3 9 12.0 8
* * * * * * * * * * * * * * * * * * * * * *
3.0 1 3.9 4 - - 3.7 5 12.0 5 96.0 5 0.0 1 4.0 4 - - 3.2 5 12.0 4
0.0 3 2.8 33 0.6 9 3.0 33 13.0 33 74.7 30 - - 3.7 26 0.6 4 3.8 26 13.1 26
0.0 1 1.3 5 0.5 1 1.4 5 12.2 5 39.6 5 * * * * * * * * * *
3.3 8 0.8 2 3.5 8 13.5 8 98.0 6 - - 3.9 8 0.5 1 3.9 8 12.0 8
0.0 2 3.0 20 0.6 6 3.2 20 13.0 20 76.5 19 - - 3.5 14 0.7 3 3.7 14 12.2 14
* * * * * * * * * * * * * * * * * * * * * *
1.6 23 3.3 280 0.7 54 3.4 292 12.8 292 87.8 288 2.2 17 3.5 254 1.0 42 3.6 268 12.5 266
1.7 3 3.3 51 0.7 12 3.5 53 12.4 53 91.0 53 2.0 3 3.5 47 0.8 10 3.6 49 12.2 48
0.5 4 2.8 30 0.7 11 3.0 31 13.7 31 64.0 31 0.0 1 3.7 24 1.2 6 3.8 25 13.4 24
- - 3.6 17 0.7 6 3.8 17 12.9 17 86.2 16 3.0 1 3.5 15 0.5 5 3.7 16 12.4 16
2.4 2 3.5 27 2.1 4 3.9 28 12.5 28 92.4 28 - - 3.6 25 1.2 3 3.7 25 12.5 26
- - 3.1 9 - - 3.1 9 13.3 9 92.1 9 - - 2.7 9 - - 2.7 9 11.6 8
2.0 2 3.6 21 0.3 2 3.6 22 13.2 22 92.9 22 4.0 1 3.7 20 4.3 2 4.1 21 12.1 20
- - 2.7 19 0.1 1 2.7 19 12.9 19 89.0 19 - - 3.2 17 1.1 2 3.1 18 12.6 19
- - 3.1 9 - - 3.1 9 13.2 9 87.0 9 3.0 1 3.4 8 - - 3.4 9 13.3 9
2.7 2 3.3 12 1.0 1 3.3 14 13.5 14 80.1 13 2.9 2 3.4 12 1.0 1 3.4 14 13.5 14
1.8 2 3.3 11 0.0 1 3.3 12 12.8 12 90.5 11 3.5 2 3.5 9 - - 3.5 11 12.8 11
1.6 8 3.4 74 0.6 16 3.6 78 12.5 78 92.7 77 1.4 6 3.6 68 0.7 13 3.6 71 12.3 71
- - 3.6 17 1.4 5 4.0 17 12.2 17 95.0 15 - - 3.5 14 0.5 2 3.6 14 12.0 13
1.2 8 3.7 13 0.4 4 3.7 16 12.1 16 83.5 15 1.2 8 3.4 12 1.5 4 3.8 15 12.1 15
2.5 2 3.3 15 0.5 3 3.5 16 12.3 16 92.8 16 2.5 2 3.5 14 0.8 2 3.7 15 12.3 15
1.0 2 3.1 25 0.8 5 3.2 26 12.6 26 85.2 24 1.0 2 3.2 24 1.0 5 3.4 25 12.7 25
1.5 2 3.0 22 0.4 7 3.0 24 14.2 24 63.0 20 3.3 18 0.6 4 3.4 18 12.0 17
0.0 1 2.2 20 0.0 1 2.2 20 17.0 20 62.1 19 3.0 2 2.8 16 1.0 1 2.9 18 12.8 15
- - 1.5 5 - - 1.5 5 15.2 5 22.5 4 * * * * * * * * * *
0.0 1 2.4 15 0.0 1 2.4 15 17.6 15 72.6 15 3.0 2 2.6 12 1.0 1 2.7 14 12.0 11
3.4 4 3.0 17 3.0 1 3.1 22 12.0 22 82.2 21 3.5 3 3.4 18 3.0 1 3.4 22 11.7 21
1.8 2 3.2 23 1.7 5 3.6 24 12.1 24 81.5 23 3.5 1 3.7 21 0.8 1 3.7 22 12.1 21
* * * * * * * * * * * * * * * * * * * * * *
* * * * * * * * * * * * * * * * * * * * * *
1.8 72 3.3 649 0.8 132 3.4 693 12.8 693 83.7 665 2.1 51 3.5 579 0.9 97 3.6 619 12.4 605

Sou
th
ern
Reg
ion
U
.S.
2003 Actual Increases 2004 Projected Increases
EXEMPT SALARIED EMPLOYEES
INDUSTRY
42 WorldatWork 2003-04 Salary Budget SurveyMining = Industry Group
Metal Mfg = Industry Subgroup
GENERALINCREASE/
COLA
MERITINCREASE
OTHERINCREASE
TOTALINCREASE
MONTHSBETWEEN
INCREASES
% OF EERECEIVINGINCREASE IN 2003
% n % n % n % n Mo. n % n
GENERALINCREASE/
COLA
MERITINCREASE
OTHERINCREASE
TOTALINCREASE
MONTHSBETWEEN
INCREASES
% n % n % n % n Mo. n
Accommodation & Food Services
Administrative Support & Waste Mgmt.
Agriculture, Forestry, Fishing & Hunting
Arts, Entertainment & Recreation
Construction
Consulting, Prof., Scientific & Tech. Svcs.
Educational Services
Finance & Insurance
Credit Intermediation & Related Act.
Funds, Trusts & Other Financial Vehicles
Insurance Carriers & Related Act.
Securities, Commodities & Other Investments
Health Care & Social Assistance
Hospitals
Nursing, Ambulatory & Residential Care
Information
Internet Industries
Publishing Industries
Motion Picture, Sound Recording, Broadcasting
Mgmt of Companies & Enterprises
Manufacturing
Chemical Mfg.
Computer & Electronic Product Mfg.
Electrical Equip., Appliance & Component Mfg.
Food, Beverage & Tobacco Product Mfg.
Machinery Mfg.
Metal Mfg.
Paper Mfg., Printing & Related Act.
Plastics & Rubber Products Mfg.
Textile, Apparel, Leather & Allied Product Mfg.
Transportation Equipment Mfg.
Other Misc. Mfg.
Mining
Public Administration
Real Estate, Rental & Leasing
Retail Trade
Telecommunications
Transportation
Air Transportation
All Other Transportation
Utilities
Wholesale Trade
Other Services (except Public Admin.)
Religious, Grantmaking, Civic, Prof. & Similar Org.
Total
* Fewer than five survey respondents ** Total line reflects all data submitted – No DataKey:
- - 3.5 13 0.4 4 3.6 13 12.5 13 89.1 13 - - 3.5 12 0.3 4 3.6 12 11.7 12
2.4 4 2.8 14 2.0 2 3.6 15 12.5 15 77.9 15 1.7 4 3.5 14 4.0 1 3.9 15 12.5 13
3.0 1 2.9 4 - - 2.9 5 12.0 5 93.2 5 * * * * * * * * * *
- - 3.1 7 - - 3.1 7 12.0 7 94.9 7 - - 3.4 7 - - 3.4 7 12.0 7
1.5 2 3.5 19 0.8 6 3.9 19 13.9 19 85.2 17 0.0 1 3.7 14 0.5 2 3.7 14 12.0 16
1.4 15 3.6 104 1.0 34 4.0 107 13.0 107 82.4 101 1.7 9 3.8 92 0.8 28 4.1 93 12.8 89
0.4 7 2.7 20 1.4 5 2.7 23 11.7 23 69.3 22 0.3 5 2.7 18 0.8 4 2.6 20 12.0 20
2.1 9 3.5 135 1.2 20 3.6 142 12.1 142 85.0 136 2.9 4 3.7 121 1.5 18 3.9 125 12.2 123
2.4 4 3.6 39 2.1 5 3.8 42 12.0 42 84.1 41 3.8 2 3.6 37 2.9 5 4.0 39 12.2 39
1.0 2 3.4 22 1.6 4 3.5 24 11.9 24 81.7 23 0.0 1 3.7 18 1.5 5 3.9 19 12.0 20
4.0 1 3.8 62 0.7 8 3.8 63 12.2 63 92.2 60 4.0 1 3.8 55 0.4 6 3.9 56 12.1 56
1.5 2 2.0 9 0.4 3 2.2 10 13.2 10 50.7 9 - - 3.4 8 1.1 2 3.6 8 14.4 5
2.3 11 3.5 50 1.9 13 4.0 57 12.0 57 90.8 54 2.1 6 3.6 46 1.9 10 3.9 51 11.9 50
2.2 9 3.6 35 2.0 12 4.1 41 11.9 41 90.8 38 2.4 4 3.6 34 1.9 10 4.0 38 11.8 36
2.5 2 3.4 15 1.0 1 3.6 16 12.4 16 90.6 16 1.5 2 3.7 12 - - 3.6 13 12.0 14
1.3 6 3.2 65 1.2 18 3.6 67 13.4 67 76.2 64 3.3 3 3.7 56 0.8 11 4.0 56 12.9 55
1.5 2 2.5 14 1.3 2 2.8 14 13.8 14 59.5 14 3.0 1 3.7 12 1.5 2 4.2 12 14.1 12
- - 3.6 12 0.8 3 3.8 12 14.0 12 97.0 10 - - 3.8 12 0.6 2 3.9 12 12.0 12
1.3 4 3.4 39 1.3 13 3.7 41 13.1 41 76.8 40 3.5 2 3.7 32 0.6 7 4.1 32 12.9 31
* * * * * * * * * * * * * * * * * * * * * *
1.6 35 3.2 390 0.7 91 3.4 404 12.9 404 84.3 396 2.5 21 3.5 339 1.1 63 3.7 357 12.6 356
2.1 4 3.4 62 0.8 19 3.7 64 12.3 64 90.2 64 2.2 3 3.5 58 0.7 14 3.7 60 12.1 57
0.3 6 2.7 67 0.8 24 2.9 69 13.5 69 64.4 68 1.5 2 3.6 50 1.1 14 3.6 55 13.3 54
0.0 1 3.4 22 0.8 7 3.7 22 14.3 22 80.8 21 3.0 1 3.5 19 0.5 5 3.7 20 12.3 21
4.7 1 3.6 35 1.5 6 3.9 36 12.4 36 93.6 36 - - 3.6 32 1.1 4 3.8 32 12.5 33
- - 2.9 11 - - 2.9 11 13.1 11 84.0 11 - - 2.8 11 - - 2.8 11 11.7 10
1.7 3 3.4 24 0.2 3 3.5 25 13.1 25 91.0 25 3.5 2 3.6 22 2.9 3 3.9 24 12.1 23
3.5 2 2.7 27 0.4 2 3.0 27 12.9 27 82.2 27 7.0 1 3.4 25 1.6 2 3.7 26 13.4 26
4.0 1 3.0 13 1.0 1 3.2 14 12.9 14 88.0 14 3.0 1 3.4 11 1.0 1 3.5 12 13.0 12
2.7 2 3.4 14 1.0 1 3.4 16 13.3 16 86.3 15 2.9 2 3.4 14 1.0 1 3.4 16 13.3 16
0.0 1 3.4 14 1.5 2 3.4 15 13.3 15 85.4 14 4.0 1 3.6 13 3.0 2 4.1 14 14.5 14
1.5 14 3.4 101 0.5 26 3.6 105 12.5 105 89.5 101 1.6 8 3.6 84 1.0 17 3.8 87 12.2 90
5.0 1 3.7 20 1.8 6 4.1 22 12.2 22 91.4 20 5.0 1 3.6 17 0.5 2 3.8 18 12.0 18
1.8 26 3.4 37 2.1 13 4.3 47 12.1 47 76.6 46 1.5 22 3.3 31 1.2 10 3.7 40 12.5 37
2.8 3 3.5 23 0.4 4 3.7 24 13.4 24 90.2 23 2.8 3 3.5 20 0.5 3 3.8 21 12.7 21
0.9 6 3.3 77 1.9 11 3.5 79 12.7 79 83.9 76 1.0 2 3.5 70 1.4 9 3.7 71 12.9 67
1.5 10 2.7 46 0.6 10 2.9 51 13.8 51 64.4 46 1.4 4 3.4 39 0.7 5 3.5 41 12.7 39
0.9 7 2.6 45 0.8 9 2.8 46 14.8 46 69.9 45 2.6 4 2.9 40 0.7 7 3.1 43 12.6 38
0.0 3 2.0 11 0.5 2 2.1 11 15.4 11 51.0 11 1.5 1 3.3 10 1.0 1 3.2 11 13.8 10
1.6 4 2.8 34 0.9 7 3.1 35 14.7 35 76.0 34 3.0 3 2.8 30 0.6 6 3.0 32 12.2 28
3.3 2 3.3 27 1.4 3 3.3 30 12.2 30 89.4 27 3.5 1 3.5 26 2.0 2 3.5 28 12.0 27
2.5 3 3.4 46 0.7 5 3.4 48 12.6 48 82.7 46 3.5 2 3.7 43 2.0 3 3.8 45 12.1 44
1.5 4 3.6 10 1.9 4 3.8 13 12.0 13 78.5 13 1.5 2 2.8 10 1.4 5 3.2 12 12.0 11
0.0 1 3.6 7 2.0 2 3.6 8 12.0 8 69.5 8 0.0 1 3.0 7 1.3 3 3.1 8 12.0 7
1.7 153 3.3 1155 1.1 259 3.5 1222 12.8 1222 82.4 1175 2.0 95 3.5 1021 1.1 187 3.7 1076 12.5 1050
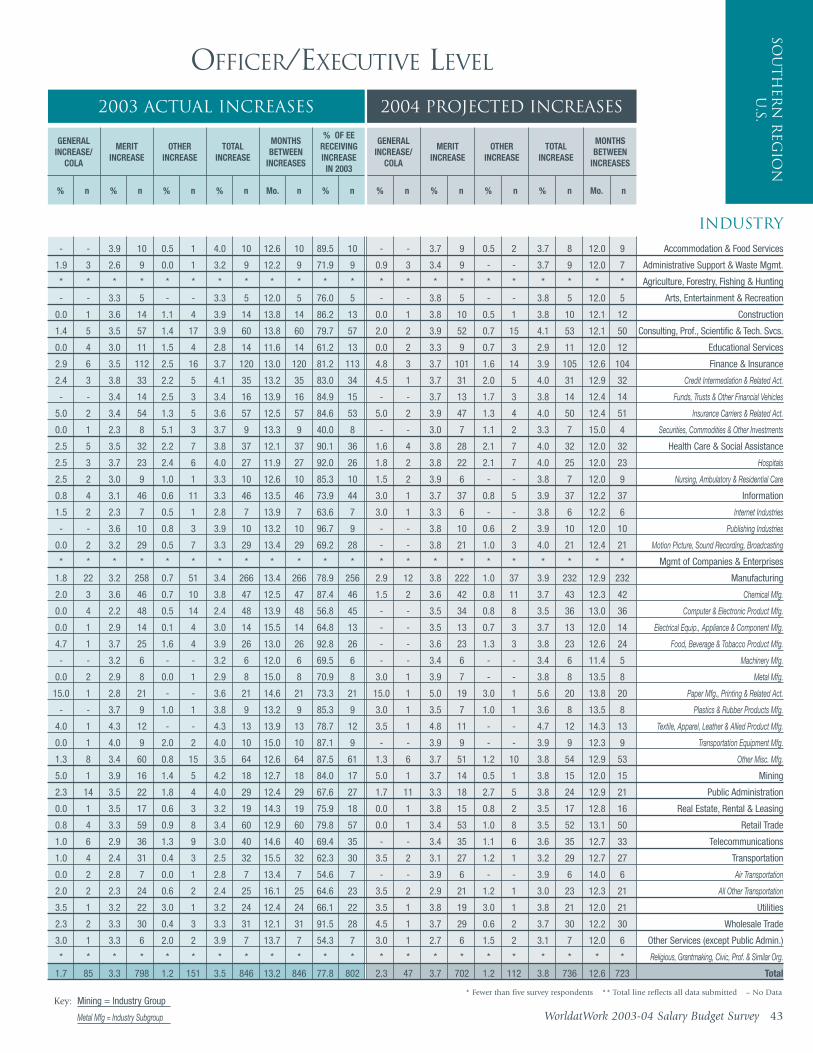
WorldatWork 2003-04 Salary Budget Survey 43
2003 Actual Increases 2004 Projected Increases
OFFICER/EXECUTIVE LEVEL
GENERALINCREASE/
COLA
MERITINCREASE
OTHERINCREASE
TOTALINCREASE
MONTHSBETWEEN
INCREASES
% OF EERECEIVINGINCREASE IN 2003
% n % n % n % n Mo. n % n
GENERALINCREASE/
COLA
MERITINCREASE
OTHERINCREASE
TOTALINCREASE
MONTHSBETWEEN
INCREASES
% n % n % n % n Mo. n
INDUSTRY
Sou
th
ern
Reg
ion
U
.S.
* Fewer than five survey respondents ** Total line reflects all data submitted – No DataMining = Industry Group
Metal Mfg = Industry Subgroup
Key:
Accommodation & Food Services
Administrative Support & Waste Mgmt.
Agriculture, Forestry, Fishing & Hunting
Arts, Entertainment & Recreation
Construction
Consulting, Prof., Scientific & Tech. Svcs.
Educational Services
Finance & Insurance
Credit Intermediation & Related Act.
Funds, Trusts & Other Financial Vehicles
Insurance Carriers & Related Act.
Securities, Commodities & Other Investments
Health Care & Social Assistance
Hospitals
Nursing, Ambulatory & Residential Care
Information
Internet Industries
Publishing Industries
Motion Picture, Sound Recording, Broadcasting
Mgmt of Companies & Enterprises
Manufacturing
Chemical Mfg.
Computer & Electronic Product Mfg.
Electrical Equip., Appliance & Component Mfg.
Food, Beverage & Tobacco Product Mfg.
Machinery Mfg.
Metal Mfg.
Paper Mfg., Printing & Related Act.
Plastics & Rubber Products Mfg.
Textile, Apparel, Leather & Allied Product Mfg.
Transportation Equipment Mfg.
Other Misc. Mfg.
Mining
Public Administration
Real Estate, Rental & Leasing
Retail Trade
Telecommunications
Transportation
Air Transportation
All Other Transportation
Utilities
Wholesale Trade
Other Services (except Public Admin.)
Religious, Grantmaking, Civic, Prof. & Similar Org.
Total
- - 3.9 10 0.5 1 4.0 10 12.6 10 89.5 10 - - 3.7 9 0.5 2 3.7 8 12.0 9
1.9 3 2.6 9 0.0 1 3.2 9 12.2 9 71.9 9 0.9 3 3.4 9 - - 3.7 9 12.0 7
* * * * * * * * * * * * * * * * * * * * * *
- - 3.3 5 - - 3.3 5 12.0 5 76.0 5 - - 3.8 5 - - 3.8 5 12.0 5
0.0 1 3.6 14 1.1 4 3.9 14 13.8 14 86.2 13 0.0 1 3.8 10 0.5 1 3.8 10 12.1 12
1.4 5 3.5 57 1.4 17 3.9 60 13.8 60 79.7 57 2.0 2 3.9 52 0.7 15 4.1 53 12.1 50
0.0 4 3.0 11 1.5 4 2.8 14 11.6 14 61.2 13 0.0 2 3.3 9 0.7 3 2.9 11 12.0 12
2.9 6 3.5 112 2.5 16 3.7 120 13.0 120 81.2 113 4.8 3 3.7 101 1.6 14 3.9 105 12.6 104
2.4 3 3.8 33 2.2 5 4.1 35 13.2 35 83.0 34 4.5 1 3.7 31 2.0 5 4.0 31 12.9 32
- - 3.4 14 2.5 3 3.4 16 13.9 16 84.9 15 - - 3.7 13 1.7 3 3.8 14 12.4 14
5.0 2 3.4 54 1.3 5 3.6 57 12.5 57 84.6 53 5.0 2 3.9 47 1.3 4 4.0 50 12.4 51
0.0 1 2.3 8 5.1 3 3.7 9 13.3 9 40.0 8 - - 3.0 7 1.1 2 3.3 7 15.0 4
2.5 5 3.5 32 2.2 7 3.8 37 12.1 37 90.1 36 1.6 4 3.8 28 2.1 7 4.0 32 12.0 32
2.5 3 3.7 23 2.4 6 4.0 27 11.9 27 92.0 26 1.8 2 3.8 22 2.1 7 4.0 25 12.0 23
2.5 2 3.0 9 1.0 1 3.3 10 12.6 10 85.3 10 1.5 2 3.9 6 - - 3.8 7 12.0 9
0.8 4 3.1 46 0.6 11 3.3 46 13.5 46 73.9 44 3.0 1 3.7 37 0.8 5 3.9 37 12.2 37
1.5 2 2.3 7 0.5 1 2.8 7 13.9 7 63.6 7 3.0 1 3.3 6 - - 3.8 6 12.2 6
- - 3.6 10 0.8 3 3.9 10 13.2 10 96.7 9 - - 3.8 10 0.6 2 3.9 10 12.0 10
0.0 2 3.2 29 0.5 7 3.3 29 13.4 29 69.2 28 - - 3.8 21 1.0 3 4.0 21 12.4 21
* * * * * * * * * * * * * * * * * * * * * *
1.8 22 3.2 258 0.7 51 3.4 266 13.4 266 78.9 256 2.9 12 3.8 222 1.0 37 3.9 232 12.9 232
2.0 3 3.6 46 0.7 10 3.8 47 12.5 47 87.4 46 1.5 2 3.6 42 0.8 11 3.7 43 12.3 42
0.0 4 2.2 48 0.5 14 2.4 48 13.9 48 56.8 45 - - 3.5 34 0.8 8 3.5 36 13.0 36
0.0 1 2.9 14 0.1 4 3.0 14 15.5 14 64.8 13 - - 3.5 13 0.7 3 3.7 13 12.0 14
4.7 1 3.7 25 1.6 4 3.9 26 13.0 26 92.8 26 - - 3.6 23 1.3 3 3.8 23 12.6 24
- - 3.2 6 - - 3.2 6 12.0 6 69.5 6 - - 3.4 6 - - 3.4 6 11.4 5
0.0 2 2.9 8 0.0 1 2.9 8 15.0 8 70.9 8 3.0 1 3.9 7 - - 3.8 8 13.5 8
15.0 1 2.8 21 - - 3.6 21 14.6 21 73.3 21 15.0 1 5.0 19 3.0 1 5.6 20 13.8 20
- - 3.7 9 1.0 1 3.8 9 13.2 9 85.3 9 3.0 1 3.5 7 1.0 1 3.6 8 13.5 8
4.0 1 4.3 12 - - 4.3 13 13.9 13 78.7 12 3.5 1 4.8 11 - - 4.7 12 14.3 13
0.0 1 4.0 9 2.0 2 4.0 10 15.0 10 87.1 9 - - 3.9 9 - - 3.9 9 12.3 9
1.3 8 3.4 60 0.8 15 3.5 64 12.6 64 87.5 61 1.3 6 3.7 51 1.2 10 3.8 54 12.9 53
5.0 1 3.9 16 1.4 5 4.2 18 12.7 18 84.0 17 5.0 1 3.7 14 0.5 1 3.8 15 12.0 15
2.3 14 3.5 22 1.8 4 4.0 29 12.4 29 67.6 27 1.7 11 3.3 18 2.7 5 3.8 24 12.9 21
0.0 1 3.5 17 0.6 3 3.2 19 14.3 19 75.9 18 0.0 1 3.8 15 0.8 2 3.5 17 12.8 16
0.8 4 3.3 59 0.9 8 3.4 60 12.9 60 79.8 57 0.0 1 3.4 53 1.0 8 3.5 52 13.1 50
1.0 6 2.9 36 1.3 9 3.0 40 14.6 40 69.4 35 - - 3.4 35 1.1 6 3.6 35 12.7 33
1.0 4 2.4 31 0.4 3 2.5 32 15.5 32 62.3 30 3.5 2 3.1 27 1.2 1 3.2 29 12.7 27
0.0 2 2.8 7 0.0 1 2.8 7 13.4 7 54.6 7 - - 3.9 6 - - 3.9 6 14.0 6
2.0 2 2.3 24 0.6 2 2.4 25 16.1 25 64.6 23 3.5 2 2.9 21 1.2 1 3.0 23 12.3 21
3.5 1 3.2 22 3.0 1 3.2 24 12.4 24 66.1 22 3.5 1 3.8 19 3.0 1 3.8 21 12.0 21
2.3 2 3.3 30 0.4 3 3.3 31 12.1 31 91.5 28 4.5 1 3.7 29 0.6 2 3.7 30 12.2 30
3.0 1 3.3 6 2.0 2 3.9 7 13.7 7 54.3 7 3.0 1 2.7 6 1.5 2 3.1 7 12.0 6
* * * * * * * * * * * * * * * * * * * * * *
1.7 85 3.3 798 1.2 151 3.5 846 13.2 846 77.8 802 2.3 47 3.7 702 1.2 112 3.8 736 12.6 723

Sou
th
ern
Reg
ion
U
.S. 2003 Actual Increases
SALARY STRUCTURE ADJUSTMENTS
NonexemptHourly
Nonunion
NonexemptSalaried
ExemptSalaried
Officer/Executive
% n % n % n % n
2004 Projected Increases
NonexemptHourly
Nonunion
NonexemptSalaried
ExemptSalaried
Officer/Executive
% n % n % n % n
Accommodation & Food Services
Administrative Support & Waste Mgmt.
Agriculture, Forestry, Fishing & Hunting
Arts, Entertainment & Recreation
Construction
Consulting, Prof., Scientific & Tech. Svcs.
Educational Services
Finance & Insurance
Credit Intermediation & Related Act.
Funds, Trusts & Other Financial Vehicles
Insurance Carriers & Related Act.
Securities, Commodities & Other Investments
Health Care & Social Assistance
Hospitals
Nursing, Ambulatory & Residential Care
Information
Internet Industries
Publishing Industries
Motion Picture, Sound Recording, Broadcasting
Mgmt of Companies & Enterprises
Manufacturing
Chemical Mfg.
Computer & Electronic Product Mfg.
Electrical Equip., Appliance & Component Mfg.
Food, Beverage & Tobacco Product Mfg.
Machinery Mfg.
Metal Mfg.
Paper Mfg., Printing & Related Act.
Plastics & Rubber Products Mfg.
Textile, Apparel, Leather & Allied Product Mfg.
Transportation Equipment Mfg.
Other Misc. Mfg.
Mining
Public Administration
Real Estate, Rental & Leasing
Retail Trade
Telecommunications
Transportation
Air Transportation
All Other Transportation
Utilities
Wholesale Trade
Other Services (except Public Admin.)
Religious, Grantmaking, Civic, Prof. & Similar Org.
Total
2.1 7 2.9 6 2.5 11 2.6 7 1.8 6 1.3 6 1.6 11 1.8 7
1.2 11 * * 1.2 11 1.4 8 2.4 10 * * 2.5 10 2.3 7
* * * * * * * * * * * * * * * *
1.3 6 * * 2.3 6 1.2 5 * * * * * * * *
1.8 8 1.1 8 1.6 13 1.9 6 2.3 5 2.4 6 2.7 9 2.7 5
1.9 48 2.2 41 2.1 76 1.9 38 2.1 46 2.3 37 2.4 70 2.3 35
2.1 12 1.2 9 1.7 16 0.4 5 1.4 9 1.3 9 1.3 13 1.4 5
1.9 61 2.4 64 2.1 107 2.4 77 2.3 51 2.3 55 2.4 92 2.5 69
1.7 25 2.2 19 1.9 34 2.1 27 2.4 23 2.0 19 2.4 32 2.5 26
1.2 11 1.3 8 1.2 17 1.4 11 1.8 8 * * 2.1 11 2.4 8
2.5 21 2.8 33 2.5 49 2.4 36 2.2 17 2.5 28 2.5 42 2.4 32
* * * * * * * * * * * * * * * *
2.1 48 1.6 8 2.0 50 1.7 31 2.2 47 2.2 8 2.2 49 2.0 29
2.0 36 * * 1.9 37 1.4 23 2.2 35 * * 2.1 36 2.0 22
2.4 12 1.4 5 2.2 13 2.3 8 2.3 12 2.3 5 2.4 13 2.2 7
1.4 26 2.0 25 1.6 46 2.4 33 2.0 25 2.7 23 2.3 42 2.0 30
0.9 7 * * 0.7 11 0.4 5 1.7 7 * * 2.3 9 2.3 5
1.8 5 2.2 7 2.1 9 1.8 8 1.9 6 2.8 6 2.3 9 2.2 7
1.6 14 2.2 14 1.8 26 3.1 20 2.2 12 2.6 13 2.4 24 1.9 18
* * * * * * * * * * * * * * * *
1.8 193 2.2 240 2.2 321 2.0 184 2.3 172 2.6 223 2.6 290 2.5 163
1.9 32 1.9 44 2.3 52 2.3 38 2.4 28 2.6 40 2.7 45 2.6 32
1.0 33 1.3 23 1.5 50 1.0 32 1.7 25 2.2 19 2.2 38 1.8 23
1.0 11 2.0 14 1.8 18 1.1 7 2.2 9 2.5 14 2.5 16 2.2 5
1.9 14 2.5 23 2.5 28 2.6 15 2.0 13 2.5 22 2.5 28 2.9 15
1.3 8 1.8 9 1.5 9 * * 2.1 7 2.4 8 2.3 8 * *
2.9 11 2.5 18 2.5 22 2.3 7 2.8 9 3.1 15 3.0 19 3.4 7
2.2 12 1.6 17 1.8 25 1.3 17 2.7 12 2.3 17 2.6 25 2.6 16
2.5 5 1.6 6 1.8 10 1.2 6 1.9 6 2.9 7 2.3 12 1.6 7
1.4 8 2.0 13 1.9 14 2.1 10 2.5 8 2.9 13 3.0 14 3.3 10
2.3 9 2.1 8 2.5 11 2.2 6 2.8 8 2.7 9 3.0 11 2.6 7
2.2 50 2.8 65 2.7 82 2.9 42 2.4 47 2.7 59 2.7 74 2.5 38
1.6 7 2.4 14 2.2 16 2.1 9 1.5 6 2.3 11 2.2 13 2.1 8
2.1 33 1.6 16 2.0 43 2.1 26 1.6 27 1.3 16 1.6 37 1.4 23
1.6 10 2.3 14 3.5 19 2.6 12 2.7 8 2.8 12 2.8 16 2.9 10
2.1 56 1.8 20 2.2 62 2.2 41 2.3 49 2.0 20 2.4 54 2.3 35
1.0 25 1.5 20 1.1 41 1.3 27 1.5 22 2.3 16 1.9 37 1.9 26
1.8 23 1.8 16 1.7 37 2.0 22 2.2 20 2.3 13 2.1 33 2.2 19
1.5 6 * * 1.3 9 * * 2.1 6 * * 2.7 9 * *
1.9 17 2.2 12 1.9 28 2.1 18 2.2 14 2.0 9 1.9 24 2.1 15
2.0 21 2.5 19 2.2 26 1.8 13 2.6 21 2.9 19 2.7 26 2.4 14
1.8 25 2.6 20 2.2 38 1.7 18 2.4 24 2.6 18 2.3 34 1.9 19
4.9 9 * * 1.8 9 2.0 5 1.8 9 * * 2.7 9 2.6 5
7.2 5 - - 1.2 5 * * 1.4 5 - - 2.6 5 * *
1.9 633 2.1 551 2.1 953 2.0 572 2.2 564 2.4 501 2.4 853 2.3 517
44 WorldatWork 2003-04 Salary Budget SurveyMining = Industry Group
Metal Mfg = Industry Subgroup
* Fewer than five survey respondents ** Total line reflects all data submitted – No DataKey:
INDUSTRY

WorldatWork 2003-04 Salary Budget Survey 45
2003 Actual Increases 2004 Projected Increases
NONEXEMPT HOURLY NONUNION EMPLOYEES
GENERALINCREASE/
COLA
MERITINCREASE
OTHERINCREASE
TOTALINCREASE
MONTHSBETWEEN
INCREASES
% OF EERECEIVINGINCREASE IN 2003
% n % n % n % n Mo. n % n
GENERALINCREASE/
COLA
MERITINCREASE
OTHERINCREASE
TOTALINCREASE
MONTHSBETWEEN
INCREASES
% n % n % n % n Mo. n
INDUSTRY
West
ern
Reg
ion
U
.S.
* Fewer than five survey respondents ** Total line reflects all data submitted – No DataMining = Industry Group
Metal Mfg = Industry Subgroup
Key:
Accommodation & Food Services
Administrative Support & Waste Mgmt.
Agriculture, Forestry, Fishing & Hunting
Arts, Entertainment & Recreation
Construction
Consulting, Prof., Scientific & Tech. Svcs.
Educational Services
Finance & Insurance
Credit Intermediation & Related Act.
Funds, Trusts & Other Financial Vehicles
Insurance Carriers & Related Act.
Securities, Commodities & Other Investments
Health Care & Social Assistance
Hospitals
Nursing, Ambulatory & Residential Care
Information
Internet Industries
Publishing Industries
Motion Picture, Sound Recording, Broadcasting
Mgmt of Companies & Enterprises
Manufacturing
Chemical Mfg.
Computer & Electronic Product Mfg.
Electrical Equip., Appliance & Component Mfg.
Food, Beverage & Tobacco Product Mfg.
Machinery Mfg.
Metal Mfg.
Paper Mfg., Printing & Related Act.
Plastics & Rubber Products Mfg.
Textile, Apparel, Leather & Allied Product Mfg.
Transportation Equipment Mfg.
Other Misc. Mfg.
Mining
Public Administration
Real Estate, Rental & Leasing
Retail Trade
Telecommunications
Transportation
Air Transportation
All Other Transportation
Utilities
Wholesale Trade
Other Services (except Public Admin.)
Religious, Grantmaking, Civic, Prof. & Similar Org.
Total
3.2 1 3.4 10 0.8 1 3.5 11 12.0 11 76.9 11 3.0 1 3.2 10 0.5 2 3.3 11 10.9 11
1.6 4 2.8 13 0.0 1 3.0 14 12.1 14 81.8 13 0.9 4 3.5 12 - - 3.3 14 12.0 13
3.0 1 2.6 4 - - 2.7 5 12.0 5 77.8 5 * * * * * * * * * *
1.2 2 3.3 11 2.2 3 3.5 13 12.0 13 83.9 12 - - 3.2 11 2.2 3 3.5 12 12.2 10
- - 3.5 9 0.3 1 3.6 9 13.3 9 94.7 7 - - 3.6 8 0.5 1 3.6 8 12.0 9
1.3 7 3.4 64 0.6 26 3.6 66 12.2 66 81.5 63 1.2 9 3.6 60 0.6 21 3.8 62 12.3 59
0.6 5 2.4 12 0.6 5 2.6 13 13.8 13 50.1 13 0.7 3 2.4 9 1.0 3 2.6 10 12.0 8
0.4 6 3.7 83 0.8 18 3.8 84 11.9 84 82.3 75 1.9 4 3.7 71 0.7 17 3.9 73 12.1 72
0.6 4 3.5 23 0.8 6 3.7 24 11.8 24 78.4 20 2.5 3 3.6 19 1.0 4 3.8 21 12.3 21
0.0 1 4.0 21 0.8 2 4.1 21 12.0 21 83.7 19 0.0 1 3.9 20 0.9 4 4.0 20 12.0 20
- - 3.6 33 0.8 9 3.8 33 12.0 33 82.3 30 - - 3.7 26 0.6 8 3.9 26 12.0 26
0.0 1 3.9 5 0.2 1 3.9 5 12.0 5 97.2 5 - - 4.0 5 0.2 1 4.0 5 12.0 4
3.0 17 3.4 43 2.4 21 4.5 55 12.0 55 88.0 53 2.7 10 3.5 37 2.3 14 4.3 44 12.0 49
3.2 11 3.6 27 2.4 18 4.9 36 11.8 36 88.7 35 2.5 6 3.5 25 2.5 12 4.5 29 11.6 31
2.7 6 3.2 16 2.3 3 3.9 19 12.3 19 86.7 18 2.9 4 3.5 12 1.5 2 3.8 15 12.7 18
1.9 5 3.4 53 1.0 12 3.5 57 13.1 57 78.5 54 2.6 4 3.5 48 1.1 12 3.8 51 12.6 49
3.0 2 3.2 14 1.4 2 3.4 16 13.7 16 71.4 16 3.5 2 3.4 13 1.3 2 3.8 14 12.8 15
0.0 1 3.8 15 0.5 4 3.9 15 13.2 15 95.6 14 0.0 1 3.6 14 0.7 5 3.9 14 12.0 13
1.8 2 3.3 24 1.2 6 3.4 26 12.7 26 73.3 24 3.5 1 3.6 21 1.5 5 3.7 23 12.9 21
* * * * * * * * * * * * * * * * * * * * * *
2.2 71 3.0 237 1.0 71 3.3 289 12.7 289 83.4 277 2.6 57 3.4 195 1.2 55 3.6 247 12.2 252
2.5 8 3.5 31 0.5 10 3.5 38 12.4 38 91.4 38 2.4 7 3.6 31 0.6 11 3.7 36 12.1 36
0.8 4 2.6 61 1.0 19 2.9 63 13.4 63 65.4 62 2.2 3 3.4 46 0.8 12 3.5 50 13.0 50
0.3 4 3.2 24 0.8 9 3.4 25 14.8 25 82.6 24 0.0 1 3.6 21 1.0 6 3.9 21 12.2 23
2.3 7 3.8 20 0.2 3 3.7 25 12.0 25 96.5 24 3.0 5 3.7 15 - - 3.5 20 12.0 21
2.5 1 2.1 10 0.0 1 2.2 11 12.5 11 69.7 11 2.5 1 2.7 8 0.0 1 2.7 9 11.7 9
1.4 3 2.9 10 0.5 2 3.1 11 11.5 11 87.5 11 1.8 3 3.3 8 1.0 1 3.3 10 12.0 11
1.7 3 2.8 11 0.9 2 2.7 14 12.0 14 86.4 14 3.0 2 3.1 11 1.5 1 3.0 14 12.9 13
2.7 5 3.3 6 0.8 2 3.9 9 12.0 9 99.0 9 2.9 5 3.1 6 0.8 2 3.8 9 12.0 9
3.0 3 2.7 2 - - 2.9 5 12.0 5 98.3 3 2.8 3 2.7 2 - - 2.8 5 12.0 5
3.3 3 3.4 5 - - 3.4 8 14.0 8 96.3 8 3.5 3 3.9 4 1.0 1 3.9 7 12.0 7
2.3 30 3.1 57 1.5 23 3.5 80 12.2 80 87.4 73 2.7 24 3.3 43 2.0 20 3.7 66 11.7 68
2.9 4 3.3 13 2.5 2 3.8 16 11.8 16 89.1 15 3.3 2 3.2 13 - - 3.2 15 12.0 13
1.5 7 2.9 15 2.3 3 3.0 20 12.6 20 71.5 20 1.4 3 3.6 13 2.9 4 3.9 16 15.7 13
2.8 2 3.2 14 0.7 4 3.6 15 12.6 15 92.8 14 2.8 2 3.3 12 0.6 5 3.7 13 12.2 13
2.1 5 3.1 56 1.3 8 3.2 60 12.2 60 86.4 55 2.4 2 3.3 48 2.0 5 3.4 52 12.0 48
1.2 9 2.5 32 1.6 8 2.9 36 13.6 36 70.1 32 1.6 6 3.3 27 1.8 6 3.5 31 12.0 30
1.5 8 2.6 23 2.0 8 3.0 29 13.2 29 67.5 29 1.9 7 3.0 19 2.0 5 3.1 26 13.0 24
0.6 5 1.1 5 1.2 3 1.7 7 13.4 7 34.7 7 1.2 3 3.2 3 1.8 2 2.8 6 14.4 5
3.0 3 3.0 18 2.5 5 3.5 22 13.1 22 78.0 22 2.4 4 3.0 16 2.1 3 3.2 20 12.6 19
2.2 8 3.1 14 0.1 5 3.6 17 11.6 17 95.4 17 2.8 5 3.2 11 0.2 2 3.6 14 12.0 15
2.3 4 3.2 32 1.8 3 3.4 35 12.0 35 87.2 34 3.2 3 3.5 30 0.3 1 3.5 33 12.1 32
1.0 3 2.3 8 0.5 2 2.2 10 13.2 10 46.2 10 2.0 3 2.5 6 2.0 2 2.8 9 13.2 10
0.0 2 2.5 6 0.5 2 2.3 7 12.0 7 40.0 7 1.5 2 2.5 5 2.0 2 2.8 7 13.7 7
2.0 171 3.2 749 1.2 203 3.4 858 12.5 858 81.5 813 2.3 127 3.4 644 1.3 158 3.6 747 12.3 738

Wes
ter
n R
egio
n
U.S
.
2003 Actual Increases 2004 Projected Increases
NONEXEMPT SALARIED EMPLOYEES
INDUSTRY
46 WorldatWork 2003-04 Salary Budget SurveyMining = Industry Group
Metal Mfg = Industry Subgroup
GENERALINCREASE/
COLA
MERITINCREASE
OTHERINCREASE
TOTALINCREASE
MONTHSBETWEEN
INCREASES
% OF EERECEIVINGINCREASE IN 2003
% n % n % n % n Mo. n % n
GENERALINCREASE/
COLA
MERITINCREASE
OTHERINCREASE
TOTALINCREASE
MONTHSBETWEEN
INCREASES
% n % n % n % n Mo. n
Accommodation & Food Services
Administrative Support & Waste Mgmt.
Agriculture, Forestry, Fishing & Hunting
Arts, Entertainment & Recreation
Construction
Consulting, Prof., Scientific & Tech. Svcs.
Educational Services
Finance & Insurance
Credit Intermediation & Related Act.
Funds, Trusts & Other Financial Vehicles
Insurance Carriers & Related Act.
Securities, Commodities & Other Investments
Health Care & Social Assistance
Hospitals
Nursing, Ambulatory & Residential Care
Information
Internet Industries
Publishing Industries
Motion Picture, Sound Recording, Broadcasting
Mgmt of Companies & Enterprises
Manufacturing
Chemical Mfg.
Computer & Electronic Product Mfg.
Electrical Equip., Appliance & Component Mfg.
Food, Beverage & Tobacco Product Mfg.
Machinery Mfg.
Metal Mfg.
Paper Mfg., Printing & Related Act.
Plastics & Rubber Products Mfg.
Textile, Apparel, Leather & Allied Product Mfg.
Transportation Equipment Mfg.
Other Misc. Mfg.
Mining
Public Administration
Real Estate, Rental & Leasing
Retail Trade
Telecommunications
Transportation
Air Transportation
All Other Transportation
Utilities
Wholesale Trade
Other Services (except Public Admin.)
Religious, Grantmaking, Civic, Prof. & Similar Org.
Total
* Fewer than five survey respondents ** Total line reflects all data submitted – No DataKey:
- - 3.3 6 - - 3.3 6 13.0 6 79.7 6 - - 3.2 5 0.5 1 3.3 5 12.4 5
3.0 1 3.0 6 0.5 1 2.7 8 13.5 8 69.4 7 - - 4.0 6 1.0 1 3.6 7 14.0 6
3.0 1 2.4 5 - - 2.5 6 14.0 6 79.8 6 4.0 1 3.4 5 - - 3.5 6 12.0 6
3.0 1 4.0 5 0.9 2 4.9 5 12.0 5 93.0 5 3.0 1 3.8 5 0.9 2 4.7 5 12.0 5
0.0 1 3.5 8 0.5 2 3.6 8 13.5 8 88.9 7 0.0 1 3.6 7 0.5 1 3.7 7 12.0 7
1.0 8 3.4 62 1.0 24 3.8 64 13.0 64 81.2 60 1.0 4 3.6 52 0.9 20 3.9 54 12.2 50
0.8 7 2.6 17 0.5 7 2.5 21 12.7 21 58.5 21 0.9 7 2.5 14 0.8 4 2.4 18 12.0 12
2.2 5 3.4 85 1.4 18 3.7 89 12.2 89 80.8 85 2.0 3 3.6 77 1.5 14 3.9 79 12.0 74
2.0 2 3.5 18 2.4 7 4.2 20 11.7 20 80.6 19 0.0 1 3.7 18 2.4 6 4.2 19 11.7 19
- - 2.9 13 1.6 4 3.3 13 12.2 13 67.4 13 2.0 1 3.5 11 1.8 2 4.0 11 11.5 11
4.0 1 3.8 45 0.3 6 3.9 46 12.2 46 89.9 44 4.0 1 3.8 40 0.3 5 3.8 41 12.1 39
1.5 2 1.9 8 0.0 1 2.0 9 13.3 9 55.0 8 - - 3.1 7 2.0 1 3.4 7 15.0 4
1.0 3 3.2 8 1.5 2 3.5 9 12.0 9 48.5 8 3.0 1 3.6 6 2.0 2 3.6 8 13.5 8
* * * * * * * * * * * * * * * * * * * * * *
1.5 2 3.5 5 - - 3.4 6 12.0 6 46.3 6 3.0 1 3.5 5 2.0 1 3.8 6 14.0 6
0.0 3 2.9 39 0.4 8 3.0 39 12.5 39 78.7 37 - - 3.5 32 0.5 2 3.5 32 12.9 29
0.0 1 2.2 9 0.4 3 2.3 9 12.1 9 62.2 9 - - 3.2 8 0.5 1 3.3 8 15.1 8
- - 3.3 10 0.8 2 3.4 10 13.2 10 97.2 9 - - 3.7 10 0.5 1 3.8 10 12.0 8
0.0 2 3.0 20 0.2 3 3.0 20 12.3 20 77.7 19 - - 3.5 14 - - 3.5 14 12.1 13
* * * * * * * * * * * * * * * * * * * * * *
0.8 19 3.3 241 0.6 56 3.4 246 12.8 246 86.2 240 2.0 10 3.5 217 0.7 42 3.6 224 12.4 221
1.0 2 3.5 36 0.6 13 3.7 37 12.3 37 90.7 37 1.5 2 3.6 35 0.7 12 3.8 36 12.0 35
0.0 5 2.9 40 0.4 13 3.0 40 13.6 40 67.5 39 - - 3.6 31 0.6 6 3.7 31 13.1 29
- - 3.4 16 0.7 6 3.7 16 14.1 16 79.0 14 3.0 1 3.4 13 0.5 5 3.5 14 12.4 14
0.0 1 3.6 25 1.2 3 3.8 25 12.2 25 93.3 25 - - 3.5 23 1.2 3 3.7 23 12.0 24
- - 3.1 7 - - 3.1 7 12.0 7 93.6 7 - - 3.3 7 - - 3.3 7 11.5 6
0.0 1 3.3 9 0.0 1 3.3 9 13.2 9 84.3 9 - - 3.5 8 - - 3.5 8 12.9 9
- - 2.6 15 0.1 1 2.6 15 12.2 15 87.7 15 - - 3.2 14 1.1 2 3.1 15 12.8 15
- - 2.9 8 - - 2.9 8 11.4 8 85.8 8 3.0 1 3.3 7 - - 3.3 8 13.4 8
- - 3.0 5 1.0 1 3.2 5 12.6 5 80.3 4 - - 2.9 5 1.0 1 3.1 5 12.6 5
1.8 2 3.2 9 0.1 2 3.3 10 13.0 10 93.0 9 3.0 1 3.6 8 0.5 1 3.6 9 12.3 9
1.1 8 3.5 71 0.6 16 3.6 74 12.7 74 91.8 73 1.5 5 3.5 66 0.6 12 3.6 68 12.2 67
- - 3.5 17 1.4 5 3.9 17 12.5 17 88.5 16 - - 3.3 15 0.8 2 3.4 15 12.0 13
2.1 17 3.0 19 0.3 6 3.7 26 13.4 26 71.3 24 1.4 12 3.2 18 0.5 5 3.5 22 12.4 18
3.0 1 3.3 12 0.9 3 3.5 13 12.4 13 92.8 13 3.0 1 3.5 12 0.8 3 3.7 13 12.3 13
1.0 2 2.8 17 0.8 5 3.0 18 12.8 18 81.0 17 1.0 2 2.9 17 1.0 5 3.2 18 13.0 18
1.5 2 3.2 23 0.4 8 3.3 24 14.2 24 69.3 19 - - 3.5 16 0.7 5 3.7 16 12.0 16
1.5 2 2.2 18 0.0 2 2.2 19 16.6 19 55.0 18 3.0 3 3.2 14 1.5 3 3.4 17 12.8 15
3.0 1 1.5 5 0.0 1 1.8 6 14.7 6 38.0 5 3.0 1 3.7 4 2.0 1 4.0 5 14.4 5
0.0 1 2.5 13 0.0 1 2.5 13 17.5 13 61.5 13 3.0 2 3.0 10 1.3 2 3.2 12 12.0 10
2.0 5 3.4 15 1.0 4 3.8 17 12.0 17 92.6 16 2.3 3 3.3 15 1.0 3 4.0 15 12.0 15
1.8 2 3.0 25 1.5 7 3.4 26 12.1 26 79.0 26 3.5 1 3.5 23 0.5 2 3.5 24 12.1 22
* * * * * * * * * * * * * * * * * * * * * *
* * * * * * * * * * * * * * * * * * * * * *
1.4 82 3.2 631 0.8 160 3.4 666 12.8 666 80.9 636 1.7 52 3.5 559 0.9 117 3.6 590 12.3 558

WorldatWork 2003-04 Salary Budget Survey 47
2003 Actual Increases 2004 Projected Increases
EXEMPT SALARIED EMPLOYEES
GENERALINCREASE/
COLA
MERITINCREASE
OTHERINCREASE
TOTALINCREASE
MONTHSBETWEEN
INCREASES
% OF EERECEIVINGINCREASE IN 2003
% n % n % n % n Mo. n % n
GENERALINCREASE/
COLA
MERITINCREASE
OTHERINCREASE
TOTALINCREASE
MONTHSBETWEEN
INCREASES
% n % n % n % n Mo. n
INDUSTRY
West
ern
Reg
ion
U
.S.
* Fewer than five survey respondents ** Total line reflects all data submitted – No DataMining = Industry Group
Metal Mfg = Industry Subgroup
Key:
Accommodation & Food Services
Administrative Support & Waste Mgmt.
Agriculture, Forestry, Fishing & Hunting
Arts, Entertainment & Recreation
Construction
Consulting, Prof., Scientific & Tech. Svcs.
Educational Services
Finance & Insurance
Credit Intermediation & Related Act.
Funds, Trusts & Other Financial Vehicles
Insurance Carriers & Related Act.
Securities, Commodities & Other Investments
Health Care & Social Assistance
Hospitals
Nursing, Ambulatory & Residential Care
Information
Internet Industries
Publishing Industries
Motion Picture, Sound Recording, Broadcasting
Mgmt of Companies & Enterprises
Manufacturing
Chemical Mfg.
Computer & Electronic Product Mfg.
Electrical Equip., Appliance & Component Mfg.
Food, Beverage & Tobacco Product Mfg.
Machinery Mfg.
Metal Mfg.
Paper Mfg., Printing & Related Act.
Plastics & Rubber Products Mfg.
Textile, Apparel, Leather & Allied Product Mfg.
Transportation Equipment Mfg.
Other Misc. Mfg.
Mining
Public Administration
Real Estate, Rental & Leasing
Retail Trade
Telecommunications
Transportation
Air Transportation
All Other Transportation
Utilities
Wholesale Trade
Other Services (except Public Admin.)
Religious, Grantmaking, Civic, Prof. & Similar Org.
Total
- - 3.4 13 0.5 2 3.5 13 12.5 13 89.1 12 - - 3.2 12 0.5 2 3.3 12 11.7 12
1.6 4 3.0 18 0.0 1 3.2 19 13.1 19 79.3 18 0.0 3 3.8 16 - - 3.6 17 13.1 17
3.0 1 2.7 7 - - 2.8 8 13.5 8 85.2 8 4.0 1 3.4 5 - - 3.5 6 12.0 7
2.7 2 3.7 13 0.9 2 3.9 14 12.1 14 83.6 13 3.0 1 3.5 13 0.9 2 3.8 13 12.2 11
0.0 1 3.6 15 0.7 4 3.7 15 13.6 15 92.5 13 0.0 1 3.6 12 0.5 2 3.7 12 12.0 14
0.8 14 3.6 121 0.8 44 3.8 124 13.2 124 83.2 117 1.0 12 3.7 106 0.8 36 4.0 108 12.4 104
1.0 7 2.8 22 0.9 9 3.0 25 13.1 25 60.3 25 1.1 6 2.3 18 0.8 5 2.5 21 12.0 15
1.5 9 3.5 144 1.1 29 3.7 149 12.2 149 83.8 139 1.8 5 3.7 128 1.2 25 3.9 131 12.1 124
1.6 4 3.5 29 1.9 9 3.9 32 12.0 32 85.5 30 1.5 2 3.6 28 2.2 8 4.1 30 12.0 29
0.0 1 3.5 30 1.2 4 3.7 30 11.9 30 75.8 28 1.0 2 3.7 27 1.3 4 3.9 27 11.7 27
4.0 1 3.8 70 0.8 13 3.9 71 12.1 71 91.4 66 4.0 1 3.8 59 0.6 11 3.9 60 12.1 58
1.0 3 2.4 13 0.4 3 2.6 14 13.3 14 61.0 13 - - 3.5 12 1.1 2 3.7 12 14.3 8
2.3 16 3.4 51 2.1 17 4.1 60 12.2 60 83.3 57 2.4 11 3.6 42 2.4 13 4.2 49 12.2 52
2.4 10 3.6 30 2.0 14 4.3 37 12.1 37 87.0 35 2.2 6 3.5 25 2.5 11 4.3 30 12.0 30
2.0 6 3.3 21 2.3 3 3.8 23 12.3 23 77.5 22 2.5 5 3.6 17 2.0 2 4.1 19 12.5 22
0.4 7 3.2 85 0.6 23 3.4 87 13.2 87 75.3 82 1.5 2 3.4 73 0.8 16 3.6 74 12.8 70
1.0 3 2.9 23 0.8 6 3.1 24 13.7 24 70.1 24 3.0 1 3.3 20 1.0 4 3.6 20 13.2 21
0.0 1 3.6 19 0.6 5 3.7 19 13.6 19 94.8 17 0.0 1 3.7 18 0.7 5 3.9 18 12.0 16
0.0 3 3.3 43 0.5 12 3.3 44 12.8 44 70.4 41 - - 3.4 35 0.7 7 3.4 36 12.9 33
* * * * * * * * * * * * * * * * * * * * * *
1.0 39 3.2 391 0.6 103 3.4 398 12.9 398 81.2 385 2.1 21 3.6 331 0.8 71 3.7 346 12.4 344
1.7 3 3.6 48 0.6 18 3.9 49 12.2 49 87.9 49 1.5 2 3.7 47 0.7 15 3.8 48 12.0 45
0.0 9 2.7 95 0.6 31 2.9 96 13.5 96 64.3 94 2.2 3 3.6 72 0.6 16 3.6 76 12.9 74
0.0 3 3.2 29 0.8 11 3.5 29 14.2 29 80.1 28 1.5 2 3.6 25 0.8 8 3.8 26 12.2 28
0.0 1 3.7 37 0.7 5 3.8 37 12.2 37 93.8 37 - - 3.6 33 1.2 3 3.7 33 12.1 33
- - 2.4 12 0.0 1 2.4 12 12.5 12 70.4 12 - - 2.9 10 0.0 1 2.9 10 11.7 10
0.5 2 3.1 15 0.5 2 3.2 15 12.9 15 83.0 15 3.0 2 3.5 12 1.0 1 3.5 14 12.5 15
0.0 1 2.5 21 0.4 2 2.5 21 12.4 21 78.3 21 - - 3.3 20 1.6 2 3.3 21 13.8 20
3.5 2 3.0 11 0.8 2 3.2 13 11.6 13 87.5 13 3.0 2 3.5 10 0.8 2 3.5 12 12.9 12
- - 3.0 6 1.0 1 3.2 6 12.5 6 92.3 4 - - 3.0 6 1.0 1 3.1 6 12.5 6
0.0 1 3.5 14 0.1 2 3.5 14 13.4 14 91.2 13 - - 3.8 13 0.8 2 3.9 13 12.5 13
1.4 17 3.5 103 0.5 28 3.7 106 12.7 106 88.5 99 2.0 10 3.6 83 1.1 20 3.9 87 12.2 88
- - 3.5 19 1.3 5 3.9 19 12.5 19 86.6 18 - - 3.3 17 0.8 3 3.5 17 12.0 15
1.6 19 3.2 32 1.3 9 3.4 42 13.1 42 67.7 40 1.1 13 3.5 28 1.7 8 3.6 35 13.9 29
3.3 2 3.3 21 0.7 6 3.7 22 14.2 22 90.2 21 3.3 2 3.4 19 0.5 5 3.7 20 12.4 20
1.3 4 3.1 59 2.0 10 3.3 62 13.0 62 83.9 59 1.0 2 3.4 52 1.5 8 3.6 54 12.8 51
1.0 12 2.7 55 0.5 16 2.9 58 13.7 58 66.7 51 1.3 5 3.4 44 0.6 9 3.6 45 12.0 44
1.6 7 2.3 40 0.8 9 2.8 40 15.1 40 63.3 40 2.3 6 3.0 31 1.0 8 3.3 35 12.8 33
0.8 4 1.0 11 0.3 3 1.4 11 15.4 11 35.1 11 2.3 2 3.2 8 1.5 2 3.3 10 14.0 9
2.7 3 2.8 29 1.0 6 3.3 29 15.0 29 74.0 29 2.3 4 3.0 23 0.9 6 3.3 25 12.4 24
1.9 7 3.5 26 0.6 8 3.8 29 12.0 29 94.7 28 2.5 4 3.3 24 0.7 5 3.7 25 12.0 26
1.9 5 3.2 48 1.1 8 3.4 51 12.5 51 81.5 50 3.3 3 3.6 45 1.6 4 3.7 48 12.1 46
1.5 4 2.3 10 0.5 2 2.3 13 12.9 13 52.4 13 2.0 3 2.3 9 2.0 2 2.6 12 13.0 12
0.0 2 2.4 8 0.5 2 2.2 9 12.0 9 44.1 9 1.5 2 2.6 7 2.0 2 2.8 9 13.3 9
1.4 162 3.2 1193 0.9 308 3.5 1252 12.9 1252 79.8 1193 1.8 102 3.5 1027 1.0 224 3.7 1083 12.4 1050
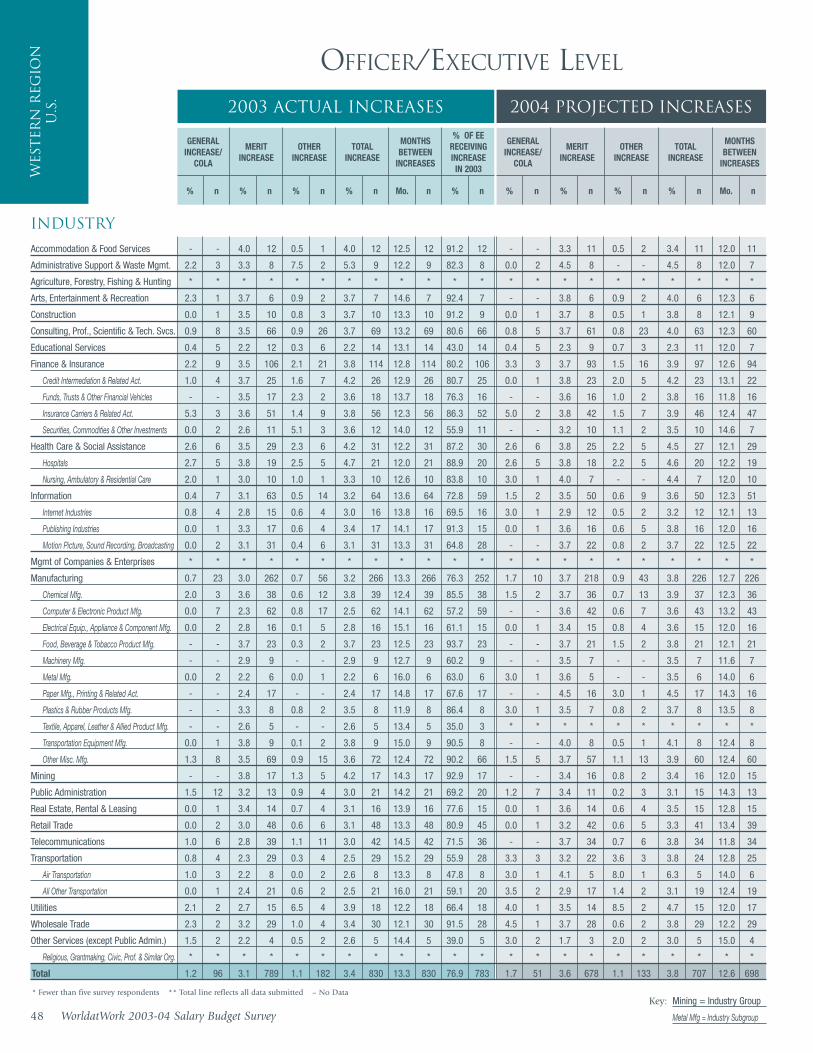
Wes
ter
n R
egio
n
U.S
.
2003 Actual Increases 2004 Projected Increases
OFFICER/EXECUTIVE LEVEL
INDUSTRY
48 WorldatWork 2003-04 Salary Budget SurveyMining = Industry Group
Metal Mfg = Industry Subgroup
GENERALINCREASE/
COLA
MERITINCREASE
OTHERINCREASE
TOTALINCREASE
MONTHSBETWEEN
INCREASES
% OF EERECEIVINGINCREASE IN 2003
% n % n % n % n Mo. n % n
GENERALINCREASE/
COLA
MERITINCREASE
OTHERINCREASE
TOTALINCREASE
MONTHSBETWEEN
INCREASES
% n % n % n % n Mo. n
Accommodation & Food Services
Administrative Support & Waste Mgmt.
Agriculture, Forestry, Fishing & Hunting
Arts, Entertainment & Recreation
Construction
Consulting, Prof., Scientific & Tech. Svcs.
Educational Services
Finance & Insurance
Credit Intermediation & Related Act.
Funds, Trusts & Other Financial Vehicles
Insurance Carriers & Related Act.
Securities, Commodities & Other Investments
Health Care & Social Assistance
Hospitals
Nursing, Ambulatory & Residential Care
Information
Internet Industries
Publishing Industries
Motion Picture, Sound Recording, Broadcasting
Mgmt of Companies & Enterprises
Manufacturing
Chemical Mfg.
Computer & Electronic Product Mfg.
Electrical Equip., Appliance & Component Mfg.
Food, Beverage & Tobacco Product Mfg.
Machinery Mfg.
Metal Mfg.
Paper Mfg., Printing & Related Act.
Plastics & Rubber Products Mfg.
Textile, Apparel, Leather & Allied Product Mfg.
Transportation Equipment Mfg.
Other Misc. Mfg.
Mining
Public Administration
Real Estate, Rental & Leasing
Retail Trade
Telecommunications
Transportation
Air Transportation
All Other Transportation
Utilities
Wholesale Trade
Other Services (except Public Admin.)
Religious, Grantmaking, Civic, Prof. & Similar Org.
Total
* Fewer than five survey respondents ** Total line reflects all data submitted – No DataKey:
- - 4.0 12 0.5 1 4.0 12 12.5 12 91.2 12 - - 3.3 11 0.5 2 3.4 11 12.0 11
2.2 3 3.3 8 7.5 2 5.3 9 12.2 9 82.3 8 0.0 2 4.5 8 - - 4.5 8 12.0 7
* * * * * * * * * * * * * * * * * * * * * *
2.3 1 3.7 6 0.9 2 3.7 7 14.6 7 92.4 7 - - 3.8 6 0.9 2 4.0 6 12.3 6
0.0 1 3.5 10 0.8 3 3.7 10 13.3 10 91.2 9 0.0 1 3.7 8 0.5 1 3.8 8 12.1 9
0.9 8 3.5 66 0.9 26 3.7 69 13.2 69 80.6 66 0.8 5 3.7 61 0.8 23 4.0 63 12.3 60
0.4 5 2.2 12 0.3 6 2.2 14 13.1 14 43.0 14 0.4 5 2.3 9 0.7 3 2.3 11 12.0 7
2.2 9 3.5 106 2.1 21 3.8 114 12.8 114 80.2 106 3.3 3 3.7 93 1.5 16 3.9 97 12.6 94
1.0 4 3.7 25 1.6 7 4.2 26 12.9 26 80.7 25 0.0 1 3.8 23 2.0 5 4.2 23 13.1 22
- - 3.5 17 2.3 2 3.6 18 13.7 18 76.3 16 - - 3.6 16 1.0 2 3.8 16 11.8 16
5.3 3 3.6 51 1.4 9 3.8 56 12.3 56 86.3 52 5.0 2 3.8 42 1.5 7 3.9 46 12.4 47
0.0 2 2.6 11 5.1 3 3.6 12 14.0 12 55.9 11 - - 3.2 10 1.1 2 3.5 10 14.6 7
2.6 6 3.5 29 2.3 6 4.2 31 12.2 31 87.2 30 2.6 6 3.8 25 2.2 5 4.5 27 12.1 29
2.7 5 3.8 19 2.5 5 4.7 21 12.0 21 88.9 20 2.6 5 3.8 18 2.2 5 4.6 20 12.2 19
2.0 1 3.0 10 1.0 1 3.3 10 12.6 10 83.8 10 3.0 1 4.0 7 - - 4.4 7 12.0 10
0.4 7 3.1 63 0.5 14 3.2 64 13.6 64 72.8 59 1.5 2 3.5 50 0.6 9 3.6 50 12.3 51
0.8 4 2.8 15 0.6 4 3.0 16 13.8 16 69.5 16 3.0 1 2.9 12 0.5 2 3.2 12 12.1 13
0.0 1 3.3 17 0.6 4 3.4 17 14.1 17 91.3 15 0.0 1 3.6 16 0.6 5 3.8 16 12.0 16
0.0 2 3.1 31 0.4 6 3.1 31 13.3 31 64.8 28 - - 3.7 22 0.8 2 3.7 22 12.5 22
* * * * * * * * * * * * * * * * * * * * * *
0.7 23 3.0 262 0.7 56 3.2 266 13.3 266 76.3 252 1.7 10 3.7 218 0.9 43 3.8 226 12.7 226
2.0 3 3.6 38 0.6 12 3.8 39 12.4 39 85.5 38 1.5 2 3.7 36 0.7 13 3.9 37 12.3 36
0.0 7 2.3 62 0.8 17 2.5 62 14.1 62 57.2 59 - - 3.6 42 0.6 7 3.6 43 13.2 43
0.0 2 2.8 16 0.1 5 2.8 16 15.1 16 61.1 15 0.0 1 3.4 15 0.8 4 3.6 15 12.0 16
- - 3.7 23 0.3 2 3.7 23 12.5 23 93.7 23 - - 3.7 21 1.5 2 3.8 21 12.1 21
- - 2.9 9 - - 2.9 9 12.7 9 60.2 9 - - 3.5 7 - - 3.5 7 11.6 7
0.0 2 2.2 6 0.0 1 2.2 6 16.0 6 63.0 6 3.0 1 3.6 5 - - 3.5 6 14.0 6
- - 2.4 17 - - 2.4 17 14.8 17 67.6 17 - - 4.5 16 3.0 1 4.5 17 14.3 16
- - 3.3 8 0.8 2 3.5 8 11.9 8 86.4 8 3.0 1 3.5 7 0.8 2 3.7 8 13.5 8
- - 2.6 5 - - 2.6 5 13.4 5 35.0 3 * * * * * * * * * *
0.0 1 3.8 9 0.1 2 3.8 9 15.0 9 90.5 8 - - 4.0 8 0.5 1 4.1 8 12.4 8
1.3 8 3.5 69 0.9 15 3.6 72 12.4 72 90.2 66 1.5 5 3.7 57 1.1 13 3.9 60 12.4 60
- - 3.8 17 1.3 5 4.2 17 14.3 17 92.9 17 - - 3.4 16 0.8 2 3.4 16 12.0 15
1.5 12 3.2 13 0.9 4 3.0 21 14.2 21 69.2 20 1.2 7 3.4 11 0.2 3 3.1 15 14.3 13
0.0 1 3.4 14 0.7 4 3.1 16 13.9 16 77.6 15 0.0 1 3.6 14 0.6 4 3.5 15 12.8 15
0.0 2 3.0 48 0.6 6 3.1 48 13.3 48 80.9 45 0.0 1 3.2 42 0.6 5 3.3 41 13.4 39
1.0 6 2.8 39 1.1 11 3.0 42 14.5 42 71.5 36 - - 3.7 34 0.7 6 3.8 34 11.8 34
0.8 4 2.3 29 0.3 4 2.5 29 15.2 29 55.9 28 3.3 3 3.2 22 3.6 3 3.8 24 12.8 25
1.0 3 2.2 8 0.0 2 2.6 8 13.3 8 47.8 8 3.0 1 4.1 5 8.0 1 6.3 5 14.0 6
0.0 1 2.4 21 0.6 2 2.5 21 16.0 21 59.1 20 3.5 2 2.9 17 1.4 2 3.1 19 12.4 19
2.1 2 2.7 15 6.5 4 3.9 18 12.2 18 66.4 18 4.0 1 3.5 14 8.5 2 4.7 15 12.0 17
2.3 2 3.2 29 1.0 4 3.4 30 12.1 30 91.5 28 4.5 1 3.7 28 0.6 2 3.8 29 12.2 29
1.5 2 2.2 4 0.5 2 2.6 5 14.4 5 39.0 5 3.0 2 1.7 3 2.0 2 3.0 5 15.0 4
* * * * * * * * * * * * * * * * * * * * * *
1.2 96 3.1 789 1.1 182 3.4 830 13.3 830 76.9 783 1.7 51 3.6 678 1.1 133 3.8 707 12.6 698
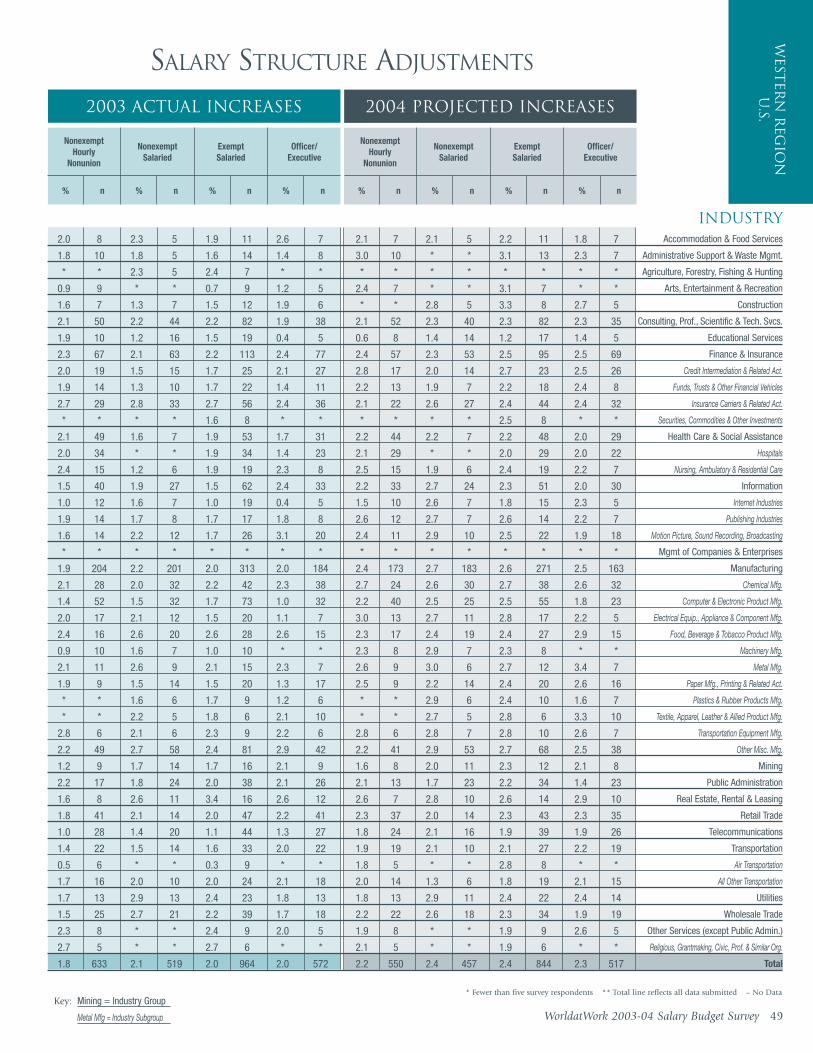
INDUSTRY
West
ern
Reg
ion
U
.S.2003 Actual Increases
SALARY STRUCTURE ADJUSTMENTS
NonexemptHourly
Nonunion
NonexemptSalaried
ExemptSalaried
Officer/Executive
% n % n % n % n
2004 Projected Increases
NonexemptHourly
Nonunion
NonexemptSalaried
ExemptSalaried
Officer/Executive
% n % n % n % n
Accommodation & Food Services
Administrative Support & Waste Mgmt.
Agriculture, Forestry, Fishing & Hunting
Arts, Entertainment & Recreation
Construction
Consulting, Prof., Scientific & Tech. Svcs.
Educational Services
Finance & Insurance
Credit Intermediation & Related Act.
Funds, Trusts & Other Financial Vehicles
Insurance Carriers & Related Act.
Securities, Commodities & Other Investments
Health Care & Social Assistance
Hospitals
Nursing, Ambulatory & Residential Care
Information
Internet Industries
Publishing Industries
Motion Picture, Sound Recording, Broadcasting
Mgmt of Companies & Enterprises
Manufacturing
Chemical Mfg.
Computer & Electronic Product Mfg.
Electrical Equip., Appliance & Component Mfg.
Food, Beverage & Tobacco Product Mfg.
Machinery Mfg.
Metal Mfg.
Paper Mfg., Printing & Related Act.
Plastics & Rubber Products Mfg.
Textile, Apparel, Leather & Allied Product Mfg.
Transportation Equipment Mfg.
Other Misc. Mfg.
Mining
Public Administration
Real Estate, Rental & Leasing
Retail Trade
Telecommunications
Transportation
Air Transportation
All Other Transportation
Utilities
Wholesale Trade
Other Services (except Public Admin.)
Religious, Grantmaking, Civic, Prof. & Similar Org.
Total
2.0 8 2.3 5 1.9 11 2.6 7 2.1 7 2.1 5 2.2 11 1.8 7
1.8 10 1.8 5 1.6 14 1.4 8 3.0 10 * * 3.1 13 2.3 7
* * 2.3 5 2.4 7 * * * * * * * * * *
0.9 9 * * 0.7 9 1.2 5 2.4 7 * * 3.1 7 * *
1.6 7 1.3 7 1.5 12 1.9 6 * * 2.8 5 3.3 8 2.7 5
2.1 50 2.2 44 2.2 82 1.9 38 2.1 52 2.3 40 2.3 82 2.3 35
1.9 10 1.2 16 1.5 19 0.4 5 0.6 8 1.4 14 1.2 17 1.4 5
2.3 67 2.1 63 2.2 113 2.4 77 2.4 57 2.3 53 2.5 95 2.5 69
2.0 19 1.5 15 1.7 25 2.1 27 2.8 17 2.0 14 2.7 23 2.5 26
1.9 14 1.3 10 1.7 22 1.4 11 2.2 13 1.9 7 2.2 18 2.4 8
2.7 29 2.8 33 2.7 56 2.4 36 2.1 22 2.6 27 2.4 44 2.4 32
* * * * 1.6 8 * * * * * * 2.5 8 * *
2.1 49 1.6 7 1.9 53 1.7 31 2.2 44 2.2 7 2.2 48 2.0 29
2.0 34 * * 1.9 34 1.4 23 2.1 29 * * 2.0 29 2.0 22
2.4 15 1.2 6 1.9 19 2.3 8 2.5 15 1.9 6 2.4 19 2.2 7
1.5 40 1.9 27 1.5 62 2.4 33 2.2 33 2.7 24 2.3 51 2.0 30
1.0 12 1.6 7 1.0 19 0.4 5 1.5 10 2.6 7 1.8 15 2.3 5
1.9 14 1.7 8 1.7 17 1.8 8 2.6 12 2.7 7 2.6 14 2.2 7
1.6 14 2.2 12 1.7 26 3.1 20 2.4 11 2.9 10 2.5 22 1.9 18
* * * * * * * * * * * * * * * *
1.9 204 2.2 201 2.0 313 2.0 184 2.4 173 2.7 183 2.6 271 2.5 163
2.1 28 2.0 32 2.2 42 2.3 38 2.7 24 2.6 30 2.7 38 2.6 32
1.4 52 1.5 32 1.7 73 1.0 32 2.2 40 2.5 25 2.5 55 1.8 23
2.0 17 2.1 12 1.5 20 1.1 7 3.0 13 2.7 11 2.8 17 2.2 5
2.4 16 2.6 20 2.6 28 2.6 15 2.3 17 2.4 19 2.4 27 2.9 15
0.9 10 1.6 7 1.0 10 * * 2.3 8 2.9 7 2.3 8 * *
2.1 11 2.6 9 2.1 15 2.3 7 2.6 9 3.0 6 2.7 12 3.4 7
1.9 9 1.5 14 1.5 20 1.3 17 2.5 9 2.2 14 2.4 20 2.6 16
* * 1.6 6 1.7 9 1.2 6 * * 2.9 6 2.4 10 1.6 7
* * 2.2 5 1.8 6 2.1 10 * * 2.7 5 2.8 6 3.3 10
2.8 6 2.1 6 2.3 9 2.2 6 2.8 6 2.8 7 2.8 10 2.6 7
2.2 49 2.7 58 2.4 81 2.9 42 2.2 41 2.9 53 2.7 68 2.5 38
1.2 9 1.7 14 1.7 16 2.1 9 1.6 8 2.0 11 2.3 12 2.1 8
2.2 17 1.8 24 2.0 38 2.1 26 2.1 13 1.7 23 2.2 34 1.4 23
1.6 8 2.6 11 3.4 16 2.6 12 2.6 7 2.8 10 2.6 14 2.9 10
1.8 41 2.1 14 2.0 47 2.2 41 2.3 37 2.0 14 2.3 43 2.3 35
1.0 28 1.4 20 1.1 44 1.3 27 1.8 24 2.1 16 1.9 39 1.9 26
1.4 22 1.5 14 1.6 33 2.0 22 1.9 19 2.1 10 2.1 27 2.2 19
0.5 6 * * 0.3 9 * * 1.8 5 * * 2.8 8 * *
1.7 16 2.0 10 2.0 24 2.1 18 2.0 14 1.3 6 1.8 19 2.1 15
1.7 13 2.9 13 2.4 23 1.8 13 1.8 13 2.9 11 2.4 22 2.4 14
1.5 25 2.7 21 2.2 39 1.7 18 2.2 22 2.6 18 2.3 34 1.9 19
2.3 8 * * 2.4 9 2.0 5 1.9 8 * * 1.9 9 2.6 5
2.7 5 * * 2.7 6 * * 2.1 5 * * 1.9 6 * *
1.8 633 2.1 519 2.0 964 2.0 572 2.2 550 2.4 457 2.4 844 2.3 517
WorldatWork 2003-04 Salary Budget Survey 49
* Fewer than five survey respondents ** Total line reflects all data submitted – No DataMining = Industry Group
Metal Mfg = Industry Subgroup
Key:

INDUSTRY
Nat
ion
al
Data
U.S
. As a Percentage of Total Base Salaries
BUDGETED PROMOTIONAL INCREASES FOR 2002
National(U.S.)
Mean % Median % n
Accommodation & Food Services
Administrative Support & Waste Mgmt.
Agriculture, Forestry, Fishing & Hunting
Arts, Entertainment & Recreation
Construction
Consulting, Prof., Scientific & Tech. Svcs.
Educational Services
Finance & Insurance
Credit Intermediation & Related Act.
Funds, Trusts & Other Financial Vehicles
Insurance Carriers & Related Act.
Securities, Commodities & Other Investments
Health Care & Social Assistance
Hospitals
Nursing, Ambulatory & Residential Care
Information
Internet Industries
Publishing Industries
Motion Picture, Sound Recording, Broadcasting
Mgmt of Companies & Enterprises
Manufacturing
Chemical Mfg.
Computer & Electronic Product Mfg.
Electrical Equip., Appliance & Component Mfg.
Food, Beverage & Tobacco Product Mfg.
Machinery Mfg.
Metal Mfg.
Paper Mfg., Printing & Related Act.
Plastics & Rubber Products Mfg.
Textile, Apparel, Leather & Allied Product Mfg.
Transportation Equipment Mfg.
Other Misc. Mfg.
Mining
Public Administration
Real Estate, Rental & Leasing
Retail Trade
Telecommunications
Transportation
Air Transportation
All Other Transportation
Utilities
Wholesale Trade
Other Services (except Public Admin.)
Religious, Grantmaking, Civic, Prof. & Similar Org.
Total
* * * * * * * * * * * * * * *
1.3 0.8 10 * * * * * * * * * 0.9 0.8 6
* * * * * * * * * * * * * * *
4.8 1.3 7 * * * * * * * * * 4.5 1.3 5
1.7 0.5 6 1.8 0.5 5 * * * 2.0 0.5 5 * * *
2.8 1.0 79 2.6 1.0 47 2.8 1.0 35 2.7 1.0 39 2.3 0.9 47
2.3 1.0 14 1.3 1.0 9 * * * * * * * * *
2.5 1.0 125 1.6 0.8 60 2.0 1.0 61 3.0 1.0 44 2.3 1.0 44
2.5 1.0 24 1.3 0.9 10 1.5 0.5 14 3.2 1.0 15 1.7 0.5 9
2.8 1.0 25 2.1 0.5 14 1.7 1.0 5 3.7 1.0 5 3.7 1.2 7
2.3 1.0 55 1.5 0.9 26 2.3 1.0 33 1.8 1.0 17 2.5 1.0 20
1.6 1.0 15 1.2 0.8 8 1.5 1.3 8 * * * 1.1 1.0 6
2.3 1.0 19 1.6 1.0 9 1.4 0.8 6 3.3 4.0 6 4.3 5.0 5
2.0 1.0 15 1.8 0.8 7 1.6 1.0 5 3.3 4.0 6 * * *
* * * * * * * * * * * * * * *
2.5 1.0 51 2.0 1.0 29 2.9 1.0 22 2.5 1.0 16 2.0 1.0 23
1.0 1.0 11 * * * 0.6 0.5 5 * * * 1.1 1.0 9
3.9 1.8 14 3.6 1.2 9 5.0 3.5 8 * * * * * *
2.3 1.0 26 1.5 1.0 16 2.4 1.0 9 1.9 1.0 11 2.6 1.2 10
3.3 1.0 5 * * * * * * * * * * * *
2.2 1.0 229 1.6 0.6 129 2.2 0.8 125 2.3 1.0 117 1.3 0.7 108
1.2 1.0 39 1.3 0.9 26 1.6 1.0 21 1.5 1.0 24 1.6 1.0 19
0.8 0.5 49 0.7 0.5 27 0.6 0.5 22 0.9 0.5 25 0.7 0.5 35
1.6 0.5 10 1.6 0.5 10 1.8 0.5 8 2.0 0.5 7 1.8 0.5 8
1.9 0.8 10 2.2 0.7 8 1.5 0.6 7 1.6 0.6 7 0.6 0.5 5
3.3 0.5 11 * * * 4.4 3.3 8 * * * * * *
2.9 1.0 20 1.3 0.5 5 3.1 1.0 7 2.7 1.3 8 * * *
8.9 6.0 7 * * * 4.1 3.0 5 9.3 3.0 5 * * *
4.3 3.0 10 * * * 4.3 5.0 7 * * * * * *
* * * * * * * * * * * * * * *
1.6 1.0 10 2.3 1.0 5 1.3 0.9 8 * * * * * *
2.4 1.0 60 2.0 0.5 36 2.5 1.0 32 2.4 1.0 29 1.3 0.7 26
1.9 0.8 5 * * * * * * 1.9 0.8 5 * * *
4.1 1.0 20 3.9 0.8 5 4.6 0.9 6 4.2 0.8 7 1.0 0.5 9
2.4 0.9 9 2.0 0.9 6 * * * 1.9 0.7 6 2.6 1.0 8
3.4 2.0 21 3.0 2.0 11 2.8 1.5 15 2.9 2.0 12 2.8 2.0 9
1.1 0.5 22 1.3 0.7 16 0.9 1.0 9 0.8 0.8 11 0.6 0.5 13
2.2 1.0 8 * * * 2.3 1.0 6 * * * * * *
* * * * * * * * * * * * * * *
1.8 1.0 7 * * * 1.8 1.0 5 * * * * * *
3.3 1.0 25 2.2 0.6 10 * * * 2.9 1.0 7 4.0 2.9 8
2.6 1.0 20 1.7 0.5 14 2.8 1.0 13 2.5 0.8 14 2.0 1.0 15
3.7 5.0 13 3.4 3.0 8 4.5 5.0 6 * * * * * *
4.2 5.0 11 3.8 5.0 7 5.2 5.0 5 * * * * * *
2.5 1.0 693 2.0 0.9 374 2.4 1.0 331 2.5 1.0 306 1.9 1.0 321
50 WorldatWork 2003-04 Salary Budget SurveyMining = Industry Group
Metal Mfg = Industry Subgroup
* Fewer than five survey respondents ** Total line reflects all data submitted – No DataKey:
Eastern Region
Mean % Median % n
Central Region
Mean % Median % n
Southern Region
Mean % Median % n
Western Region
Mean % Median % n
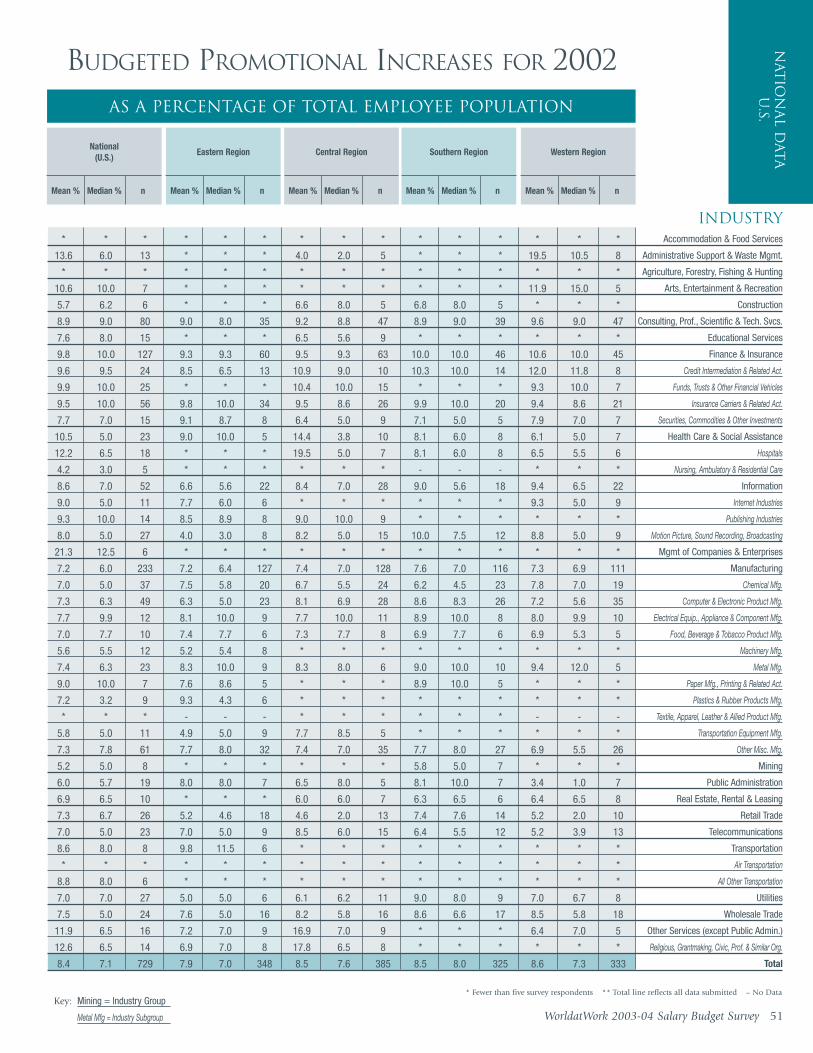
INDUSTRY
Nat
ion
al D
ata
U.S.
BUDGETED PROMOTIONAL INCREASES FOR 2002
WorldatWork 2003-04 Salary Budget Survey 51
* Fewer than five survey respondents ** Total line reflects all data submitted – No DataMining = Industry Group
Metal Mfg = Industry Subgroup
Key:
As a Percentage of Total Employee Population
National(U.S.)
Mean % Median % n
Eastern Region
Mean % Median % n
Central Region
Mean % Median % n
Southern Region
Mean % Median % n
Western Region
Mean % Median % n
Accommodation & Food Services
Administrative Support & Waste Mgmt.
Agriculture, Forestry, Fishing & Hunting
Arts, Entertainment & Recreation
Construction
Consulting, Prof., Scientific & Tech. Svcs.
Educational Services
Finance & Insurance
Credit Intermediation & Related Act.
Funds, Trusts & Other Financial Vehicles
Insurance Carriers & Related Act.
Securities, Commodities & Other Investments
Health Care & Social Assistance
Hospitals
Nursing, Ambulatory & Residential Care
Information
Internet Industries
Publishing Industries
Motion Picture, Sound Recording, Broadcasting
Mgmt of Companies & Enterprises
Manufacturing
Chemical Mfg.
Computer & Electronic Product Mfg.
Electrical Equip., Appliance & Component Mfg.
Food, Beverage & Tobacco Product Mfg.
Machinery Mfg.
Metal Mfg.
Paper Mfg., Printing & Related Act.
Plastics & Rubber Products Mfg.
Textile, Apparel, Leather & Allied Product Mfg.
Transportation Equipment Mfg.
Other Misc. Mfg.
Mining
Public Administration
Real Estate, Rental & Leasing
Retail Trade
Telecommunications
Transportation
Air Transportation
All Other Transportation
Utilities
Wholesale Trade
Other Services (except Public Admin.)
Religious, Grantmaking, Civic, Prof. & Similar Org.
Total
* * * * * * * * * * * * * * *
13.6 6.0 13 * * * 4.0 2.0 5 * * * 19.5 10.5 8
* * * * * * * * * * * * * * *
10.6 10.0 7 * * * * * * * * * 11.9 15.0 5
5.7 6.2 6 * * * 6.6 8.0 5 6.8 8.0 5 * * *
8.9 9.0 80 9.0 8.0 35 9.2 8.8 47 8.9 9.0 39 9.6 9.0 47
7.6 8.0 15 * * * 6.5 5.6 9 * * * * * *
9.8 10.0 127 9.3 9.3 60 9.5 9.3 63 10.0 10.0 46 10.6 10.0 45
9.6 9.5 24 8.5 6.5 13 10.9 9.0 10 10.3 10.0 14 12.0 11.8 8
9.9 10.0 25 * * * 10.4 10.0 15 * * * 9.3 10.0 7
9.5 10.0 56 9.8 10.0 34 9.5 8.6 26 9.9 10.0 20 9.4 8.6 21
7.7 7.0 15 9.1 8.7 8 6.4 5.0 9 7.1 5.0 5 7.9 7.0 7
10.5 5.0 23 9.0 10.0 5 14.4 3.8 10 8.1 6.0 8 6.1 5.0 7
12.2 6.5 18 * * * 19.5 5.0 7 8.1 6.0 8 6.5 5.5 6
4.2 3.0 5 * * * * * * - - - * * *
8.6 7.0 52 6.6 5.6 22 8.4 7.0 28 9.0 5.6 18 9.4 6.5 22
9.0 5.0 11 7.7 6.0 6 * * * * * * 9.3 5.0 9
9.3 10.0 14 8.5 8.9 8 9.0 10.0 9 * * * * * *
8.0 5.0 27 4.0 3.0 8 8.2 5.0 15 10.0 7.5 12 8.8 5.0 9
21.3 12.5 6 * * * * * * * * * * * *
7.2 6.0 233 7.2 6.4 127 7.4 7.0 128 7.6 7.0 116 7.3 6.9 111
7.0 5.0 37 7.5 5.8 20 6.7 5.5 24 6.2 4.5 23 7.8 7.0 19
7.3 6.3 49 6.3 5.0 23 8.1 6.9 28 8.6 8.3 26 7.2 5.6 35
7.7 9.9 12 8.1 10.0 9 7.7 10.0 11 8.9 10.0 8 8.0 9.9 10
7.0 7.7 10 7.4 7.7 6 7.3 7.7 8 6.9 7.7 6 6.9 5.3 5
5.6 5.5 12 5.2 5.4 8 * * * * * * * * *
7.4 6.3 23 8.3 10.0 9 8.3 8.0 6 9.0 10.0 10 9.4 12.0 5
9.0 10.0 7 7.6 8.6 5 * * * 8.9 10.0 5 * * *
7.2 3.2 9 9.3 4.3 6 * * * * * * * * *
* * * - - - * * * * * * - - -
5.8 5.0 11 4.9 5.0 9 7.7 8.5 5 * * * * * *
7.3 7.8 61 7.7 8.0 32 7.4 7.0 35 7.7 8.0 27 6.9 5.5 26
5.2 5.0 8 * * * * * * 5.8 5.0 7 * * *
6.0 5.7 19 8.0 8.0 7 6.5 8.0 5 8.1 10.0 7 3.4 1.0 7
6.9 6.5 10 * * * 6.0 6.0 7 6.3 6.5 6 6.4 6.5 8
7.3 6.7 26 5.2 4.6 18 4.6 2.0 13 7.4 7.6 14 5.2 2.0 10
7.0 5.0 23 7.0 5.0 9 8.5 6.0 15 6.4 5.5 12 5.2 3.9 13
8.6 8.0 8 9.8 11.5 6 * * * * * * * * *
* * * * * * * * * * * * * * *
8.8 8.0 6 * * * * * * * * * * * *
7.0 7.0 27 5.0 5.0 6 6.1 6.2 11 9.0 8.0 9 7.0 6.7 8
7.5 5.0 24 7.6 5.0 16 8.2 5.8 16 8.6 6.6 17 8.5 5.8 18
11.9 6.5 16 7.2 7.0 9 16.9 7.0 9 * * * 6.4 7.0 5
12.6 6.5 14 6.9 7.0 8 17.8 6.5 8 * * * * * *
8.4 7.1 729 7.9 7.0 348 8.5 7.6 385 8.5 8.0 325 8.6 7.3 333
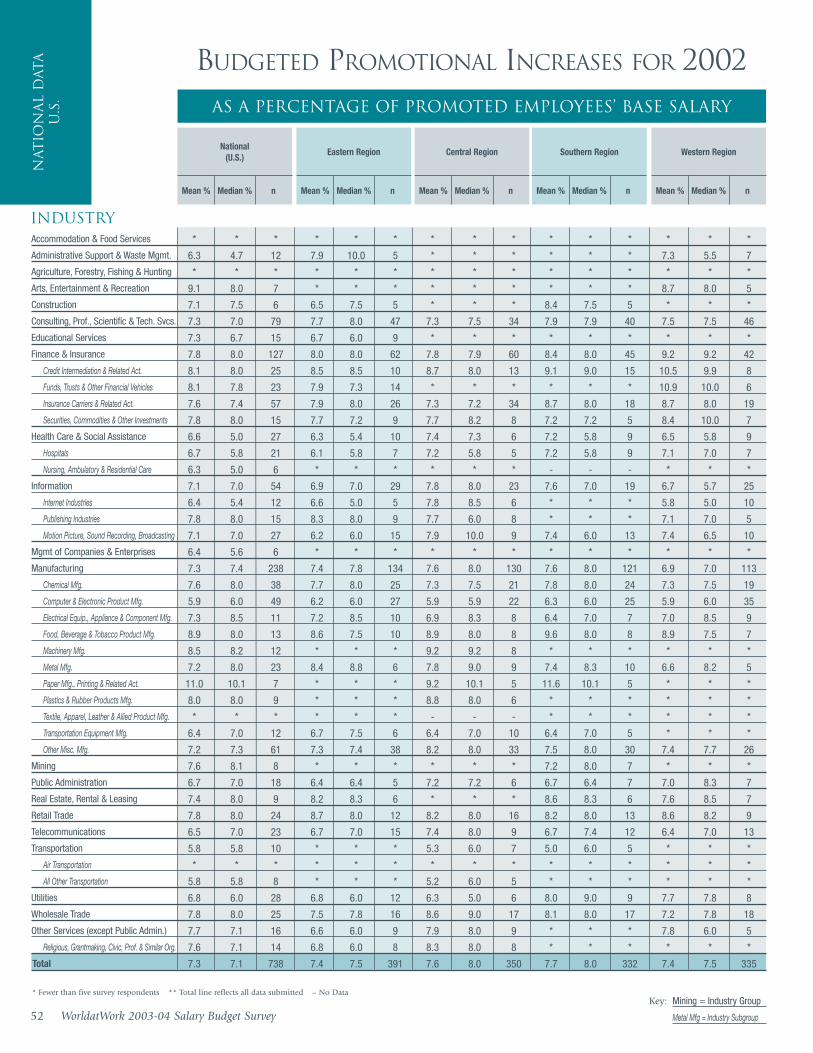
INDUSTRY
Nat
ion
al
Data
U.S
. As a Percentage of Promoted Employees’ Base Salary
BUDGETED PROMOTIONAL INCREASES FOR 2002
National(U.S.)
Mean % Median % n
Accommodation & Food Services
Administrative Support & Waste Mgmt.
Agriculture, Forestry, Fishing & Hunting
Arts, Entertainment & Recreation
Construction
Consulting, Prof., Scientific & Tech. Svcs.
Educational Services
Finance & Insurance
Credit Intermediation & Related Act.
Funds, Trusts & Other Financial Vehicles
Insurance Carriers & Related Act.
Securities, Commodities & Other Investments
Health Care & Social Assistance
Hospitals
Nursing, Ambulatory & Residential Care
Information
Internet Industries
Publishing Industries
Motion Picture, Sound Recording, Broadcasting
Mgmt of Companies & Enterprises
Manufacturing
Chemical Mfg.
Computer & Electronic Product Mfg.
Electrical Equip., Appliance & Component Mfg.
Food, Beverage & Tobacco Product Mfg.
Machinery Mfg.
Metal Mfg.
Paper Mfg., Printing & Related Act.
Plastics & Rubber Products Mfg.
Textile, Apparel, Leather & Allied Product Mfg.
Transportation Equipment Mfg.
Other Misc. Mfg.
Mining
Public Administration
Real Estate, Rental & Leasing
Retail Trade
Telecommunications
Transportation
Air Transportation
All Other Transportation
Utilities
Wholesale Trade
Other Services (except Public Admin.)
Religious, Grantmaking, Civic, Prof. & Similar Org.
Total
* * * * * * * * * * * * * * *
6.3 4.7 12 7.9 10.0 5 * * * * * * 7.3 5.5 7
* * * * * * * * * * * * * * *
9.1 8.0 7 * * * * * * * * * 8.7 8.0 5
7.1 7.5 6 6.5 7.5 5 * * * 8.4 7.5 5 * * *
7.3 7.0 79 7.7 8.0 47 7.3 7.5 34 7.9 7.9 40 7.5 7.5 46
7.3 6.7 15 6.7 6.0 9 * * * * * * * * *
7.8 8.0 127 8.0 8.0 62 7.8 7.9 60 8.4 8.0 45 9.2 9.2 42
8.1 8.0 25 8.5 8.5 10 8.7 8.0 13 9.1 9.0 15 10.5 9.9 8
8.1 7.8 23 7.9 7.3 14 * * * * * * 10.9 10.0 6
7.6 7.4 57 7.9 8.0 26 7.3 7.2 34 8.7 8.0 18 8.7 8.0 19
7.8 8.0 15 7.7 7.2 9 7.7 8.2 8 7.2 7.2 5 8.4 10.0 7
6.6 5.0 27 6.3 5.4 10 7.4 7.3 6 7.2 5.8 9 6.5 5.8 9
6.7 5.8 21 6.1 5.8 7 7.2 5.8 5 7.2 5.8 9 7.1 7.0 7
6.3 5.0 6 * * * * * * - - - * * *
7.1 7.0 54 6.9 7.0 29 7.8 8.0 23 7.6 7.0 19 6.7 5.7 25
6.4 5.4 12 6.6 5.0 5 7.8 8.5 6 * * * 5.8 5.0 10
7.8 8.0 15 8.3 8.0 9 7.7 6.0 8 * * * 7.1 7.0 5
7.1 7.0 27 6.2 6.0 15 7.9 10.0 9 7.4 6.0 13 7.4 6.5 10
6.4 5.6 6 * * * * * * * * * * * *
7.3 7.4 238 7.4 7.8 134 7.6 8.0 130 7.6 8.0 121 6.9 7.0 113
7.6 8.0 38 7.7 8.0 25 7.3 7.5 21 7.8 8.0 24 7.3 7.5 19
5.9 6.0 49 6.2 6.0 27 5.9 5.9 22 6.3 6.0 25 5.9 6.0 35
7.3 8.5 11 7.2 8.5 10 6.9 8.3 8 6.4 7.0 7 7.0 8.5 9
8.9 8.0 13 8.6 7.5 10 8.9 8.0 8 9.6 8.0 8 8.9 7.5 7
8.5 8.2 12 * * * 9.2 9.2 8 * * * * * *
7.2 8.0 23 8.4 8.8 6 7.8 9.0 9 7.4 8.3 10 6.6 8.2 5
11.0 10.1 7 * * * 9.2 10.1 5 11.6 10.1 5 * * *
8.0 8.0 9 * * * 8.8 8.0 6 * * * * * *
* * * * * * - - - * * * * * *
6.4 7.0 12 6.7 7.5 6 6.4 7.0 10 6.4 7.0 5 * * *
7.2 7.3 61 7.3 7.4 38 8.2 8.0 33 7.5 8.0 30 7.4 7.7 26
7.6 8.1 8 * * * * * * 7.2 8.0 7 * * *
6.7 7.0 18 6.4 6.4 5 7.2 7.2 6 6.7 6.4 7 7.0 8.3 7
7.4 8.0 9 8.2 8.3 6 * * * 8.6 8.3 6 7.6 8.5 7
7.8 8.0 24 8.7 8.0 12 8.2 8.0 16 8.2 8.0 13 8.6 8.2 9
6.5 7.0 23 6.7 7.0 15 7.4 8.0 9 6.7 7.4 12 6.4 7.0 13
5.8 5.8 10 * * * 5.3 6.0 7 5.0 6.0 5 * * *
* * * * * * * * * * * * * * *
5.8 5.8 8 * * * 5.2 6.0 5 * * * * * *
6.8 6.0 28 6.8 6.0 12 6.3 5.0 6 8.0 9.0 9 7.7 7.8 8
7.8 8.0 25 7.5 7.8 16 8.6 9.0 17 8.1 8.0 17 7.2 7.8 18
7.7 7.1 16 6.6 6.0 9 7.9 8.0 9 * * * 7.8 6.0 5
7.6 7.1 14 6.8 6.0 8 8.3 8.0 8 * * * * * *
7.3 7.1 738 7.4 7.5 391 7.6 8.0 350 7.7 8.0 332 7.4 7.5 335
52 WorldatWork 2003-04 Salary Budget SurveyMining = Industry Group
Metal Mfg = Industry Subgroup
* Fewer than five survey respondents ** Total line reflects all data submitted – No DataKey:
Eastern Region
Mean % Median % n
Central Region
Mean % Median % n
Southern Region
Mean % Median % n
Western Region
Mean % Median % n
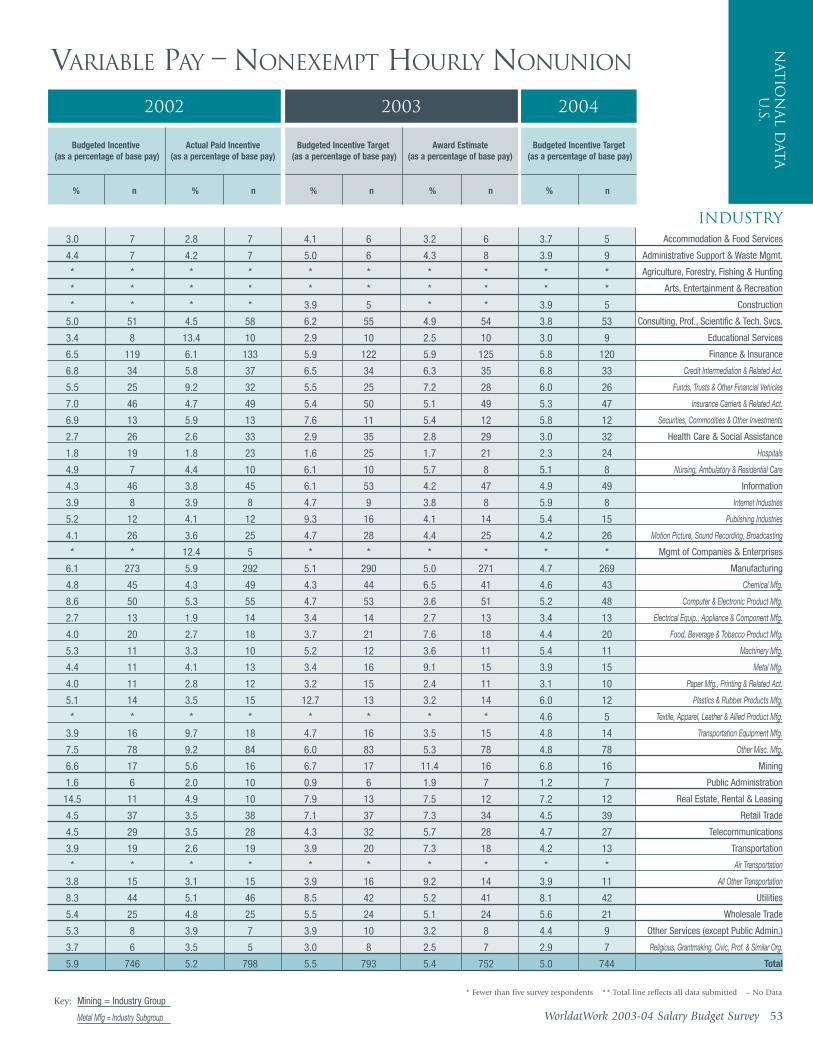
INDUSTRY
Nat
ion
al D
ata
U.S.
WorldatWork 2003-04 Salary Budget Survey 53
* Fewer than five survey respondents ** Total line reflects all data submitted – No DataMining = Industry Group
Metal Mfg = Industry Subgroup
Key:
Accommodation & Food Services
Administrative Support & Waste Mgmt.
Agriculture, Forestry, Fishing & Hunting
Arts, Entertainment & Recreation
Construction
Consulting, Prof., Scientific & Tech. Svcs.
Educational Services
Finance & Insurance
Credit Intermediation & Related Act.
Funds, Trusts & Other Financial Vehicles
Insurance Carriers & Related Act.
Securities, Commodities & Other Investments
Health Care & Social Assistance
Hospitals
Nursing, Ambulatory & Residential Care
Information
Internet Industries
Publishing Industries
Motion Picture, Sound Recording, Broadcasting
Mgmt of Companies & Enterprises
Manufacturing
Chemical Mfg.
Computer & Electronic Product Mfg.
Electrical Equip., Appliance & Component Mfg.
Food, Beverage & Tobacco Product Mfg.
Machinery Mfg.
Metal Mfg.
Paper Mfg., Printing & Related Act.
Plastics & Rubber Products Mfg.
Textile, Apparel, Leather & Allied Product Mfg.
Transportation Equipment Mfg.
Other Misc. Mfg.
Mining
Public Administration
Real Estate, Rental & Leasing
Retail Trade
Telecommunications
Transportation
Air Transportation
All Other Transportation
Utilities
Wholesale Trade
Other Services (except Public Admin.)
Religious, Grantmaking, Civic, Prof. & Similar Org.
Total
3.0 7 2.8 7 4.1 6 3.2 6 3.7 5
4.4 7 4.2 7 5.0 6 4.3 8 3.9 9
* * * * * * * * * *
* * * * * * * * * *
* * * * 3.9 5 * * 3.9 5
5.0 51 4.5 58 6.2 55 4.9 54 3.8 53
3.4 8 13.4 10 2.9 10 2.5 10 3.0 9
6.5 119 6.1 133 5.9 122 5.9 125 5.8 120
6.8 34 5.8 37 6.5 34 6.3 35 6.8 33
5.5 25 9.2 32 5.5 25 7.2 28 6.0 26
7.0 46 4.7 49 5.4 50 5.1 49 5.3 47
6.9 13 5.9 13 7.6 11 5.4 12 5.8 12
2.7 26 2.6 33 2.9 35 2.8 29 3.0 32
1.8 19 1.8 23 1.6 25 1.7 21 2.3 24
4.9 7 4.4 10 6.1 10 5.7 8 5.1 8
4.3 46 3.8 45 6.1 53 4.2 47 4.9 49
3.9 8 3.9 8 4.7 9 3.8 8 5.9 8
5.2 12 4.1 12 9.3 16 4.1 14 5.4 15
4.1 26 3.6 25 4.7 28 4.4 25 4.2 26
* * 12.4 5 * * * * * *
6.1 273 5.9 292 5.1 290 5.0 271 4.7 269
4.8 45 4.3 49 4.3 44 6.5 41 4.6 43
8.6 50 5.3 55 4.7 53 3.6 51 5.2 48
2.7 13 1.9 14 3.4 14 2.7 13 3.4 13
4.0 20 2.7 18 3.7 21 7.6 18 4.4 20
5.3 11 3.3 10 5.2 12 3.6 11 5.4 11
4.4 11 4.1 13 3.4 16 9.1 15 3.9 15
4.0 11 2.8 12 3.2 15 2.4 11 3.1 10
5.1 14 3.5 15 12.7 13 3.2 14 6.0 12
* * * * * * * * 4.6 5
3.9 16 9.7 18 4.7 16 3.5 15 4.8 14
7.5 78 9.2 84 6.0 83 5.3 78 4.8 78
6.6 17 5.6 16 6.7 17 11.4 16 6.8 16
1.6 6 2.0 10 0.9 6 1.9 7 1.2 7
14.5 11 4.9 10 7.9 13 7.5 12 7.2 12
4.5 37 3.5 38 7.1 37 7.3 34 4.5 39
4.5 29 3.5 28 4.3 32 5.7 28 4.7 27
3.9 19 2.6 19 3.9 20 7.3 18 4.2 13
* * * * * * * * * *
3.8 15 3.1 15 3.9 16 9.2 14 3.9 11
8.3 44 5.1 46 8.5 42 5.2 41 8.1 42
5.4 25 4.8 25 5.5 24 5.1 24 5.6 21
5.3 8 3.9 7 3.9 10 3.2 8 4.4 9
3.7 6 3.5 5 3.0 8 2.5 7 2.9 7
5.9 746 5.2 798 5.5 793 5.4 752 5.0 744
2002
VARIABLE PAY – NONEXEMPT HOURLY NONUNION
Budgeted Incentive(as a percentage of base pay)
Actual Paid Incentive (as a percentage of base pay)
% n
2003 2004
% n
Budgeted Incentive Target(as a percentage of base pay)
Award Estimate (as a percentage of base pay)
% n % n
Budgeted Incentive Target(as a percentage of base pay)
% n
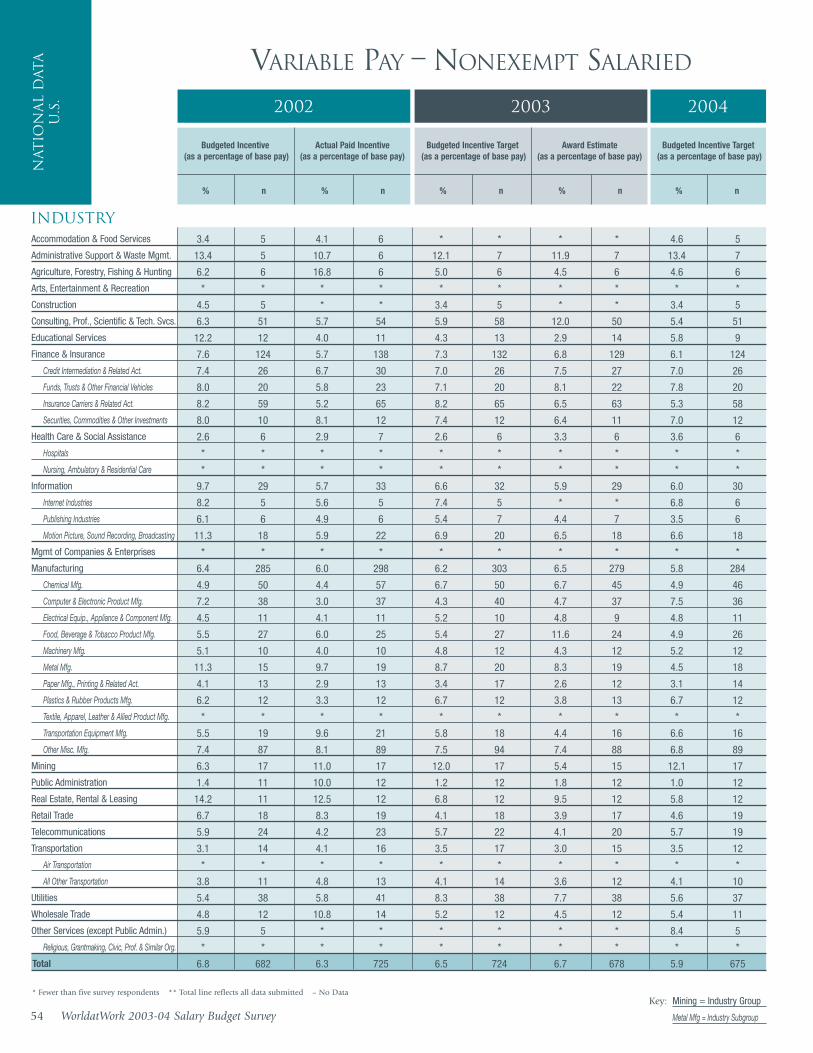
INDUSTRY
Nat
ion
al
Data
U.S
. 2002
VARIABLE PAY – NONEXEMPT SALARIED
Budgeted Incentive(as a percentage of base pay)
Actual Paid Incentive (as a percentage of base pay)
% n
Accommodation & Food Services
Administrative Support & Waste Mgmt.
Agriculture, Forestry, Fishing & Hunting
Arts, Entertainment & Recreation
Construction
Consulting, Prof., Scientific & Tech. Svcs.
Educational Services
Finance & Insurance
Credit Intermediation & Related Act.
Funds, Trusts & Other Financial Vehicles
Insurance Carriers & Related Act.
Securities, Commodities & Other Investments
Health Care & Social Assistance
Hospitals
Nursing, Ambulatory & Residential Care
Information
Internet Industries
Publishing Industries
Motion Picture, Sound Recording, Broadcasting
Mgmt of Companies & Enterprises
Manufacturing
Chemical Mfg.
Computer & Electronic Product Mfg.
Electrical Equip., Appliance & Component Mfg.
Food, Beverage & Tobacco Product Mfg.
Machinery Mfg.
Metal Mfg.
Paper Mfg., Printing & Related Act.
Plastics & Rubber Products Mfg.
Textile, Apparel, Leather & Allied Product Mfg.
Transportation Equipment Mfg.
Other Misc. Mfg.
Mining
Public Administration
Real Estate, Rental & Leasing
Retail Trade
Telecommunications
Transportation
Air Transportation
All Other Transportation
Utilities
Wholesale Trade
Other Services (except Public Admin.)
Religious, Grantmaking, Civic, Prof. & Similar Org.
Total
3.4 5 4.1 6 * * * * 4.6 5
13.4 5 10.7 6 12.1 7 11.9 7 13.4 7
6.2 6 16.8 6 5.0 6 4.5 6 4.6 6
* * * * * * * * * *
4.5 5 * * 3.4 5 * * 3.4 5
6.3 51 5.7 54 5.9 58 12.0 50 5.4 51
12.2 12 4.0 11 4.3 13 2.9 14 5.8 9
7.6 124 5.7 138 7.3 132 6.8 129 6.1 124
7.4 26 6.7 30 7.0 26 7.5 27 7.0 26
8.0 20 5.8 23 7.1 20 8.1 22 7.8 20
8.2 59 5.2 65 8.2 65 6.5 63 5.3 58
8.0 10 8.1 12 7.4 12 6.4 11 7.0 12
2.6 6 2.9 7 2.6 6 3.3 6 3.6 6
* * * * * * * * * *
* * * * * * * * * *
9.7 29 5.7 33 6.6 32 5.9 29 6.0 30
8.2 5 5.6 5 7.4 5 * * 6.8 6
6.1 6 4.9 6 5.4 7 4.4 7 3.5 6
11.3 18 5.9 22 6.9 20 6.5 18 6.6 18
* * * * * * * * * *
6.4 285 6.0 298 6.2 303 6.5 279 5.8 284
4.9 50 4.4 57 6.7 50 6.7 45 4.9 46
7.2 38 3.0 37 4.3 40 4.7 37 7.5 36
4.5 11 4.1 11 5.2 10 4.8 9 4.8 11
5.5 27 6.0 25 5.4 27 11.6 24 4.9 26
5.1 10 4.0 10 4.8 12 4.3 12 5.2 12
11.3 15 9.7 19 8.7 20 8.3 19 4.5 18
4.1 13 2.9 13 3.4 17 2.6 12 3.1 14
6.2 12 3.3 12 6.7 12 3.8 13 6.7 12
* * * * * * * * * *
5.5 19 9.6 21 5.8 18 4.4 16 6.6 16
7.4 87 8.1 89 7.5 94 7.4 88 6.8 89
6.3 17 11.0 17 12.0 17 5.4 15 12.1 17
1.4 11 10.0 12 1.2 12 1.8 12 1.0 12
14.2 11 12.5 12 6.8 12 9.5 12 5.8 12
6.7 18 8.3 19 4.1 18 3.9 17 4.6 19
5.9 24 4.2 23 5.7 22 4.1 20 5.7 19
3.1 14 4.1 16 3.5 17 3.0 15 3.5 12
* * * * * * * * * *
3.8 11 4.8 13 4.1 14 3.6 12 4.1 10
5.4 38 5.8 41 8.3 38 7.7 38 5.6 37
4.8 12 10.8 14 5.2 12 4.5 12 5.4 11
5.9 5 * * * * * * 8.4 5
* * * * * * * * * *
6.8 682 6.3 725 6.5 724 6.7 678 5.9 675
54 WorldatWork 2003-04 Salary Budget SurveyMining = Industry Group
Metal Mfg = Industry Subgroup
* Fewer than five survey respondents ** Total line reflects all data submitted – No DataKey:
2003 2004
% n
Budgeted Incentive Target(as a percentage of base pay)
Award Estimate (as a percentage of base pay)
% n % n
Budgeted Incentive Target(as a percentage of base pay)
% n
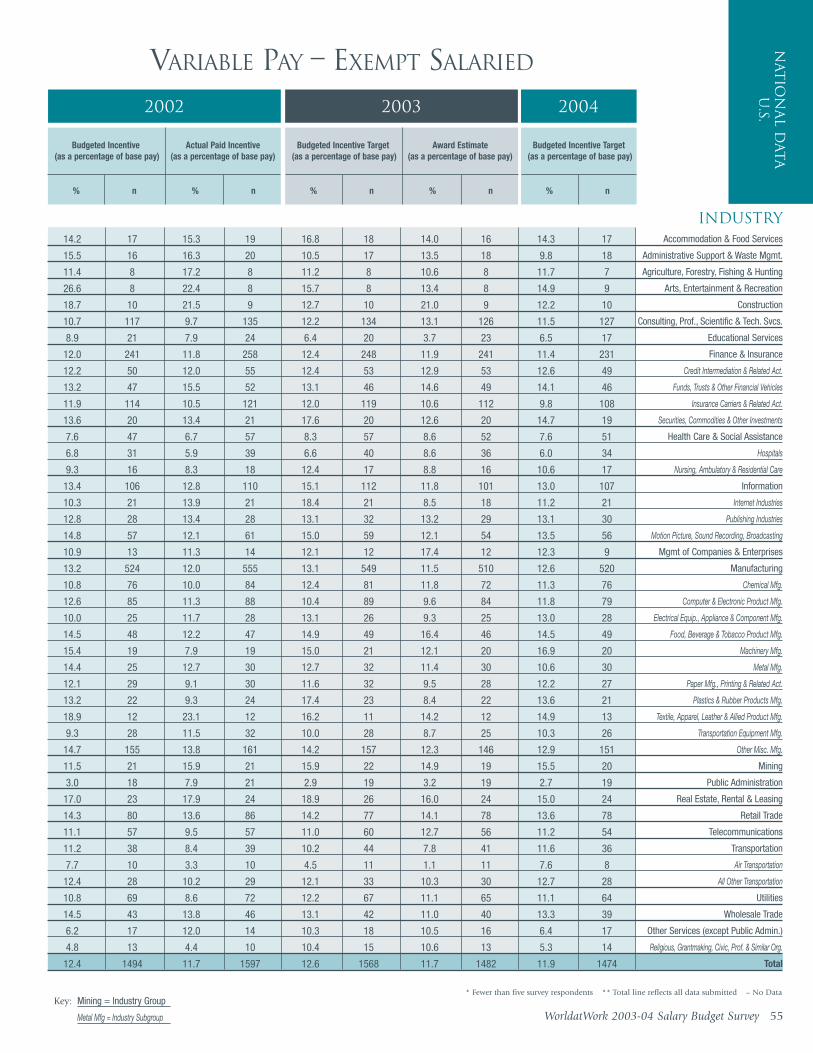
INDUSTRY
Nat
ion
al D
ata
U.S.
WorldatWork 2003-04 Salary Budget Survey 55
* Fewer than five survey respondents ** Total line reflects all data submitted – No DataMining = Industry Group
Metal Mfg = Industry Subgroup
Key:
Accommodation & Food Services
Administrative Support & Waste Mgmt.
Agriculture, Forestry, Fishing & Hunting
Arts, Entertainment & Recreation
Construction
Consulting, Prof., Scientific & Tech. Svcs.
Educational Services
Finance & Insurance
Credit Intermediation & Related Act.
Funds, Trusts & Other Financial Vehicles
Insurance Carriers & Related Act.
Securities, Commodities & Other Investments
Health Care & Social Assistance
Hospitals
Nursing, Ambulatory & Residential Care
Information
Internet Industries
Publishing Industries
Motion Picture, Sound Recording, Broadcasting
Mgmt of Companies & Enterprises
Manufacturing
Chemical Mfg.
Computer & Electronic Product Mfg.
Electrical Equip., Appliance & Component Mfg.
Food, Beverage & Tobacco Product Mfg.
Machinery Mfg.
Metal Mfg.
Paper Mfg., Printing & Related Act.
Plastics & Rubber Products Mfg.
Textile, Apparel, Leather & Allied Product Mfg.
Transportation Equipment Mfg.
Other Misc. Mfg.
Mining
Public Administration
Real Estate, Rental & Leasing
Retail Trade
Telecommunications
Transportation
Air Transportation
All Other Transportation
Utilities
Wholesale Trade
Other Services (except Public Admin.)
Religious, Grantmaking, Civic, Prof. & Similar Org.
Total
14.2 17 15.3 19 16.8 18 14.0 16 14.3 17
15.5 16 16.3 20 10.5 17 13.5 18 9.8 18
11.4 8 17.2 8 11.2 8 10.6 8 11.7 7
26.6 8 22.4 8 15.7 8 13.4 8 14.9 9
18.7 10 21.5 9 12.7 10 21.0 9 12.2 10
10.7 117 9.7 135 12.2 134 13.1 126 11.5 127
8.9 21 7.9 24 6.4 20 3.7 23 6.5 17
12.0 241 11.8 258 12.4 248 11.9 241 11.4 231
12.2 50 12.0 55 12.4 53 12.9 53 12.6 49
13.2 47 15.5 52 13.1 46 14.6 49 14.1 46
11.9 114 10.5 121 12.0 119 10.6 112 9.8 108
13.6 20 13.4 21 17.6 20 12.6 20 14.7 19
7.6 47 6.7 57 8.3 57 8.6 52 7.6 51
6.8 31 5.9 39 6.6 40 8.6 36 6.0 34
9.3 16 8.3 18 12.4 17 8.8 16 10.6 17
13.4 106 12.8 110 15.1 112 11.8 101 13.0 107
10.3 21 13.9 21 18.4 21 8.5 18 11.2 21
12.8 28 13.4 28 13.1 32 13.2 29 13.1 30
14.8 57 12.1 61 15.0 59 12.1 54 13.5 56
10.9 13 11.3 14 12.1 12 17.4 12 12.3 9
13.2 524 12.0 555 13.1 549 11.5 510 12.6 520
10.8 76 10.0 84 12.4 81 11.8 72 11.3 76
12.6 85 11.3 88 10.4 89 9.6 84 11.8 79
10.0 25 11.7 28 13.1 26 9.3 25 13.0 28
14.5 48 12.2 47 14.9 49 16.4 46 14.5 49
15.4 19 7.9 19 15.0 21 12.1 20 16.9 20
14.4 25 12.7 30 12.7 32 11.4 30 10.6 30
12.1 29 9.1 30 11.6 32 9.5 28 12.2 27
13.2 22 9.3 24 17.4 23 8.4 22 13.6 21
18.9 12 23.1 12 16.2 11 14.2 12 14.9 13
9.3 28 11.5 32 10.0 28 8.7 25 10.3 26
14.7 155 13.8 161 14.2 157 12.3 146 12.9 151
11.5 21 15.9 21 15.9 22 14.9 19 15.5 20
3.0 18 7.9 21 2.9 19 3.2 19 2.7 19
17.0 23 17.9 24 18.9 26 16.0 24 15.0 24
14.3 80 13.6 86 14.2 77 14.1 78 13.6 78
11.1 57 9.5 57 11.0 60 12.7 56 11.2 54
11.2 38 8.4 39 10.2 44 7.8 41 11.6 36
7.7 10 3.3 10 4.5 11 1.1 11 7.6 8
12.4 28 10.2 29 12.1 33 10.3 30 12.7 28
10.8 69 8.6 72 12.2 67 11.1 65 11.1 64
14.5 43 13.8 46 13.1 42 11.0 40 13.3 39
6.2 17 12.0 14 10.3 18 10.5 16 6.4 17
4.8 13 4.4 10 10.4 15 10.6 13 5.3 14
12.4 1494 11.7 1597 12.6 1568 11.7 1482 11.9 1474
2002
VARIABLE PAY – EXEMPT SALARIED
Budgeted Incentive(as a percentage of base pay)
Actual Paid Incentive (as a percentage of base pay)
% n
2003 2004
% n
Budgeted Incentive Target(as a percentage of base pay)
Award Estimate (as a percentage of base pay)
% n % n
Budgeted Incentive Target(as a percentage of base pay)
% n

INDUSTRY
Nat
ion
al
Data
U.S
. 2002
VARIABLE PAY – OFFICER / EXECUTIVE
Budgeted Incentive(as a percentage of base pay)
Actual Paid Incentive (as a percentage of base pay)
% n
Accommodation & Food Services
Administrative Support & Waste Mgmt.
Agriculture, Forestry, Fishing & Hunting
Arts, Entertainment & Recreation
Construction
Consulting, Prof., Scientific & Tech. Svcs.
Educational Services
Finance & Insurance
Credit Intermediation & Related Act.
Funds, Trusts & Other Financial Vehicles
Insurance Carriers & Related Act.
Securities, Commodities & Other Investments
Health Care & Social Assistance
Hospitals
Nursing, Ambulatory & Residential Care
Information
Internet Industries
Publishing Industries
Motion Picture, Sound Recording, Broadcasting
Mgmt of Companies & Enterprises
Manufacturing
Chemical Mfg.
Computer & Electronic Product Mfg.
Electrical Equip., Appliance & Component Mfg.
Food, Beverage & Tobacco Product Mfg.
Machinery Mfg.
Metal Mfg.
Paper Mfg., Printing & Related Act.
Plastics & Rubber Products Mfg.
Textile, Apparel, Leather & Allied Product Mfg.
Transportation Equipment Mfg.
Other Misc. Mfg.
Mining
Public Administration
Real Estate, Rental & Leasing
Retail Trade
Telecommunications
Transportation
Air Transportation
All Other Transportation
Utilities
Wholesale Trade
Other Services (except Public Admin.)
Religious, Grantmaking, Civic, Prof. & Similar Org.
Total
38.0 16 35.2 17 40.5 17 32.0 14 38.1 16
34.7 11 33.2 15 28.3 12 25.5 13 22.4 14
29.1 7 26.0 7 30.6 7 27.4 7 30.3 6
41.0 8 20.9 8 30.9 8 23.9 8 34.0 7
44.6 9 51.0 7 33.8 9 39.9 8 33.8 9
28.6 108 24.7 120 27.2 122 25.9 114 27.4 117
14.0 16 17.5 18 7.7 16 6.9 17 9.3 14
30.9 220 33.0 239 31.6 224 31.4 215 30.7 212
30.9 44 33.7 48 30.6 46 30.5 46 30.2 46
34.0 42 38.0 47 34.7 42 37.4 43 38.0 42
31.6 107 31.4 116 32.1 109 30.5 101 29.5 100
32.8 17 41.3 19 37.9 17 34.2 18 33.8 15
20.0 57 17.9 62 23.2 68 21.5 62 21.2 62
18.2 43 16.6 48 21.2 51 19.5 47 18.5 47
25.5 14 22.0 14 28.9 17 27.5 15 29.7 15
34.0 100 29.9 103 35.9 107 28.1 95 35.5 101
35.1 22 33.9 21 39.3 23 28.3 20 36.0 21
33.1 26 33.8 26 34.1 30 30.1 27 37.6 30
34.0 52 26.6 56 35.3 54 26.9 48 34.1 50
28.5 11 22.1 11 35.1 10 24.8 10 26.5 8
35.2 453 30.4 476 34.9 471 29.9 433 35.7 442
32.6 67 30.8 74 34.8 71 33.1 62 35.0 66
33.2 73 24.3 72 29.1 74 22.2 68 32.3 70
33.4 23 29.8 25 36.0 24 28.6 22 37.1 24
39.4 43 31.7 42 39.3 45 36.0 43 37.4 42
40.5 15 33.9 15 36.3 16 27.3 15 43.5 15
27.7 25 22.5 28 27.8 28 27.8 24 32.0 25
35.4 29 27.5 29 33.4 30 25.2 27 35.9 26
32.9 18 24.1 20 36.4 19 21.2 18 33.8 18
40.0 12 46.7 11 35.7 11 33.0 12 36.1 12
34.2 20 33.7 26 35.9 22 31.2 20 35.2 20
37.4 128 34.0 134 37.7 131 33.1 122 37.2 124
36.9 15 41.2 15 41.9 16 41.8 14 38.1 16
10.4 19 16.0 20 10.7 19 10.5 19 11.1 15
34.1 22 40.8 24 42.1 24 37.6 22 37.3 23
38.5 74 35.3 80 35.8 72 35.6 71 36.5 73
35.5 55 28.8 55 33.6 55 33.4 51 34.2 51
34.3 32 29.5 33 32.5 35 25.3 32 37.1 28
24.1 9 18.2 10 14.2 9 4.2 9 26.3 6
38.3 23 34.4 23 38.8 26 33.6 23 40.1 22
32.8 58 29.5 61 33.8 59 31.8 56 31.1 58
35.7 39 29.8 41 37.4 35 30.5 35 36.9 34
15.2 18 25.1 15 16.1 18 15.6 16 13.4 17
9.6 14 8.3 11 13.4 16 13.0 13 9.2 14
32.5 1348 29.8 1427 32.4 1404 29.1 1312 32.3 1323
56 WorldatWork 2003-04 Salary Budget SurveyMining = Industry Group
Metal Mfg = Industry Subgroup
* Fewer than five survey respondents ** Total line reflects all data submitted – No DataKey:
2003 2004
% n
Budgeted Incentive Target(as a percentage of base pay)
Award Estimate (as a percentage of base pay)
% n % n
Budgeted Incentive Target(as a percentage of base pay)
% n

WorldatWork 2003-04 Salary Budget Survey 57
Canada
The 2003-04 Salary Budget Survey reports data for more than 625,000 Canadian employees from the 280 organizations participating in the survey. Collected in April 2003, this data represents a broad range of industries across all provinces of Canada.
2003 RESPONSES BY CANADIAN REGION
Ontario 213
Alberta 135
British Columbia 125
Quebec 116
Manitoba 80
Saskatchewan 74
Nova Scotia 73
New Brunswick 63
New Foundland 49
Prince Edward Island 34
Northwest Territories 12
Yukon 10
Nunavut 8
Note: The combined responses above add up to greater than the total response from Canada because some participants answered for multiple regions or nationally, and thus, they are counted in multiple regions.
Executive Summary of Trends
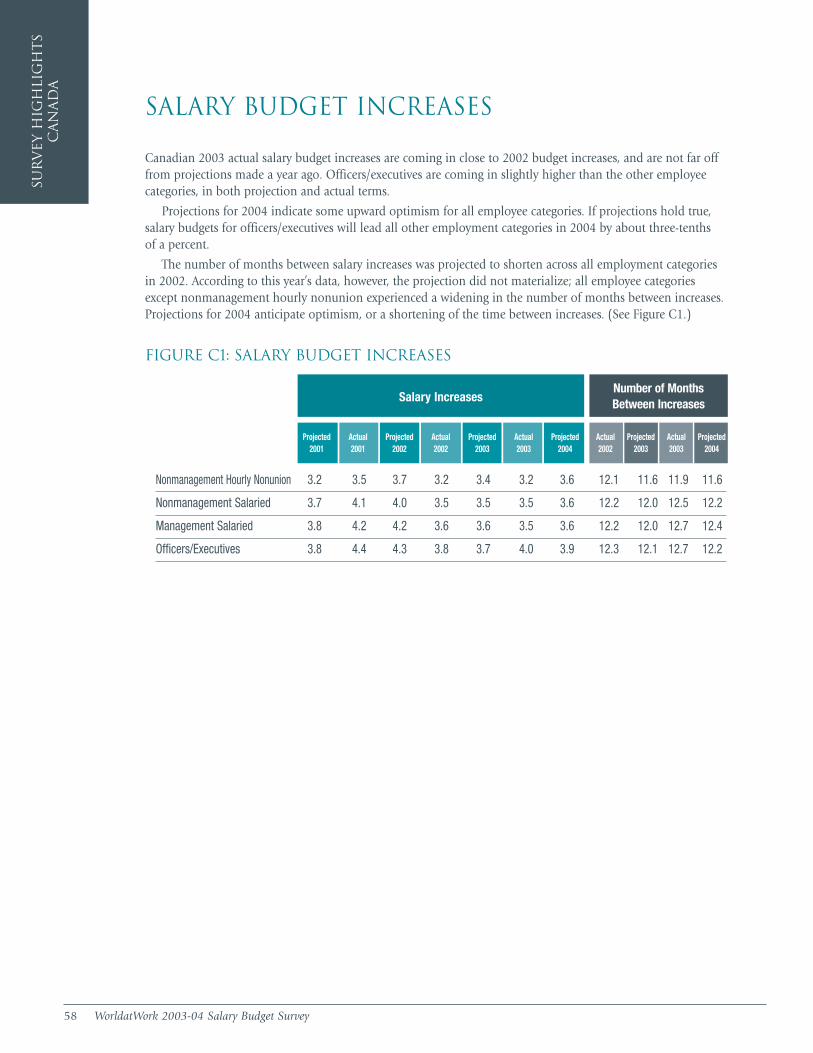
58 WorldatWork 2003-04 Salary Budget Survey
Salary Budget Increases
Canadian 2003 actual salary budget increases are coming in close to 2002 budget increases, and are not far offfrom projections made a year ago. Officers/executives are coming in slightly higher than the other employeecategories, in both projection and actual terms.
Projections for 2004 indicate some upward optimism for all employee categories. If projections hold true,salary budgets for officers/executives will lead all other employment categories in 2004 by about three-tenths of a percent.
The number of months between salary increases was projected to shorten across all employment categoriesin 2002. According to this year’s data, however, the projection did not materialize; all employee categoriesexcept nonmanagement hourly nonunion experienced a widening in the number of months between increases.Projections for 2004 anticipate optimism, or a shortening of the time between increases. (See Figure C1.)
FIGURE C1: SALARY BUDGET INCREASES
Sur
vey H
igh
lig
ht
sC
an
ad
a
Nonmanagement Hourly Nonunion 3.2 3.5 3.7 3.2 3.4 3.2 3.6 12.1 11.6 11.9 11.6
Nonmanagement Salaried 3.7 4.1 4.0 3.5 3.5 3.5 3.6 12.2 12.0 12.5 12.2
Management Salaried 3.8 4.2 4.2 3.6 3.6 3.5 3.6 12.2 12.0 12.7 12.4
Officers/Executives 3.8 4.4 4.3 3.8 3.7 4.0 3.9 12.3 12.1 12.7 12.2
Number of MonthsBetween IncreasesSalary Increases
Projected2001
Actual 2001
Projected2002
Actual 2002
Projected2003
Actual 2003
Projected2004
Actual2002
Projected2003
Actual2003
Projected2004
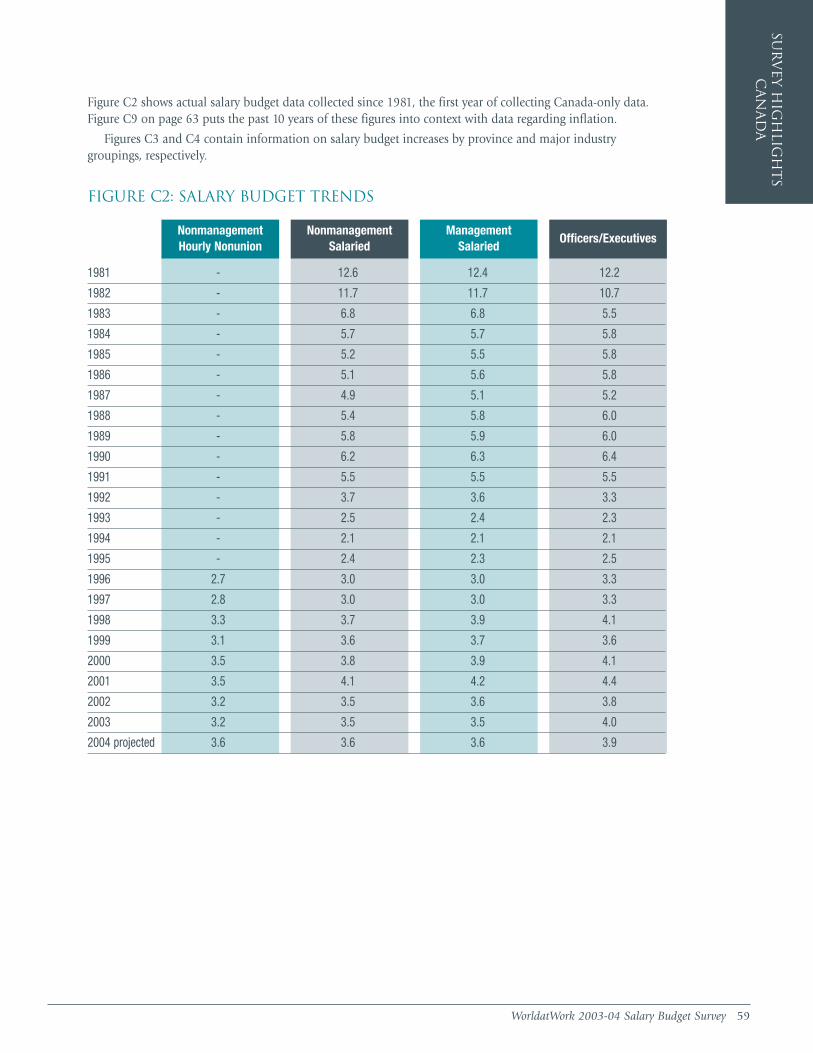
WorldatWork 2003-04 Salary Budget Survey 59
Sur
vey H
igh
ligh
ts
Ca
na
da
Nonmanagement Hourly Nonunion
1981 - 12.6 12.4 12.2
1982 - 11.7 11.7 10.7
1983 - 6.8 6.8 5.5
1984 - 5.7 5.7 5.8
1985 - 5.2 5.5 5.8
1986 - 5.1 5.6 5.8
1987 - 4.9 5.1 5.2
1988 - 5.4 5.8 6.0
1989 - 5.8 5.9 6.0
1990 - 6.2 6.3 6.4
1991 - 5.5 5.5 5.5
1992 - 3.7 3.6 3.3
1993 - 2.5 2.4 2.3
1994 - 2.1 2.1 2.1
1995 - 2.4 2.3 2.5
1996 2.7 3.0 3.0 3.3
1997 2.8 3.0 3.0 3.3
1998 3.3 3.7 3.9 4.1
1999 3.1 3.6 3.7 3.6
2000 3.5 3.8 3.9 4.1
2001 3.5 4.1 4.2 4.4
2002 3.2 3.5 3.6 3.8
2003 3.2 3.5 3.5 4.0
2004 projected 3.6 3.6 3.6 3.9
NonmanagementSalaried
ManagementSalaried
Officers/Executives
Figure C2 shows actual salary budget data collected since 1981, the first year of collecting Canada-only data.Figure C9 on page 63 puts the past 10 years of these figures into context with data regarding inflation.
Figures C3 and C4 contain information on salary budget increases by province and major industry groupings, respectively.
FIGURE C2: SALARY BUDGET TRENDS
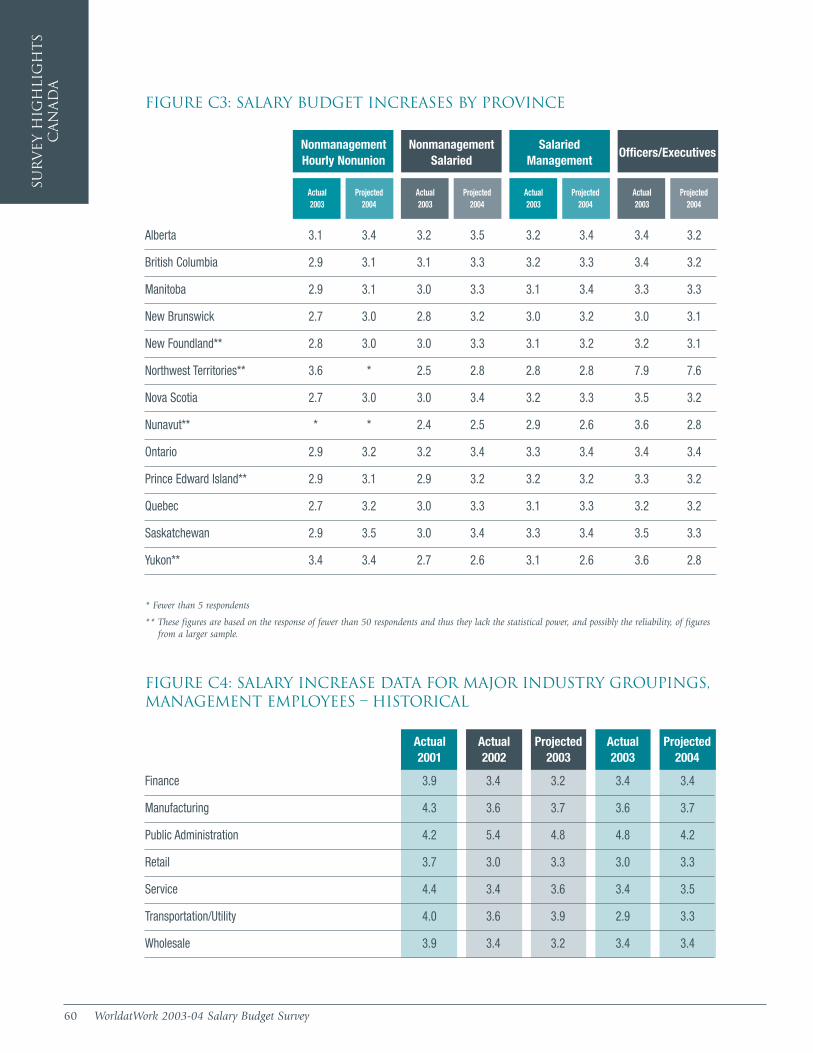
60 WorldatWork 2003-04 Salary Budget Survey
Sur
vey H
igh
lig
ht
sC
an
ad
a
Alberta 3.1 3.4 3.2 3.5 3.2 3.4 3.4 3.2
British Columbia 2.9 3.1 3.1 3.3 3.2 3.3 3.4 3.2
Manitoba 2.9 3.1 3.0 3.3 3.1 3.4 3.3 3.3
New Brunswick 2.7 3.0 2.8 3.2 3.0 3.2 3.0 3.1
New Foundland** 2.8 3.0 3.0 3.3 3.1 3.2 3.2 3.1
Northwest Territories** 3.6 * 2.5 2.8 2.8 2.8 7.9 7.6
Nova Scotia 2.7 3.0 3.0 3.4 3.2 3.3 3.5 3.2
Nunavut** * * 2.4 2.5 2.9 2.6 3.6 2.8
Ontario 2.9 3.2 3.2 3.4 3.3 3.4 3.4 3.4
Prince Edward Island** 2.9 3.1 2.9 3.2 3.2 3.2 3.3 3.2
Quebec 2.7 3.2 3.0 3.3 3.1 3.3 3.2 3.2
Saskatchewan 2.9 3.5 3.0 3.4 3.3 3.4 3.5 3.3
Yukon** 3.4 3.4 2.7 2.6 3.1 2.6 3.6 2.8
* Fewer than 5 respondents
** These figures are based on the response of fewer than 50 respondents and thus they lack the statistical power, and possibly the reliability, of figuresfrom a larger sample.
Nonmanagement Hourly Nonunion
NonmanagementSalaried
Salaried Management
Officers/Executives
Actual 2003
Projected 2004
Actual 2003
Projected 2004
Actual 2003
Projected 2004
Actual 2003
Projected 2004
FIGURE C3: SALARY BUDGET INCREASES BY PROVINCE
FIGURE C4: SALARY INCREASE DATA FOR MAJOR INDUSTRY GROUPINGS,MANAGEMENT EMPLOYEES – HISTORICAL
Finance 3.9 3.4 3.2 3.4 3.4
Manufacturing 4.3 3.6 3.7 3.6 3.7
Public Administration 4.2 5.4 4.8 4.8 4.2
Retail 3.7 3.0 3.3 3.0 3.3
Service 4.4 3.4 3.6 3.4 3.5
Transportation/Utility 4.0 3.6 3.9 2.9 3.3
Wholesale 3.9 3.4 3.2 3.4 3.4
Actual2001
Actual2002
Projected2003
Actual2003
Projected2004
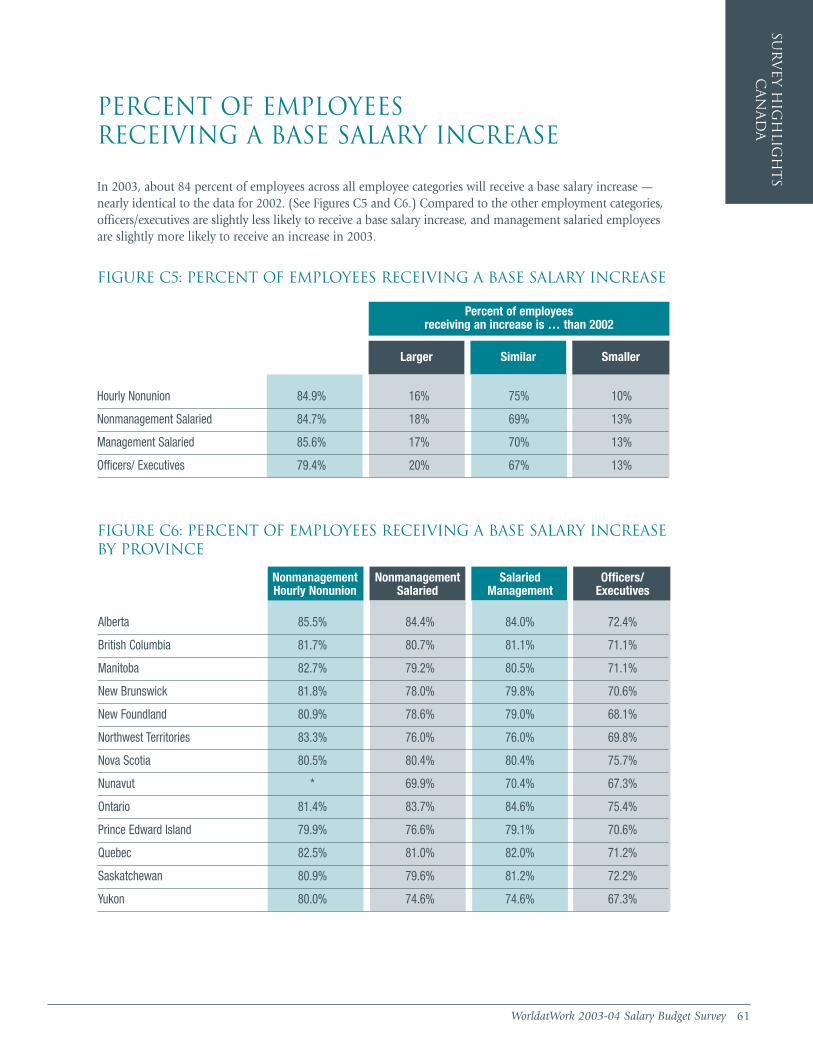
WorldatWork 2003-04 Salary Budget Survey 61
Sur
vey H
igh
ligh
ts
Ca
na
da
Percent of Employees Receiving a Base Salary Increase
In 2003, about 84 percent of employees across all employee categories will receive a base salary increase —nearly identical to the data for 2002. (See Figures C5 and C6.) Compared to the other employment categories,officers/executives are slightly less likely to receive a base salary increase, and management salaried employeesare slightly more likely to receive an increase in 2003.
FIGURE C5: PERCENT OF EMPLOYEES RECEIVING A BASE SALARY INCREASE
Percent of employees receiving an increase is … than 2002
Larger Similar Smaller
Hourly Nonunion 84.9% 16% 75% 10%
Nonmanagement Salaried 84.7% 18% 69% 13%
Management Salaried 85.6% 17% 70% 13%
Officers/ Executives 79.4% 20% 67% 13%
FIGURE C6: PERCENT OF EMPLOYEES RECEIVING A BASE SALARY INCREASEBY PROVINCE
Alberta 85.5% 84.4% 84.0% 72.4%
British Columbia 81.7% 80.7% 81.1% 71.1%
Manitoba 82.7% 79.2% 80.5% 71.1%
New Brunswick 81.8% 78.0% 79.8% 70.6%
New Foundland 80.9% 78.6% 79.0% 68.1%
Northwest Territories 83.3% 76.0% 76.0% 69.8%
Nova Scotia 80.5% 80.4% 80.4% 75.7%
Nunavut * 69.9% 70.4% 67.3%
Ontario 81.4% 83.7% 84.6% 75.4%
Prince Edward Island 79.9% 76.6% 79.1% 70.6%
Quebec 82.5% 81.0% 82.0% 71.2%
Saskatchewan 80.9% 79.6% 81.2% 72.2%
Yukon 80.0% 74.6% 74.6% 67.3%
Nonmanagement Hourly Nonunion
NonmanagementSalaried
Salaried Management
Officers/Executives
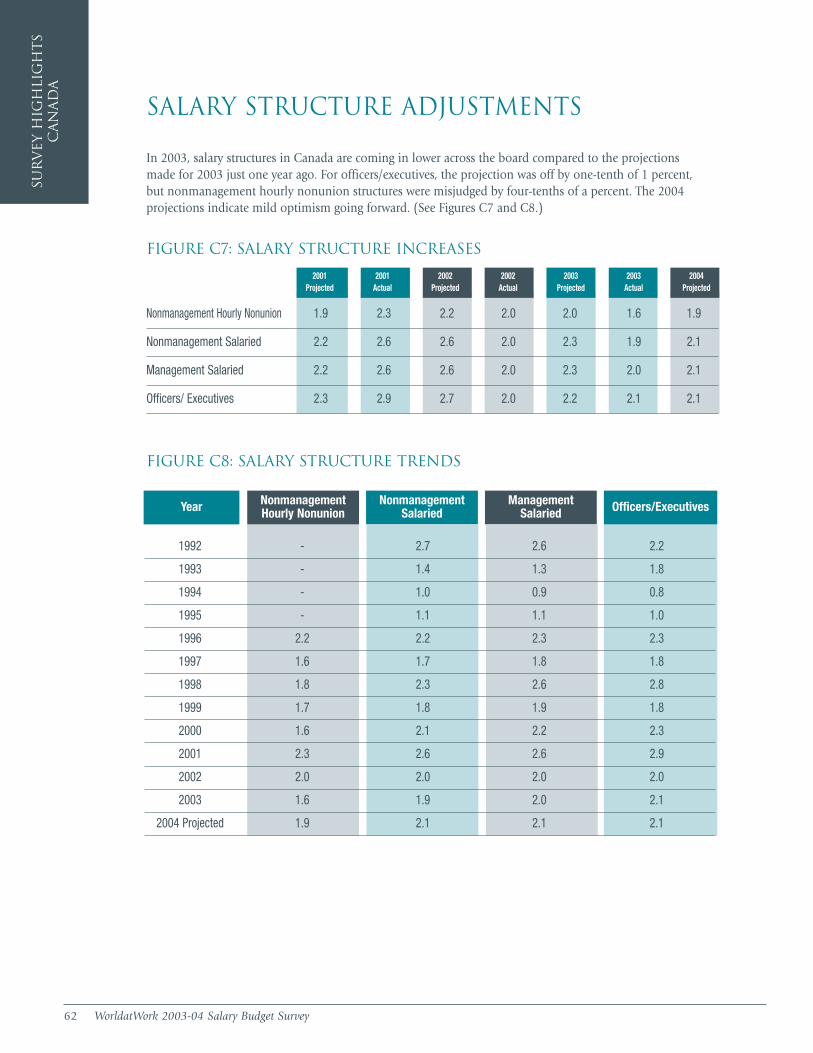
62 WorldatWork 2003-04 Salary Budget Survey
Sur
vey H
igh
lig
ht
sC
an
ad
a
Salary Structure Adjustments
In 2003, salary structures in Canada are coming in lower across the board compared to the projections made for 2003 just one year ago. For officers/executives, the projection was off by one-tenth of 1 percent, but nonmanagement hourly nonunion structures were misjudged by four-tenths of a percent. The 2004 projections indicate mild optimism going forward. (See Figures C7 and C8.)
FIGURE C7: SALARY STRUCTURE INCREASES
Nonmanagement Hourly Nonunion 1.9 2.3 2.2 2.0 2.0 1.6 1.9
Nonmanagement Salaried 2.2 2.6 2.6 2.0 2.3 1.9 2.1
Management Salaried 2.2 2.6 2.6 2.0 2.3 2.0 2.1
Officers/ Executives 2.3 2.9 2.7 2.0 2.2 2.1 2.1
2001 Projected
2001 Actual
2002 Projected
2002 Actual
2003 Projected
2003 Actual
2004 Projected
FIGURE C8: SALARY STRUCTURE TRENDS
NonmanagementSalaried
ManagementSalaried Officers/Executives
1992 - 2.7 2.6 2.2
1993 - 1.4 1.3 1.8
1994 - 1.0 0.9 0.8
1995 - 1.1 1.1 1.0
1996 2.2 2.2 2.3 2.3
1997 1.6 1.7 1.8 1.8
1998 1.8 2.3 2.6 2.8
1999 1.7 1.8 1.9 1.8
2000 1.6 2.1 2.2 2.3
2001 2.3 2.6 2.6 2.9
2002 2.0 2.0 2.0 2.0
2003 1.6 1.9 2.0 2.1
2004 Projected 1.9 2.1 2.1 2.1
NonmanagementHourly NonunionYear
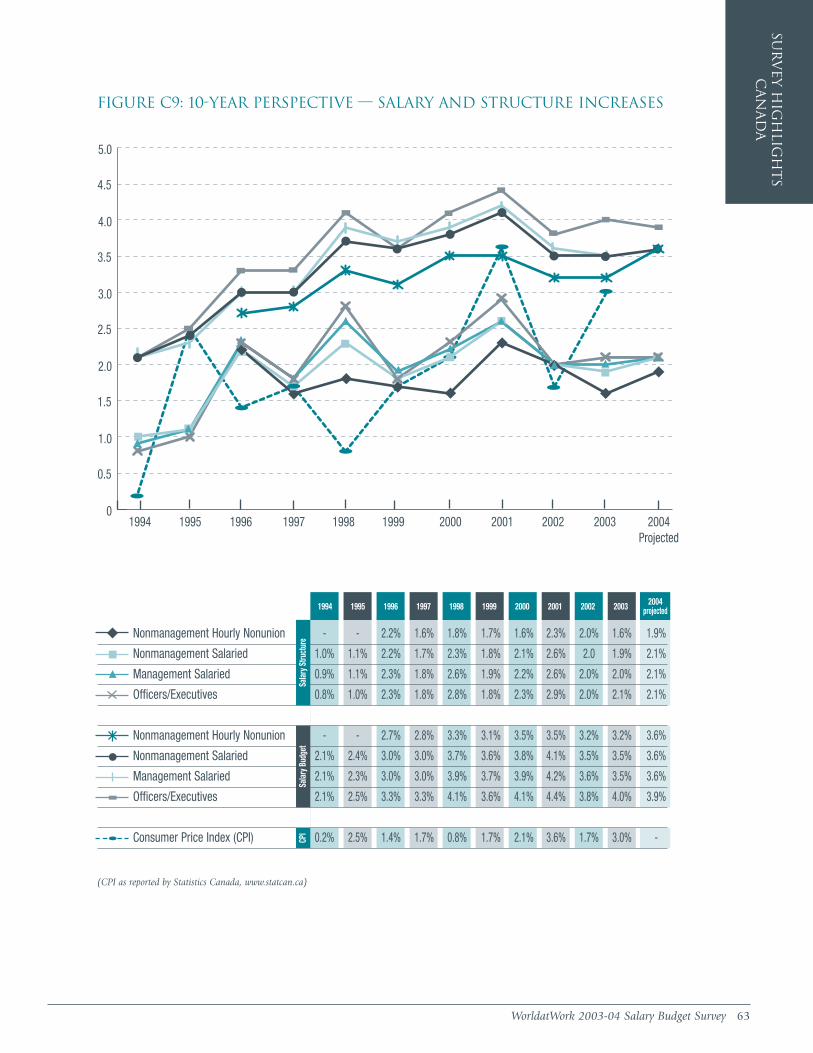
WorldatWork 2003-04 Salary Budget Survey 63
Sur
vey H
igh
ligh
ts
Ca
na
da
1994 1995 1996 1997 1998 1999 2000 2001 2002 2003 2004projected
0
1.0
2.0
3.0
4.0
5.0
0.5
1.5
2.5
3.5
4.5
1994 1995 1996 1997 1998 1999 2000 2001 2002 2003 2004 Projected
FIGURE C9: 10-YEAR PERSPECTIVE — SALARY AND STRUCTURE INCREASES
Nonmanagement Hourly Nonunion - - 2.2% 1.6% 1.8% 1.7% 1.6% 2.3% 2.0% 1.6% 1.9%
Nonmanagement Salaried 1.0% 1.1% 2.2% 1.7% 2.3% 1.8% 2.1% 2.6% 2.0 1.9% 2.1%
Management Salaried 0.9% 1.1% 2.3% 1.8% 2.6% 1.9% 2.2% 2.6% 2.0% 2.0% 2.1%
Officers/Executives 0.8% 1.0% 2.3% 1.8% 2.8% 1.8% 2.3% 2.9% 2.0% 2.1% 2.1%
Nonmanagement Hourly Nonunion - - 2.7% 2.8% 3.3% 3.1% 3.5% 3.5% 3.2% 3.2% 3.6%
Nonmanagement Salaried 2.1% 2.4% 3.0% 3.0% 3.7% 3.6% 3.8% 4.1% 3.5% 3.5% 3.6%
Management Salaried 2.1% 2.3% 3.0% 3.0% 3.9% 3.7% 3.9% 4.2% 3.6% 3.5% 3.6%
Officers/Executives 2.1% 2.5% 3.3% 3.3% 4.1% 3.6% 4.1% 4.4% 3.8% 4.0% 3.9%
Consumer Price Index (CPI) 0.2% 2.5% 1.4% 1.7% 0.8% 1.7% 2.1% 3.6% 1.7% 3.0% -
(CPI as reported by Statistics Canada, www.statcan.ca)
Salar
y Stru
ctur
e Sa
lary B
udge
t CP
I
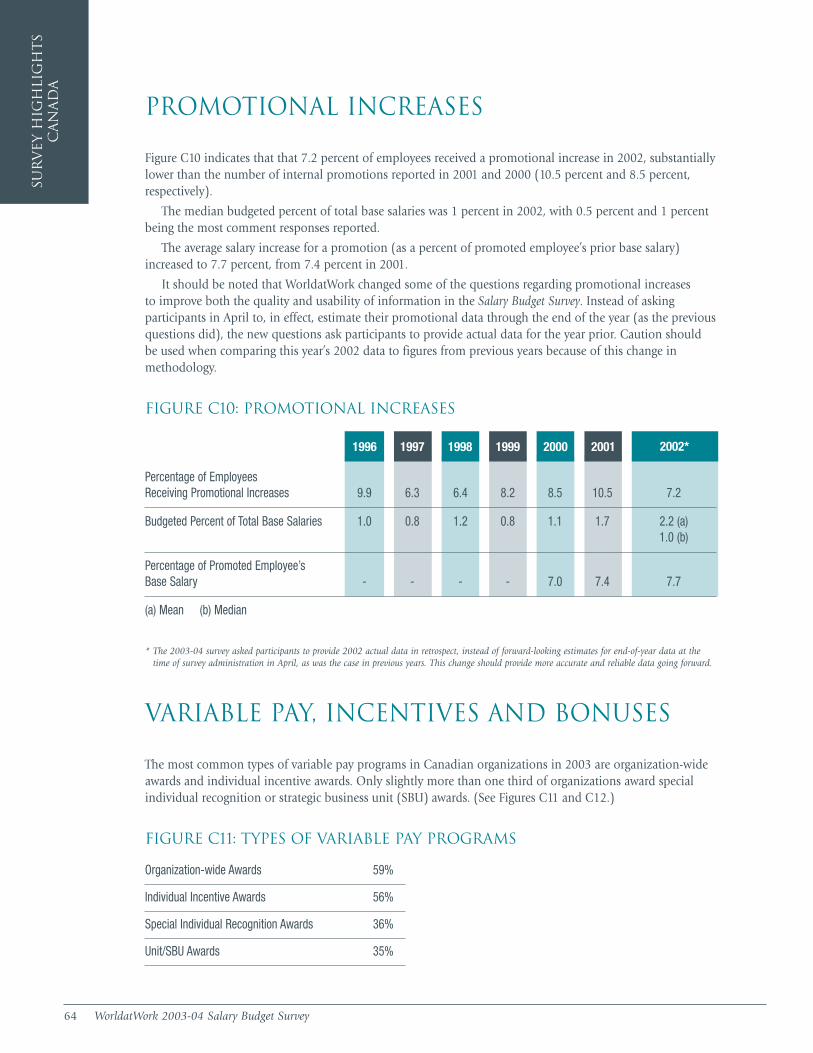
Sur
vey H
igh
lig
ht
sC
an
ad
a
64 WorldatWork 2003-04 Salary Budget Survey
Promotional Increases
Figure C10 indicates that that 7.2 percent of employees received a promotional increase in 2002, substantiallylower than the number of internal promotions reported in 2001 and 2000 (10.5 percent and 8.5 percent,respectively).
The median budgeted percent of total base salaries was 1 percent in 2002, with 0.5 percent and 1 percentbeing the most comment responses reported.
The average salary increase for a promotion (as a percent of promoted employee’s prior base salary)increased to 7.7 percent, from 7.4 percent in 2001.
It should be noted that WorldatWork changed some of the questions regarding promotional increases to improve both the quality and usability of information in the Salary Budget Survey. Instead of asking participants in April to, in effect, estimate their promotional data through the end of the year (as the previousquestions did), the new questions ask participants to provide actual data for the year prior. Caution shouldbe used when comparing this year’s 2002 data to figures from previous years because of this change inmethodology.
FIGURE C10: PROMOTIONAL INCREASES
Percentage of Employees Receiving Promotional Increases 9.9 6.3 6.4 8.2 8.5 10.5 7.2
Budgeted Percent of Total Base Salaries 1.0 0.8 1.2 0.8 1.1 1.7 2.2 (a)1.0 (b)
Percentage of Promoted Employee’s Base Salary - - - - 7.0 7.4 7.7
(a) Mean (b) Median
* The 2003-04 survey asked participants to provide 2002 actual data in retrospect, instead of forward-looking estimates for end-of-year data at thetime of survey administration in April, as was the case in previous years. This change should provide more accurate and reliable data going forward.
1996 1997 1998 1999 2000 2001
Variable Pay, Incentives and Bonuses
The most common types of variable pay programs in Canadian organizations in 2003 are organization-wideawards and individual incentive awards. Only slightly more than one third of organizations award specialindividual recognition or strategic business unit (SBU) awards. (See Figures C11 and C12.)
FIGURE C11: TYPES OF VARIABLE PAY PROGRAMS
Organization-wide Awards 59%
Individual Incentive Awards 56%
Special Individual Recognition Awards 36%
Unit/SBU Awards 35%
2002*

WorldatWork 2003-04 Salary Budget Survey 65
Sur
vey H
igh
ligh
ts
Ca
na
da
NonmanagementSalaried
ManagementSalaried
Officers/Executive
NonmanagementHourly Nonunion
FIGURE C12: 2002-2004 VARIABLE PAY PROGRAMS
Stock/Equity-Based CompensationPrograms
Stock-based incentive programs continue to be popular in Canada with 74 percent of 2003-04 survey respondents with stock using it for variable compensation programs. This is an increase over 2002, when 58 percent reported using stock. The most common programs across all organizations are stock options. (See Figure C13.)
FIGURE C13: TYPES OF STOCK-BASED INCENTIVE PROGRAMS OFFERED BY EMPLOYEE CATEGORY (All public and private companies offering stock-based incentive programs, n=128)
Nonmanagement Hourly Nonunion 9% 2% 2% 2% 1%
Nonmanagement Salaried 26% 3% 3% 2% 2%
Management Salaried 54% 9% 5% 8% 6%
Officers/Executives 79% 11% 9% 16% 15%
Stock OptionProgram
Stock GrantProgram
PhantomStock/SAR
Restricted Stock
PerformanceShares
2002 2002 budgeted incentive (as a percentage of base pay) 6.6 7.6 13.7 28.2
2002 actual paid incentive (as a percentage of base pay) 4.8 7.6 13.2 27.6
Percent of employees eligible in 2002 for variable pay 84.5 85.6 88.6 95.3
Percent of employees actually paid variable pay for 2002 75.1 77.7 82.4 89.4
2003 2003 budgeted incentive target 7.6 8.5 14.6 28.7
2003 awarded incentive (estimate) 7.3 8.9 14.0 25.5
2004 2004 budgeted incentive target 6.3 7.7 14.3 29.4
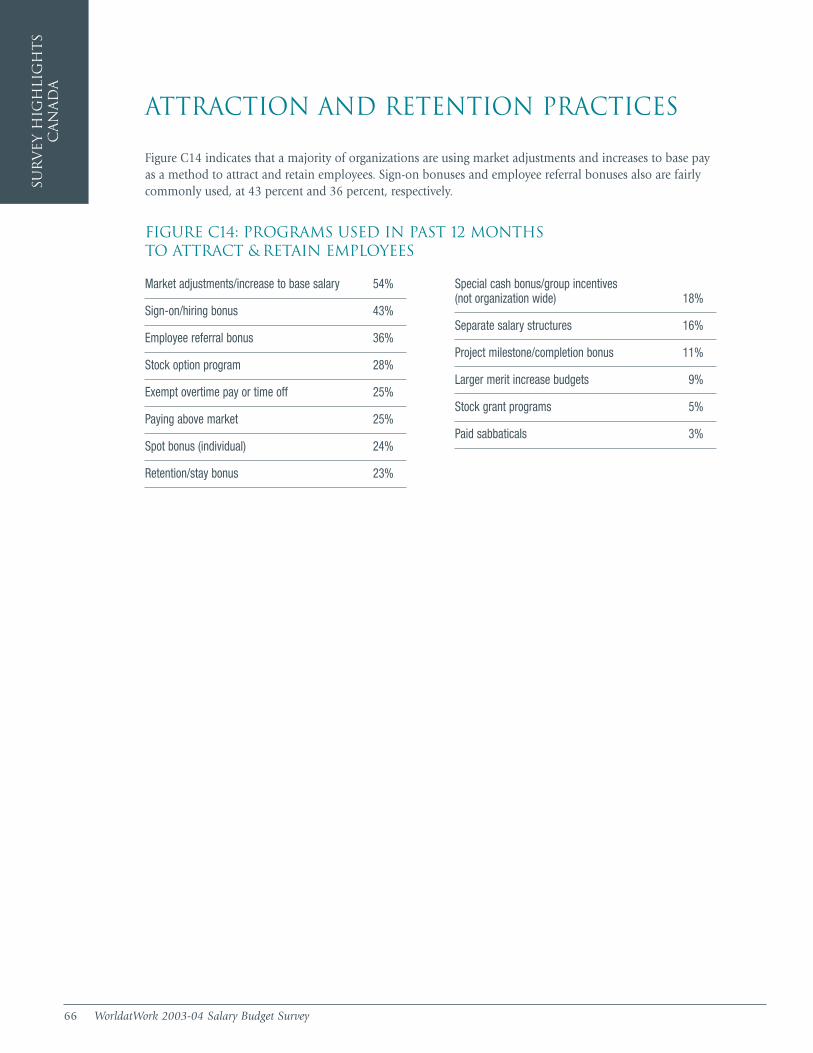
66 WorldatWork 2003-04 Salary Budget Survey
Sur
vey H
igh
lig
ht
sC
an
ad
a
Attraction and Retention Practices
Figure C14 indicates that a majority of organizations are using market adjustments and increases to base payas a method to attract and retain employees. Sign-on bonuses and employee referral bonuses also are fairlycommonly used, at 43 percent and 36 percent, respectively.
FIGURE C14: PROGRAMS USED IN PAST 12 MONTHS TO ATTRACT & RETAIN EMPLOYEES
Market adjustments/increase to base salary 54%
Sign-on/hiring bonus 43%
Employee referral bonus 36%
Stock option program 28%
Exempt overtime pay or time off 25%
Paying above market 25%
Spot bonus (individual) 24%
Retention/stay bonus 23%
Special cash bonus/group incentives (not organization wide) 18%
Separate salary structures 16%
Project milestone/completion bonus 11%
Larger merit increase budgets 9%
Stock grant programs 5%
Paid sabbaticals 3%

WorldatWork 2003-04 Salary Budget Survey 67
2003 Actual Increases 2004 Projected Increases
NONMANAGEMENT HOURLY NONUNION EMPLOYEES
GENERALINCREASE/
COLA
MERITINCREASE
OTHERINCREASE
TOTALINCREASE
MONTHSBETWEEN
INCREASES
% OF EERECEIVINGINCREASE IN 2003
% n % n % n % n Mo. n % n
GENERALINCREASE/
COLA
MERITINCREASE
OTHERINCREASE
TOTALINCREASE
MONTHSBETWEEN
INCREASES
% n % n % n % n Mo. n
INDUSTRY
Nat
ion
al D
ata
Ca
na
da
* Fewer than five survey respondents ** Total line reflects all data submitted – No DataMining = Industry Group
Metal Mfg = Industry Subgroup
Key:
Accommodation & Food Services
Administrative Support & Waste Mgmt.
Agriculture, Forestry, Fishing & Hunting
Arts, Entertainment & Recreation
Construction
Consulting, Prof., Scientific & Tech. Svcs.
Educational Services
Finance & Insurance
Credit Intermediation & Related Activities
Securities, Commodities & Other Investments
Insurance Carriers & Related Activities
Health Care & Social Assistance
Information
Manufacturing
Food, Beverage & Tobacco Product Mfg.
Chemical Mfg.
Computer, Electrical, Appliance Product Mfg.
Metal Mfg.
Mining
Other Services (except Public Admin.)
Public Administration
Real Estate, Rental & Leasing
Retail Trade
Telecommunications
Transportation
Utilities
Wholesale Trade
Total
* * * * * * * * * * * * * * * * * * * * * *
* * * * * * * * * * * * * * * * * * * * * *
- - - - - - - - - - - - - - - - - - - - - -
* * * * * * * * * * * * * * * * * * * * * *
* * * * * * * * * * * * * * * * * * * * * *
1.8 3 2.8 7 0.7 3 3.1 9 12.0 9 89.9 8 2.5 2 3.0 5 1.1 4 3.4 7 12.0 6
* * * * * * * * * * * * * * * * * * * * * *
1.1 4 2.3 7 0.5 2 2.7 8 11.3 8 80.4 8 2.0 2 2.9 5 1.0 1 3.3 6 12.0 7
* * * * * * * * * * * * * * * * * * * * * *
* * * * * * * * * * * * * * * * * * * * * *
* * * * * * * * * * * * * * * * * * * * * *
* * * * * * * * * * * * * * * * * * * * * *
0.0 1 2.5 4 1.5 2 2.6 5 12.0 5 58.6 5 0.0 1 2.8 4 1.5 2 2.8 5 12.0 5
2.4 23 2.2 24 0.9 10 3.0 39 12.0 39 85.3 37 2.2 19 2.6 18 1.5 6 3.1 32 11.6 32
2.8 3 3.1 4 0.2 1 3.0 7 12.0 7 99.1 7 3.0 3 3.0 4 0.2 1 3.0 7 12.0 7
2.0 3 1.8 4 0.0 1 2.2 6 12.0 6 73.5 6 2.0 3 2.2 3 0.0 1 2.5 5 12.0 4
* * * * * * * * * * * * * * * * * * * * * *
* * * * * * * * * * * * * * * * * * * * * *
3.0 8 4.0 6 0.7 2 4.1 12 12.0 12 98.4 11 2.8 4 3.3 9 - - 4.0 10 12.0 9
* * * * * * * * * * * * * * * * * * * * * *
3.0 4 2.0 3 3.3 3 4.0 7 12.0 7 81.9 7 2.8 4 2.0 4 11.5 2 6.0 7 12.0 7
* * * * * * * * * * * * * * * * * * * * * *
2.6 5 2.7 7 4.0 1 3.3 11 10.4 11 88.5 10 3.3 4 2.9 7 4.0 1 3.4 11 10.6 11
0.0 1 1.3 6 0.2 2 1.4 6 16.0 6 48.8 6 * * * * * * * * * *
1.5 4 2.5 5 0.0 1 3.0 6 10.0 6 78.6 5 * * * * * * * * * *
* * * * * * * * * * * * * * * * * * * * * *
* * * * * * * * * * * * * * * * * * * * * *
2.3 62 2.5 82 1.3 27 3.2 121 11.9 121 84.9 114 2.4 48 2.9 72 2.6 19 3.6 104 11.6 101

Nat
ion
al
Data
Ca
na
da
2003 Actual Increases 2004 Projected Increases
NONMANAGEMENT SALARIED EMPLOYEES
INDUSTRY
68 WorldatWork 2003-04 Salary Budget SurveyMining = Industry Group
Metal Mfg = Industry Subgroup
GENERALINCREASE/
COLA
MERITINCREASE
OTHERINCREASE
TOTALINCREASE
MONTHSBETWEEN
INCREASES
% OF EERECEIVINGINCREASE IN 2003
% n % n % n % n Mo. n % n
GENERALINCREASE/
COLA
MERITINCREASE
OTHERINCREASE
TOTALINCREASE
MONTHSBETWEEN
INCREASES
% n % n % n % n Mo. n
Accommodation & Food Services
Administrative Support & Waste Mgmt.
Agriculture, Forestry, Fishing & Hunting
Arts, Entertainment & Recreation
Construction
Consulting, Prof., Scientific & Tech. Svcs.
Educational Services
Finance & Insurance
Credit Intermediation & Related Activities
Securities, Commodities & Other Investments
Insurance Carriers & Related Activities
Health Care & Social Assistance
Information
Manufacturing
Food, Beverage & Tobacco Product Mfg.
Chemical Mfg.
Computer, Electrical, Appliance Product Mfg.
Metal Mfg.
Mining
Other Services (except Public Admin.)
Public Administration
Real Estate, Rental & Leasing
Retail Trade
Telecommunications
Transportation
Utilities
Wholesale Trade
Total
* Fewer than five survey respondents ** Total line reflects all data submitted – No DataKey:
* * * * * * * * * * * * * * * * * * * * * *
* * * * * * * * * * * * * * * * * * * * * *
* * * * * * * * * * * * * * * * * * * * * *
2.8 3 2.8 3 0.5 1 3.5 5 12.0 5 99.2 5 2.7 3 2.7 3 - - 3.2 5 12.0 4
* * * * * * * * * * * * * * * * * * * * * *
2.1 5 3.0 14 0.8 9 3.5 17 12.7 17 83.6 16 2.3 3 3.1 10 1.0 7 3.4 13 12.5 12
3.2 6 3.3 2 6.0 2 6.3 6 12.0 6 84.4 6 2.8 5 3.0 2 - - 4.0 5 12.0 5
1.7 11 2.7 35 1.3 10 3.3 38 12.2 38 90.4 36 2.2 9 2.9 29 1.6 9 3.5 33 12.0 35
- - 3.0 6 2.0 5 3.5 8 12.8 8 89.7 7 - - 3.1 5 2.2 5 3.8 7 12.0 7
2.2 3 2.4 8 1.0 1 3.0 9 12.0 9 88.5 9 3.0 2 3.1 6 1.0 1 3.2 8 12.0 8
1.5 8 2.7 21 0.6 4 3.4 21 12.0 21 91.5 20 1.9 7 2.7 18 0.8 3 3.6 18 12.0 20
2.8 6 3.0 1 3.3 2 4.4 6 13.0 6 99.0 6 2.8 5 - - 3.3 2 4.1 5 13.2 5
1.5 6 1.8 11 1.4 5 2.4 15 12.0 15 65.3 15 1.8 3 2.9 9 2.0 3 2.9 13 13.8 13
1.9 23 2.8 60 1.7 25 3.6 69 13.1 69 85.1 67 2.1 17 3.2 50 1.9 17 3.8 59 12.4 57
3.5 2 3.1 11 0.2 1 3.4 12 12.0 12 96.5 12 3.4 3 3.2 10 0.4 2 3.6 12 12.0 12
0.6 4 2.3 10 0.7 8 3.1 10 12.0 10 75.5 10 1.3 2 2.8 8 0.9 5 3.7 8 12.0 7
0.0 1 2.1 7 4.8 3 3.6 8 13.9 8 69.4 7 0.0 1 3.6 4 3.0 1 2.9 6 15.0 4
* * * * * * * * * * * * * * * * * * * * * *
2.4 4 4.0 13 1.5 2 4.6 14 12.0 14 96.4 14 3.0 4 3.8 11 - - 4.5 12 12.0 11
2.2 3 2.7 6 5.0 1 4.6 6 11.0 6 98.3 6 1.8 3 3.2 5 - - 4.3 5 10.8 5
3.2 11 2.6 11 2.4 3 4.1 17 12.7 17 85.1 17 2.5 9 2.4 7 2.4 3 3.6 13 12.0 13
* * * * * * * * * * * * * * * * * * * * * *
1.0 2 2.7 12 3.4 1 3.1 12 12.5 12 88.4 11 2.2 1 2.8 12 3.5 1 3.3 12 12.3 12
1.6 6 1.3 15 0.4 5 1.8 17 14.1 17 57.7 17 2.5 4 2.4 10 0.9 3 3.1 12 13.2 10
1.4 8 2.5 9 0.0 1 2.9 12 11.0 12 71.7 11 1.6 5 2.6 8 0.0 1 3.2 9 10.7 9
3.0 4 3.2 8 - - 3.8 10 11.4 10 91.0 10 3.0 4 3.6 5 - - 4.3 7 11.3 8
2.0 1 3.1 8 0.3 2 3.4 8 12.0 8 97.8 8 2.0 1 3.1 8 0.3 2 3.4 8 12.0 8
2.2 101 2.7 217 1.6 70 3.5 262 12.5 262 84.7 255 2.4 78 3.0 178 1.6 49 3.6 221 12.2 217
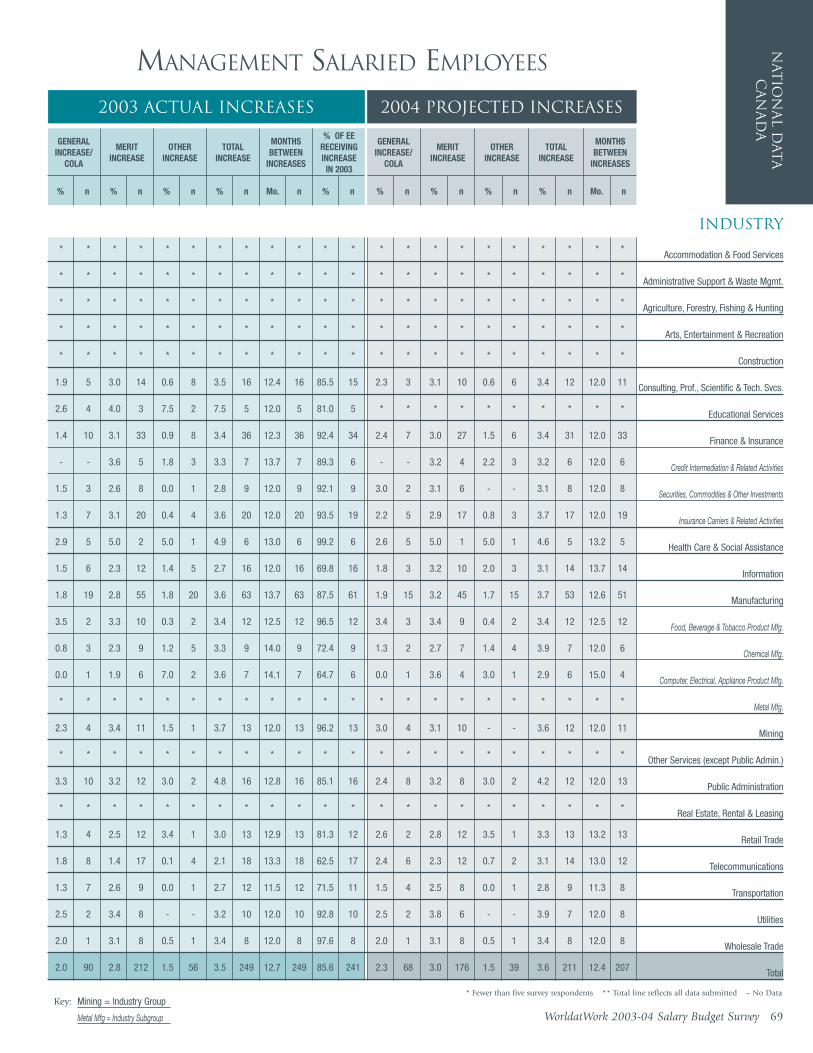
WorldatWork 2003-04 Salary Budget Survey 69
2003 Actual Increases 2004 Projected Increases
MANAGEMENT SALARIED EMPLOYEES
GENERALINCREASE/
COLA
MERITINCREASE
OTHERINCREASE
TOTALINCREASE
MONTHSBETWEEN
INCREASES
% OF EERECEIVINGINCREASE IN 2003
% n % n % n % n Mo. n % n
GENERALINCREASE/
COLA
MERITINCREASE
OTHERINCREASE
TOTALINCREASE
MONTHSBETWEEN
INCREASES
% n % n % n % n Mo. n
INDUSTRY
Nat
ion
al D
ata
Ca
na
da
* Fewer than five survey respondents ** Total line reflects all data submitted – No DataMining = Industry Group
Metal Mfg = Industry Subgroup
Key:
Accommodation & Food Services
Administrative Support & Waste Mgmt.
Agriculture, Forestry, Fishing & Hunting
Arts, Entertainment & Recreation
Construction
Consulting, Prof., Scientific & Tech. Svcs.
Educational Services
Finance & Insurance
Credit Intermediation & Related Activities
Securities, Commodities & Other Investments
Insurance Carriers & Related Activities
Health Care & Social Assistance
Information
Manufacturing
Food, Beverage & Tobacco Product Mfg.
Chemical Mfg.
Computer, Electrical, Appliance Product Mfg.
Metal Mfg.
Mining
Other Services (except Public Admin.)
Public Administration
Real Estate, Rental & Leasing
Retail Trade
Telecommunications
Transportation
Utilities
Wholesale Trade
Total
* * * * * * * * * * * * * * * * * * * * * *
* * * * * * * * * * * * * * * * * * * * * *
* * * * * * * * * * * * * * * * * * * * * *
* * * * * * * * * * * * * * * * * * * * * *
* * * * * * * * * * * * * * * * * * * * * *
1.9 5 3.0 14 0.6 8 3.5 16 12.4 16 85.5 15 2.3 3 3.1 10 0.6 6 3.4 12 12.0 11
2.6 4 4.0 3 7.5 2 7.5 5 12.0 5 81.0 5 * * * * * * * * * *
1.4 10 3.1 33 0.9 8 3.4 36 12.3 36 92.4 34 2.4 7 3.0 27 1.5 6 3.4 31 12.0 33
- - 3.6 5 1.8 3 3.3 7 13.7 7 89.3 6 - - 3.2 4 2.2 3 3.2 6 12.0 6
1.5 3 2.6 8 0.0 1 2.8 9 12.0 9 92.1 9 3.0 2 3.1 6 - - 3.1 8 12.0 8
1.3 7 3.1 20 0.4 4 3.6 20 12.0 20 93.5 19 2.2 5 2.9 17 0.8 3 3.7 17 12.0 19
2.9 5 5.0 2 5.0 1 4.9 6 13.0 6 99.2 6 2.6 5 5.0 1 5.0 1 4.6 5 13.2 5
1.5 6 2.3 12 1.4 5 2.7 16 12.0 16 69.8 16 1.8 3 3.2 10 2.0 3 3.1 14 13.7 14
1.8 19 2.8 55 1.8 20 3.6 63 13.7 63 87.5 61 1.9 15 3.2 45 1.7 15 3.7 53 12.6 51
3.5 2 3.3 10 0.3 2 3.4 12 12.5 12 96.5 12 3.4 3 3.4 9 0.4 2 3.4 12 12.5 12
0.8 3 2.3 9 1.2 5 3.3 9 14.0 9 72.4 9 1.3 2 2.7 7 1.4 4 3.9 7 12.0 6
0.0 1 1.9 6 7.0 2 3.6 7 14.1 7 64.7 6 0.0 1 3.6 4 3.0 1 2.9 6 15.0 4
* * * * * * * * * * * * * * * * * * * * * *
2.3 4 3.4 11 1.5 1 3.7 13 12.0 13 96.2 13 3.0 4 3.1 10 - - 3.6 12 12.0 11
* * * * * * * * * * * * * * * * * * * * * *
3.3 10 3.2 12 3.0 2 4.8 16 12.8 16 85.1 16 2.4 8 3.2 8 3.0 2 4.2 12 12.0 13
* * * * * * * * * * * * * * * * * * * * * *
1.3 4 2.5 12 3.4 1 3.0 13 12.9 13 81.3 12 2.6 2 2.8 12 3.5 1 3.3 13 13.2 13
1.8 8 1.4 17 0.1 4 2.1 18 13.3 18 62.5 17 2.4 6 2.3 12 0.7 2 3.1 14 13.0 12
1.3 7 2.6 9 0.0 1 2.7 12 11.5 12 71.5 11 1.5 4 2.5 8 0.0 1 2.8 9 11.3 8
2.5 2 3.4 8 - - 3.2 10 12.0 10 92.8 10 2.5 2 3.8 6 - - 3.9 7 12.0 8
2.0 1 3.1 8 0.5 1 3.4 8 12.0 8 97.6 8 2.0 1 3.1 8 0.5 1 3.4 8 12.0 8
2.0 90 2.8 212 1.5 56 3.5 249 12.7 249 85.6 241 2.3 68 3.0 176 1.5 39 3.6 211 12.4 207
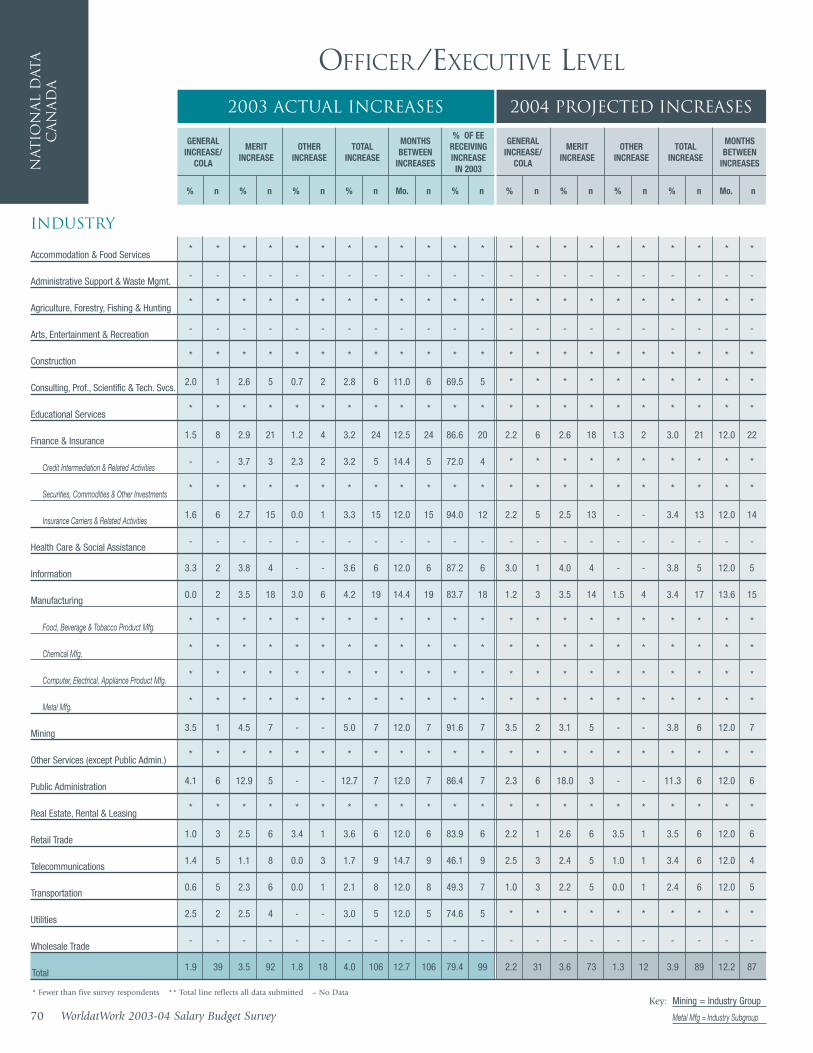
Nat
ion
al
Data
Ca
na
da
2003 Actual Increases 2004 Projected Increases
OFFICER/EXECUTIVE LEVEL
INDUSTRY
70 WorldatWork 2003-04 Salary Budget SurveyMining = Industry Group
Metal Mfg = Industry Subgroup
GENERALINCREASE/
COLA
MERITINCREASE
OTHERINCREASE
TOTALINCREASE
MONTHSBETWEEN
INCREASES
% OF EERECEIVINGINCREASE IN 2003
% n % n % n % n Mo. n % n
GENERALINCREASE/
COLA
MERITINCREASE
OTHERINCREASE
TOTALINCREASE
MONTHSBETWEEN
INCREASES
% n % n % n % n Mo. n
Accommodation & Food Services
Administrative Support & Waste Mgmt.
Agriculture, Forestry, Fishing & Hunting
Arts, Entertainment & Recreation
Construction
Consulting, Prof., Scientific & Tech. Svcs.
Educational Services
Finance & Insurance
Credit Intermediation & Related Activities
Securities, Commodities & Other Investments
Insurance Carriers & Related Activities
Health Care & Social Assistance
Information
Manufacturing
Food, Beverage & Tobacco Product Mfg.
Chemical Mfg.
Computer, Electrical, Appliance Product Mfg.
Metal Mfg.
Mining
Other Services (except Public Admin.)
Public Administration
Real Estate, Rental & Leasing
Retail Trade
Telecommunications
Transportation
Utilities
Wholesale Trade
Total
* Fewer than five survey respondents ** Total line reflects all data submitted – No DataKey:
* * * * * * * * * * * * * * * * * * * * * *
- - - - - - - - - - - - - - - - - - - - - -
* * * * * * * * * * * * * * * * * * * * * *
- - - - - - - - - - - - - - - - - - - - - -
* * * * * * * * * * * * * * * * * * * * * *
2.0 1 2.6 5 0.7 2 2.8 6 11.0 6 69.5 5 * * * * * * * * * *
* * * * * * * * * * * * * * * * * * * * * *
1.5 8 2.9 21 1.2 4 3.2 24 12.5 24 86.6 20 2.2 6 2.6 18 1.3 2 3.0 21 12.0 22
- - 3.7 3 2.3 2 3.2 5 14.4 5 72.0 4 * * * * * * * * * *
* * * * * * * * * * * * * * * * * * * * * *
1.6 6 2.7 15 0.0 1 3.3 15 12.0 15 94.0 12 2.2 5 2.5 13 - - 3.4 13 12.0 14
- - - - - - - - - - - - - - - - - - - - - -
3.3 2 3.8 4 - - 3.6 6 12.0 6 87.2 6 3.0 1 4.0 4 - - 3.8 5 12.0 5
0.0 2 3.5 18 3.0 6 4.2 19 14.4 19 83.7 18 1.2 3 3.5 14 1.5 4 3.4 17 13.6 15
* * * * * * * * * * * * * * * * * * * * * *
* * * * * * * * * * * * * * * * * * * * * *
* * * * * * * * * * * * * * * * * * * * * *
* * * * * * * * * * * * * * * * * * * * * *
3.5 1 4.5 7 - - 5.0 7 12.0 7 91.6 7 3.5 2 3.1 5 - - 3.8 6 12.0 7
* * * * * * * * * * * * * * * * * * * * * *
4.1 6 12.9 5 - - 12.7 7 12.0 7 86.4 7 2.3 6 18.0 3 - - 11.3 6 12.0 6
* * * * * * * * * * * * * * * * * * * * * *
1.0 3 2.5 6 3.4 1 3.6 6 12.0 6 83.9 6 2.2 1 2.6 6 3.5 1 3.5 6 12.0 6
1.4 5 1.1 8 0.0 3 1.7 9 14.7 9 46.1 9 2.5 3 2.4 5 1.0 1 3.4 6 12.0 4
0.6 5 2.3 6 0.0 1 2.1 8 12.0 8 49.3 7 1.0 3 2.2 5 0.0 1 2.4 6 12.0 5
2.5 2 2.5 4 - - 3.0 5 12.0 5 74.6 5 * * * * * * * * * *
- - - - - - - - - - - - - - - - - - - - - -
1.9 39 3.5 92 1.8 18 4.0 106 12.7 106 79.4 99 2.2 31 3.6 73 1.3 12 3.9 89 12.2 87

INDUSTRY
Nat
ion
al D
ata
Ca
na
da
2003 Actual Increases
SALARY STRUCTURE ADJUSTMENTS
NonexemptHourly
Nonunion
NonexemptSalaried
ExemptSalaried
Officer/Executive
% n % n % n % n
2004 Projected Increases
NonexemptHourly
Nonunion
NonexemptSalaried
ExemptSalaried
Officer/Executive
% n % n % n % n
Accommodation & Food Services
Administrative Support & Waste Mgmt.
Agriculture, Forestry, Fishing & Hunting
Arts, Entertainment & Recreation
Construction
Consulting, Prof., Scientific & Tech. Svcs.
Educational Services
Finance & Insurance
Credit Intermediation & Related Activities
Securities, Commodities & Other Investments
Insurance Carriers & Related Activities
Health Care & Social Assistance
Information
Manufacturing
Food, Beverage & Tobacco Product Mfg.
Chemical Mfg.
Computer, Electrical, Appliance Product Mfg.
Metal Mfg.
Mining
Other Services (except Public Admin.)
Public Administration
Real Estate, Rental & Leasing
Retail Trade
Telecommunications
Transportation
Utilities
Wholesale Trade
Total
* * * * * * * * * * * * * * * *
* * * * * * - - * * * * * * - -
- - * * * * * * - - * * * * * *
* * 3.1 5 * * - - * * * * * * - -
* * * * * * - - * * * * * * - -
1.8 5 2.0 10 2.5 10 3.1 5 1.2 6 1.7 8 2.4 8 * *
* * 2.0 6 2.4 5 * * * * 2.1 5 * * * *
1.3 7 1.5 36 1.5 33 1.4 21 2.5 5 1.9 30 1.8 28 1.7 18
* * 1.2 8 1.0 7 * * - - 0.9 7 0.7 6 * *
* * 1.5 7 1.5 7 * * * * 2.4 5 2.2 5 * *
* * 1.6 21 1.8 19 1.7 13 * * 2.1 18 2.0 17 2.0 12
* * * * * * - - * * * * * * - -
0.4 5 1.5 10 1.4 11 * * 1.4 5 1.8 10 1.9 11 * *
1.5 27 1.8 59 2.1 53 2.0 15 2.1 21 2.1 51 2.3 47 2.0 13
* * 2.3 10 2.8 9 * * * * 2.5 9 2.6 8 * *
2.0 5 1.5 9 1.9 6 * * * * 2.6 7 3.3 5 * *
* * 0.6 7 0.4 5 * * * * 1.4 6 1.6 5 * *
- - 2.0 3 * * * * - - * * * * * *
* * 3.1 8 3.5 7 * * * * 2.7 8 2.6 7 * *
* * 1.9 5 * * * * * * 2.1 5 * * * *
3.3 5 3.0 13 3.1 12 4.8 6 2.2 5 2.3 11 2.2 10 1.8 6
- - - - - - - - - - - - - - - -
1.8 7 1.5 8 1.7 10 * * 2.1 6 2.2 8 2.2 9 * *
0.8 5 1.1 15 1.2 15 1.1 9 * * 1.8 11 1.8 10 1.9 5
0.9 6 1.2 11 1.7 11 1.2 7 1.5 5 1.7 10 1.7 10 0.8 6
- - 2.0 8 1.7 8 - - - - * * * * - -
* * 3.5 8 4.1 8 * * * * 2.4 8 2.4 8 * *
1.6 83 1.9 213 2.0 199 2.1 83 1.9 73 2.1 184 2.1 171 2.1 67
WorldatWork 2003-04 Salary Budget Survey 71
* Fewer than five survey respondents ** Total line reflects all data submitted – No DataMining = Industry Group
Metal Mfg = Industry Subgroup
Key:
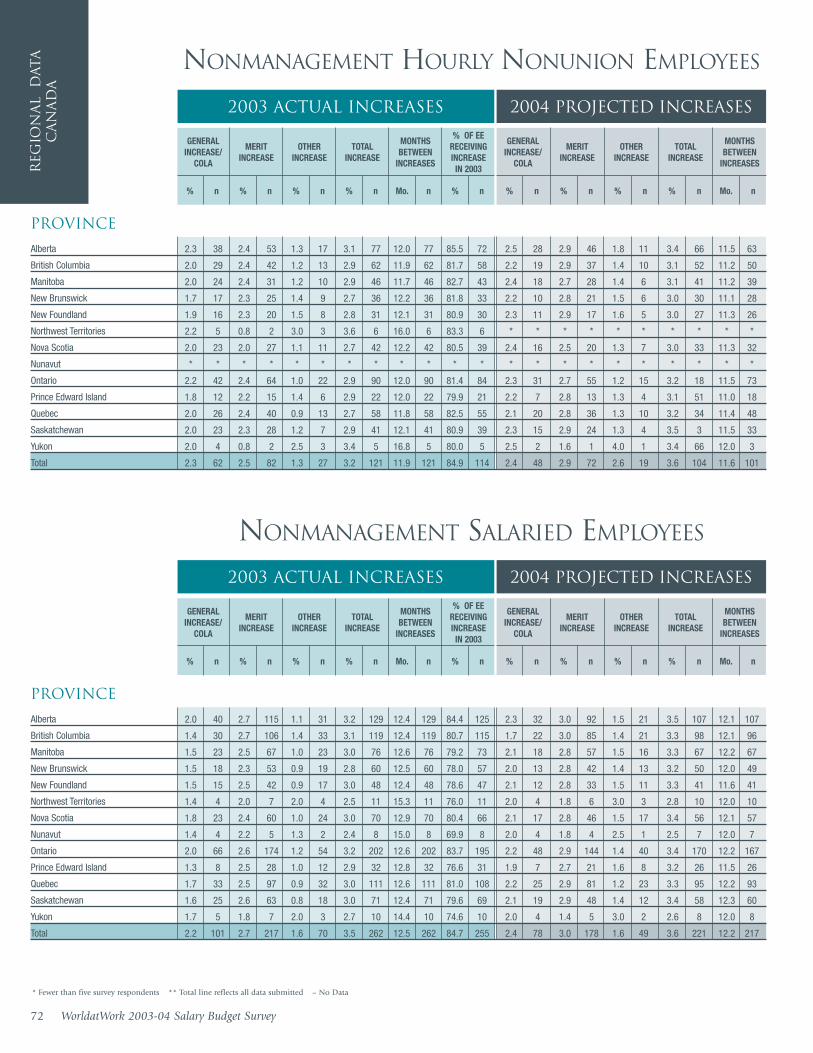
Reg
ion
al
Data
Ca
na
da
2003 Actual Increases 2004 Projected Increases
NONMANAGEMENT HOURLY NONUNION EMPLOYEES
PROVINCE
72 WorldatWork 2003-04 Salary Budget Survey
GENERALINCREASE/
COLA
MERITINCREASE
OTHERINCREASE
TOTALINCREASE
MONTHSBETWEEN
INCREASES
% OF EERECEIVINGINCREASE IN 2003
% n % n % n % n Mo. n % n
GENERALINCREASE/
COLA
MERITINCREASE
OTHERINCREASE
TOTALINCREASE
MONTHSBETWEEN
INCREASES
% n % n % n % n Mo. n
Alberta
British Columbia
Manitoba
New Brunswick
New Foundland
Northwest Territories
Nova Scotia
Nunavut
Ontario
Prince Edward Island
Quebec
Saskatchewan
Yukon
Total
* Fewer than five survey respondents ** Total line reflects all data submitted – No Data
2.3 38 2.4 53 1.3 17 3.1 77 12.0 77 85.5 72 2.5 28 2.9 46 1.8 11 3.4 66 11.5 63
2.0 29 2.4 42 1.2 13 2.9 62 11.9 62 81.7 58 2.2 19 2.9 37 1.4 10 3.1 52 11.2 50
2.0 24 2.4 31 1.2 10 2.9 46 11.7 46 82.7 43 2.4 18 2.7 28 1.4 6 3.1 41 11.2 39
1.7 17 2.3 25 1.4 9 2.7 36 12.2 36 81.8 33 2.2 10 2.8 21 1.5 6 3.0 30 11.1 28
1.9 16 2.3 20 1.5 8 2.8 31 12.1 31 80.9 30 2.3 11 2.9 17 1.6 5 3.0 27 11.3 26
2.2 5 0.8 2 3.0 3 3.6 6 16.0 6 83.3 6 * * * * * * * * * *
2.0 23 2.0 27 1.1 11 2.7 42 12.2 42 80.5 39 2.4 16 2.5 20 1.3 7 3.0 33 11.3 32
* * * * * * * * * * * * * * * * * * * * * *
2.2 42 2.4 64 1.0 22 2.9 90 12.0 90 81.4 84 2.3 31 2.7 55 1.2 15 3.2 18 11.5 73
1.8 12 2.2 15 1.4 6 2.9 22 12.0 22 79.9 21 2.2 7 2.8 13 1.3 4 3.1 51 11.0 18
2.0 26 2.4 40 0.9 13 2.7 58 11.8 58 82.5 55 2.1 20 2.8 36 1.3 10 3.2 34 11.4 48
2.0 23 2.3 28 1.2 7 2.9 41 12.1 41 80.9 39 2.3 15 2.9 24 1.3 4 3.5 3 11.5 33
2.0 4 0.8 2 2.5 3 3.4 5 16.8 5 80.0 5 2.5 2 1.6 1 4.0 1 3.4 66 12.0 3
2.3 62 2.5 82 1.3 27 3.2 121 11.9 121 84.9 114 2.4 48 2.9 72 2.6 19 3.6 104 11.6 101
2003 Actual Increases 2004 Projected Increases
NONMANAGEMENT SALARIED EMPLOYEES
PROVINCE
GENERALINCREASE/
COLA
MERITINCREASE
OTHERINCREASE
TOTALINCREASE
MONTHSBETWEEN
INCREASES
% OF EERECEIVINGINCREASE IN 2003
% n % n % n % n Mo. n % n
GENERALINCREASE/
COLA
MERITINCREASE
OTHERINCREASE
TOTALINCREASE
MONTHSBETWEEN
INCREASES
% n % n % n % n Mo. n
Alberta
British Columbia
Manitoba
New Brunswick
New Foundland
Northwest Territories
Nova Scotia
Nunavut
Ontario
Prince Edward Island
Quebec
Saskatchewan
Yukon
Total
2.0 40 2.7 115 1.1 31 3.2 129 12.4 129 84.4 125 2.3 32 3.0 92 1.5 21 3.5 107 12.1 107
1.4 30 2.7 106 1.4 33 3.1 119 12.4 119 80.7 115 1.7 22 3.0 85 1.4 21 3.3 98 12.1 96
1.5 23 2.5 67 1.0 23 3.0 76 12.6 76 79.2 73 2.1 18 2.8 57 1.5 16 3.3 67 12.2 67
1.5 18 2.3 53 0.9 19 2.8 60 12.5 60 78.0 57 2.0 13 2.8 42 1.4 13 3.2 50 12.0 49
1.5 15 2.5 42 0.9 17 3.0 48 12.4 48 78.6 47 2.1 12 2.8 33 1.5 11 3.3 41 11.6 41
1.4 4 2.0 7 2.0 4 2.5 11 15.3 11 76.0 11 2.0 4 1.8 6 3.0 3 2.8 10 12.0 10
1.8 23 2.4 60 1.0 24 3.0 70 12.9 70 80.4 66 2.1 17 2.8 46 1.5 17 3.4 56 12.1 57
1.4 4 2.2 5 1.3 2 2.4 8 15.0 8 69.9 8 2.0 4 1.8 4 2.5 1 2.5 7 12.0 7
2.0 66 2.6 174 1.2 54 3.2 202 12.6 202 83.7 195 2.2 48 2.9 144 1.4 40 3.4 170 12.2 167
1.3 8 2.5 28 1.0 12 2.9 32 12.8 32 76.6 31 1.9 7 2.7 21 1.6 8 3.2 26 11.5 26
1.7 33 2.5 97 0.9 32 3.0 111 12.6 111 81.0 108 2.2 25 2.9 81 1.2 23 3.3 95 12.2 93
1.6 25 2.6 63 0.8 18 3.0 71 12.4 71 79.6 69 2.1 19 2.9 48 1.4 12 3.4 58 12.3 60
1.7 5 1.8 7 2.0 3 2.7 10 14.4 10 74.6 10 2.0 4 1.4 5 3.0 2 2.6 8 12.0 8
2.2 101 2.7 217 1.6 70 3.5 262 12.5 262 84.7 255 2.4 78 3.0 178 1.6 49 3.6 221 12.2 217
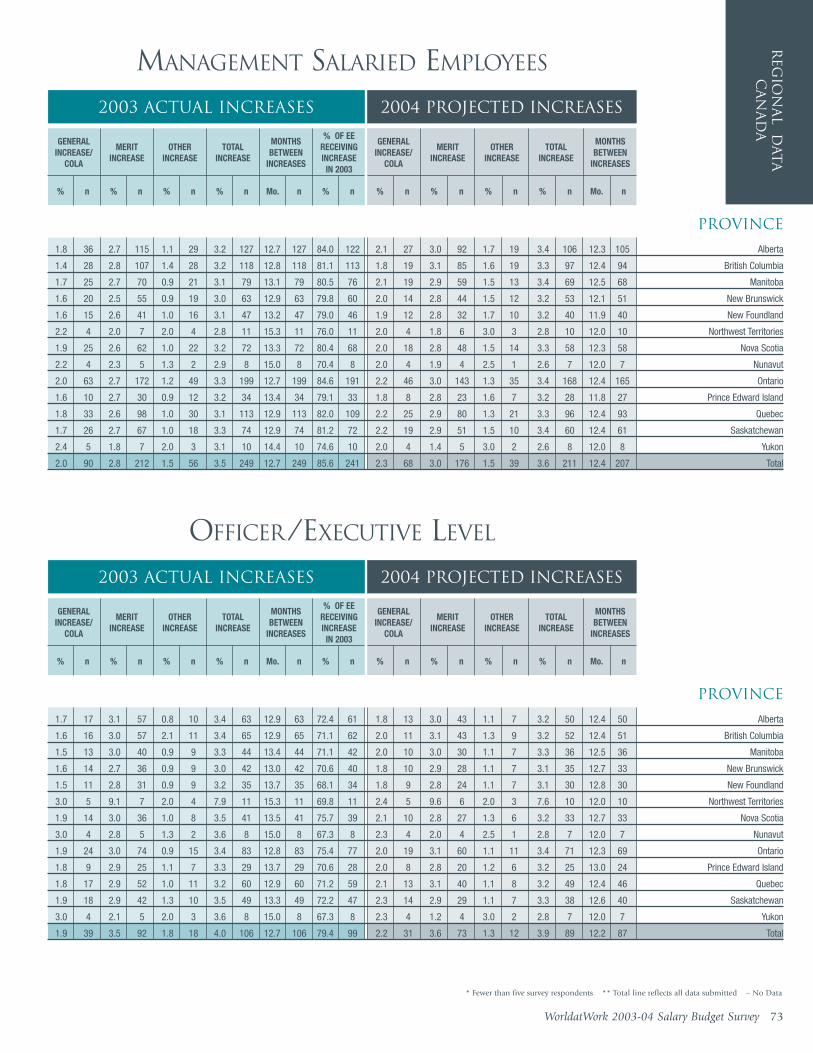
WorldatWork 2003-04 Salary Budget Survey 73
2003 Actual Increases 2004 Projected Increases
MANAGEMENT SALARIED EMPLOYEES
GENERALINCREASE/
COLA
MERITINCREASE
OTHERINCREASE
TOTALINCREASE
MONTHSBETWEEN
INCREASES
% OF EERECEIVINGINCREASE IN 2003
% n % n % n % n Mo. n % n
GENERALINCREASE/
COLA
MERITINCREASE
OTHERINCREASE
TOTALINCREASE
MONTHSBETWEEN
INCREASES
% n % n % n % n Mo. n
PROVINCE
Reg
ion
al D
ata
Ca
na
da
* Fewer than five survey respondents ** Total line reflects all data submitted – No Data
Alberta
British Columbia
Manitoba
New Brunswick
New Foundland
Northwest Territories
Nova Scotia
Nunavut
Ontario
Prince Edward Island
Quebec
Saskatchewan
Yukon
Total
1.8 36 2.7 115 1.1 29 3.2 127 12.7 127 84.0 122 2.1 27 3.0 92 1.7 19 3.4 106 12.3 105
1.4 28 2.8 107 1.4 28 3.2 118 12.8 118 81.1 113 1.8 19 3.1 85 1.6 19 3.3 97 12.4 94
1.7 25 2.7 70 0.9 21 3.1 79 13.1 79 80.5 76 2.1 19 2.9 59 1.5 13 3.4 69 12.5 68
1.6 20 2.5 55 0.9 19 3.0 63 12.9 63 79.8 60 2.0 14 2.8 44 1.5 12 3.2 53 12.1 51
1.6 15 2.6 41 1.0 16 3.1 47 13.2 47 79.0 46 1.9 12 2.8 32 1.7 10 3.2 40 11.9 40
2.2 4 2.0 7 2.0 4 2.8 11 15.3 11 76.0 11 2.0 4 1.8 6 3.0 3 2.8 10 12.0 10
1.9 25 2.6 62 1.0 22 3.2 72 13.3 72 80.4 68 2.0 18 2.8 48 1.5 14 3.3 58 12.3 58
2.2 4 2.3 5 1.3 2 2.9 8 15.0 8 70.4 8 2.0 4 1.9 4 2.5 1 2.6 7 12.0 7
2.0 63 2.7 172 1.2 49 3.3 199 12.7 199 84.6 191 2.2 46 3.0 143 1.3 35 3.4 168 12.4 165
1.6 10 2.7 30 0.9 12 3.2 34 13.4 34 79.1 33 1.8 8 2.8 23 1.6 7 3.2 28 11.8 27
1.8 33 2.6 98 1.0 30 3.1 113 12.9 113 82.0 109 2.2 25 2.9 80 1.3 21 3.3 96 12.4 93
1.7 26 2.7 67 1.0 18 3.3 74 12.9 74 81.2 72 2.2 19 2.9 51 1.5 10 3.4 60 12.4 61
2.4 5 1.8 7 2.0 3 3.1 10 14.4 10 74.6 10 2.0 4 1.4 5 3.0 2 2.6 8 12.0 8
2.0 90 2.8 212 1.5 56 3.5 249 12.7 249 85.6 241 2.3 68 3.0 176 1.5 39 3.6 211 12.4 207
2003 Actual Increases 2004 Projected Increases
OFFICER/EXECUTIVE LEVEL
GENERALINCREASE/
COLA
MERITINCREASE
OTHERINCREASE
TOTALINCREASE
MONTHSBETWEEN
INCREASES
% OF EERECEIVINGINCREASE IN 2003
% n % n % n % n Mo. n % n
GENERALINCREASE/
COLA
MERITINCREASE
OTHERINCREASE
TOTALINCREASE
MONTHSBETWEEN
INCREASES
% n % n % n % n Mo. n
PROVINCE
Alberta
British Columbia
Manitoba
New Brunswick
New Foundland
Northwest Territories
Nova Scotia
Nunavut
Ontario
Prince Edward Island
Quebec
Saskatchewan
Yukon
Total
1.7 17 3.1 57 0.8 10 3.4 63 12.9 63 72.4 61 1.8 13 3.0 43 1.1 7 3.2 50 12.4 50
1.6 16 3.0 57 2.1 11 3.4 65 12.9 65 71.1 62 2.0 11 3.1 43 1.3 9 3.2 52 12.4 51
1.5 13 3.0 40 0.9 9 3.3 44 13.4 44 71.1 42 2.0 10 3.0 30 1.1 7 3.3 36 12.5 36
1.6 14 2.7 36 0.9 9 3.0 42 13.0 42 70.6 40 1.8 10 2.9 28 1.1 7 3.1 35 12.7 33
1.5 11 2.8 31 0.9 9 3.2 35 13.7 35 68.1 34 1.8 9 2.8 24 1.1 7 3.1 30 12.8 30
3.0 5 9.1 7 2.0 4 7.9 11 15.3 11 69.8 11 2.4 5 9.6 6 2.0 3 7.6 10 12.0 10
1.9 14 3.0 36 1.0 8 3.5 41 13.5 41 75.7 39 2.1 10 2.8 27 1.3 6 3.2 33 12.7 33
3.0 4 2.8 5 1.3 2 3.6 8 15.0 8 67.3 8 2.3 4 2.0 4 2.5 1 2.8 7 12.0 7
1.9 24 3.0 74 0.9 15 3.4 83 12.8 83 75.4 77 2.0 19 3.1 60 1.1 11 3.4 71 12.3 69
1.8 9 2.9 25 1.1 7 3.3 29 13.7 29 70.6 28 2.0 8 2.8 20 1.2 6 3.2 25 13.0 24
1.8 17 2.9 52 1.0 11 3.2 60 12.9 60 71.2 59 2.1 13 3.1 40 1.1 8 3.2 49 12.4 46
1.9 18 2.9 42 1.3 10 3.5 49 13.3 49 72.2 47 2.3 14 2.9 29 1.1 7 3.3 38 12.6 40
3.0 4 2.1 5 2.0 3 3.6 8 15.0 8 67.3 8 2.3 4 1.2 4 3.0 2 2.8 7 12.0 7
1.9 39 3.5 92 1.8 18 4.0 106 12.7 106 79.4 99 2.2 31 3.6 73 1.3 12 3.9 89 12.2 87

74 WorldatWork 2003-04 Salary Budget Survey
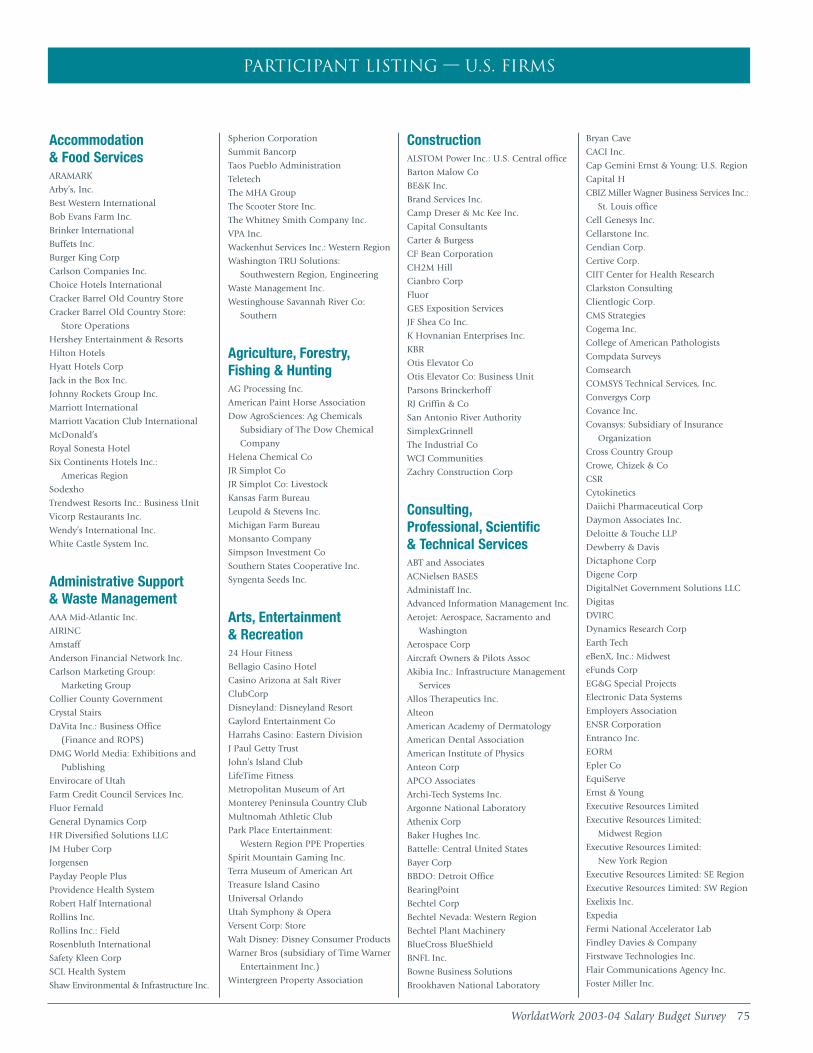
Accommodation & Food ServicesARAMARK
Arby’s, Inc.
Best Western International
Bob Evans Farm Inc.
Brinker International
Buffets Inc.
Burger King Corp
Carlson Companies Inc.
Choice Hotels International
Cracker Barrel Old Country Store
Cracker Barrel Old Country Store:
Store Operations
Hershey Entertainment & Resorts
Hilton Hotels
Hyatt Hotels Corp
Jack in the Box Inc.
Johnny Rockets Group Inc.
Marriott International
Marriott Vacation Club International
McDonald’s
Royal Sonesta Hotel
Six Continents Hotels Inc.:
Americas Region
Sodexho
Trendwest Resorts Inc.: Business Unit
Vicorp Restaurants Inc.
Wendy’s International Inc.
White Castle System Inc.
Administrative Support & Waste ManagementAAA Mid-Atlantic Inc.
AIRINC
Amstaff
Anderson Financial Network Inc.
Carlson Marketing Group:
Marketing Group
Collier County Government
Crystal Stairs
DaVita Inc.: Business Office
(Finance and ROPS)
DMG World Media: Exhibitions and
Publishing
Envirocare of Utah
Farm Credit Council Services Inc.
Fluor Fernald
General Dynamics Corp
HR Diversified Solutions LLC
JM Huber Corp
Jorgensen
Payday People Plus
Providence Health System
Robert Half International
Rollins Inc.
Rollins Inc.: Field
Rosenbluth International
Safety Kleen Corp
SCL Health System
Shaw Environmental & Infrastructure Inc.
Spherion Corporation
Summit Bancorp
Taos Pueblo Administration
Teletech
The MHA Group
The Scooter Store Inc.
The Whitney Smith Company Inc.
VPA Inc.
Wackenhut Services Inc.: Western Region
Washington TRU Solutions:
Southwestern Region, Engineering
Waste Management Inc.
Westinghouse Savannah River Co:
Southern
Agriculture, Forestry,Fishing & HuntingAG Processing Inc.
American Paint Horse Association
Dow AgroSciences: Ag Chemicals
Subsidiary of The Dow Chemical
Company
Helena Chemical Co
JR Simplot Co
JR Simplot Co: Livestock
Kansas Farm Bureau
Leupold & Stevens Inc.
Michigan Farm Bureau
Monsanto Company
Simpson Investment Co
Southern States Cooperative Inc.
Syngenta Seeds Inc.
Arts, Entertainment & Recreation24 Hour Fitness
Bellagio Casino Hotel
Casino Arizona at Salt River
ClubCorp
Disneyland: Disneyland Resort
Gaylord Entertainment Co
Harrahs Casino: Eastern Division
J Paul Getty Trust
John’s Island Club
LifeTime Fitness
Metropolitan Museum of Art
Monterey Peninsula Country Club
Multnomah Athletic Club
Park Place Entertainment:
Western Region PPE Properties
Spirit Mountain Gaming Inc.
Terra Museum of American Art
Treasure Island Casino
Universal Orlando
Utah Symphony & Opera
Versent Corp: Store
Walt Disney: Disney Consumer Products
Warner Bros (subsidiary of Time Warner
Entertainment Inc.)
Wintergreen Property Association
ConstructionALSTOM Power Inc.: U.S. Central office
Barton Malow Co
BE&K Inc.
Brand Services Inc.
Camp Dreser & Mc Kee Inc.
Capital Consultants
Carter & Burgess
CF Bean Corporation
CH2M Hill
Cianbro Corp
Fluor
GES Exposition Services
JF Shea Co Inc.
K Hovnanian Enterprises Inc.
KBR
Otis Elevator Co
Otis Elevator Co: Business Unit
Parsons Brinckerhoff
RJ Griffin & Co
San Antonio River Authority
SimplexGrinnell
The Industrial Co
WCI Communities
Zachry Construction Corp
Consulting,Professional, Scientific & Technical ServicesABT and Associates
ACNielsen BASES
Administaff Inc.
Advanced Information Management Inc.
Aerojet: Aerospace, Sacramento and
Washington
Aerospace Corp
Aircraft Owners & Pilots Assoc
Akibia Inc.: Infrastructure Management
Services
Allos Therapeutics Inc.
Alteon
American Academy of Dermatology
American Dental Association
American Institute of Physics
Anteon Corp
APCO Associates
Archi-Tech Systems Inc.
Argonne National Laboratory
Athenix Corp
Baker Hughes Inc.
Battelle: Central United States
Bayer Corp
BBDO: Detroit Office
BearingPoint
Bechtel Corp
Bechtel Nevada: Western Region
Bechtel Plant Machinery
BlueCross BlueShield
BNFL Inc.
Bowne Business Solutions
Brookhaven National Laboratory
Bryan Cave
CACI Inc.
Cap Gemini Ernst & Young: U.S. Region
Capital H
CBIZ Miller Wagner Business Services Inc.:
St. Louis office
Cell Genesys Inc.
Cellarstone Inc.
Cendian Corp.
Certive Corp.
CIIT Center for Health Research
Clarkston Consulting
Clientlogic Corp.
CMS Strategies
Cogema Inc.
College of American Pathologists
Compdata Surveys
Comsearch
COMSYS Technical Services, Inc.
Convergys Corp
Covance Inc.
Covansys: Subsidiary of Insurance
Organization
Cross Country Group
Crowe, Chizek & Co
CSR
Cytokinetics
Daiichi Pharmaceutical Corp
Daymon Associates Inc.
Deloitte & Touche LLP
Dewberry & Davis
Dictaphone Corp
Digene Corp
DigitalNet Government Solutions LLC
Digitas
DVIRC
Dynamics Research Corp
Earth Tech
eBenX, Inc.: Midwest
eFunds Corp
EG&G Special Projects
Electronic Data Systems
Employers Association
ENSR Corporation
Entranco Inc.
EORM
Epler Co
EquiServe
Ernst & Young
Executive Resources Limited
Executive Resources Limited:
Midwest Region
Executive Resources Limited:
New York Region
Executive Resources Limited: SE Region
Executive Resources Limited: SW Region
Exelixis Inc.
Expedia
Fermi National Accelerator Lab
Findley Davies & Company
Firstwave Technologies Inc.
Flair Communications Agency Inc.
Foster Miller Inc.
WorldatWork 2003-04 Salary Budget Survey 75
Participant Listing — U.S. Firms
76 WorldatWork 2003-04 Salary Budget Survey
Framatome Technologies Inc.
Franklin Covey Co: OSBU
Fred Hutchinson Cancer Research Center
Genentech Inc.
General Atomics
General Dynamics: General Dynamics-
Advanced Information Systems
Grant Thornton LLP
H&R Block
H&R Block: Tax Services - Tax Field
HDR Inc.
Headstrong
Heat Transfer Research Inc.
Heller Draper Hayden Patrick & Horn
Hewitt Associates LLC
HF Lenz Company
Hill Holliday
Hitachi Chemical Research Center:
Western - R&D
HNTB Corp
Howard Hughes Medical Institute
HRadvantage LLC
HRL Laboratories LLC
Idealab
InfoTechWorks
Insurance Information Institute
InterCept
Intier Automotive Seating:
Engineering Division
Intuitive HR
ITT Industries
JD Power & Associates
Jeanneret & Associates Inc.
Jefferson Lab
Jenkens & Gilchrist PC
Johnson & Johnson
Kanbay Inc.
Keane Inc.
Kemia Inc.
KPMG
Laboratory Corporation of America
Lawrence Berkeley National Laboratory
Leica Microsystems: North America
Selling Unit
LHB Engineers & Architects
Linda Crow Consulting
Lockheed Martin
Lockheed Martin - KAPL, Inc.:
Eastern Region, Applied R&D
Lockheed Martin: Department of Energy
Contractor, Southern region, Y-12 Plant
LOMA
Manpower
MedVenture Technology
Merit Resource Group Inc.
Milliman USA
Mitre Corp
Mountain States Employers Council Inc.
NAC International
National Academies
National Food Processors Association
National Renewable Energy Lab
Naylor Group LLC
Neoris
Noesis Inc.
Northrop Grumman Corp:
Information Technology
Oak Ridge Associated Universities
Oak Ridge National Laboratory
Openwave Systems, Inc.
Overton Consulting Inc.
Pacific Inst for Research & Evaluation
Parexel International
Parsons
Paymentech Inc.
PCTEL
PerkinElmer: Divisional Business Unit
Headquarters
Phase Forward Incorporated
Pierce Atwood
Population Council
Post Buckley Schuh & Jernigan
Promega
PRT Group Inc.
PTC
Public Sector Personnel Consultants
QTI Consulting
Quintiles
Quorum Group Inc.
Rand
Ray Associates
Red Hat Inc.
Requisite Technology
RG Bauer & Associates
Ribapharm
Richards, Layton & Finger
RMT
Rockwell Science Center
Runzheimer International
S&H Greenpoints
S1 Corp
SAIC
SAIC-Frederick, Inc.: Biomedical
Research and Development
Sandia National Laboratories
Scientific Research Corp
Serono Laboratories Inc.: U.S. Region
Signature Compensation Design
Software & Services of Louisiana Inc.
Southwest Research Institute
Spacehab Inc.
SRI International
Stantec Consulting: U.S. Southeast
and US Southwest
Stanton Group, Inc.
Strategic Pay Partners
Susan A. Dussault
Sverdrup Technology Inc.
Sykes Enterprises Inc.
Symantec Corp
Syntegra: U.S.A.
Syzygy Consulting Group
Teledyne Brown Engineering
Tetra Tech EMI
The Johns Hopkins University/Applied
Physics Laboratory
The Management Association of Illinois
The Network Group
The Noble Foundation
The Personnel Perspective
The Salk Institute
The Survey Group
Titan Jaycor: Administrative Division
Towers Perrin
Towers Perrin: Chicago Office
Toyota Technical Center USA Inc.
TransCore
Travis County Medical Society
UCAR
Underwriters Laboratories Inc.
Unisys
User Technology Associates Inc.
UT Battelle LLC
Verifone: Petro C-store
Vinson & Elkins LLP
Vytek
Wackenhut Services Inc.: Aiken SC
Washington Demilitarization Company:
Umatilla Project
Washington Group International
Watson Wyatt Worldwide
Welch Associates
Weltman Weinberg & Reis
Westinghouse Electric
Wilmer Cutler & Pickering
Wipfli Ullrich Bertelson LLP
Woods Hole Oceanographic Inst
ZymoGenetics Inc.
Educational ServicesAlbemarle County: School Division -
Non-Teachers
Albemarle County: School Division -
Teachers Only
American Board of Internal Medicine
American Council on Education
American Public University System
Arizona State University West
Ball State University
Baylor College of Medicine
Boston College
Boy Scouts of America
Brigham Young University
Brooklyn Public Library
Brown University
California Institute of Technology
California State University
Capital Associated Industries Inc.
Carnegie Mellon University
Central Michigan University
Committee For Children
Duke University
Eastern Illinois University
Eastern Michigan University
Edfund
Education Development Center
Emory University
ERI Economic Research Institute
ETS Inc.
Fairfax County Public Schools
Fairleigh Dickinson University
Iowa Student Loan Liquidity Corp
ITT Educational Services Inc.
Johns Hopkins University
Kamehameha Schools
L-3 Link Simulation & Training
Macalester College
Madonna University
Massachusetts Institute of Technology
Mercer University:
Macon and Atlanta Campuses
Milton Hershey School
Mount Holyoke College
National Board of Medical Examiners
National School Boards Association
NCJFCJ
NCJFCJ: Mid West, Research Division
Northeastern University
Northern Arizona University
Northside ISD
Northwestern University
Peirce College
Pennsylvania State University
Phillips Exeter Academy
Princeton University
Project Hope
Rensselaer Polytechnic Institute
Rhode Island School of Design
Rice University
Rutgers University
Seattle University
Smith College
Southern Methodist University
St John’s University
Stanford University
Swarthmore College
Sylvan Learning Systems Inc.
Texas Guaranteed Student Loan Corp
The American College
The Association of Former Students
The College Board
The Ohio State University
Tufts University
Universal Technical Institute
University of Arizona, HR
University of California at Berkeley
University of California at San Diego:
San Diego campus of multi-campus
university
University of Chicago
University of Dayton
University of Houston at Clear Lake
University of Iowa Foundation
University of Louisiana at Lafayette
University of Maryland, Baltimore
University of Michigan
University of MO-KC
University of Nebraska Lincoln
University of Nebraska Medical Center:
Medical/Allied Health School Campus
University of New Mexico
United States
WorldatWork 2003-04 Salary Budget Survey 77
University of Oklahoma
University of Pittsburgh
University of Rochester
University of Texas at El Paso
University of Texas Health & Science
University of Toledo
University of Virginia
University of Washington
Valley Forge Christian College
Vanderbilt University
Vinnell Corp: Enterprise Management
Services
Wackenhut Services Inc.: WSI-NNSI
Walsh College
Washington University
Washington University
Wellesley College
Wright State University
Yale University
Finance & InsuranceBoard of Governers Fed Reserve Sys
Federal Reserve Bank of Atlanta
Federal Reserve Bank of Boston
Federal Reserve Bank of Chicago
Federal Reserve Bank of Cleveland
Federal Reserve Bank of Dallas
Federal Reserve Bank of Kansas City
Federal Reserve Bank of New York
Federal Reserve Bank of Philadelphia
Federal Reserve Bank of Richmond
Federal Reserve Bank of San Francisco
International Monetary Fund
Finance & InsuranceCredit Intermediation & Related Activities1st Farm Credit Services
Advanta
Aegis Mortgage Corp
AgriBank FCB
AgStar Financial Services
Amcore Bank Inc.
American General
AmSouth Bank
Associated Banc Corp Services
Astoria Federal Savings
Bank of Hawaii
Bank of the West
Bankers Trust Co
Banknorth Group Inc.
BB&T
Bluebonnet Federal Credit Union
Boeing Employees Credit Union
BOK Financial Corp
Bombardier Capital Inc.
Bremer Financial Services Inc.
California Bank & Trust
Capital One Financial Corp
Cash America International
Catapiller IncFinancial Products Division
Chevy Chase Bank
Chittenden Bank
CIT Group
Citigroup International
Citigroup: Bankcards Organization
Citizens Bank
Citizens Financial Group
Cole Taylor Bank
Colonial BancGroup
Comerica
Commerce Bancshares Inc.
Discover Financial Services:
Credit Card Company
Eastern Bank
Emigrant Savings Bank
Exchange Bank
F&M Bank & Trust Co
Farm Credit Bank of Texas
Federal Home Loan Bank of Cincinnati
Federal Home Loan Bank of Indianapolis
Fifth Third Bank
Finova
First Charter
First Citizens Bank
First Federal Savings Bank
First Merit Corp
First National Bank of Omaha
First Virginia Banks Inc.
Firstmark Services
Fort Knox Federal Credit Union
Hancock Bank
Hibernia National Bank
Home Savings & Loan
HSBC Bank USA
IndyMac Bancorp, Inc.
IndyMac Bancorp, Inc.: Midwest Home
Loan Servicing Center
John Deere Credit Co
JP Morgan & Co: Technology
LaSalle Bank Corporation
Liberty Bank & Trust Co
Luther Burbank Savings & Loan
Lynk
Manufacturers Bank
MasterCard International Inc.
Matrix Bancorp
Mutual Federal Savings Bank
Nationwide Credit Inc.
North Island Federal Credit Union
Nuvell Financial Services Corp
Old National Bancorp
Provident Bank - Eastern Region
PSECU
Republic Bank
Riggs Bank NA
Risk Management
San Antonio Credit Union
Security Service Federal Credit Union
Sovereign Bancorp
Sumitomo Trust & Banking
Company Ltd: NY Branch
Teachers Credit Union
Technology Credit Union
The Bankers Bank
The PNC Financial Services Group, Inc.
The PrivateBank and Trust Co
Trans Union Corp
Transamerica
Triad Financial Corporation
Trustmark National Bank
Tucson Federal Credit Union
UMB Financial Corporation
Union Bank of California
Union Planters Corp
US Bank
Visa International
Wachovia Corp
Washington Trust Bank
Wauwatosa Savings Bank
Wells Fargo & Co
Westcorp
Whitney National Bank
World Savings
Finance & InsuranceFunds, Trusts & Other Financial VehiclesAgFirst Farm Credit Bank
Alliance Mortgage Co
American Express
AmeriCredit Corp
Annuity Board of the SBC
Bank of Utah
Bank One: Retail Lending
Boston Financial Data Services Inc.
Brown Brothers Harriman & Co
California Coast Credit Union
CDC IXIS Asset Management Services Inc.:
Services Division
Citizen Trust Bank
CNB National Bank Florida Bancshares
Coastal Financial Corporation
Collegiate Funding Services LLC
Commercial Federal Bank
Community First Bankshares Inc.
Countrywide Financial Corp
D Hilton Associates
Desert Schools Federal Credit Union
Diversified Investment Advisors
Edward Jones
Ent Federal Credit Union
eOne Global
EQUIX Financial Services
Federal Home Loan Bank of Pittsburgh
Federated Insurance Co
First National Bank Alaska
Fitch Ratings
General Board of Pension
GMAC Residential Funding Corp
Government Employees Credit Union
Great American Federal
HEREIU Welfare/Pension Funds
Household International
Huntington Bancshares Inc.
Investors Bank & Trust
Irwin Financial Corp
Janus Capital Group
John Hancock Financial Services:
Mutual Fund Company
Justice Federal Credit Union
Liberty Bank
M&T Bank
MacGregor
Marshall & Ilsley Corp
Mellon Financial Corp
Metris Companies Inc.
Metropolitain Mortgage
MFS Investment Management
Munder Capital Management
National City Bank
New Century Mortgage
Northern Trust Bank
Nuveen Investments
Ohio Police & Fire Pension Fund
Ohio Savings Bank
Old National Bancorp
PFF Bank & Trust
PFPC
PSCU Financial Services Inc.
Raymond James & Associates
Regions Financial Corp
Ruesch International
Russell Mellon Analytical Services
Rydex Funds
SAIF Corp
Sikorsky Financial Credit Union
Sky Financial Group
Society of Worldwide Finance Telecom:
Americas Division
State Street Corporation
Strong Capital Management Inc.
SunTrust Banks
Synovus Financial Corp
The Capital Group
UBS AG: Wealth Management U.S.
US Federal Credit Union
Volvo Commercial Finance
Washington Mutual
Watermark Credit Union
Finance & InsuranceInsurance Carriers & Related Activities21st Century Insurance Group
AAA California
AAA Life Insurance
Advance PCS
Aegon Corp
AEGON Direct Marketing Services
Aetna
AFLAC
AIG
AIG American General Insurance:
Domestic Life Insurance Operations
AIGM: Division of AIG
AIPSO
Allmerica Financial
United States
78 WorldatWork 2003-04 Salary Budget Survey
Allstate
American Family Insurance Co
American Medical Security
American Re-Insurance Co
American Republic Insurance Co
American United Life
Ameritas Life Insurance Corp
Amica Mutual Insurance Co
Anthem Inc.
Aon Consulting
Aon Consulting: Combined Insurance of
America Underwriting Division
Assurant Group
Auto Club Group The
Automobile Club of Missouri
Automobile Club of Southern California
AXA Financial
Beacon Mutual Insurance Company
Blue Cross and Blue Shield Association
Blue Cross Blue Shield of Kansas City
BlueCross BlueShield of CA
BlueCross BlueShield of FL
Blue Cross of ID
BlueCross BlueShield of IL
BlueCross BlueShield of KS
BlueCross BlueShield of MA
BlueCross BlueShield of MT
BlueCross BlueShield of NC
BlueCross BlueShield of OK
BlueCross BlueShield of PA
BlueCross BlueShield of RI
Blue Cross/Blue Shield of TN
Brady & Co
California Casualty Management Co
Capital Blue Cross
Carefirst BlueCross BlueShield
Carroll Enterprises Inc.
Chubb & Son Inc.
CIGNA
CNA
Cobalt Corporation
ConnectiCare Capital LLC
Conseco
Continental General Insurance Co.:
Senior Division
Converium Reinsurance (North
America): North American Division
Country Insurance & Financial Services
Coventry Health Care Inc.
CUNA Mutual Group
Denta Quest Ventures Inc.
Deseret Mutual
EMC Insurance Company
Erie Insurance Group
Farm Bureau Insurance
Farmers Insurance
FCCI Mutual
Federated Mutual Insurance Companies
Fireman’s Fund Insurance Co
First Health Group Corporation
FM Global
Fortis Family
Fortis Health Care: U.S. Health
Insurance Subsidiary
GE Frankona Re
General Casualty Insurance Company
Germania Insurance Company
GHI
Grange Insurance
Great American Insurance Co
Guardian Life Insurance of America
Harleysville Group Inc.
Harvard Pilgrim Health Care
Health Partners of Philadelphia
Highmark Blue Cross/Blue Shield
Humana
Humana
IMT Insurance Co
Independence Blue Cross
Independent Health
ING Investment Management Americas
Insurance Placement Facility
Inter Valley Health Plan
Jackson National Life Insurance
JLT Services Corporation
Kaiser Foundation Health Plan
Kaiser Permanente Northwest Division:
Colorado Region
Kaiser Permanente: Sales and
Marketing-Small Business Unit
Kansas City Life Insurance Co
Kemper Insurance Companies
LandAmerica Financial Group
Liberty Regional Agency Markets:
Small Business Unit
Lincoln National
Lincoln National Life Insurance Co:
Major Business Unit
Louisiana Medical Mutual Insurance Co
Louisiana Workers Compensation Corp
M Financial Group
Marsh Risk & Insurance Services:
San Diego
MCare: Central Region, Insurance/
Healthplan
Medco Health Solutions Inc.
Medical Mutual of Ohio
Meemic Insurance Co
Metropolitan Life Insurance
MGIC Insurance Corp
Minnesota Life
Motorists Mutual Insurance Company
MSI Insurance
Mutual of Omaha Insurance Co
MVP Health Plan
NAIC
National Assoc of Independant Insurers
National Grange Mutual Insurance
Nationwide
New York Life Insurance
Norcal Mutual Insurance Co
Northwestern Mutual Life Insurance
Ohio Casualty Group
Ohio National Financial Services
One Beacon Insurance
Oregon Mutual Insurance Co
Pacific Life Insurance Company
PacifiCare
Palmer & Cay Inc.
Penn National Insurance Company
Permanent General Companies:
Automobile Insurance - California
Permanent General Companies:
Automobile Insurance - Ohio
Permanent General Companies:
Automobile Insurance - Southeast
Phoenix Wealth Management
Pinnacol Assurance
PMA Group
Premera Blue Cross
Princeton Insurance Company
Principal Financial
Priority Health
Protective Life Corp
Prudential Financial
Reliance Insurance Company
Republic Insurance Co
Royal & SunAlliance Global
ScriptSave
Seibels Bruce Group Inc.
Sentry Insurance
SilverStone Consulting Inc.
Standard Insurance
State Farm Insurance
Sun Life Financial: United States
Operations
Swiss Re Life & Health: U.S. Division
Texas Mutual Insurance Co
The Harleysville Insurance Companies
The Hartford: Indianapolis Personal
Lines Claim Service Center
The Midland Company: Insurance
The Mony Group Inc.
The Progressive Corp
The Providence Washington Companies
The Regence Group
Thrivent Financial for Lutherans
Travelers
TriWest Healthcare Alliance
Trustmark Insurance Co
Tufts Health Plan
Tyco Electronics
Union Central Life Insurance Co
United Government Services LLC:
Medicare Subsidiary
Universal Underwriters Group
UNUM
USAA
Vision Service Plan
WellChoice, Inc.
Wellmark Blue Cross/Blue Shield of Iowa
Western Southern Life Insurance Co
Westfield Group
Willis North America Inc.
Workers’ Comp Reinsurance Assn
XL America
Zurich Insurance Co
Zurich Kemper Life
Finance & InsuranceSecurities, Commodity Contracts & Other FinancialInvestment VehiclesAdvest Inc.
AG Edwards & Sons Inc.
Charles Schwab
Chenega Corporation
Chicago Board of Trade
Chicago Board Options Exchange
Chicago Mercantile Exchange
Credit Suisse First Boston
Dresdner Kleinwort Wasserstein:
North American Operations
DST Systems Inc.
Fannie Mae
Federal Home Loan Bank of San Francisco
Forst Command Financial Planning
Franklin Templeton Group of Funds
GMAC
H&R Block: Financial Advisors
(Financial Services)
Idaho Housing & Finance Assoc
Independent Financial Marketing Group
Legg Mason
NASD
New York Stock Exchange
NRUCFC
Pacific Exchange
People’s Bank
Prudential
RBC Dain Rauscher
Robert W Baird & Company Inc.
Ryan Beck & Company
Sallie Mae
The Chicago Stock Exchange Inc.
The Depository Trust & Clearing Corp
The Hartford: Investment Division
UBS AG
Waddell & Reed Inc.
William Blair & Company LLC
Health Care & Social AssistanceHospitalsAlaska Native Tribal Health Consortium
Albany Medical Center Hospital
Alegent Health
Allina Health System
Alvarado Hospital Medical Center
Arante Health System
Aurora Health Care Inc.
Avera McKennan Hospital Division,
Avera Health
Banner Health
Banner Health Arizona: AZ Region
Baptist Health Care
Baystate Health Systems
Baystate Health Systems
Berkshire Health Sytems
Beth Israel Medical Center
United States
WorldatWork 2003-04 Salary Budget Survey 79
BJC Healthcare
Bon Secours Health Corp Richmond
Botsford General Hospital
Brooks Health System
Bryan Memorial Hospital
Capital Health System
Carilion Health System
Carondelet Health
Carroll County General Hospital
Catholic Healthcare West
Catholic Medical Center
Central DuPage Health
Central Vermont Medical Center
CentraState Health Care System
Centura Health
Cheboygan Memorial Hospital
Childrens Health System
Children’s Hospital (Omaha, NE)
Children’s Hospital (Boston, MA)
Chilton Memorial Hospital
Clarian Health Partners, Inc.
Cleveland Clinic Foundation:
Western Region
Columbia St Mary’s Hospital
CompCord
Conemaugh Memorial Medical Center
Correctional Medical Services
Covenant Health
Danbury Health System
Deaconess Associations
Duke University: Health System
Eden Medical Center
Elliot Hospital
Evanston Northwestern Healthcare
Fayette County Memorial Hospital
Fletcher Allen Health Care
Foote Hospital
General Health System
Great River Health Systems
Gundersen Lutheran Medical Center
Halifax Community Health System
Hazelden Foundation
HCA Healthcare: West Florida Division
HCA International Co
Health East
Health One: Western Region
Hebrew Rehabilitation Center for Aged
Heritage Valley Health System
Hospital of St Raphael
Hospital Sisters Health System
HR Practice
Infirmary Health System
Inland Northwest Health Services
Inova Health System
Intermountain Health Care
Iowa Health System
Joint Township Hospital
Kaiser Permanente: Hawaii Region
Kennedy Health Systems
Kessler Medical Rehab Res & Ed Corp
Lahey Clinic Medical Center
Lancaster Health Alliance
Lexington Medical Center
Loyola University Medical Center
Mac Neal Hospital
Maine General Health
Maricopa County Human Resources
Massachusetts Eye and Ear Infirmary
Mayo Clinic: Medical Campus Location
McLeod Health
Medical Center of Central Georgia
Memorial Hermann Healthcare System
Memorial Medical Center
Memorial Sloan Kettering Cancer Center
Mental Health Services for Clark County
Mercy Health Partners
Mercy Hospital
Mercy Hospital
Mercy Medical Center
Methodist Hospitals of Indiana
Miami Valley Hospital
MultiCare Health System
Nemours Health Clinic
New England Medical Center
Norman Regional Hospital
North Carolina Baptist Hospitals Inc.
North Memorial Health Care
Northside Hospital
Northwest Community Healthcare
Norwalk Hospital
Novant Health Inc.
NYU Medical Center
Orlando Regional Medical Center
Our Lady of the Lake Reg Med Ctr
Palmetto Health Alliance
Parkland Health & Hospital System
Parkview Health System
PeaceHealth: Lower Columbia Region
Presbyterian Healthcare Services
Provena Health
Providence Health System: Oregon Region
Providence Health Systems: AK Region
Rapid City Regional Hospital
Rush North Shore Med Center
Rush Presbyterian St Luke’s Medical Ctr
Saint Thomas Health Services
Sarah Bush Lincoln Health Center
Scottsdale Healthcare
Shands Health Care
Shands Jacksonville Medical Center:
Southern, Healthcare
Sheppard Pratt Health System
Shriners International Headquarters
Sibley Memorial Hospital
Sioux Valley Hospital
Sisters of Mercy Health System
Sisters of Providence Health System
Southwest Washington Med Center
Spartanburg Regional Medical Center
Spectrum Health
St Alphonsus Regional Medical Center
St Joseph Health System
St Joseph’s Hospital of Atlanta
St Jude Children’s Res Hosp
St Louis Children’s Hospital
St Louis Health Care Network: Jefferson City
St Lukes Episcopal Hospital
St Luke’s Health System
St Luke’s Regional Medical Center
St Lukes Shawnee Mission
St Mary’s Duluth Clinic Health System
St Mary’s Hospital & Medical Center:
Affiliate hospital of Sisters of
Charity of Leavenworth
St Petersburg General Hospital:
Facility Level
St Vincent Hospital (Indianapolis, IN)
St Vincent Hospital (Green Bay, WI)
Summa Health System
Sun Health Corp
Sutter Health
Sutter Medical Center Sacramento
Swedish Health Services
Team Health Inc.
Tenet Healthcare
Texas Children’s Hospital
Texas Health Resources
Texoma Healthcare System
The Children’s Medical Center
The Cleveland Clinic Foundation
The Johns Hopkins Hospital
The New York Hospital
The Queen’s Medical Center
The Reading Hospital & Medical Center
ThedaCare
Thomason Hospital
Trinity Health
Uams
UHHS CSAHS-Cuyahoga Inc.
UMass Memorial HealthCare
Uniontown Hospital
University Community Hospital
University Medical Center
University Medical Center, Inc.
University of California at Irvine
University of California at San Diego
University of Chicago Hospital
University of Colorado Hospital
University of Illinois at Chicago
University of Pennsylvania Health System
University of Pittsburgh Medical Center
Upper Valley Medical Center
UT MD Anderson Cancer Center:
Component of the University of
Texas System
Virginia Commonwealth University
Virginia Mason Medical Center
Washington Hospital Center
Winchester Hospital
Yale New Haven Hospital
Health Care & Social AssistanceAmbulatory Health Care,Nursing & Residential Care and Social ServicesAlterra Healthcare Corporation
America’s Second Harvest
Amerigroup Corp
Apria Healthcare
BayCare Health System
Beverly Enterprises
CARTI
Christian Childrens Fund Inc.
Coast Dental Services
Community Action Organization
Council for Jewish Elderly
Eckerd Youth Alternatives
FamiliesFirst Inc.
Family Services of King County
Father Flanagan’s Boys Home
Ferguson & Fitzgerald
Genesis Health Ventures
Gentiva Health Services
Group Health Cooperative
Harvard Vanguard Medical Associates
Holiday Retirement Corp
Hospice Care Network
HR Dynamics
Jewish Vocational Service
Kaiser Permanente: Northwest Region
Kidspeace Corp
Kindred Healthcare Inc.
Lutheran Social Services
March of Dimes Foundation
Marshfield Clinic
Mason City Clinic
Masonicare
McKinley Hall, Inc.
Medical Associates Health Centers
MSO
NCPSSM
Oregon Medical Group
PeopleSoft
Phyamerica Physician Services Inc.
Physicians Immediate Care
Physicians Management Group
Planned Parenthood of Northern NE
Porter Hills Presbyterian Village
Queen Liliuokalani Children’s Center
Renal Care Group
Salick Health Care Inc.
San Bernardino County: Central
Spindletop MHMR Services:
Behavioral Health
The Don & Sybil Harrington Cancer Ctr
The Everett Clinic
The Vancouver Clinic
United Way Inc.
University of Minnesota Physicians HR
University of Wisconsin Hospital/Clinic
US Oncology
Value Options: Corporate
Visiting Nurse Service of New York
VistaCare Inc.
Volunteers of America Texas
United States
80 WorldatWork 2003-04 Salary Budget Survey
InformationInternet Publishing, Broadcasting,Service Providers, WebAdobe Systems Inc.
Alliance Data Systems
Amazon.com
America Online, Inc.: North East
Cable & Wireless: U.S. Operations
Corporate Express
Data Recognition Corp
Digex
Digital Impact Inc.
Double Click Inc.
EarthLink Inc.
eBay
Global Payments Inc.
Hughes Electronics
JD Edwards
Microsoft
Mitchell International
NDC Health Information Services
Overture Services Inc.
Pegasus Solutions Inc.
PeopleSoft Inc.
RL Polk & Co
San Diego Data Processing Corp
StarBand
Survey Research Associates LLC
The Cobalt Group
VeriSign
Websense Inc.
West Group
WorldNow
Yahoo
InformationPublishing Industries (except Internet)Abbott Langer & Associates
Autodesk Inc.
Belo Corp: The Dallas Morning News
Business & Legal Reports
Candle Corp
Concordia Publishing House
Cook Communications Ministries
Copley Press
DeLorme Publishing
Dow Jones & Company Inc.
Elsevier Science Inc.: U.S.
Entertainment Publications Inc.
FileNet
G&J USA Publishing:
USA Magazine Company
Gale Group
Gannett
GBC
Guideposts Associates Inc.
Hanley-Wood Inc.: Magazine Division
Harcourt Inc.
Houghton Mifflin Co
Information Handling Services
InterArt Distribution
International Data Group: Eastern Region
John Wiley & Sons Inc.
Martha Stewart Living Omnimedia
Media General Inc.
Merant Inc.
National Geographic Society
Newsday: Northeast Region, Publishing
Paddock Publications
Pearson Education
ProQuest Information & Learning:
Information & Learning Division
ProQuest Information & Learning
ProQuest Information & Learning:
Business Solutions
Random House Inc.
Scholastic Inc.
Southern Progress Corp
The Houston Chronicle
The New York Times Company
The Seattle Times
The Taunton Press
Thomson Corporation
TransWestern Publishing Co
US Pharmacopeia
Vivendi Universal
InformationMotion Picture, Sound Recording,Broadcasting (except Internet)AAMVA
ACNielsen
ACS Inc.: Government Services Group
Acxiom Corp
Advanced Solutions
American Management Systems Inc.
American Society of Employers
Anexsys
Answerthink Inc.
Applied Discovery
Applied HR Strategies Inc.
Applied Systems
ARINC Inc.
Ascend One Corporation
Associated General Contractors
Automatic Data Processing
AXA Client Solutions: IT Infrastructure group
Base Consulting Group
Biodynamic Research Corp
BMG
Ceridian Corp
Certegy
Checkfree Corporation
Chrome Data Corporation
Clear Channel Communications
Comcast Cable: Southern Division
CompuCom Systems
Data Center Inc.
Dendrite International Inc.
Discovery Communications Inc.
ePresence
First Data
Fiserv CBS Worldwide Division
Fiserv Inc.
General Dynanmics Network Systems
Getty Images Inc.
Home Box Office Inc.
IDX Systems Corp
IMS Health: U.S. Region
Information Resources Inc.
Integretel
Kronos Incorporated
Maritz Inc.
MDeverywhere
MemberWorks Inc.
META Group
Metavante Corporation
MIB Group Inc.
Micro Focus Inc.
Mobius Management Systems Inc.
Morningstar Inc
MRA The Management Assn Inc.
National Broadcasting Company NBC
Navigation Technologies
NCS Pearson
Neolytica
Online Computer Library Center
OpenText Coporation
Perot Systems Corp
PHH Arval: Northeast Region,
Business Services
Portal Software
Prime Therapeutics Inc.
QRS Corporation
RealNetworks
Sabre Holdings
Sagebrush Corp
Salary.com
SAP Labs Inc.: Research and
Development, North America
Secure Computing Corp: All US employees
including headquarters in CA
Securities Industry Automation Corp
Siemens
Sony Pictures Entertainment
Sterling Commerce
StoneWater Systems
Susquehanna Pfaltzgraff Co
The EW Scripps Co
The Weather Channel
The Weather Channel: Business Unit of
Landmark Communications, Inc.
Thomson Financial Services
Tibco Software
Time Warner Cable
Turner Broadcasting System Inc.
Universal City Studios Inc.: Western Region
Viacom Inc.
Vignette Corporation
Walt Disney
Watson Wyatt Data Services
WebHire
Whitehead Institute
Wicks Broadcast Solutions LLC
Worldspan
Management of Companies & EnterprisesACS Wireless
Catholic Health Initiatives
Compensation Resources Inc.
CRL Industries
FBD Consulting Inc.
Fremont General Corp
GE Commercial Finance
HR Northwest
LIMRA International
Loews Corporation
Matthews Young-Management Consulting
Parson Group
South Jersey Gas Co
SWA Holdings
The Harding Group LLC
TOSOH America Inc.
United Technologies
USAC
ManufacturingChemical ManufacturingAbbott Laboratories: Distribution Center -
Atlanta, GA
Abbott Laboratories: Distribution Center -
Dallas, TX
Abbott Laboratories: Distribution Center -
King of Prussia, PA
Abbott Laboratories: Distribution Center -
Los Angeles, CA
Air Liquide America Corp: U.S.
Headquarters
Air Products and Chemicals
Albemarle Corp: Specialty Chemicals
American Pharmaceutical Partners
American Pharmaceutical Partners:
Manufacturing Facility, Buffalo,
New York
Amersham Health: U.S. Region
Amersham Pharmacia Biotech Inc.
Antonellis & Associates
Ashland Specialty Chemical Company
Ashton Consulting
ATOFINA Petrochemicals Inc.
Avecia Inc.
Aventis Pharmaceuticals: United States
Bayer Corp: US Regional Operations
Berlex Laboratories Inc.
Boehringer Ingelheim Pharmaceuticals Inc.
Borden Chemical Inc.
BP: North America
Cabot Corp
Cabot Microelectronics Corp
Celanese International Corporation
CF Industries
Chevron Phillips Chemical Co LP
Ciba Specialty Chemical
Clariant Corp
Cognis BV
Covance
United States

WorldatWork 2003-04 Salary Budget Survey 81
CP Hall Co
Crompton Corporation
Cytec Industries
DFB Pharmaceutical Inc.
Diosynth Inc.: BioTechnology
Business Unit
DSM Catalytica Pharmaceuticals
DSM Elastomers Americas Inc.: Addis Facility
Ecolab Inc.
EI Du Pont Nemours
Elan Pharmaceuticals
Eli Lilly
Engelhard Corp
ESP Pharma
Flexsys America LP
Franklin International
Fuji Photo Film: U.S. Manufacturing
Fujisawa USA Inc.
General Chemical Corp
Georgia Gulf Corp
Great Lakes Chemical Corp
Griffin LLC
Hoffmann La Roche
ICI Paints
International Flavors & Fragrances Inc.
International Specialty Products
Invitrogen
JohnsonDiversey
JR Simplot Co: Fertilizer
Kendle International
Leiner Health Products Inc.
Merck & Company Inc.
Mikart Inc.
Millenium Pharmaceuticals Inc.
Millennium Chemicals
Nanophase Technologies Corp
National Starch & Chemical
Novartis Corp: Pharmaceuticals U.S.
Noveon Inc.
Novo Nordisk Pharmaceuticals Inc.
Nuclear Fuel Services Inc.
OMNOVA Solutions Inc.
Otsuka America Pharmaceutical
OXY, Inc.: Occidental Chemical
Corporation
Potash Corp
PPG Industries
PQ Corp
Praxair
Reichold, Inc.
Rhodia Inc
Roche Bioscience: One Research Division
Roche Carolina Inc.: Manufacturing
and R&D
Rohm and Haas
Rust-Oleum Corp
Sanofi-Synthelabo Inc.
Sasol North America Inc.
SC Johnson & Son Inc.
Schering-Plough
Shipley Company LLC: Electronic
Materials Division
SmithKline Beecham Corp
Solvay America Inc.: U.S. Region
Solvay Pharmaceuticals
Syngenta Crop Protection Inc.
Talley Defense Systems
TAP Pharmaceutical Products Inc.:
Subsidiary of Abbott Labs and
Takeda Pharmaceuticals
Teva Pharmaceuticals USA, Inc.
The Alpha Corporation
The Dow Chemical Co
The Lubrizol Corp
United States Enrichment Corp
Valspar Corp
Vantico: Adhesives & Tooling Division
Velsicol Chemical Corp
Watson Pharmaceuticals
WR Grace
ManufacturingComputer & Electronic Product ManufacturingAAI Corp
ACSS
Activision Inc.
Adaptec Inc.
Adtran
AGFA Corp: NAFTA Region
(U.S., Canada & Mexico)
Agilent Technologies
Alps Electric USA Inc.: California
AMI Semiconductor
Analog Devices Inc.
Analogic
ASML: United States
Atheros Communications Inc.
Attachmate Corp
BAE Systems
BAE Systems: Information Systems Sector
BAE Systems Platform Solutions
Ball Aerospace Communications Group
Best Software Inc.
BMC Software Inc.
Boeing-Irving Co, Avionics Manufacturer
Bose Corp
Brother International Corp: Eastern,
Southern, & Western Regions, Sales
& Distribution
Cadence Design Systems Inc.
Caliper Technologies Corp
Ciprico
Cisco Systems
CTI Group
CTS Corp
Cubic Corp
Dell Computer
Diebold Inc.
Digi International
Dynamic Instruments Inc.
Emulex Corp
ESS Technology Inc.
Extended Systems Inc.
Farmstead Telephone Group
Flextronics Intl: United States
Fuji Film Microdisks USA Inc.:
Manufacturing
Gateway Inc.
GE Medical Systems
Handspring Inc.
Herley Industries Inc.
Hewlett-Packard: United States
HHP
Hitachi Computer Products America Inc.
Hitachi Home Electronics
Honeywell: Northwest Manufacturing
facility
Hutchinson Technology Incorporated
Hyperion Software
I Many, Inc.
Identix Inc.
Imation Corporation
Instron Corp: North America
Intel
Inter-Coastal Electronics
Internet Security Systems
Intersil Corp
Intuit
Iomega Corp
ITT Gilfillan: Radar Group
ITT Industries: California -
manufacturing division
Keithley Instruments Inc.
Kyocera America Inc.
Lam Research Corp
LAN International
Legerity Semiconductor
Lexmark International Inc.
Lumenis: U.S. Operations
Made 2 Manage Systems
Matrix One Inc.
Micronpc.com
Microsemi Corp
Microwave Data Systems, Inc.
Mitsubishi Digital Electronics America
Molex Automotive: Automotive Division
Molex Inc.
MSC Software Corp
National Semiconductor Corp
NCR Corporation
Nintendo of America Inc.:
American operations
North American INt
Northrop Grumman SBMS:
Melbourne FL Facility
Novell Inc.
Orchard Supply Hardware
Palo Alto Research Center: Research
Panasonic: Customer Call Center
Philips Semiconductors
Pitney Bowes
Plexus
QLogic Corp
Qualcomm Inc.
Renaissance Learning Inc.
RF Micro Devices Inc.
Rockwell Collins
SAS Institute Inc.
Schneider Automation Inc.
Seagate Technology LLC
Sematech Inc.
SERENA Software Inc.
Sharp Electronics Corp
Siebel Systems
Siemens Medical Systems: Siemens
Ultrasound Division
Silicon Graphics
Sipex Corp
Sony Electronics Inc.
Space Systems Loral
Special Devices Inc.
St Jude Medical Inc.: R&D
STMicroelectronics: North America Region
Storage Tek
Stratus Computer Inc.
Sumitomo Sitix of Phoenix
Symbol Technologies Inc.
Synopsys Inc.
Tektronix Inc.
Telex Communications Inc.
The Foxboro Company: U.S. Division -
Production Management Division
The MathWorks Inc.
Troxler Electronic Labs
VBrick Systems
WaferTech: U.S. Manufacturing Division
Wavecrest Corporation
Wind River Systems
Xerox
Xilinx Inc.
Zebra Technologies Corp
Zygo Corp
ManufacturingElectrical Equipment, Appliance & Component ManufacturingApplied Micro Circuits Corporation
Automatic Switch Company: ASCO
Valve Division of Emerson Electric
Carlyle Inc.
Cooper Industries
Cummins Allison Corp
Electro Scientific Industries
Electroswitch: Northeast Region,
Manufacturing Division
Evans & Sutherland Computer Corp
Fluke Corp
Honeywell: Industry Solutions:
Automation and Controls Group
Honeywell: Aerospace Electronic
Systems (AES)
Honeywell: Control Products
Manufacturing Plant
Hypertherm Inc.
Ikon Office Solutions
Invensys: Powerware
Johnson Controls: Controls Group
Business Unit
Kalas Manufacturing Inc.
United States

82 WorldatWork 2003-04 Salary Budget Survey
Legrand North America
Leviton Manufacturing
Liebert Corp: Manufacturing Division
Matsushita Electric Corp of America
Memec Inc.
Newport Corp
Northrop Grumman Corp: Navigation
Systems Division
OrthoLogic Corp
OSRAM SYLVANIA
Palm Inc.
Philips Electronics: All operations
in North America
Philips Lighting Co
Preco Electronics: Manufacturing Branch
Racal Instruments Inc.
Raytheon Co
Sanmina Corp
SatCon Technology Corp Inc.
Schweitzer Engineering Laboratory
Siemens Building Technologies
Siemens Corp Business Process Consulting
Siemens Energy & Automation Inc.:
Subsidiary of Siemens Germany
Square D Company: USA Corporate
Headquarters
Superconductor Technologies
Tetra Holding US Inc.
Thomas & Betts
Triquint Semiconductors
Tundra Semiconductor Corp:
Design Services
Tyco Electronics: Electronics
Whirlpool Corp
Yazaki North America Inc.
ManufacturingFood, Beverage & TobaccoProduct ManufacturingAllied Domecq Wines, USA:
Wines Division
Altria Corporate Services Inc.
Anheuser-Busch
Aurora Foods
Beringer Blass Wine Estates:
Americas Division
Brown & Williamson Tobacco Corp
Brown Forman Corp
Bunge North America
Bush Brothers & Company
Cadbury Adams
Cadbury Schweppes Americas:
Americas Beverages Region
Campbell Soup
Cargill
Coca-Cola
Coca-Cola Enterprises
ConAgra
ConAgraFrozen Foods Group
Coors Brewing Company
Del Monte Foods
Del Monte Foods: East
E&J Gallo Winery
Foster Poultry Farms
Fresh Start Bakeries
Frito-Lay Inc.
Grande Cheese Co
Hershey Foods
HJ Heinz
Hormel Foods
HP Hood Inc.
International Multifoods Corporation
Jif-Pak Manufacturing Inc.
JR Simplot CoFood
Just Born Inc.
Keystone Foods Corp
Kraft Foods Inc.
Land O’Lakes Inc.
Le Chef Bakery
Lorillard Tobacco Co: Manufacturing
Company
LSG Sky Chefs
Marigold Foods
Masterfoods USA
Mauna Loa Macadamia Nut Corp
McCain Foods Ltd
McCormick & Company Inc.
Miller Brewing Co.
Mission Foods: Subsidiary of
Gruma Corporation
Nature’s Sunshine Products
Nestle USA Inc.: USA group
Novartis Nutrition Corporation
Organic Valley
Pepsi Americas
Pepsico
Perdue Farms Inc.
Pernod Ricard Korea
Pioneer Hi-Bred International Inc.:
Agriculture and Nutrition Group
Ralcorp Holdings Inc.
Ralston Purina Co
Rich Products Corp
Riviana Foods Inc.
RJ Reynolds Tobacco Co
Robert Mondavi Winery
Sara Lee: National
Schieffelin & Somerset Co
Schwan’s Sales Enterprises Inc.
Seaboard Corp
Snyders of Hanover
Swedish Match North America
Tetra Pak: Global Information
Management, Americas
Tropicana Products Inc.
Unilever Bestfoods: All Regions
UST Corp
Wm Wrigley Jr Co
Wrigley Manufacturing: SW region,
Manufacturing Plant
Zinpro Corporation
ManufacturingMachinery ManufacturingAmerican Standard Inc.
Applied Materials Inc.
Avid Technology Inc.
Briggs & Stratton Corp
Carrier Corp
Caterpillar
Daifuku America Corp
Detroit Diesel Corp: North Central
Region, Manufacturing Subsidiary
Ebara
Eureka Company
FMC
Husky Injection Molding Systems:
Manufacturing (VT), Distribution
Center (Buffalo, NY) and Regional
Sales Offices (13 cities)
Hussmann Corp
JLG Industries Inc.
Joy Mining Machinery
Kinetico Inc.
Kulicke & Soffa Industries Inc.
Nordson Corp
Oil States Industries Inc.
R A Jones Co
Raymond Corporation
Robert Bosch Corp
Schindler Elevator Corp: All North America
Group of a Swiss based company
Solar Turbines Inc.
Stewart & Stevenson
Sulzer Bingham
Varian Semiconductor Equipment
Vesuvius USA
Weigh-Tronix Inc.
ZF Lemforder Corp:
Manufacturing Division
ManufacturingMetal ManufacturingAlfa Laval Inc.
Alfe Heat Treating Inc.
Allvac, An Allegheny Technologies Co:
Manufacturing Division (specialty
metals)
American Axle & Manufacturing Inc.
Barnes Group
Baumann Inc.
Borg Warner Automotive
Bunn-O-Matic Corp
BWX Technologies BWSI:
Manufacturing Division
Canam Steel
Carpenter Technology Corp
Chatsworth Products Inc.:
Manufacturing
Copeland Corp
Copperweld Corporation
Deere & Company
Depuy
Donaldson Company Inc.
Federal Mogul Corporation: Skokie plant
Fike Corp
Ford Motor
GKN Aerospace Chem-Tronics:
North America West Division
Grede Foundries Inc.
Hensley Industries Inc.
Implant Innovations Inc.
Ispat Inland Inc.
ITW: Automotive Manufacturer
Kennametal Inc.
Komag Inc.
LA Darling Co
Lennox International Inc.
Mckechnie Aerospace
Metso Automation USA Inc.:
U.S. Field Systems
Midmark Corp
Modine Manufacturing Co
NATCO
Northwest Pipe Co: Manufacturing
NSK Corp
Olin Corp: Winchester and Brass
Divisions
Perry Equipment Corp
Ross Controls
SMM USA Inc.: U.S. Manufacturing
Southco Inc.
Textron Fastening Systems
The Bilco Co
Tower Automotive
Tyco Fire & Security: Plant
US Steel
Valmont Industries Inc.
Voith Siemens Hydro Inc.: US Division
Volvo Trucks North America Inc.
Western Forge: Tool Division
William L Bonnell Company
Wolverine Tube Inc.
Worthington Industries
Wright Medical Technology Inc.
York International
ManufacturingPaper Manufacturing, Printing & Related Support ActivitiesAdvo Inc.
americangreetings.com
Appleton Papers Inc.
Atlantic Envelope Co
BOISE
Bowater Inc.
Bowne & Company
Corporate Express Document &
Print Management
Fraser Papers Inc.
FujiColor Processing Inc.
GAF Materials Corp: Dallas
Manufacturing Site
Georgia-Pacific
Gulf States Paper Corp
United States
WorldatWork 2003-04 Salary Budget Survey 83
Hallmark Cards
JJ Keller & Associates Inc.
John H Harland Company
Journal-Chronicle Company
Liberty Diversified Industries
Little Rapids Corp
Loparex Inc.
McCormick & Company Inc.
MeadWestvaco
Merrill Corporation
Monadnock Paper Mills Inc.
Morris Communications Co LLC
Nashua Corp
Packaging Corporation of America
Paxar Corp
Potlatch Corp
Recycled Paper Greetings Inc.
Riverwood International Corp
RR Donnelley & Sons
Sappi Fine Paper NA
Smead Manufacturing
Smurfit-Stone Container Corp
Sonoco Products Co
Standard Register Co
Stora Enso North America
TimeMed Labeling Systems Inc.
Wachovia Corp
Wallace
Walter G Anderson
Weyerhaeuser Co
ManufacturingPlastics & Rubber ProductsManufacturingArkay Industries Inc.
Arkay Industries Inc.:
Manufacturing Division
Aslide: Manufacturing Division
B. Braun Inc.
Bemis Manufacturing Co
Bemis, Inc.
Bespak Inc.: U.S. Subsidiary
BMC Industries Inc.
Clayton Corporation
Cooper Tire & Rubber Company
Entegris Inc.
GLS Corporation
Goodyear Tire & Rubber
Infiltrator Systems
Michelin North America
Mikron Industries
Nike Inc.
Pactiv Corp
Phillips Plastics Corp
Polimeri Europa: U.S.A.
Prairie Packaging
Precix Inc.
PWPipe
Quadion
Roche Diagnostics Corp
Sealed Air Corp
Solvay Engineered Polymers:
Manufacturing Division
Stampin’ Up
Strongwell
Teknor Apex Co
Toray Plastics America Inc.
Tredegar Industries
Trostel Ltd
Tupperware Corporation
Zeon Chemicals LP
ManufacturingTextile Mills, Apparel, Leather & Allied Product ManufacturingBeiersdorf Jobst
Burlington Industries Inc.
Cone Corporate Center
Dal Tile
Dan River Inc.
Garden State Tanning
Glenoit Corp
Gold Toe Brands Inc.
Guilford Mills Inc.
Haggar Clothing Co
Jockey International
Jones Apparel Group Inc.
Kellwood Co
Levi Strauss & Co
Maguire Consulting
New Balance Athletic Shoe Inc.
Sara Lee Corporation: Manufacturing
Division
Shaw Industries
Springs Industries Inc.
Standard Textile Co
Swift Denim
Toray Composites (America), Inc.
VF Services
ManufacturingTransportation EquipmentManufacturingAerospace (Business Jets): Division
of General Dynamics
Argo-Tech Corp
ArvinMeritor Inc.
Associated Fuel Pump Systems Corp
Autoliv
Canon USA Inc.
Champion Laboratories Inc.
Daimler Chrysler Corporation
Dana Corp: Commercial Vehicle
Systems Division
Dassault Falcon Jet Corp
Denso
Denso International America Inc.:
Sales and Engineering Division
Donnelly Corp: Magna Donnelly
North America
Fairchild Controls Corp: Aerospace
Sub Systems Design & Manufacture
Federal Mogul Corporation
Freightliner Corp
Gates Corporation
General Atomics
General Electric
General Motors
GKN Automotive Inc.
Goodrich: Manufacturing Division
Hendrickson International
HKS USA Inc.
International Truck & Engine Corp
Johnson Controls
LUK Inc.: U.S. Manufacturing
Metaldyne
Mitsubishi Motors North America-Mfg. Div:
Manufacturing Division
New United Motor Manufacturing
North American Lighting
Northrop Grumman Corp:
Newport News Shipbuilding Sector
Oiles America Corp
Oiles America Corp:
Manufacturing Division
Orscheln Industries: Manufacturing
Division
Oxford Automotive
Paccar
Robert Bosch Corp: Central U.S,
Subsidiary of German Company
Robert Bosch Corp: Research/
Development/Sales division
TBDN Tennessee Company
Tenneco Automotive
The Budd Company
Visteon
Vought Aircraft Co: Manufacturing
Plant, California
Vought Aircraft Co: Manufacturing
Plants, Southeast
ZF Batavia LLC
ManufacturingOther MiscellaneousManufacturingA T Cross
Abbott Laboratories
ACCO Brands: Office Products Group
Acushent Company
A-Dec
Advanced Medical Optics Inc.
Airborn Inc.
Aisin Brake & Chassis Inc.:
Manufacturing Plant
Akzo Nobel Inc.
Alcoa
Alcon Laboratories Inc.
Allergan Inc.
Alliant Techsystems
Alticor Corp
American Gypsum
American Medical Systems Inc.
Ametek Inc.
Amgen Inc.
Apogee Enterprises
Aquarium Pharmaceuticals Inc.
Aramco Services Co
Armstrong World Industries
Ash Grove Cement Co
Automated Packaging
Aventis Behring LLC
Aventis Behring LLC: U.S.
Manufacturing site
Avon Products
Ball Corp
Bath Iron Works Corp
Bausch & Lomb Inc.
Bausch & Lomb Inc.:
Pharmaceuticals Plant
Bausch & Lomb Inc.: St. Louis plant
Baxter Healthcare: Renal Division,
Largo, FL
Beckman Coulter Inc.
Berwick Offray LLC
Bimba Manufacturing Co
Binney & Smith Inc.
Black & Decker
BMW Manufacturing Corp:
Plant 10 Spartanburg
Boeing Company: Aerospace
Boston Scientific Corp
BP: Western Hemisphere
Brady Corp
BREG Inc.
Bristol-Myers Squibb
Brooks-PRI Automation Inc.
Callaway Golf Co
CertainTeed Corp
Chamberlain Group Inc.:
Manufacturing Division
Chiron Corp
Church & Dwight Company Inc.
CIBA Vision Corporation:
Surgical and Contact Lens
Citgo Petroleum Corp
Clorox Company
Coherent Inc.
Colgate-Palmolive Co:
North America Division
Combe Inc.
CommScope
Conestoga Wood Specialties Inc.
Cytyc Corp
Dade Behring Inc.
Delphi Automotive Systems
Denso International America Inc.:
North America
Dionex Corp
Dolly Inc.
Dresser Measurement & Controls:
Instrument (manufacturing division)
Dwyer Instruments Inc.
ElkCorp
EMPI Inc.
Enodis Corp
Enodis Corp: Cleveland Range
United States

84 WorldatWork 2003-04 Salary Budget Survey
Enodis Corp: Delfield - MI
Enodis Corp: Delfield - TN
Enodis Corp: Garland
Enodis Corp: Kysor Panel Systems
Enodis Corp: Lincoln
Enodis Corp: Mile High Equipment Co.
Enodis CorpFrymaster
EnPro Industries Inc.
Enzon Inc.
ESCO Electronics Corp
Estee Lauder
Express Point Technologies
Farnam Companies Inc.
Faro Technologies
Federal Sign: Manufacturing Division
Fine Art Lamps
Fiskars Brands Inc.
Fleetwood Enterprises
Flowserve
Fortune Brands
GE Interlogix Inc.: Portland, OR
General Dynamics Land Systems Div
General Dynamics: Armaments and
Technical Products
General Electric
Geneva Pharmaceuticals:
US Generics Division
Gen-Probe Incorporated
GreenLeaf
Guidant Corp
Hamilton Beach Proctor Silex
Hanson Building Materials America
Harley-Davidson
Haworth Inc.
Herman Miller Inc.
Hilti North America
Hitachi America Ltd.
HM Electronics
Honeywell: Central United States,
Manufacturing Division
Honeywell: Manufacturing Division
Hu-Friedy Manufacturing Company Inc.
Interior Systems Inc.
International Game Technology
International Imaging Materials
InTEST Corporation
Invacare Corp
Ionics Inc.
ITT
ITT Industries
Jergens Inc.
Johns Manville Corporation
Johnson Controls: Automotive Group
Johnson Outdoors
Jostens
Kaman Aerospace Corp: Manufacturing -
Defense Related Technologies
Kohler Co
L-3 Communications Corp:
Microwave Division
LA Darling Co: Wood Division-Arkansas
LA Darling Co: Wood Division-Wisconsin
Lafarge Canada Inc.
Lamson & Sessions Co
La-Z-Boy Inc.: Manufacturing Division,
Midwest region
Lear Corp
Leatherman Tool Group Inc.
Lifetouch Inc.
Lockheed Martin
Longaberger Company
Lord Corp
L’Oreal
Louisiana Pacific Corp
Mary Kay Inc.
MasterBrand Cabinets Inc.
MasterCraft Cabinets
Matthews International Corp
Medela
Medtronic Inc.
Medtronic Vascular
MEMC Electronic Materials Inc.
Mercury Marine
Merillat Industry Inc.
Merit Medical Systems
Michaels: Meridian Idaho Branch,
Manufacturing and Dist. Center
Millipore
MTS Systems Corp
Murphy Oil Corporation: Refining
& Marketing Division
New England Business Service Inc.
Northrop Grumman Corp
Northrop Grumman Corp:
Manufacturing
NVIDIA
ODL Inc.
Omya Inc.
Orange Glo
Organon Inc.
Organon Pharmaceuticals USA
O’Sullivan Industries
Pergo Inc.
Pfizer: Consumer Health
PGT Industries Inc.
Pharmacia Corp
Pharmavite Corp
Pilkington Libbey Owens Ford Co
Polaroid Corporation
Praecis Pharmaceuticals Incorporated
Premcor
Pro-Tec Coating Co
Purdue Pharma LP
Rayonier Inc.
Remington Arms Company Inc.
Remington Products Co
Respironics, Inc.
Revlon Inc.
Rockwell Collins
Saint-Gobain Containers:
Containers Division
Sara Lee Corporation
Satellite Industries Inc.
Sauder Manufacturing Company
Schick Wilkinson Sword
Schott Corp
Sealy Inc.
Sentry Group
Siemens Westinghouse Power Corp
Solo Cup Co
Stihl Inc.
Stratagene
Stryker Howmedica Osteonics
Sunbeam Corp: Subsidiary of American
Household, Inc.
Sunoco Inc.
Sybron Dental Specialties
Systems & Electronics Inc.
Tekelec
Teleflex Inc.
Teradyne Inc.
Terumo Cardiovascular Systems
Teva Pharmaceuticals USA Inc.:
U.S. subsidiary of Israeli-based
parent company
Texas Industries Inc.
The Boeing Co: Defense Systems
The Dial Corporation
The Gillette Co
The Woodbridge Group: Corporate US
Thermo Electron
Thomasville Furniture Ind Inc.
Tindall Corp
TRW
TRW: Occupant Safety Systems Division -
Mesa Plant
Tyco Healthcare
United Technologies Corporation:
Pratt & Whitney
Unocal
US Remodelers
USG
Valero Energy Corp
Ventana Medical System Inc.
Vestas American Wind Technology Inc.
VISX Inc.
Wacker Siltronic Corp: US Division
Waterbury Companies Inc.
Wilson Greatbatch Ltd: Western NY
Corporate and Manufacturing group
WL Gore & Associates Inc.
Wyeth
YKK Corp of America
Zimmer Inc.
MiningAlaska Clean Seas
Amerada Hess
Anadarko Petroleum Corp
Apache Corp
Asarco Inc.
Barrick Goldstrike Mines Inc.
Burlington Resources Inc.
Chemical Lime
Cleveland Cliffs Inc.
ConocoPhillips
Drummond Company Inc.
Duke Energy
EOD Resources Inc.
ExxonMobil
Giant Industries Inc.
Halliburton
Kerr-Mcgee corporation
Landmark Graphics Corp
Luck Stone Corp
Marathon Ashland Petroleum LLC:
Joint Venture
Murphy Oil Corporation
Newmont Mining Corp
Ocean Energy, Inc.
Oglebay Norton Co
Oxbow Corporation
Phelps Dodge
Rio Tinto
Samson Investment Co
Shell Oil Co
Vulcan Chemicals
Public AdministrationAlbemarle County
Bernalillo Co Govt
Boeing Company
Briggs & Morgan PA
Broward County Florida
Broward County Sheriff’s Office
CEOGC
Chesterfield County
City of Akron
City of Allen
City of Alpharetta
City of Ames
City of Anaheim
City of Arvada
City of Battle Creek
City of Beaverton
City of Charlotte
City of Chattanooga
City of Dayton
City of Dover
City of El Paso
City of Ft Lauderdale
City of Glendale
City of Grapevine
City of Greenville
City of Hickory
City of Houston
City of Indianapolis
City of Irving
City of Jacksonville
City of Las Vegas
City of Mequon
City of Naperville
City of Orlando
City of Overland Park
City of Richmond
City of Savannah
City of Seattle
City of Slidell
City of St George
City of Topeka
United States
WorldatWork 2003-04 Salary Budget Survey 85
City of Virginia Beach
City of Wheaton
City of Wilmington Human Resourc
Clark County
Clerk of the Circuit Court
Collier County Government
Collin County
Colorado Housing & Finance Authority
Comptroller of the Currency
County of Charleston
County of Los Angeles
Dakota County
Department of Human Resources
Management
DFW Hospital Council
DFW International Airport Board
DHRA CPMS Wage & Salary Div
Duane Morris LLP
Georgia Merit System
Hall County/Gainesville City
Government
Horry County Government
Housing Authority of Baltimore City
IL Dept of Central Mgmt Svcs
Illinois Student Assistance Comm
Jefferson County Government
Jet Propulsion Laboratory
Kent County
L-3 Communications Corp:
Communication Systems -
East, Southern New Jersey
Lawrence Livermore National Laboratory
Lee County Government
Lockheed Martin:
Design/Development/Manufacturing
Minnesota State Senate
Missouri Department of Conservation
Missouri Division of Personnel: Central
Region, State Government
Missouri State Employees Retirement Sys
MIT Lincoln Laboratory: Northeast
Region, MIT Lincoln Research and
Development Laboratory
Montgomery County Government
Moog Inc
Morrison & Foerster
New Mexico State Personnel Office
Northrop Grumman Corp
Northrop Grumman Corp:
Space Technology
Ohio Dept of Administrative Services
Okaloosa County
Orange County Convention Center
Orbital Sciences Corp
Palm Beach County
Palm Beach County Sheriff’s Office
Park City Municipal Corp
Philadelphia Youth Network Inc.
Pinellas County Government
Port Authority of New York & New Jersey
Port of Portland
Port of Seattle
Protection Technology Los Alamos
Salt Lake City Corp
Sarasota County Government
Seminole County Government/BCC
St Louis County Government
State Corporation Commission
State of Arizona
State of Colorado
State of Hawaii
State of Idaho
State of Maryland
State of North Carolina
State of Oklahoma
State of Oregon
State of Texas State Auditor’s Office
State of Utah
State Teachers Retirement System of Ohio
Superior Court for Maricopa Co
Swales Aerospace
Terry Reilly Health Services
The County of Dallas
Titan Corp
Town of Collierville
Town of Hilton Head Island
Town of Oro Valley
United Space Alliance
US Office of Personnel Management
Veridian Information Solutions
Virginia Housing Development Authority
Washington State Department
of Personnel
Washoe County
Wisconsin Dept of Employment Relations
Wyoming Business Council
Real Estate,Rental & LeasingAmstar Group Ltd
ANC Rental Corp
AvalonBay Communications Inc.
CB Richard Ellis
Cendant Corporation
CHEP USA
Combined Properties Inc.
Cort Business Services
Crescent Heights
Dell Financial Services
Dollar Thrifty Automotive Group
Duke Realty
Electro Rent Corp
Equity Office Properties
Fairbanks Capital Corp
GATX Corp
GE Capital Commercial: Commercial
Equipment Financing Division of GE
General Growth Properties, Inc.
Grubb & Ellis
JPI Partners LLC
Rent-A-Center
RNM Management Inc.
RREEF Management Company
Simon Property Group
SOS Staffing Services
Terrus Real Estate Group
The Hertz Corp
The Irvine Company
The Mills Corp
The Rouse Company
The Taubman Company Inc.
The Town & Country Trust
Transamerica Real Estate Tax Service
USAA Real Estate Co
Visa
Retail Trade7-Eleven
Accredo Health Inc.
Advance Auto Parts
Advance PCS
Ahold USA
Alderwoods Group
Allied Domecq Retailing USA:
Quick Service Restaurants
American Honda Motor Co Inc.
American Radiology Services Inc.
AmeriSource Bergen
Ann Taylor
Arizona Mail Order Company Inc.
Attributes
AutoNation Inc.
AutoZone
AutoZone: Distribution Centers
AutoZone: Retail Stores
Bear Creek Corp
Bergey’s Inc.
Best Buy
Big Lots
Big Y Foods Inc.
BJ’s Wholesale Club
Blockbuster Entertainment
Borders Group Inc.
Brookshires Grocery Company
Brown Shoe Company
Brunswick: Retail Division
Brylane Inc.
Checks Unlimited
Chipotle Mexican Grill Inc.
Cinemark USA Inc.
Coast Dental Services
Compass Group USA
Crate & Barrel
Cumberland Farms Inc.
CVS
Dan’s Competition:
Distribution/Call-center division
Darden Restaurants Inc.
Dollar General
Eckerd Corp
Eddie Bauer
Electronics Boutique
Empire Southwest
Federated Department Stores
Ferrellgas
Footstar
Franklin Covey Co:
Consumer Business Unit
Fred Meyer Inc.
Gap
General Nutrition Inc.
Golf Galaxy Inc.
Golf Galaxy Inc.: Retail Stores Division
Harris Teeter
HEB
Helzberg Diamonds
Henry Schein, Inc.
Home Shopping Network Inc.
Honey Baked Ham
JC Penney
JoAnn Stores Inc.
Jordans Furniture Co
Kathryn Beich Inc.
Kawasaki Motors Corp USA:
Consumer Products Division
LensCrafters: Speciality Retail
Limited Too
LoJack Corp
Lund Food Holdings Inc.
May Department Stores
McKesson HBOC Inc.
Medical Arts Press
Meijer Inc.
Michaels Stores Inc.
Micro Warehouse Inc.
Mikasa
Mike Albert Leasing Inc.
Neiman Marcus
Nordstrom
Norm Thompson
Office Max
Omaha Steaks International
One Price Clothing Stores Inc.
OshKosh B’Gosh
Owens Corning World Headquarters
Pacific Sunwear
Pamida Inc.
Papa Johns International Inc.
Papa Johns International Inc.:
Store Operations
PartyLite Gifts Inc.
Patterson Dental Company
Payless ShoeSource
Petco Animal Supplies Inc.
PFG Florida
Pier 1 Imports Inc.
Pomare Hilo Hattie
Quill Corp
RadioShack
REI
Rental Service Corp
Roundy’s
SA Consulting
Safeway
Savers Inc.
Sears Roebuck
Service Corp International
Shoe Carnival Inc.
Smart & Final
United States

86 WorldatWork 2003-04 Salary Budget Survey
Speedway SuperAmerica LLC
Stage Stores Inc.
Staples Inc.
Starbucks Coffee Co
Stop & Shop Companies Inc.:
Northeast, food retailer
Subaru-Isuzu Automotive Inc.:
Manufacturing Division
Talbots
Target Corp
Target Corp: Marshall Field’s
Target Corp: Mervyn’s
The J Jill Group Inc.
The Limited Inc.
The Pampered Chef
The Pantry Inc.
Toys R Us
Trimeris Inc.
Trivita Inc.
UCB Inc.: North America Headquarters
Wal-Mart Stores
Wegmans Food Markets Inc.
Western Warehouse
Williams Sonoma Inc.
Yum! Brands Inc.
Zale Corp
TelecommunicationsActerna
ADC Telecommunications Inc.
Adelphia Communication
Alcatel
ALLTEL Corp
Amdocs Inc.
Anda Networks Inc.
Andrew Corporation
Arch Wireless
AT&T
BellSouth Corp
Buckeye Cable System
CenturyTel
Charter Communications
Ciena Corp
Cingular Wireless
Comcast Communications
Comcast: Northwest Division
Cox Communications New England
Cox Communications: Phoenix
Cox Enterprises Inc.
CSG Systems Inc.
DIRECTV
Eatel Corp
Ensemble Communications Inc.
Ericsson Inc.: U.S.
Global Crossing
Hargray Communications Group
Harmonic Inc.
Hickory Tech Corp
Hughes Network Systems
I-Link Inc.
Integra Telecom
JDS Uniphase
Kyocera Wireless Corp
L-3 Communications Corp
Leap Wireless International Cricket
Lucent Technologies
MCI
Monet Mobile Network
Mpower Communications
NEC America Inc.
Neca
New Edge Networks
Nextel Communications
Norstan Inc.
Nortel Networks: United States
NTELOS
Optical Solutions Inc.
Plant Equipment Inc.
Plantronics Inc.
Qwest
Radian Communications Services
RCN Corporation
Riverstone Networks
SBC Communications
Scientific Atlanta Inc.
SES Americom: U.S. Subsidiary
Siemens Information & Communication
Networks Inc.
South Dakota Network Inc.
SpectraSite Communications Inc.
Sprint
SureWest Communications
Swift: Americas
Telcordia Technologies
Telenor Satelllite Services Inc.
Telephone & Data System
Tellabs
Time Warner Cable: Milwaukee Division
Time Warner Telecom
T-Mobile: U.S. wireless division
TracFone Wireless
Triton Corp
TVMAX
UbiquiTel
Ulticom Inc.
United Asset Coverage Inc.
US Cellular Corp
Verizon Communications
Verizon Communications
Vertek Corp: Northeast Region,
Client Care Center
Virgin Mobile USA
Vodafone Americas Inc.
Voice Systems Engineering Inc.
Wiltel Communications Systems Inc.
XO Communications
Zarlink: U.S. Operations
TransportationAir TransportationAirTran Airways
Alaska Airlines
America West Airlines
American Airlines
Atlantic Coast Airlines
Bombardier Aerospace
Bombardier Learjet: U.S. Aerospace Division
Comair
Delta Air Lines
FedEx Corporate Services: Sales, Marketing
& Information Technology Divisions
Gulfstream Aerospace Corp
Horizon Air
KLM Royal Dutch Airlines: United States
Massachusetts Port Authority
Navigant International
Northwest Airlines
SkyWest Airlines
United Airlines
UPS: Southeast
TransportationAll Other TransportationAAA Southern New England
ABF Freight Systems Inc.
Aldworth Company Inc.: Union City,
CA facility
Alexander & Baldwin Inc.
Amtrak
APL Limited: North American
Headquarters
Associated Grocers Inc.
Bay Area Rapid Transit Distrct
Burlington Northern Santa Fe
Canadian National Railways
Cardinal Health Inc.: Medical Products
& Services Division
Chicago Transit Authority
CNF Inc.
CSX Corp
Dallas Area Rapid Transit
Distribution & Auto Service Inc.
Distribution Fulfillment Services:
DFS division
DSC Logistics
Duke Energy: Natural Gas Transmission
Federal Express World Headquarters
FedEx Freight
Galileo International:
Travel Distribution Services
Globus & Cosmos
Graebel Companies Inc.
Greyhound Lines Inc.
HPR Partners
Hudd Distribution Inc.
Ingram Industries Inc.
Market Day Corporation
MARTA
Maryland Port Administration: Agency
MBM Corp
Metropolitan Transit Authority
Metropolitan Washington Airports Auth
MTA Long Island Bus
New Jersey Transit
Norfolk Airport Authority
Norfolk Southern
Orange County Transportation Authority
Pace Suburban Bus Service
Penske Truck Leasing Inc.
Port Authority of Allegheny County
Portland Natural Gas Transmission System
Regional Transportation Authority
Regional Transportation District
Roadway Express Inc.
Ryder
Schneider National Inc.
Southeastern Freight Lines
Teco Transport & Trade: Southern Region,
Maritime Division
The Williams Companies
Transtar Inc.
Union Pacific Railroad Co:
Rairoad Subsidiary
United States Marine Repair
Univar USA
US Freightways Corp
Vistar
Washington Metro Transit Auth
Yellow Transportation Inc.
UtilitiesACS Wireless
AGL Resources
Allegheny Energy
Ameren
American Electric Power
AMP
Associated Electric Cooperative Inc.
Avista Corp
Basin Electric Power Cooperative
Black Hills Corporation
CenterPoint Energy
Chelan County Pud #1
Cinergy Corp
Cipco
Consolidated Edison
Constellation Energy Group
Dakota Electric
Derry Township Municipal Authority
Dominion Resources
Dominion Resources Inc.
DTE Energy Company
Duke Energy
Dynegy Inc.
Exelon Nuclear
Firstenergy
Florida Power & Light Co
Georgia System Operations
Hawaiian Electric Co Inc.
Idaho Power Co
ISO New England
Kansas City Power & Light Co
LG&E Energy: U.S. Subsidiary of
E.ON Energie
Lincoln Electric System
Lower Colorado River Authority
Madison Gas & Electric Co
Marine Spill Response Corp
United States

WorldatWork 2003-04 Salary Budget Survey 87
Marquette Board Light & Power, HQ
Massachusetts Water Resources Authority
MEAG Power
Memphis Light Gas & Water
Metro Wastewater Reclamation District
Metropolitan Utilities District
MidAmerican Energy Company
Midland Cogeneration Venture
Minnesota Power
Nashville Electric Service
Nebraska Public Power District
Nevada Power Co
New England Gas Company
New York Power Authority
Nicor Inc.
North American Energy Services
Northwestern Energy:
Energy Utility Subsidiary
NRG Energy Inc.
NSTAR
NUI Corp
NW Natural
Omaha Public Power Resources
ONEOK Inc.
Orlando Utilities Commission
PacifiCorp
PG&E Corp
PG&E Corporation
Piedmont Natural Gas Company
Pinnacle West Capital Corp
PJM Interconnection LLC
PPL Services Corp
Progress Energy
PSEG Energy Holdings Inc.
Questar Corp: Natural Gas Distribution
and Transmission
Salt River Project
San Antonio Water System
SCANA Corp
Sempra Energy
Severn Trent Systems
Snohomish County
South Central Conn Regl Water Au
Southern California Edison Co: Corporate
Southern Company
Southwest Gas Corp
Southwestern Energy Co
TECO Energy Inc.
Tennessee Valley Authority
Texas-New Mexico Power Co
Thermal Energy Cooperative
Timeless Publications
Tracterbel North America
TXU
TXU Communications
UniSource Energy
United Electric Cooperation
United Illuminating Co
United Water Management & Services Co
Unitil Service Corp
Vectren Corp
Vermont Gas Systems
Wabash Valley Power Association Inc.
Water Conservancy District
We Energies
Westar Energy
Western Area Power Aministration
Wolf Creek Nuclear Oper Corp
Xcel Energy
Wholesale TradeAdvanced Marketing Services
Alex Lee Inc.
American Suzuki
Associated Food Stores
Aviall Inc.
Baker & Taylor
Biacore
Cardinal Health Inc.
CCITRIAD
Cobra Electronics Corp
Converge
Fisher Scientific
General Electric
Genuine Part Company
Gordon Food Service
Gulf States Toyota, Inc.
Hasbro
Hughes Supply Inc.
Hyundai Motor America
Imagistics
Ingram Book: Wholesale Book Distributor
Ingram Micro
Interstate Batteries
Isuzu Motors America Inc.
Itochu International Inc.
JM Family Enterprises Inc.
Kaman Indl Technologies Corp
Katun Corp
Knight Ridder Digital
Lands’ End Inc.
Lawson Products Inc.
Manheim Auto Auction: Region 2
Mazda
Medco Association
Mercedes Benz USA Inc.
Microflex Medical Corp
Miles Kimball
Mitsubishi Fuso Truck of America
Mitsubishi International Corp
Mitsubishi Motors North America Inc.
Mitsui & Company USA Inc.
Morinda Inc.
MSC Industrial Supply Co
Newark Electronics
Newell Rubbermaid
Nissan North America Inc.
Norbest Inc.
Oakley
Olympus America Inc.: U.S. Subsidiary
Pacesetter Steel Service Inc.
Pentax USA, Inc.
PrimeSource Healthcare Inc.
Republic Beverage Co
RISO Inc.
Salt Lake City Corp: City of Salt Lake
Sherwin-Williams
SRI
Subaru of America Inc.
Supervalu
Sysco
The Paper Magic Group:
Fall and Spring Division
Toshiba America Medical Systems
Toyota Motor Sales USA Inc.
TruServ
Unified Western Grocers
US Foodservice
US Oil Co
Verbatim Corp
Viking Electric Supply
Volkswagen of America Inc.
VWR International
Walsh HealthCare Solutions
WW Grainger Inc.
Yamaha Corp of America
Other Services (except Public Administration)DynCorp Technical Services LLC
Goodrich: Aviation Technical Services
Qualex, Inc.
Ratner Companies
Raytheon Co
ServiceCo
The ServiceMaster Company
Other Services(except Public Administration)Religious, Grantmaking,Civic, Professional & Similar OrganizationsALSAC St Jude Childrens Hospital
American Academy of Orthopaedic
Surgeons
American Academy of Pediatrics
American Cancer Society NHO
American Chemical Society
American Heart Association
American Medical Association
American Red Cross
American Society for Quality
AmeriNet Inc.
Cascade Employers Association Inc.
Church of Jesus Christ Latter Day Saints
City of Sachse
Credit Union Executives Society
Diocese of Phoenix
Employers Resource Council
International Churches of Christ
Investment Company Institute
Larson Allen Weishair & Co LLP
National Futures Association
National Multiple Sclerosis Society
Natural Resources Defense Council
Nellie Mae Education Foundation
NRECA
Oncology Nursing Society
Oregon Health Sciences University
RBC Ministries
Sisters of St Francis of Sylvania
Society of Financial Service Professionals
The Bible League
The Cleveland Foundation
The Conference Board
The Employers Association
The Lumina Foundation
The Nature Conservancy
The Salvation Army: Eastern
Pennsylvania and Delaware
United Way
Unity School of Christianity
University Presbyterian Church
WK Kellogg Foundation
World Wildlife Fund
YMCA of the Greater Houston Area
United States
Accommodation and Food ServicesFairmont Hotels & Resorts
Sysco Food Services Inc.: Edmonton
servicing Northern Alberta
The Tdl Group Ltd (Tim Hortons)
Administrative and Supportand Waste Managementand RemediationAccenture: BC HQ & Call Center, NB,
Toronto, Ottawa, Thorold Call Centers,
Toronto HQ
BC Medical Association
Agriculture, Forestry,Fishing and HuntingJames Richardson & Sons Ltd
Norbord Industries Inc.
Weyerhaeuser Canada Ltd:
Canadian operations
Arts, Entertainment,and RecreationAtlantic Lottery Corp
Glenbow Alberta Institute
Northlands Park
Versent Corp
Western Canada Lottery Corp
ConstructionAluma Enterprises Inc.
AMEC Inc.: Canada
Consulting,Professional, Scientific,and Technical ServicesAccenture LLP
Adobe Systems Inc.: Canadian office -
Ottawa
Adp Canada
Amdocs Inc.
Aspen Technology Inc.: Canadian
Subsidiary
Clayton Research Associates Ltd
Eli Lilly
Fisher Scientific International
H&R Block Canada, Inc. -
Canada National Office
H&R Block Canada, Inc. - Tax Field
ICOM Information &
Communications Inc.
Lockheed Martin Canada
Maxxam
Mds Diagnostic Sector
Protegra Technology Group
Stantec Consulting: Canada
Torys Llp
Watson Wyatt Worldwide: Canadian branch
Wyeth: Canadian Subsidiary
Educational ServicesColumbia College
Mc Master University
Saskatoon Public School Division
Siast (Sk Institute Of Applied Science
& Technology)
Simon Fraser University
University of Calgary
Upper Canada District School Board
Finance and InsuranceCredit Intermediation & Related Activities Bank of Montreal
Bank of Nova Scotia
Cambrian Credit Union
Credit Union Central of Nova Scotia
National Bank of Canada
Royal Bank of Canada: Retail Division
TD Bank Financial Group
Trans Canada Credit: Canadian Division
Finance and InsuranceSecurities, Commodity Contracts,Funds, Trust & Other FinanceAetna: Canadian Business
Alberta Pensions Administration
AmeriCredit Corp: Canadian Region
Franklin Templeton Investments:
Canadian Subsidiary
Hospitals Of Ontario Pension Plan
Investment Dealers Association of Canada
Laurentian Bank of Canada
Pitney Bowes: Canadian Region
TSX Group
Volvo Commercial Finance: Canada
Finance and InsuranceInsurance Carriers & Related ActivitiesAllstate
Canada BrokerLink
Canada Life Assurance Co
Citadel Assurance
Co-operators General Insurance Co
Desjardins Financial Security
FM Global: Canadian Operations
Independent Order of Foresters
ING Canada: Insurance Canada
Insurance Corp of British Columbia
L’ Industrielle-Alliance Co
London Life Insurance Co
Manulife Financial
OMERS
Pilot Insurance Company
RBC Insurance
Royal & Sun Alliance Insurance (HK)
Ltd: Canadian Subsidiary
Standard Life Assurance Co
Sun Life Financial Of Canada: Canada
Travel Underwriters
UNUM
Health Care and Social AssistanceACNielsen: Canadian Subsidiary
Bethany Care Society
CGI Inc.
Computer Sciences: Canadian Subsidiary
DWL Inc.
EDS Canada Inc.: Canadian Region
Electronic Arts Canada: Canada
Emergency Medical Care Inc.
epost
Harlequin Enterprises Ltd
Hummingbird Associates
Interlake Regional Health Authority
MacDonald Dettwiler & Associates
MemberWorks Inc.: Canadian Call Center -
Montreal
Moneris Solutions
Nielsen Marketing Research
Oakville Public Library
Oracle Corp Canada Inc.: Canada
Saint Elizabeth Health Care
St Michael’s Hospital
The Hospital For Sick Children
The Toronto Star
Manufacturing3M Canada Inc.
ACCO Canada Inc.
Advanced Medical Optics Inc.:
Canada Region
Apotex
ArvinMeritor Inc.: Canadian plants
and locations
Aventis Pasteur
Boeing Toronto, Ltd.: Toronto
manufacturing Plant
Canadian Blood Services
Chevron Texaco
Chevron Texaco: Canadian Downstream
Church & Dwight Canada
Estee Lauder: Manufacturing Division
Fisher Gauge
Greenlight Power Technologies Inc.:
Test station division
Husky Injection Molding Systems
i-Stat Canada Ltd: Cartridge research,
development & manufacturing
Kohler Co: Cabinetry Division
L-3 Wescam
L-3 Wescam: Healdsburg Division
Lear Corp: Plants in Canada
Louisiana Pacific Corp
Michelin North America (Canada) Inc.
Paccar
Pactiv Corp: Canadian Manufacturing
Operations
Pilkington Libbey Owens Ford Co:
Collingwood Ontario Plant
PolyCon Industries: Manufacturing
Division
PPG Industries: Canada
Siemens Westinghouse Power Corp:
Manufacturing Plant, Hamilton, Ontario
Steelcase Canada Ltd: Canada
Sulzer Mitroflow: Manufacturing
Swift Denim: Quebec
Syncrude Canada Ltd
The Woodbridge Group
Transcontinental Inc.
Unilever United States Inc.
Voith Siemens Hydro Inc.: Canadian
division of Voith Siemens Hydro
World Heart Corp
ManufacturingFood, Beverage & Tobacco Product Manufacturing Agropur Cooperative
Allied Domecq Spirits & Wine:
Manufacturing Division
Cargill Ltd: Canada wide division
Danone Inc.: Canada Fresh dairy product
Hershey Canada Inc.: Divisional office
Hostess Frito-Lay
Kraft Foods Inc.: Canada division of
North America
Labatt Breweries
Mc Cormick Canada Inc.: Canadian
Division - US Parent Company
Mother Parker Tea & Coffee
Robin Hood Multifoods Inc.
Schneider Foods Inc.
ManufacturingChemical ManufacturingAmerican Pharmaceutical Partners:
Canadian Subsidiary
Bayer Rubber Inc.: Southwestern Ontario
region - Manufacturing division
CF Industries: Canandian
Manufacturing division
Chemtrade Logistics
Dow Chemical Company:
Canadian region
Dupont Canada Inc.: Manufacturing
Division
KIK Corporation
MDS Pharma Services
Novopharm Ltd
88 WorldatWork 2003-04 Total Salary Increase Budget Survey88 WorldatWork 2003-04 Salary Budget Survey
Participant Listing — Canadian Firms
WorldatWork 2003-04 Salary Budget Survey 89
Praxair Canada Inc.
Reichold, Inc.: Manufacturing Plant
ManufacturingComputer, Electrical Product & Equipment, Appliance & ComponentsABB Canada Inc.
Actronix Antrum: Canada -
manufacturing division
Agilent Technologies: Canadian division
ATI Technologies Inc.
CAE Inc.
Creo Products Inc.
Raytheon Canada Limited:
Richmond British Columbia Facility
Tundra Semiconductor Corp
ManufacturingMetal ManufacturingJoan Quintin & Associates
Kobay Tool & Stampings Inc.
Nexans Canada Inc.
Toyota Motor Manufacturing Canada:
Canadian Subsidiary - Automotive
Manufacturer
Wescast Industries Inc.
MiningAlbian Sands Energy Inc.
BP Canada Energy Co: Canada
BP Canada Energy Co: Integtrated Supply
& Trading, North America Gas & Power
Devon Canada Corporation
Falconbridge Ltd: Sudbury Mining and
Smelting Division
Imperial Oil Ltd
Inmet Mining Corp
Nexen
PCS Inc.: Corporate office,
Potash Mine Divisions
Petro Canada
Placer Dome Inc.
Samson Investment Co: Canada
Shell Canada Ltd
Suncor Energy Inc.
Talisman Energy
Other Services (exceptPublic Administration)Canadian Breast Cancer Foundation
Canadian Federation of Independent
Businesses
Canadian Medical Protective Association
Canadian Medical Association
Standard Aero Ltd: Canadian Division
United Way
Public AdministrationAlberta Energy & Utilities Boa
CAAT Pension Plan
Canada Council
Canada Mortgage & Housing Corp
City of Edmonton
City of Ottawa
Government of NWT: All Territorial
Public Service
International Dev Research Ctr
Law Society of Upper Canada
MD Robotics: Space Robotics
National Energy Board
Nova Scotia Public Service Commission
Personnel Administration Office
Regional Municipality of Durham
Regional Municipality of York
Saskatchewan Public Service Commission
Saskatchewan Research Council
The Toronto Board of Trade
Workers’ Compensation Board
Real Estate and Rental and LeasingOxford Properties Group
Retail TradeAlberta Motor Association
Canadian Tire Corp Ltd
Cara Operations Ltd
HDS Retail: North American subsidiary
of French company
Loblaw Companies Limited
Maxim Transporation Services Inc.
Mountain Equipment Co-op
PartyLite Gifts Inc.: Canadian Sales
& Marketing Office
Priszm Brandz
Sobeys Canada Inc.
The Business Depot Ltd
The North West Company
Wal-Mart Stores: Canadian Subsidiary
TelecommunicationsAlcatel Networks: Canada
Aliant: Telecom
Andrew Corporation: Canadian operations
AT&T
Bce Corporate Services
Ericsson Communications Canada:
Reserach and Development Center
JDS Uniphase: Ottawa Site
Manitoba Telecom Services
Microcell Telecommunications Inc.
Norstan Inc.
Nortel Networks: Canada
PageNet of Canada Inc.
Radian Communications Services
Rogers Communications Inc.
SaskTel
SED Systems Inc.
Silicon Access Networks
Telus
Zarlink
TransportationAir Canada Inc.
Canadian National Railways
Canadian Pacific Railway
Enbridge Pipelines Inc.:
Canadian Operations
Federal Express World Headquarters:
Canadian Division
First Air
Galileo Canada
Halifax Port Corp
IATA
NAV Canada
The Federal Bridge Corporation Ltd
Toronto Transit Commission
WestJet Airlines Ltd.
UtilitiesAquila Networks Canada
Atco Ltd: Construction and
Power Generation
BC Gas Inc.
BC Hydro
Duke Energy Corp, NC:
Canadian locations
Guelph Hydro Electric Systems Inc.
Independent Market Operator
New Brunswick Power
Newfoundland & Labrador Hydro
SaskEnergy
Transcanada Pipelines Inc.
Wholesale TradeAGFA Corp: Canadian Subsidiary
Canon Canada Inc.
Moen Inc.: Canadian Subsidiary
Nike Inc.
Pfizer Warner Lambert Consumer
Group: Canadian Consumer
Healthcare Division
Sealy Inc.: Canadian Division of Sealy, Inc.
TruServ Canada Cooperative Inc.
Yamaha Motor Corp USA: Canadian
region, wholesale distribution
Canada
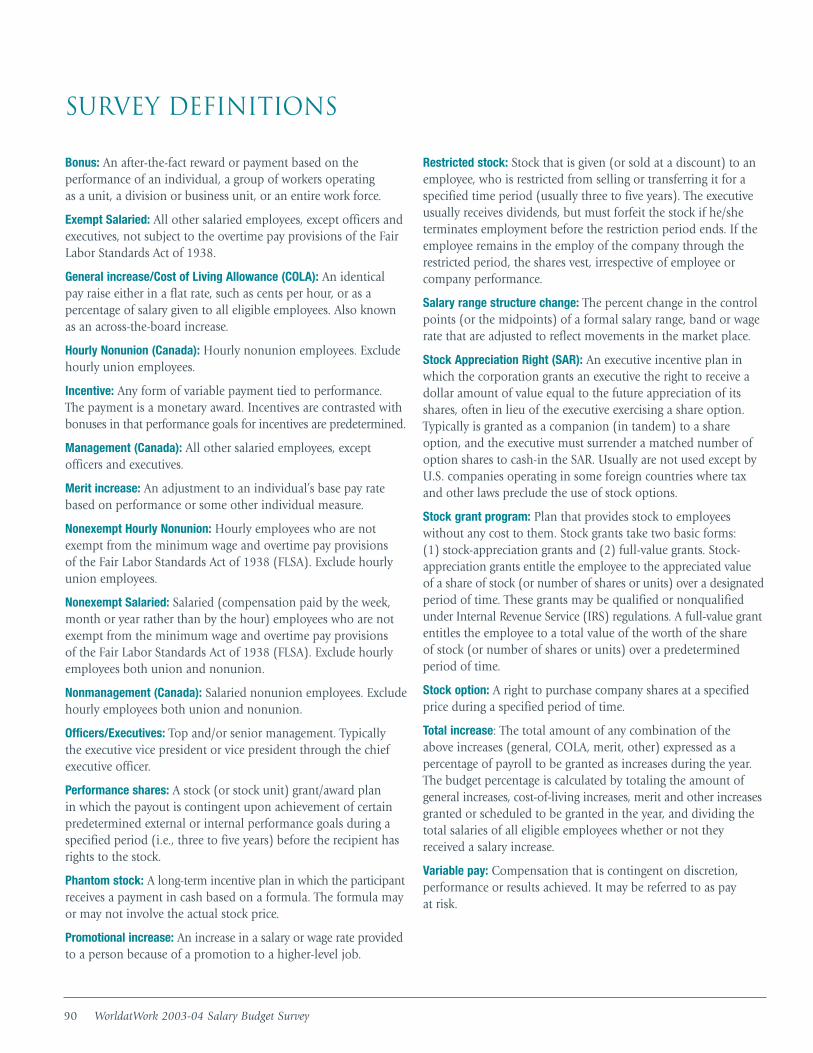
Survey Definitions
Bonus: An after-the-fact reward or payment based on the performance of an individual, a group of workers operating as a unit, a division or business unit, or an entire work force.
Exempt Salaried: All other salaried employees, except officers andexecutives, not subject to the overtime pay provisions of the FairLabor Standards Act of 1938.
General increase/Cost of Living Allowance (COLA): An identical pay raise either in a flat rate, such as cents per hour, or as a percentage of salary given to all eligible employees. Also knownas an across-the-board increase.
Hourly Nonunion (Canada): Hourly nonunion employees. Excludehourly union employees.
Incentive: Any form of variable payment tied to performance. The payment is a monetary award. Incentives are contrasted withbonuses in that performance goals for incentives are predetermined.
Management (Canada): All other salaried employees, except officers and executives.
Merit increase: An adjustment to an individual’s base pay ratebased on performance or some other individual measure.
Nonexempt Hourly Nonunion: Hourly employees who are notexempt from the minimum wage and overtime pay provisions of the Fair Labor Standards Act of 1938 (FLSA). Exclude hourlyunion employees.
Nonexempt Salaried: Salaried (compensation paid by the week,month or year rather than by the hour) employees who are notexempt from the minimum wage and overtime pay provisions of the Fair Labor Standards Act of 1938 (FLSA). Exclude hourlyemployees both union and nonunion.
Nonmanagement (Canada): Salaried nonunion employees. Excludehourly employees both union and nonunion.
Officers/Executives: Top and/or senior management. Typically the executive vice president or vice president through the chiefexecutive officer.
Performance shares: A stock (or stock unit) grant/award plan in which the payout is contingent upon achievement of certainpredetermined external or internal performance goals during aspecified period (i.e., three to five years) before the recipient hasrights to the stock.
Phantom stock: A long-term incentive plan in which the participantreceives a payment in cash based on a formula. The formula mayor may not involve the actual stock price.
Promotional increase: An increase in a salary or wage rate providedto a person because of a promotion to a higher-level job.
Restricted stock: Stock that is given (or sold at a discount) to anemployee, who is restricted from selling or transferring it for aspecified time period (usually three to five years). The executiveusually receives dividends, but must forfeit the stock if he/she terminates employment before the restriction period ends. If theemployee remains in the employ of the company through therestricted period, the shares vest, irrespective of employee orcompany performance.
Salary range structure change: The percent change in the controlpoints (or the midpoints) of a formal salary range, band or wagerate that are adjusted to reflect movements in the market place.
Stock Appreciation Right (SAR): An executive incentive plan inwhich the corporation grants an executive the right to receive adollar amount of value equal to the future appreciation of itsshares, often in lieu of the executive exercising a share option.Typically is granted as a companion (in tandem) to a shareoption, and the executive must surrender a matched number ofoption shares to cash-in the SAR. Usually are not used except byU.S. companies operating in some foreign countries where taxand other laws preclude the use of stock options.
Stock grant program: Plan that provides stock to employees without any cost to them. Stock grants take two basic forms: (1) stock-appreciation grants and (2) full-value grants. Stock-appreciation grants entitle the employee to the appreciated value of a share of stock (or number of shares or units) over a designatedperiod of time. These grants may be qualified or nonqualifiedunder Internal Revenue Service (IRS) regulations. A full-value grantentitles the employee to a total value of the worth of the share of stock (or number of shares or units) over a predeterminedperiod of time.
Stock option: A right to purchase company shares at a specifiedprice during a specified period of time.
Total increase: The total amount of any combination of the above increases (general, COLA, merit, other) expressed as a percentage of payroll to be granted as increases during the year.The budget percentage is calculated by totaling the amount ofgeneral increases, cost-of-living increases, merit and other increasesgranted or scheduled to be granted in the year, and dividing thetotal salaries of all eligible employees whether or not theyreceived a salary increase.
Variable pay: Compensation that is contingent on discretion, performance or results achieved. It may be referred to as pay at risk.
90 WorldatWork 2003-04 Salary Budget Survey
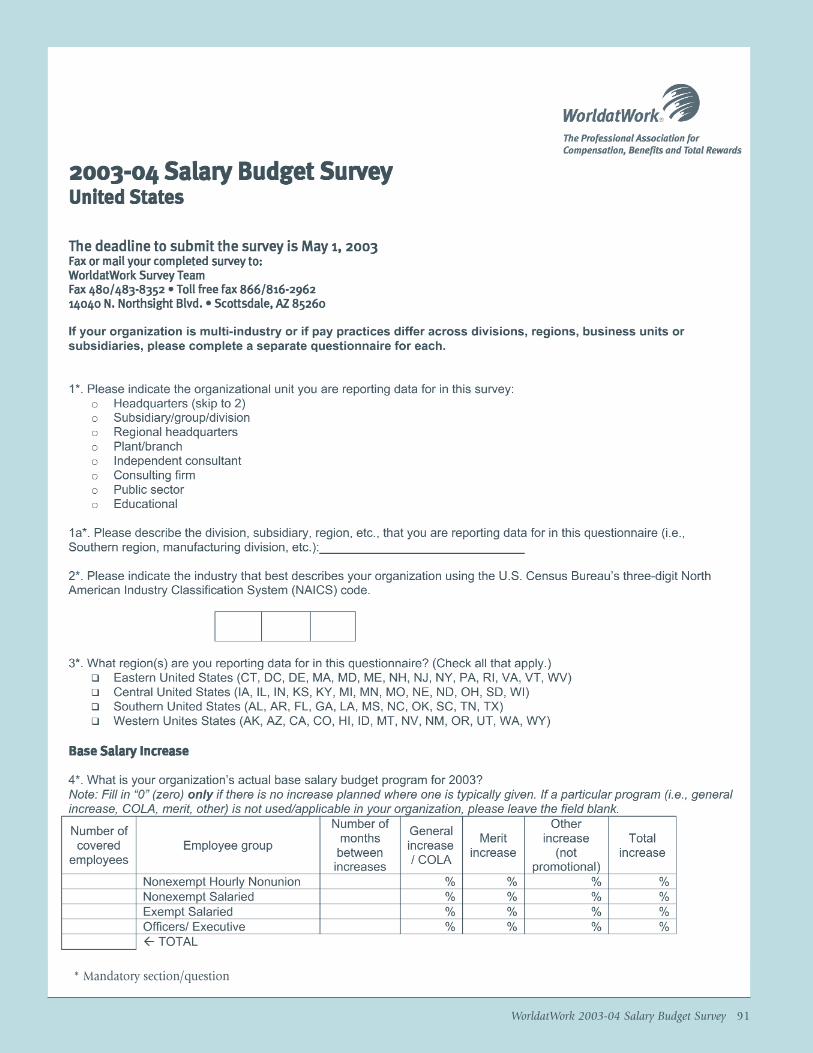
WorldatWork 2003-04 Salary Budget Survey 91
* Mandatory section/question
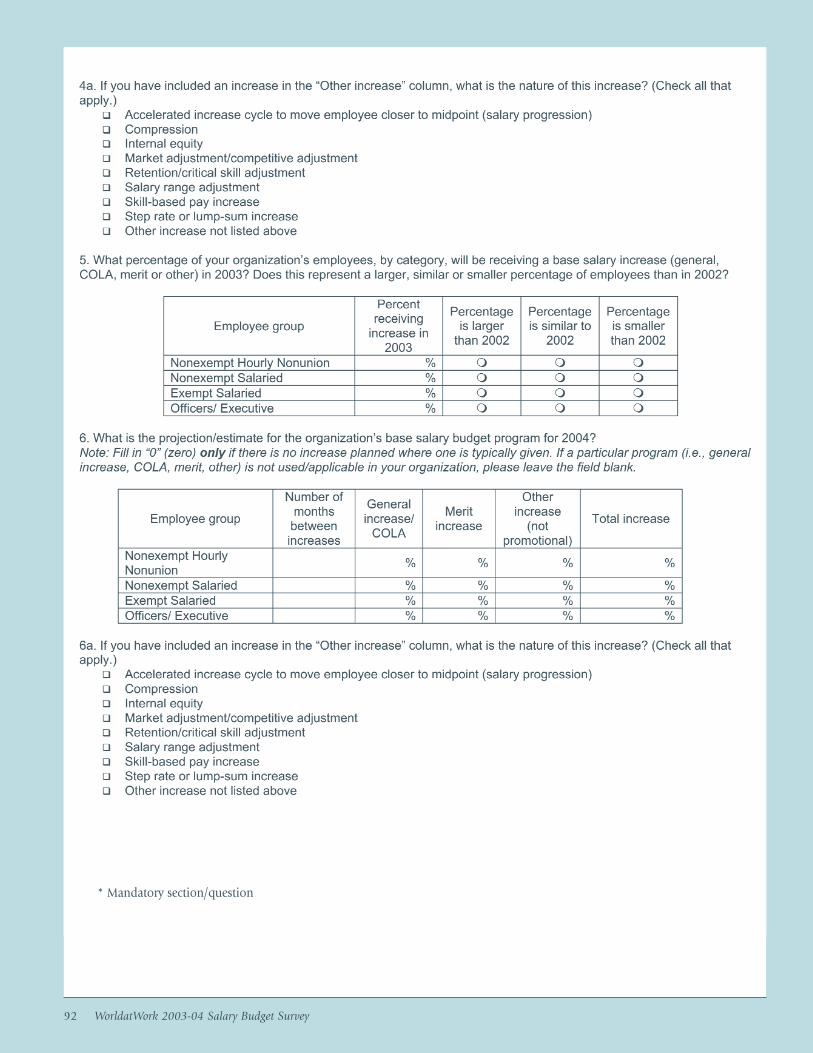
92 WorldatWork 2003-04 Salary Budget Survey
* Mandatory section/question
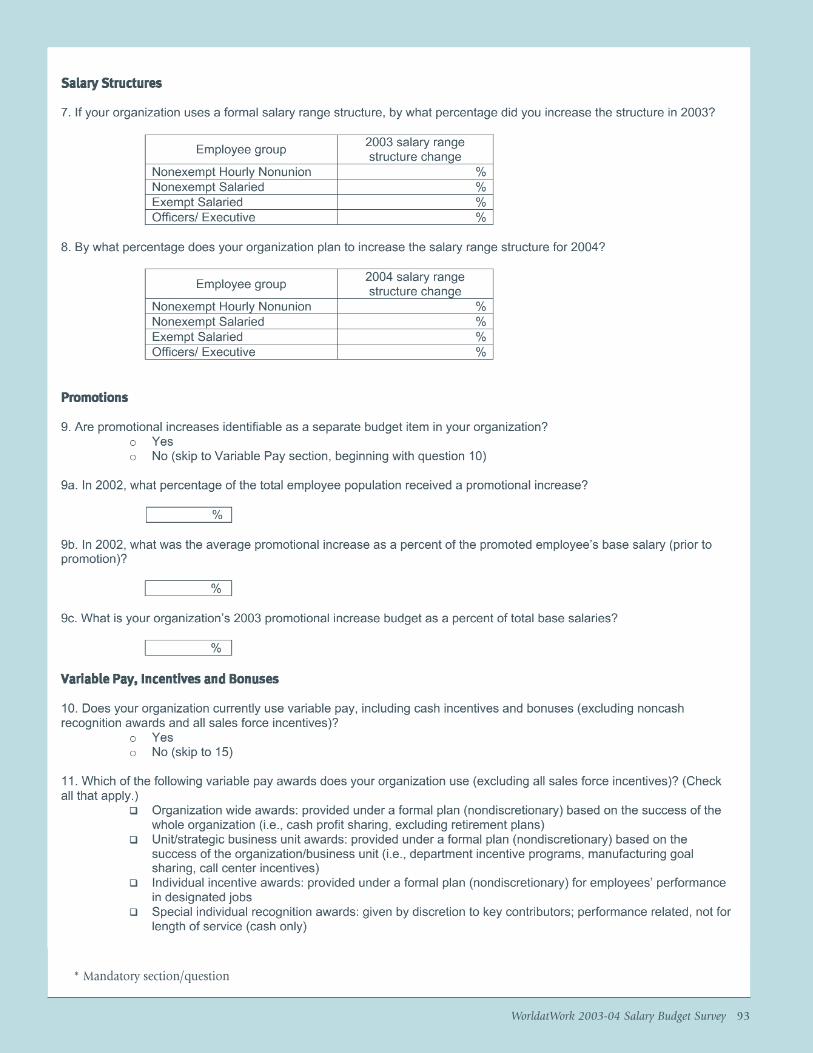
WorldatWork 2003-04 Salary Budget Survey 93
* Mandatory section/question

94 WorldatWork 2003-04 Salary Budget Survey
* Mandatory section/question
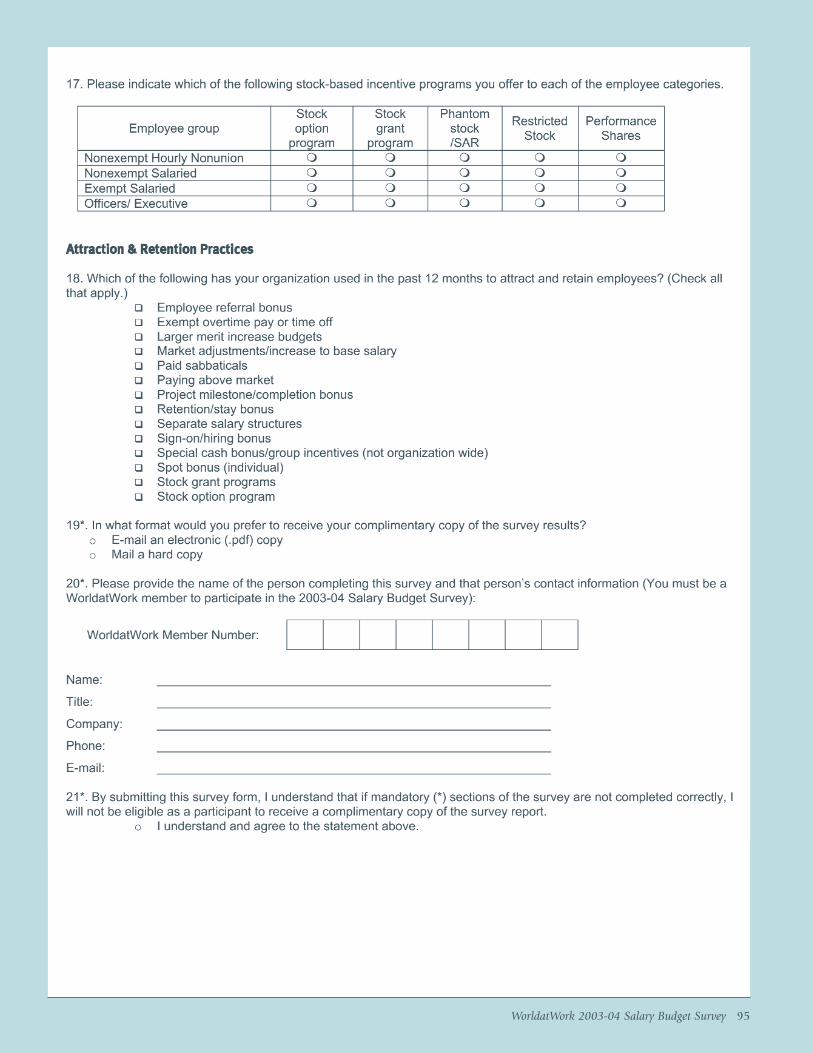
WorldatWork 2003-04 Salary Budget Survey 95

96 WorldatWork 2003-04 Salary Budget Survey


