
California State Park System
StatisticalReport
2009/10 Fiscal Year
Statewide Planning Unit
Planning Division
California State Parks
P.O. Box 942896
Sacramento, California 94296-0001

Statistical Report – FY 2009/10 i
TABLE OF CONTENTS
INTRODUCTION ............................................................................................................. 1
CHAPTER 1 - SUMMARY AND ANALYSIS .................................................................... 5
Number of Units and Properties ................................................................................... 5
Acreage, DPR-Owned .................................................................................................. 5
Acreage, Other ............................................................................................................. 6
Total Acreage ............................................................................................................... 6
Waterfront Feet ............................................................................................................. 6
Individual Camp Sites ................................................................................................... 6
Group Camp Sites ........................................................................................................ 6
Non-Camping Overnight Facilities ................................................................................ 7
Individual Picnic Sites ................................................................................................... 7
Group Picnic Sites ........................................................................................................ 7
Non-Motorized Trail Miles ............................................................................................. 7
Visitor Attendance – Day Use ....................................................................................... 7
Visitor Attendance – Camping ...................................................................................... 7
Visitor Attendance – Total............................................................................................. 8
Revenue - User Fees ................................................................................................... 8
Revenue – Concessions ............................................................................................... 8
Revenue – Miscellaneous............................................................................................. 8
Total Revenue .............................................................................................................. 8
Operating Costs ............................................................................................................ 8
Revenue as a % of Operating Costs ............................................................................ 8
Authorized Permanent Full-Time Positions................................................................... 8
Authorized Temporary Positions ................................................................................... 8
CHAPTER 2 - PARK SYSTEM SIZE AND SCOPE......................................................... 9
CHAPTER 3 - BASIC PARK SYSTEM STATISTICS .................................................... 13
CHAPTER 4 - BASIC STATISTICS – DEFINITION OF TERMS ................................... 39
Park Name .................................................................................................................. 39
Park Classification ...................................................................................................... 39
Unit Number ............................................................................................................... 39
County ........................................................................................................................ 39
Acreage ...................................................................................................................... 39
Waterfront Feet ........................................................................................................... 40
Public Use Facilities ................................................................................................... 40
Visitor Attendance ...................................................................................................... 42
Revenue ..................................................................................................................... 43
Operating Costs .......................................................................................................... 44
Revenue as % of Operating Costs ............................................................................. 45

ii Statistical Report - FY 2009/10
Staffing ....................................................................................................................... 45
CHAPTER 5 - OTHER AVAILABLE STATISTICS ....................................................... 47
A. Internet/Intranet ..................................................................................................... 47
B. Direct Sources ....................................................................................................... 47
Accidents ................................................................................................................. 48
Aerial Photo Files ..................................................................................................... 48
Archaeological Collections ....................................................................................... 48
Condition Assessment Database ............................................................................. 48
Cooperating Associations ........................................................................................ 48
Crimes ..................................................................................................................... 49
Cultural Resources: Sites, Structures, Registrations ............................................... 49
Facilities – Accessibility ........................................................................................... 49
Facilities – Data for Maintenance Purposes ............................................................. 49
Facilities – Museum Collections ............................................................................... 49
Facilities – Three Visitor Facility Types in Detail ...................................................... 50
Incidents .................................................................................................................. 50
Interpretive programs ............................................................................................... 50
Legislative Districts .................................................................................................. 50
Park Features, Attractions and Associations ........................................................... 51
Photographic Archives - ........................................................................................... 51
Reservations for Campsites, Hearst Castle ® .......................................................... 51
CHAPTER 6 - HISTORY OF THIS REPORT ................................................................ 53
A. Division of Beaches and Parks ............................................................................. 55
B. State Parks ........................................................................................................... 55
APPENDIX A - SELECTED DATA – 1990/91 TO 2000/01 ........................................... 57
APPENDIX B - PUBLIC USE FACILITY SURVEY – FY 2009/10 ................................. 59
APPENDIX C - INTERNAL UNITS, MINOR SYSTEM PROPERTIES .......................... 63
Table C-1 – State Park System – Internal Units ........................................................ 65
Table C-2 – Minor System Properties ........................................................................ 71
APPENDIX D - DEPARTMENT ORGANIZATION CHART ........................................... 73
APPENDIX E - OTHER SOURCES OF PARK SYSTEM DATA ................................... 77
A. California State Parks............................................................................................ 77
Archives ................................................................................................................... 77
Central Records Office ............................................................................................. 77
Internal Departmental “Libraries” ............................................................................. 77
Statistical Report – FY 2009/10 iii
B. Other Sources ....................................................................................................... 78
California State Library (Sacramento) ...................................................................... 78
National Association of State Park Directors ........................................................... 78
PUBLICATION CREDITS .............................................................................................. 79
NOTES .......................................................................................................................... 80

iv Statistical Report - FY 2009/10
INTRODUCTION The central purpose of this edition of the annual statistical report is to provide information on the basic parameters of the California State Park System (State Park System) for a specific period of time; the 2009/10 fiscal year. This year spanned the period of July 1, 2009 through June 30, 2010. As indicated in Chapter 3, some of the data used to portray the State Park System for this fiscal year are current as of the beginning of the fiscal year, July 1. Some are current as of the last day of the fiscal year, June 30. Most of the State Park System data reflects the measurement of activity that took place between these two points in time, during the course of the entire fiscal year. Like any responsible organization, the State Park System needs to clearly know the scope, scale and dimensions of its activities and operations. To have this knowledge, the State Park System needs information, as accurate as can be reasonably and economically obtained, on its assets, its activities and its products. Collectively, this information will give a measure of the State Park System - what its various resources are, what it does with them, and what are the useful results of its activities. Such information will allow this organization to broadly view itself and the workings of the State Park System at a specific point in time and, when comparing this view with those taken at other points in time, will allow one to see and to perhaps analyze the changes that have occurred. It is a convention that the official number of classified units and major unclassified properties that constitute the State Park System is established on the first day of each fiscal year, July 1, and does not change during that year. The few parks and properties that may in actuality be added to (or removed from) the System during the year will not be included in the official total until the first day of the following fiscal year. Reflecting this convention, the State Park System contained a total of 260 classified units and 18 major unclassified properties, for a total of 278 areas, during the 2009/10 fiscal year. For management purposes, these units and properties were grouped into districts, many of which further organized them into smaller groupings called sectors. The 25 districts and 65 sectors used in this publication reflect the organizational arrangement of the System’s “field” on the last day of the fiscal year, June 30, 2010. This statistical report will focus exclusively on information that is related to or reflects on the State Park System’s “field” areas and activities, the system’s 278 classified units and major unclassified properties. Specifically excluded from the data on the System’s “field” activities and expenditures is the small number of the
Statistical Report - FY 2009/10 1
functions that serve the field and are situated in field locations outside of headquarters, but are functions which are not associated with specific units or districts, or which are considered an extension of the headquarters’ responsibilities. These functions include the two regional service centers (which provide unit-level planning and technical assistance), the two regional communication centers, and the statewide personnel training center at Pacific Grove. Also excluded are the Museum Collections Section and the Archaeological Lab and Collections. The operation and management of the State Park System parklands and facilities requires approximately 65.3% of the effort and expenditure needed to operate California State Parks in which the State Park System is administratively located. This compares to 68.57% of the effort and expenditure for FY 2008/09 (The FY 2008/09 Statistical Report mistakenly reported this figure as 80%). The current percentage includes the “field” activities and expenditures noted above that serve the field and are situated in field locations outside of headquarters, but are functions which are not associated with specific units or districts, or which are considered an extension of the headquarters’ responsibilities. Most of the remainder of the non-“field” costs excluded from this report are those for accomplishing the wide array of administrative and control functions that take place at the Sacramento, California headquarters. Also excluded are the costs of California State Parks’ activities in managing those of its functions which are not at all related to the State Park System, mainly the administration of the state’s many park and recreation grant programs, the provision of technical assistance services to local park and recreation agencies, and any expenses related to California State Parks’ Office of Historic Preservation. During the 2009/10 fiscal year, the State Park System was host to many tens of millions of visitors, cost hundreds of millions of dollars to manage and operate, employed over eighteen hundred permanent staff people, and generated tens of millions of dollars in fees and other revenues. During the course of this fiscal year, the funds and staff allocated at the field level were applied to many critical objectives involving the protection and management of the State Park System’s natural and cultural resources, as well as to the provision of high-quality resource-based outdoor recreation opportunities for park visitors. At the same time, staff provided the park visitors with a variety of direct services ranging from interpretive programs to public safety. This report provides the end of the fiscal year’s numerical information on many of the State Park System’s most basic activities, revenues and expenditures, reflecting certain of the System’s more measurable “inputs” and “outputs” for the collective 365-day period. Some of this information, such as park acreage and visitor attendance, is available at the level of the individual unit or property. Other information, such as a park's operating costs and staffing numbers, is not available at the level of an individual
2 Statistical Report - FY 2009/10
park or property. Such information is available only at the district level, where such resources are allocated as a single amount, so as to allow the manager to make flexible sub-allocations to various units based on needs that shift throughout the year. In general, this statistical report contains the most basic data for the 2009/10 fiscal year, as well as some analysis of this information. It also contains reference to important specialized System data that is not widely available, but which may be directly obtained from identified staff members. Chapter 1 highlights the salient points found in the report’s data for the 2009/10 fiscal year, data which is found in detail in Chapter 3, and makes some analysis of this data’s substance and significance. Where appropriate, comparisons may be made with similar data sets from earlier annual statistical reports or from other sources. Chapter 2 briefly describes the size and organization of the State Park System as it existed at the end of the fiscal year, on June 30, 2010. Chapter 3 is the core of this report, its multi-page table providing the selected statistical information on the 278 classified units and major unclassified properties that constituted the State Park System during the 2009/10 fiscal year. The data categories and their sequence on the table are arranged so as to provide maximum comparability with the layout of previous statistical reports. Chapter 4 provides important information about the basic data that appears in the table in Chapter 3. This includes definitions of the data categories and the terms that are used. Where important, the data collection methodology is described. This chapter also provides information on the known limitations in the scope and accuracy of this data, and indicates the source(s) within California State Parks where this data originates. Chapter 5 provides information about and access to a variety of system-related data which is beyond the necessarily limited scope of this statistical report. The State Park System creates a wide variety of other data and information, often specialized in nature and not widely known or available. This chapter provides references and citations which refer the reader to a variety of more specialized data on the State Park System’s field activity, management and operations. Chapter 6 provides information on the history of California State Parks’ annual statistical report series and on its predecessor documents. It provides specific titles of documents containing basic data reaching back many decades. Appendix A briefly refers the reader to the 2001/02 Statistical Report, which provided key data for the fiscal years from 1990/91 through 2000/01, when such reports were not prepared.
Statistical Report - FY 2009/10 3
Appendix B provides information on the methodology and the results of the detailed inventory used to develop data on the State Park System’s three basic types of public use facilities –overnight use (mainly camping), picnicking, and (non-motorized) trail mileage – used in this report. This survey also contains information on the capability of these facilities to accommodate visitors, of their “carrying capacity.” Appendix C provides, as a matter of having a complete record of the State Park System’s classified units, basic information for its 87 classified internal units, which are specialized units situated within the boundaries of certain other classified units. This appendix also identifies and provides limited data on a handful of small or minor properties which in 2009/10 were owned by California State Parks but which were not associated with any of the State Park System’s set of 278 classified parks and major unclassified properties. Appendix D contains an organization chart of California State Parks, included here mainly to indicate the relationship of the State Park System’s field units to the rest of the system. Appendix E provides references to sources of statistical data and other information about the State Park System and to collections of written materials which exist both internal to and external to California State Parks. This information is very different from and does not duplicate the “Other Available Statistics” provided in Chapter 5 or the “Selected Data” referred to in Appendix A. A new and revised edition of this statistical report will be produced following the close of each fiscal year. Readers’ suggestions for additions and improvements to this regularly issued document may be made to California State Parks, Planning Division.
4 Statistical Report - FY 2009/10

This page intentionally left blank.
CHAPTER 1 - SUMMARY AND ANALYSIS
The purpose of this statistical report is to provide selected data sets which portray the fundamental measures of California State Parks for the 2009/10 fiscal year. Collectively, this data shows the scope and scale of the State Park System, its activities and operations, and offers implications as to the benefits derived by its users. This large amount of data has been assembled in the extensive table that is the basis of Chapter 3. The purpose of this chapter is to draw from the data found in Chapter 3 and to highlight its major findings. In many cases, data from this year’s report will be compared with that from last year’s report, revealing changes over time. Where possible, some commentary will be made on the data or its trends, bringing useful perspective to the information presented. The ability to compare data through time will be limited due to the lack of detailed statistical information from the eleven years 1990/01 through 2000/01, during which time statistical reports were not prepared (see Appendix A). This report’s summary and analysis is limited to the system-wide totals of the various data sets. This statistical report’s summary, with its commentary and analysis, follows. For definitions of the data categories, see Chapter 4.
* * * * * Number of Units and Properties - The total figure of basic classified units and major unclassified properties adjusted to 278. These 278 units reflect the October 2008 reclassification and addition of the adjacent Año Nuevo State Natural Reserve into the existing Año Nuevo State Park, reducing the number of classified units in the state park system by one. Acreage, DPR-Owned - The total of 1,316,729.98 acres reflects an increase of ~0.20% (2,661.78 acres) over the previous year. Some of the major acquisitions were:
• Gaviota SP, Grantor: The Trust for Public land, 43.37 acres, No Cost to DPR, Gift Value = $3,000,000.00
The acquisition of this property will protect coastal view shed from further development and will provide day-use access to trails into the Gaviota back country and the Los Padres National Forest. The property will also protect sensitive wildlife and habitat, including grasslands, riparian, chaparral and coastal sage scrub.
• Anza Borrego Desert SP, Grantor: Anza Borrego Foundation, 1,113.89
acres, No Cost to DPR, Gift Value = $470,000.00
Statistical Report - FY 2009/10 5

Acquisition of this property provides for the preservation of flat-tailed horned lizard habitat and will help to protect the ecosystem. The land will be included in the Borrego Badlands Flat-tailed Horned Lizard Management Area and provided mitigation credits for San Diego County water projects thereby reducing the State's water usage from the Colorado River.
Acreage, Other - The total of 250,169.3 acres shows a decrease of approximately 0.0001% (0.2 acres) from the previous fiscal year report. Total Acreage - The State Park System’s total acreage, a data category not reported in the table, is the total of the two previous figures. At 1,566,899.28
acres, this total reflects an increase of approximately 0.17% (2,661.58 acres) from the previous fiscal year. Waterfront Feet - The total of the four categories of waterfront footage is 8,647,671 (the equivalent of 1,637.82 miles), a 0.28% (24,353 linear feet) increase over the previous year. The waterfront length related to the shoreline of lakes and reservoirs (“L”) is 3,417,067 linear feet (or approximately 647.17 miles), no change from the previous year. The length of frontage on the Pacific Ocean and its major bays and estuaries (“O”) is 1,681,429 linear feet (the equivalent of 318.45 miles), a 1.47% increase attributed to updating the Statistical Report spreadsheet to include minor system properties. The length of river footage (“R”) is 1,728,565 linear feet (the equivalent of 327.38), reflecting no change from the previous year. The length of submerged footage (“S”) remained the same at 1,820,610 linear feet (the equivalent of 344.81 miles). All waterfront feet reported reflects actual footage that is owned or managed by California State Parks. Some units within the system include waterfront footage that is operated by entities outside California State Parks. Individual Camp Sites - A total of 14,207 individual sites, as defined in Chapter 4 and determined by the survey described in Appendix B existed in the State Park System in the 2009/10 fiscal year. These data reflect an increase of 113 individual camp sites from the previous year, a 0.80% jump. In addition, Silver Strand SB added 136 new developed campsites by converting some of its overflow/wayside camping areas. Appendix B explains why overflow/wayside camping data is not included in this report. Because of the way individual camp sites (sometimes labeled as “family camp sites”) have been variously defined and counted over the last three decades, this figure cannot be usefully compared with any “information” earlier than fiscal year 2001/02. Over the last twenty years, estimates have run as high as 17,772 sites. Group Camp Sites - A total of 324 such sites, as defined in Chapter 4 and determined by the survey described in Appendix B, existed in the State Park
6 Statistical Report - FY 2009/10

System in the 2009/10 fiscal year. This number reflects an increase (9.83%) of 29 sites. Hungry Valley SVRA added a new group campground (Honey Valley) with 15 sites which accounts for the majority of the change in the number of group camp sites. Non-Camping Overnight Facilities - There were 652 such facilities, as defined in Chapter 4 and determined by the survey described in Appendix B, existing in the State Park System. The number of non-camping overnight facilities increased 0.62% (4 sites) from the previous year. These facilities were a range of accommodations which include rooms in commercial lodging, cabins and the use of space in hostels. Individual Picnic Sites - A total of 7,245 such facilities, as defined in Chapter 4 and determined by the survey described in Appendix B, existed in the State Park System. This reflects a 1.56% increase (111 sites) in individual picnic sites from the previous year. In addition, Silver Strand SB modified some of their picnic areas for ADA purposes. This has increased the number of tables by 60 but only slightly increased the number of seats/capacity. Group Picnic Sites - A total of 243 facilities, as defined in Chapter 4 and determined by the survey described in Appendix B, existed in the System. This reflects a 8.48% increase (19 sites) in group picnic sites from the previous year. Hungry Valley SVRA added 15 group picnic sites which accounts for the bulk of the overall increase in group picnic sites system-wide. Non-Motorized Trail Miles - A total of 5,091.33 miles, as defined in Chapter 4 and determined by the survey described in Appendix B, existed in the System. This is a 13.77% increase or 616 miles more than that reported in the previous year. This change is almost entirely the result of field unit respondents correcting their prior year’s data using more precise data collection techniques, not of changes in the actual number of trails. Visitor Attendance – Day Use - The total of 59,197,588 day use visitors included both those who paid an admission fee and those who were admitted free. Almost three quarters (70.24%) of all day use visits are unpaid or free. This total figure reflected a decrease of 9.45% over the previous fiscal year. Since the tabulation of visitor attendance includes many variables such as but not limited to methodology of collection and economic factors, any explanation of this decrease would be speculative. Visitor Attendance – Camping - This figure reached a total of 6,305,068 overnight uses, a decrease of 11.93% over the previous fiscal year. Note that the camping attendance contains only some of the overnight use of the system that takes place in structures, as explained in Appendix B. This situation makes it impossible to make a valid correlation between the total of overnight public use facilities and overnight visitor attendance.
Statistical Report - FY 2009/10 7
Visitor Attendance – Total - This figure reached 65,502,656 a decrease of 9.70% over the previous fiscal year report. It should be noted that the State Park System’s unit-level attendance figures, with few exceptions, are based on estimates rather than actual counts. In addition, the total attendance for the State Park System as a whole is believed to be substantially underestimated. The circumstances surrounding both of these factors are discussed as part of the definition of “visitor attendance”, found in Chapter 4. Revenue - User Fees - The total of $81,488,326 reflects a 16.13% increase over the previous fiscal year. Some visitor fees increased during the 2009/10 fiscal year. Revenue – Concessions - The total of $12,241,748 reflects an increase of 26.17% over the previous year. These data indicate an increased shift from internal to concession management of some Department revenue based entities as well as the scenario discussed in Revenue – Miscellaneous (below). Revenue – Miscellaneous - The total of $290,581 reflects a decrease of 19.20% over the previous year which reflects an effort to classify miscellaneous revenue into more specific revenue sources such as concessions. Total Revenue - The System’s total revenue of $94,020,655, the sum of the above three categories, reflects an increase of 17.18% ($13,786,881) from the prior fiscal year. The three revenue categories listed above, based on California State Parks’ “earnings”, constitute an important part of the State Park and Recreation Fund (SPRF). Occasionally, districts will report a negative revenue figure. This does not necessarily mean that the district has lost revenue but is more likely a carryover debit from the previous year or a cost associated with an individual unit reported at the district level. Operating Costs: The authorized base budget for field operations was a total of $171,091,590, a decrease of 23.45% over the previous fiscal year. Revenue as a % of Operating Costs - In the 2009/10 fiscal year, the total revenue was 52.2% of the field operating costs for the System as a whole, compared to 35.9% the previous fiscal year. Authorized Permanent Full-Time Positions - The total of 1,843.9 positions for the 2009/10 fiscal year reflected an increase of 4.03% over the previous year. Authorized Temporary Positions - In terms of person-year (PY) equivalents, a total of 805 positions reflected a decrease of 0.51% over the previous fiscal year.
8 Statistical Report - FY 2009/10

This page intentionally left blank.

CHAPTER 2 - PARK SYSTEM SIZE AND SCOPE
The State Park System consisted of 278 properties during the entire 2009/10 fiscal year. Of these, 261 were units that have been classified. The other 18 were major unclassified properties for which classification as distinct new units could be anticipated at some future date. All of these specific units and properties are identified by name on Lists 1 and 2 of the July 1, 2009 edition of the publication Planning Milestones for the Park Units and Major Properties of the California State Park System. The number and distribution of these properties, by classification, is as follows:
State Park (SP) 87 State Beach (SB) 63 State Historic Park (SHP) 51 State Recreation Area (SRA) 32 State Natural Reserve (SNR) 16 State Vehicular Recreation Area (SVRA) 8 State Historical Monument (SHM) 1 State Seashore (SS) 1 Wayside Campground (WC) 1 State Cultural Reserve 0 Underwater Recreation Area 0
Classified Units 260 Major Unclassified Properties 18 Total – State Park System 278
The California Resources Code, Sections 5019.50 et seq, describes and characterizes each of the eleven classifications listed above. The code indicates in general terms the types of features and general qualities inherent in a unit that is given a particular classification, and also provides guidance as to the sort of management to be accorded to such a unit. State Vehicular Recreation Areas are technically part of the State Vehicular Recreation and Trails System which, by legislation, is organizationally separate from the State Park System. For this reason, much of the data for the two systems are collected separately. The data for the two systems, however, is brought together for the purposes of this statistical report. Located within and being an integral part of many of the State Park System’s 261 units with the classifications indicated above, there were an additional 87 units which were identified by three other classifications. These other classifications call
Statistical Report - FY 2009/10 9
for enhanced, specialized protection and management for the noteworthy features or qualities found in the unit in question. Commonly termed “internal units”, and found on List 3 of the Planning Milestones publication cited above, the number and distribution of these units, by classification, is as follows:
Cultural Preserve (CP) 15 Natural Preserve (NP) 61 State Wilderness (SW) 11 Total – Internal Units 87
The State Wilderness units, in addition to being part of the State Park System, are also part of a larger California Wilderness Preservation System, as defined in Public Resources Code Section 5093.3. In addition to the lands noted above, which constitute the official State Park System, California State Parks owns a number of small or minor properties that are not related to any of the System’s classified units or major unclassified properties. Information on these minor State Park System properties appears in Table C-2, in Appendix C. The State Park System’s 278 classified units and major unclassified properties are administered through districts, groupings based largely on their geographic proximity. Larger districts are often subdivided for management purposes into smaller areas called sectors. During the 2009/10 fiscal year, the units and properties of the State Park System were administered through 25 districts. These districts contained, collectively, a total of 65 sectors. It is important to note the manner in which any change in the size or composition of the State Park System is officially determined; a matter alluded to in this report’s Introduction. Because the California State Park and Recreation Commission may name and classify property at its meetings, and new properties may come into system ownership during the year, the size of the State Park System may change over the course of a fiscal year. To transform this natural periodic fluctuation to an administratively useful once-a-year change, California State Parks has adopted a convention which deems the State Park System to have a single size and composition, unchanging over the course of an entire fiscal year. By this convention, the official size and composition of the State Park System is changed only once a year, on each July 1. To accomplish this, the changes that have been made during a year, as well as candidates for changes still needed to be made in updating the State Park System’s official list of units and properties, are all identified in late June.
10 Statistical Report - FY 2009/10
These changes can include the addition, removal or combining of specific units or properties. They can include changes of unit or property names, and changes in unit classifications. Such changes, both already accomplished or proposed, are discussed in late June of each year by California State Parks’ Planning Policy and Programming Committee. Its recommendations for desirable changes are submitted near the end of the fiscal year to the Director of California State Parks for approval. Those changes which are approved by the Director in late June become official on July 1. These changes modify the existing set of State Park System units and properties and the new official set for the next fiscal year appears in that year’s July 1 edition of California State Parks’ annual Planning Milestones publication. Changes in the State Park System’s set of districts, their boundaries or names, are the result of administrative decisions, proposals for which are approved by the Deputy Director of Park Operations and the Director of California State Parks. Such changes may be made at any point in the fiscal year. The same is true for changes made in the boundaries of the sectors within districts. The districts and sectors reported in this statistical report are those that were in place on June 30, 2010, at the end of the 2009/10 fiscal year.
Statistical Report - FY 2009/10 11

12 Statistical Report - FY 2009/10

This page intentionally left blank.
CHAPTER 3 - BASIC PARK SYSTEM STATISTICS
The following set of pages presents a single table which contains data providing the basic statistics which measure selected aspects of the scale, activity and operation of the California State Park System during the 2009/10 fiscal year. In this table, the individual districts of the basic State Park System, as they existed at the end of the fiscal year, are presented alphabetically and, within each district, its sectors are arranged alphabetically. When classified units and major unclassified properties are managed out of a district office, that district office is - for the purpose of this report only - considered a de facto sector. Within each sector, the classified units and major unclassified properties are listed alphabetically. Internal classified units do not appear in this table, to avoid the double counting that would result from including their statistics along with those for the unit in which they are situated. Basic information on internal classified units appears in Appendix C. The table has three parts that are joined sequentially. The first part provides information for each district. The second provides the totals for each of the districts. The last part combines the totals for all 25 districts, giving the total for the State Park System as a whole. To this total is added the information for minor system properties which, when combined, give the grand total for all of the properties of California State Parks. In addition, totals are provided for acreage, public use facilities and visitor attendance are amalgamated by unit classification (e.g., State Park, State Historic Park, etc.). For each entry, the names of the classified units are followed immediately by their classifications, in abbreviated form. The names of the major unclassified projects appear as names only, without being otherwise indicated by a word like “project” or “property” unless that designation has been officially added to the name of the project or property. Thirty-two units and properties in the State Park System are operated not by the state but instead by local government park agencies (see July 1,2009 Planning Milestones List 10) or by non-profit organizations, acting through individual operating agreements with California State Parks. Twenty-eight of these units meet the criteria to be included in this publication, i.e., classified units and major unclassified properties. The names of these units and properties appear in italics. Their acreage data is included in the State Park System’s subtotals and totals, but in many cases there is no available information on their other characteristics - their facilities, visitor attendance, operation costs, and the like.
Statistical Report - FY 2009/10 13
There are certain units and properties which are operated by the State Park System where no attendance is reported. These are usually small, isolated, little developed and little-visited units where counting visitors or collecting entrance fees would not justify the costs of doing so. Most of the data in the table is available and reported on the basis of the individual unit or property. However, in cases of data on such topics as operating cost and staffing, the reported data is of the allocations of these resources made by headquarters to the district. This allows the district to be flexible in allocating (and reallocating) its funds to its sectors and individual units in the course of the year. Therefore, there are no unit-level allocations shown in these categories. Also, in the case of revenues, some of these monies come not into individual units but instead into the district or sector offices; these are recorded as district or sector income rather than unit income. Some of the categories of information in this chapter’s table, which appear as column headings, contain data which is current as of either the beginning or the end of the fiscal year. The remainder of the data categories reflects activity which occurs during the course of the fiscal year, between the first and last day. Categories with data which are current as of the first day of the fiscal year, July 1, 2009 are those which define the State Park System for the entire fiscal year (2009/10). This information corresponds exactly with the classified units and major unclassified properties (Lists 1 and 2) of the publication Planning Milestones for the Park Units and Major Unclassified Properties of the California State Park System which is dated July 1, 2009. These categories are:
• Unit name and classification, or name of the major unclassified property • Unit number • County or counties in which the unit or property is located
The following categories of information in the table show what is valid or in place as of the last day of the fiscal year, June 30, 2010. These categories are:
• District name • Sector name • Acreage - state owned • Acreage - other • Waterfront feet – separated into lake (“L”), ocean (“O”), river (“R”) and
submerged (“S”). • Public use facilities - individual camp sites • Public use facilities - group camp sites • Public use facilities - non-camping overnight facilities per individual unit (e.g.
rooms, cabins, yurts, etc.) • Public use facilities - individual picnic sites • Public use facilities - group picnic sites
14 Statistical Report - FY 2009/10

• Public use facilities - non-motorized trail miles The last categories of information indicate activity undertaken, revenue generated, or resources expended over the 365-day course of the year, from July 1 through June 30. These categories are:
• Visitor attendance - day use • Visitor attendance - camping • Revenue - user fees • Revenue - concessions • Revenue – miscellaneous • Revenue - total • Operating costs • Revenue as a percent of operating costs • Authorized staffing levels - permanent full-time • Authorized staffing levels - temporary, in PY (person-year) equivalents
Definitions of these data categories may be found in Chapter 4. Two symbols which appear in the table, defined as follows, are used so as to leave no space or cell empty. • A zero (“0”) is put in a space where there could be a number, indicating that the
actual number is zero. • A dash (“-“) is put in a space where the appropriate information does not exist
or is unavailable, either because it is not collected (e.g. attendance of small or remote units) or because it is not computed for record-keeping purposes (e.g. the unit allocation of a lump-sum amount of district funding).
Statistical Report - FY 2009/10 15

ACREAGE
ANGELES DISTRICT
Angeles District HQ Office
Los Angeles Sector
Castaic Lake SRA 569 LA 1965 0.00 4,223.62 218,943 L 0 2 0 35 4 3.40
Dockweiler SB 541 LA 1948 91.40 0.00 19,800 O 118 0 0 0 0 0.00
Kenneth Hahn SRA 516 LA 1984 400.58 0.00 0 0 0 14 0 0.00
Los Angeles SHP 578 LA 2001 32.00 0.00 0 0 0 3 0 1.10
Los Encinos SHP 546 LA 1949 4.73 0.00 0 0 0 3 1 0.00
Pío Pico SHP 551 LA 1917 1.12 4.35 0 0 0 4 5 0.00
Placerita Canyon SP 552 LA 1949 341.72 0.00 0 3 0 6 3 5.60
Rio de Los Angeles State Park SRA
563 LA 2001 58.222 0.00 3,376 R 0 0 0 0 0 0.25
Santa Monica SB 557 LA 1948 27.21 21.27 9,794 O 0 0 0 0 0 0.00
Santa Susana Pass SHP 505 LA 1979 670.68 0.00 0 0 0 0 0 0.00
Verdugo Mountains 597 LA 1984 251.41 0.00 0 0 0 0 0 0.00
Watts Towers of Simon
Rodia SHP518 LA 1978 0.11 0.00 0 0 0 0 0 0.00
Will Rogers SB 562 LA 1931 82.14 0.00 16,630 O 0 0 0 0 0 0.00
Malibu Sector 0
LA 2,397.04 0.00
VEN 116.41 2.46
Malibu Creek SP 537 LA 1974 8,151.36 63.86 63 1 0 50 1 37.30
2,404 O
1,785,960 S
Point Dume SB 533 VEN 1958 32.14 4.44 2,927 O 0 0 0 0 0 3.00
Point Mugu SP 573 VEN 1966 13,925.15 21.46 19,224 O 72 3 0 30 0 53.00
Robert H. Meyer Memorial SB
590 LA 1978 37.01 0.00 2,342 O 0 0 0 0 0 0.00
Topanga Sector 0
Topanga SP 572 LA 1967 12,655.02 10.75 8 0 0 16 1 76.60
Will Rogers SHP 559 LA 1944 189.12 0.00 0 0 0 12 3 10.00
39,532.22 4,394.39 218,943 L 0 403 10 0 179 18 197.45
3,376 R
86,229 O
1,785,960 S
CAPITAL DISTRICT
Capital District HQ Office
(No sector organization. Attached directly to district)
Woodland Opera House
SHP327 YOL 1980 0.26 0.00 0 0 0 0 0 0 0.00
California Indian Heritage Center Sector
State Indian Museum (SHP)
309 SAC 1914 0.00 0.00 0 0 0 0 0 0 1.00
Sacramento History and Railroad Sector
Old Sacramento SHP 372 SAC 1967 293.25 0.163 1,065 R 0 0 0 12 0 0.50
Railtown 1897 SHP 335 TUO 1982 23.44 0.75 0 0 0 0 15 2 0.25
Sutter's Fort SHP 308 SAC 1914 5.80 0.00 0 0 0 0 0 0 1.00
Stanford Mansion Sector
Leland Stanford Mansion SHP
328 SAC 1978 0.88 0.00 0 0 0 0 0 0 0.00
State Capital and Govenor's Mansion Sector
California State Capitol Museum
357 SAC 1982 - - 0 0 0 0 0 0 0.00
Governor's Mansion SHP 377 SAC 1903 0.78 0.00 0 0 0 0 0 0 0.00
CAPITAL DISTRICT
TOTALS324.41 0.91 1,065 R 0 0 0 0 27 2 2.75
Waterfront Feet
R = River
L = LakeIndividual Camp SitesO = Ocean
Year Aqrd.
42.18
13,108 O
S= Submerged
OtherGroup Camp Sites
Non-Camping Overnight Facilities
1951Malibu Lagoon SB
ANGELES DISTRICT
TOTALS
548 LA 67.65
Leo Carrillo SP 540 142 7.200
00
UNITS AND PROPERTIES OF THE CALIFORNIA STATE PARK SYSTEM
Fiscal Year 2009/10
PUBLIC USE FACILITIES
1953
DISTRICT / Sector / Park Unit
Unit No.
CountyCalifornia State Parks
Owned
0
Individual Picnic Sites
Group Picnic Sites
Non-Motorized Trail Miles
1 0 6
0.000 0
16 Statistical Report - FY 2009/10

VISITOR ATTENDANCE
ANGELES DISTRICT
($1,253) - - ($1,253) $7,502,677 21.0
- - - $0 21.5
372,696 25,675 16,464 414,835 - - - $0
- - - 0 ($12) $0 $0 ($12)
- - - 0 $15,958 $0 $0 $15,958
0 53,649 0 53,649 $620 $0 $0 $620
180 23,925 0 24,105 $50 $0 $0 $50
- - - 0 $0 $0 $0 $0
- - - 0 - - - $0
- - - 0 - - $0
- - - 0 - - - $0
0 11,975 0 11,975 - - - $0
0 0 0 0 - - - $0
- - - 0 - - - $0
- - - 0 - - - $0
$3,600 $0 $0 $3,600 40.5
213,003 203,511 47,402 463,916 $726,969 $0 $0 $726,969
- - - 0 - - - $0
114,612 150,293 123,535 388,440 $1,057,922 $25,108 $1,974 $1,085,004
61,402 196,767 0 258,169 $105,869 $0 $0 $105,869
$3,600 $0 $0 $3,600 18.0
24,323 101,249 231 125,803 $104,466 $87,892 $3,842 $196,200
103,109 35,726 0 138,835 $522,655 $21,639 $0 $544,294
1,078,566 1,110,231 342,294 2,531,091 $4,222,930 $176,556 $7,116 $4,406,601 $7,502,677 58.7% 101.0
CAPITAL DISTRICT
$789 $0 $0 $789 $7,166,644 31.0
- - - $0
- - - 0 - - - $0
- - - $0 4.9
10,833 20,273 0 31,106 $24,743 $0 $0 $24,743
$1,142,783 $39,437 $73,703 $1,255,923 31.5
165,118 396,548 0 561,666 $99,687 $0 $0 $99,687
14,636 24,122 0 38,758 - - - $0
55,511 44,778 0 100,289 $208,536 $0 $0 $208,536
$568 $568 10.0
8,258 16,994 0 25,252 $41,388 $0 $0 $41,388
- - - $0 19.0
0 528,191 0 528,191 - - - $0
10,602 21,377 0 31,979 $54,730 $0 $0 $54,730
264,958 1,052,283 0 1,317,241 $1,573,224 $39,437 $73,703 $1,686,364 $7,166,644 23.5% 96.4See
summary
Paid Day Use
AUTHORIZED
STAFFING LEVELS
$1,463,140
152,815
Camping Concessions
0
Free Day Use
$070,434
Total
$262,563
REVENUE
225,080
UNITS AND PROPERTIES OF THE CALIFORNIA STATE PARK SYSTEM
Fiscal Year 2009/10
154,662 $1,419,923 $41,917
User Fees
498,549
Total Temp.
Revenue as % of Oper. Cost
$0
Operating Costs ($)
82,381 $262,563
AUTHORIZED BASE
BUDGET
Perm Full Time
$1,300
Misc.
118,807
See
summary
Statistical Report - FY 2009/10 17

ACREAGE
Waterfront Feet
R = River
L = LakeIndividual Camp SitesO = Ocean
Year Aqrd.
S= Submerged
OtherGroup Camp Sites
Non-Camping Overnight Facilities
UNITS AND PROPERTIES OF THE CALIFORNIA STATE PARK SYSTEM
Fiscal Year 2009/10
PUBLIC USE FACILITIES
DISTRICT / Sector / Park Unit
Unit No.
CountyCalifornia State Parks
OwnedIndividual
Picnic Sites
Group Picnic Sites
Non-Motorized Trail Miles
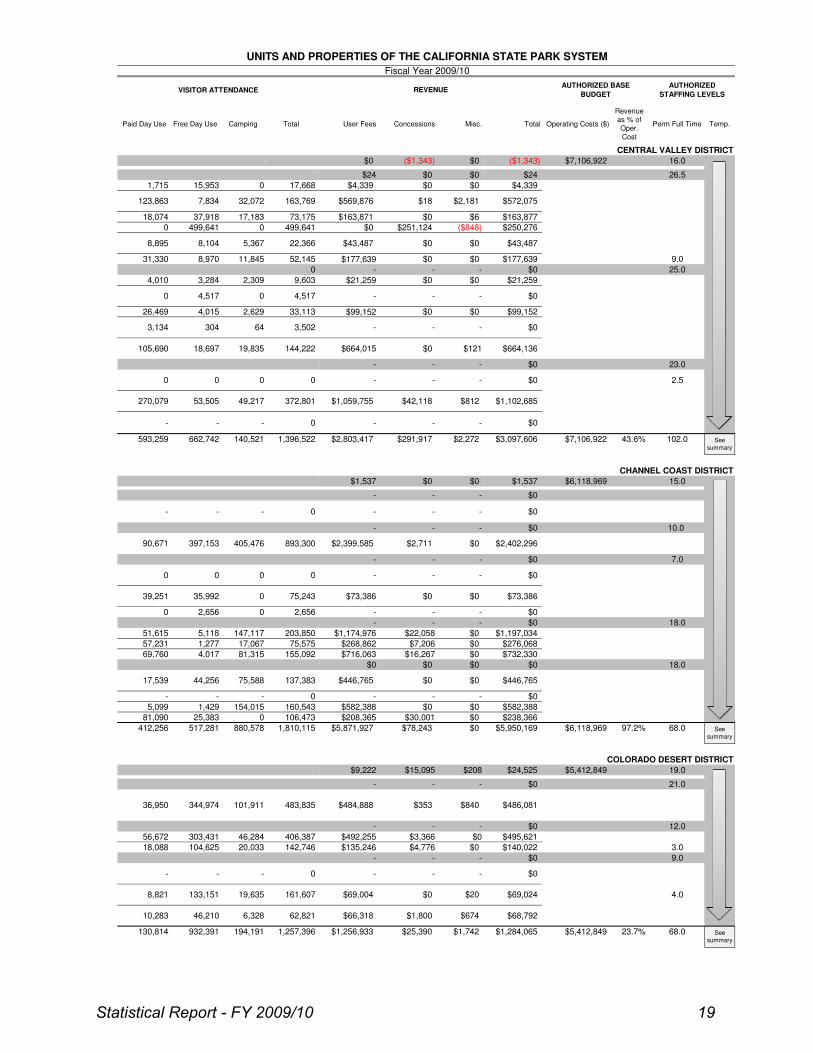
CENTRAL VALLEY DISTRICT
Central Valley District HQ Office
Calaveras Sector
Bethany Reservoir SRA 744 ALA 1974 0.00 608.54 29,400 L 0 0 0 8 0 2.00
CAL 2,819.36 0.00
TUO 3,678.70 0.00
Caswell Memorial SP 316 SJ 1952 258.13 0.00 24,375 R 66 1 0 30 1 4.50
Columbia SHP 307 TUO 1946 251.9929 20.601 0 0 27 25 3 1.00
Indian Grinding Rock SHP
373 AMA 1962 135.43 0.00 23 0 7 5 1 1.50
Turlock Lake SRA 311 STA 1950 0.00 3,558.80 12,000 L 63 0 0 50 0 6.00
Four Rivers Sector
George J. Hatfield SRA 312 MER 1953 46.50 0.00 7,300 R 15 1 0 10 0 1.00
Great Valley Grasslands SP
352 MER 1982 2,826.00 0.00 16,900 R 0 0 0 0 0 4.00
McConnell SRA 310 MER 1949 74.26 0.00 6,065 R 21 2 0 20 0 0.00
MER 6,253.50 0.00
SCL 640.35 0.00
San Luis Reservoir SRA 333 MER 1969 0.00 26,035.68 480,510 L 193 3 0 150 5 13.50
San Joaquin Sector
California State Mining & Mineral Museum
707 SJ 1999 0.00 0.00 0 0 0 0 0 0.00
FRE 302.50 5,777.03
MAD 1.52 776.43
Wassama Round House
SHP376 MAD 1978 26.61 0.00 0 0 0 6 0 0.00
17,314.85 36,777.08 754,950 L 753 17 34 574 14 123.50
81,040 R
CHANNEL COAST DISTRICT
Channel Coast District HQ Office
(No sector organization. Attached directly to district)
El Presidio de Santa
Barbara SHP575 SB 1966 5.785 0.00 0 0 0 0 0 0.00
Carpinteria Sector
SB 60.08 0.00
VEN 2.21 0.00
La Purísima Sector
Chumash Painted Cave SHP
525 SB 1976 7.50 0.00 0 0 0 0 0 0.10
La Purísima Mission SHP 513 SB 1935 1,934.31 0.00 0 0 0 20 1 48.00
Point Sal SB 535 SB 1948 84.03 0.00 8,800 O 0 0 0 0 0 0.00
Santa Barbara Sector
El Capitán SB 519 SB 1953 2,633.98 0.00 9,750 O 137 5 0 19 0 2.50
Gaviota SP 542 SB 1953 2,781.40 5.837 32,020 O 40 0 0 8 0 34.00
Refugio SB 527 SB 1950 155.08 750.00 33,055 O 68 3 0 52 0 2.90
Ventura Sector
16,200 O
1,550 R
Mandalay SB 676 VEN 1985 92.12 0.00 2,920 O 0 0 0 0 0 0.00
McGrath SB 567 VEN 1948 312.39 2.06 13,445 O 163 27 0 0 0 1.50
San Buenaventura SB 515 VEN 1961 109.13 0.95 8,920 O 0 0 0 76 44 0.00
8,287.22 761.56 129,795 O 0 721 47 0 203 47 90.50
1,550 R
COLORADO DESERT DISTRICT
Colorado Desert District HQ Office
Anza-Borrego Sector
IMP 14,709.57 0.00
RIV 37,320.11 0.00
SD 533,898.21 1.93
Montane Sector
Cuyamaca Rancho SP 618 SD 1933 24,693.21 0.00 171 3 5 72 3 132.90
Palomar Mountain SP 617 SD 1932 1,908.54 0.00 32 3 0 16 0 16.50
Salton Sea Sector
Indio Hills Palms Project 646 RIV 1983 5,629.53 0.00 0 0 0 0 0 0.00
7,160 L
44,005 R
IMP 435.70 7,322.00
RIV 2,868.37 6,274.85
621,973.84 19,846.78 95,280 L 0 1,340 31 5 124 6 1,224.85
44,005 R
2
0
135
1933
82,1201951 L
1957
2
233,040
Anza-Borrego Desert SP
O 2224,685
2.71
658 IMP
153
623 4.25915 25Salton Sea SRA
COLORADO DESERT
DISTRICT TOTALS
6,248.001960
2
Pacheco SP 1995
Millerton Lake SRA
Calaveras Big Trees SP 1931
CENTRAL VALLEY DISTRICT
TOTALS
69
L
369
306
378 228
109.20
26,400 R
9 2.7000
20
1.500
0.00
40.00
514
8
6,000622
VEN
1932
1957
1
530Emma Wood SB
Carpinteria SB
Picacho SRA
L
CHANNEL COAST DISTRICT
TOTALS
9
0
1,068.50
510.60
27.00
0
0
30
2
6
5
8
15
50
91
9
1
7
3
1
211 23.00
0
0
0
18 Statistical Report - FY 2009/10
VISITOR ATTENDANCE
Paid Day Use
AUTHORIZED
STAFFING LEVELS
Camping ConcessionsFree Day Use Total
REVENUE
UNITS AND PROPERTIES OF THE CALIFORNIA STATE PARK SYSTEM
Fiscal Year 2009/10
User Fees Total Temp.
Revenue as % of Oper. Cost
Operating Costs ($)
AUTHORIZED BASE
BUDGET
Perm Full TimeMisc.
CENTRAL VALLEY DISTRICT
$0 ($1,343) $0 ($1,343) $7,106,922 16.0
$24 $0 $0 $24 26.5
1,715 15,953 0 17,668 $4,339 $0 $0 $4,339
18,074 37,918 17,183 73,175 $163,871 $0 $6 $163,877
0 499,641 0 499,641 $0 $251,124 ($848) $250,276
8,895 8,104 5,367 22,366 $43,487 $0 $0 $43,487
31,330 8,970 11,845 52,145 $177,639 $0 $0 $177,639 9.0
0 - - - $0 25.0
4,010 3,284 2,309 9,603 $21,259 $0 $0 $21,259
0 4,517 0 4,517 - - - $0
26,469 4,015 2,629 33,113 $99,152 $0 $0 $99,152
105,690 18,697 19,835 144,222 $664,015 $0 $121 $664,136
- - - $0 23.0
0 0 0 0 - - - $0 2.5
- - - 0 - - - $0
593,259 662,742 140,521 1,396,522 $2,803,417 $291,917 $2,272 $3,097,606 $7,106,922 43.6% 102.0
CHANNEL COAST DISTRICT
$1,537 $0 $0 $1,537 $6,118,969 15.0
- - - $0
- - - 0 - - - $0
- - - $0 10.0
- - - $0 7.0
0 0 0 0 - - - $0
39,251 35,992 0 75,243 $73,386 $0 $0 $73,386
0 2,656 0 2,656 - - - $0
- - - $0 18.0
51,615 5,118 147,117 203,850 $1,174,976 $22,058 $0 $1,197,034
57,231 1,277 17,067 75,575 $268,862 $7,206 $0 $276,068
69,760 4,017 81,315 155,092 $716,063 $16,267 $0 $732,330
$0 $0 $0 $0 18.0
- - - 0 - - - $0
5,099 1,429 154,015 160,543 $582,388 $0 $0 $582,388
81,090 25,383 0 106,473 $208,365 $30,001 $0 $238,366
412,256 517,281 880,578 1,810,115 $5,871,927 $78,243 $0 $5,950,169 $6,118,969 97.2% 68.0
COLORADO DESERT DISTRICT
$9,222 $15,095 $208 $24,525 $5,412,849 19.0
- - - $0 21.0
- - - $0 12.0
56,672 303,431 46,284 406,387 $492,255 $3,366 $0 $495,621
18,088 104,625 20,033 142,746 $135,246 $4,776 $0 $140,022 3.0
- - - $0 9.0
- - - 0 - - - $0
130,814 932,391 194,191 1,257,396 $1,256,933 $25,390 $1,742 $1,284,065 $5,412,849 23.7% 68.0
3,502
161,607
53,505 49,217
$66,31862,821
90,671
17,539
$69,004
6,32846,210
133,1518,821
$674 $68,792
$812$1,059,755
$0
$486,081$840
$0
$0
-
$20
$353
$0
$0
$446,765
$1,102,685
$2,402,296$2,711
$1,800
$484,888
$569,8767,834
304
$2,399,585405,476
19,635
$446,765
372,801
101,911 483,835
893,300
$572,075163,769
137,383
36,950
$18
-64
32,072
75,588
-
123,863
$42,118
$2,181
44,256
$69,024 4.0
397,153
3,134
344,974
10,283
270,079
See
summary
See
summary
See
summary
Statistical Report - FY 2009/10 19
ACREAGE
Waterfront Feet
R = River
L = LakeIndividual Camp SitesO = Ocean
Year Aqrd.
S= Submerged
OtherGroup Camp Sites
Non-Camping Overnight Facilities
UNITS AND PROPERTIES OF THE CALIFORNIA STATE PARK SYSTEM
Fiscal Year 2009/10
PUBLIC USE FACILITIES
DISTRICT / Sector / Park Unit
Unit No.
CountyCalifornia State Parks
OwnedIndividual
Picnic Sites
Group Picnic Sites
Non-Motorized Trail Miles
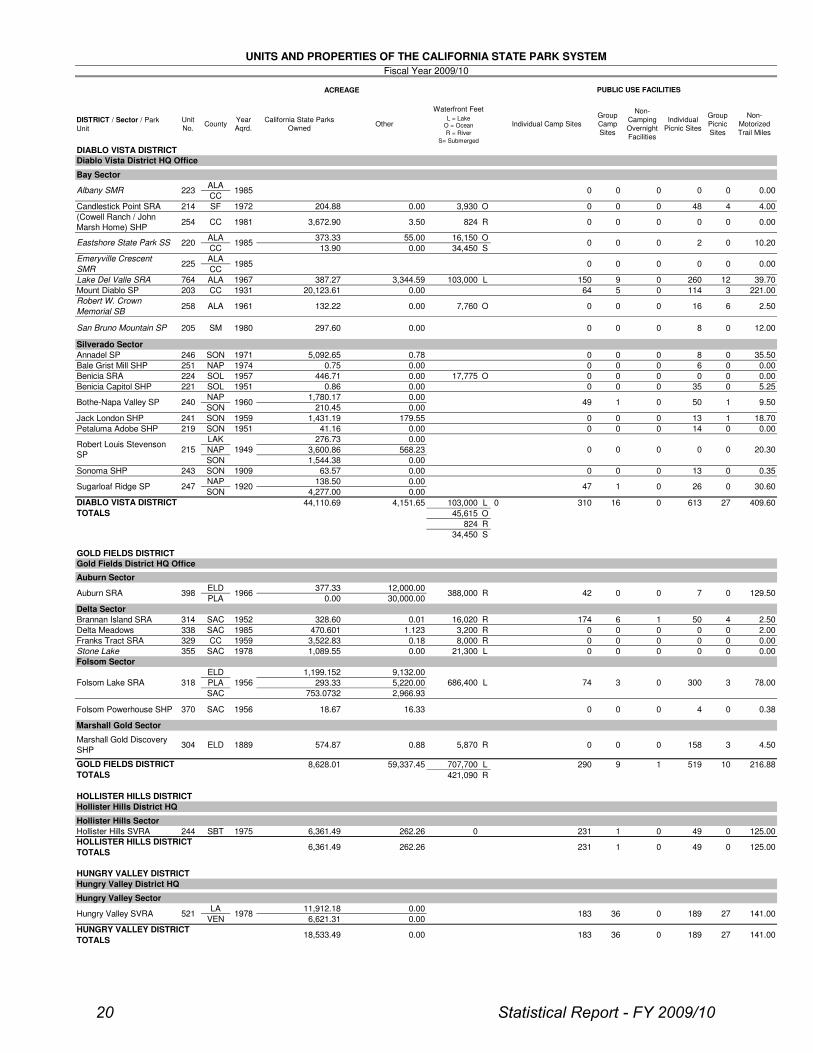
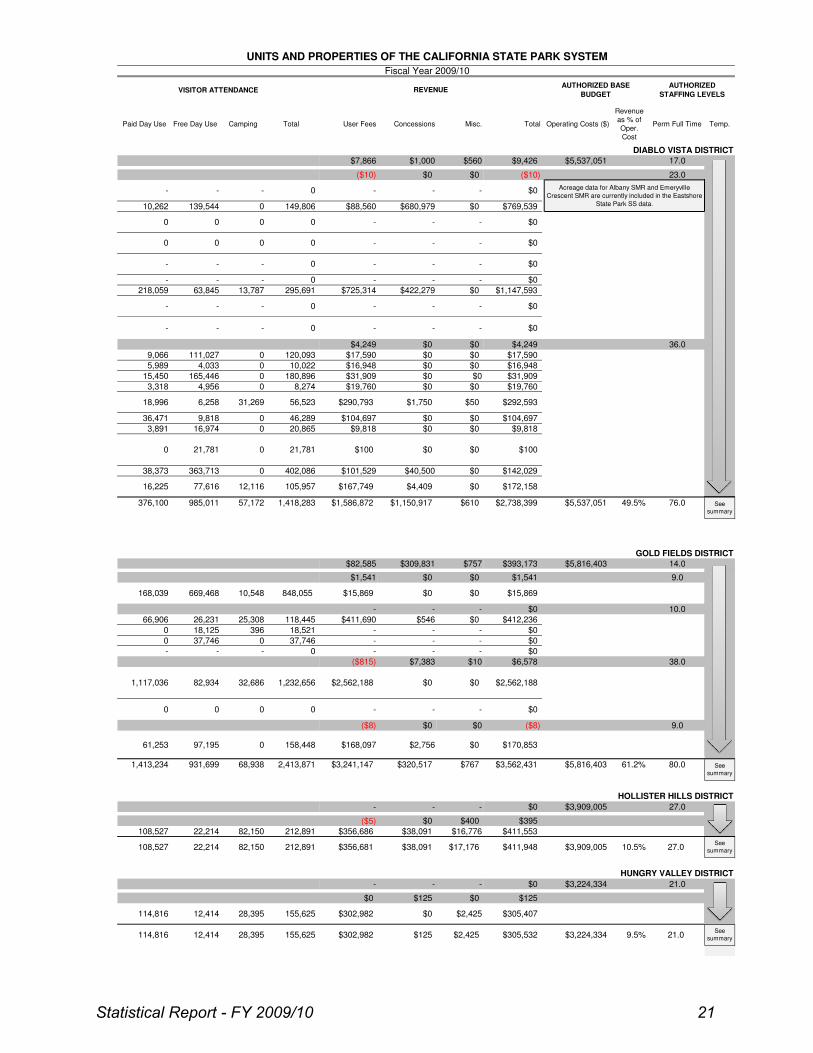
DIABLO VISTA DISTRICT
Bay Sector
ALA
CC
Candlestick Point SRA 214 SF 1972 204.88 0.00 3,930 O 0 0 0 48 4 4.00
(Cowell Ranch / John Marsh Home) SHP
254 CC 1981 3,672.90 3.50 824 R 0 0 0 0 0 0.00
ALA 373.33 55.00 16,150 O
CC 13.90 0.00 34,450 S
ALA
CC
Lake Del Valle SRA 764 ALA 1967 387.27 3,344.59 103,000 L 150 9 0 260 12 39.70
Mount Diablo SP 203 CC 1931 20,123.61 0.00 64 5 0 114 3 221.00
Robert W. Crown
Memorial SB258 ALA 1961 132.22 0.00 7,760 O 0 0 0 16 6 2.50
San Bruno Mountain SP 205 SM 1980 297.60 0.00 0 0 0 8 0 12.00
Silverado Sector
Annadel SP 246 SON 1971 5,092.65 0.78 0 0 0 8 0 35.50
Bale Grist Mill SHP 251 NAP 1974 0.75 0.00 0 0 0 6 0 0.00
Benicia SRA 224 SOL 1957 446.71 0.00 17,775 O 0 0 0 0 0 0.00
Benicia Capitol SHP 221 SOL 1951 0.86 0.00 0 0 0 35 0 5.25
NAP 1,780.17 0.00
SON 210.45 0.00
Jack London SHP 241 SON 1959 1,431.19 179.55 0 0 0 13 1 18.70
Petaluma Adobe SHP 219 SON 1951 41.16 0.00 0 0 0 14 0 0.00
LAK 276.73 0.00
NAP 3,600.86 568.23
SON 1,544.38 0.00
Sonoma SHP 243 SON 1909 63.57 0.00 0 0 0 13 0 0.35
NAP 138.50 0.00
SON 4,277.00 0.00
44,110.69 4,151.65 103,000 L 0 310 16 0 613 27 409.60
45,615 O
824 R
34,450 S
GOLD FIELDS DISTRICT
Gold Fields District HQ Office
Auburn Sector
ELD 377.33 12,000.00
PLA 0.00 30,000.00
Delta Sector
Brannan Island SRA 314 SAC 1952 328.60 0.01 16,020 R 174 6 1 50 4 2.50
Delta Meadows 338 SAC 1985 470.601 1.123 3,200 R 0 0 0 0 0 2.00
Franks Tract SRA 329 CC 1959 3,522.83 0.18 8,000 R 0 0 0 0 0 0.00
Stone Lake 355 SAC 1978 1,089.55 0.00 21,300 L 0 0 0 0 0 0.00
Folsom Sector
ELD 1,199.152 9,132.00
PLA 293.33 5,220.00
SAC 753.0732 2,966.93
Folsom Powerhouse SHP 370 SAC 1956 18.67 16.33 0 0 0 4 0 0.38
Marshall Gold Sector
Marshall Gold Discovery SHP
304 ELD 1889 574.87 0.88 5,870 R 0 0 0 158 3 4.50
8,628.01 59,337.45 707,700 L 290 9 1 519 10 216.88
421,090 R
HOLLISTER HILLS DISTRICT
Hollister Hills District HQ
Hollister Hills Sector
Hollister Hills SVRA 244 SBT 1975 6,361.49 262.26 0 231 1 0 49 0 125.00
HUNGRY VALLEY DISTRICT
Hungry Valley District HQ
Hungry Valley Sector
LA 11,912.18 0.00
VEN 6,621.31 0.00
1
0
00
27
47
1985
1985
0
1960
225
Sugarloaf Ridge SP
1966
Folsom Lake SRA 318
240
DIABLO VISTA DISTRICT
TOTALS
26
262.26
183
1949
247 1920
0
141.00
74
30.60
1956
6,361.49
521
HUNGRY VALLEY DISTRICT
TOTALS183
Hungry Valley SVRA 36
0 0Auburn SRA
0.00
1978 27
78.00
141.00
Eastshore State Park SS
223
0
231
398
GOLD FIELDS DISTRICT
TOTALS
686,400
0
0
10.20
0
9.50
0 0
220
Bothe-Napa Valley SP
Emeryville Crescent
SMR
Albany SMR
0 0
1985 0
0 0
HOLLISTER HILLS DISTRICT
TOTALS
Robert Louis Stevenson SP
Diablo Vista District HQ Office
189
L
215
0 129.50
0
20.30
18,533.49
0 0.00
1
49
189
125.00
3
2
1
388,000
3
R
0.00 0
0
7
300
36
49 1
0 0 0 0
50
0
42
0
0
20 Statistical Report - FY 2009/10
VISITOR ATTENDANCE
Paid Day Use
AUTHORIZED
STAFFING LEVELS
Camping ConcessionsFree Day Use Total
REVENUE
UNITS AND PROPERTIES OF THE CALIFORNIA STATE PARK SYSTEM
Fiscal Year 2009/10
User Fees Total Temp.
Revenue as % of Oper. Cost
Operating Costs ($)
AUTHORIZED BASE
BUDGET
Perm Full TimeMisc.
DIABLO VISTA DISTRICT
$7,866 $1,000 $560 $9,426 $5,537,051 17.0
($10) $0 $0 ($10) 23.0
10,262 139,544 0 149,806 $88,560 $680,979 $0 $769,539
0 0 0 0 - - - $0
- - - 0 - - - $0
218,059 63,845 13,787 295,691 $725,314 $422,279 $0 $1,147,593
- - - 0 - - - $0
- - - 0 - - - $0
$4,249 $0 $0 $4,249 36.0
9,066 111,027 0 120,093 $17,590 $0 $0 $17,590
5,989 4,033 0 10,022 $16,948 $0 $0 $16,948
15,450 165,446 0 180,896 $31,909 $0 $0 $31,909
3,318 4,956 0 8,274 $19,760 $0 $0 $19,760
36,471 9,818 0 46,289 $104,697 $0 $0 $104,697
3,891 16,974 0 20,865 $9,818 $0 $0 $9,818
38,373 363,713 0 402,086 $101,529 $40,500 $0 $142,029
376,100 985,011 57,172 1,418,283 $1,586,872 $1,150,917 $610 $2,738,399 $5,537,051 49.5% 76.0
GOLD FIELDS DISTRICT
$82,585 $309,831 $757 $393,173 $5,816,403 14.0
$1,541 $0 $0 $1,541 9.0
- - - $0 10.0
66,906 26,231 25,308 118,445 $411,690 $546 $0 $412,236
0 18,125 396 18,521 - - - $0
0 37,746 0 37,746 - - - $0
- - - 0 - - - $0
($815) $7,383 $10 $6,578 38.0
0 0 0 0 - - - $0
($8) $0 $0 ($8) 9.0
61,253 97,195 0 158,448 $168,097 $2,756 $0 $170,853
1,413,234 931,699 68,938 2,413,871 $3,241,147 $320,517 $767 $3,562,431 $5,816,403 61.2% 80.0
- - - $0 $3,909,005 27.0
($5) $0 $400 $395
108,527 22,214 82,150 212,891 $356,686 $38,091 $16,776 $411,553
- - - $0 $3,224,334 21.0
$0 $125 $0 $125
108,527 82,150 212,891 $356,681 $38,091
-
$292,593
$15,869
$411,948
82,934
21,781
6,258
$2,425
669,468
$100
Acreage data for Albany SMR and Emeryville
Crescent SMR are currently included in the Eastshore
State Park SS data.
9.5%
$3,909,005
HUNGRY VALLEY DISTRICT
HOLLISTER HILLS DISTRICT
See
summary
10.5%
$3,224,334 21.0
$172,158
$305,407
$305,53228,395 155,625
-
32,686
-
18,996
-
0
22,214
12,414
77,616
0
1,117,036
168,039
0
$302,982
$302,982
12,414
16,225
$0
$15,869
114,816
114,816
- -
$100
28,395 155,625
$0
See
summary
27.0
$290,79331,269
$0
$1,750
$0
$4,409 $0
$0$0
56,523
0
See
summary
$2,425
-0
10,548
12,116
0 -
$125
21,781
$2,562,188
$0
$0
-
105,957
$2,562,188
$17,176
848,055
$167,749
1,232,656
0 --
- $0
$0
$50
-- -
See
summary
0
Statistical Report - FY 2009/10 21
ACREAGE
Waterfront Feet
R = River
L = LakeIndividual Camp SitesO = Ocean
Year Aqrd.
S= Submerged
OtherGroup Camp Sites
Non-Camping Overnight Facilities
UNITS AND PROPERTIES OF THE CALIFORNIA STATE PARK SYSTEM
Fiscal Year 2009/10
PUBLIC USE FACILITIES
DISTRICT / Sector / Park Unit
Unit No.
CountyCalifornia State Parks
OwnedIndividual
Picnic Sites
Group Picnic Sites
Non-Motorized Trail Miles
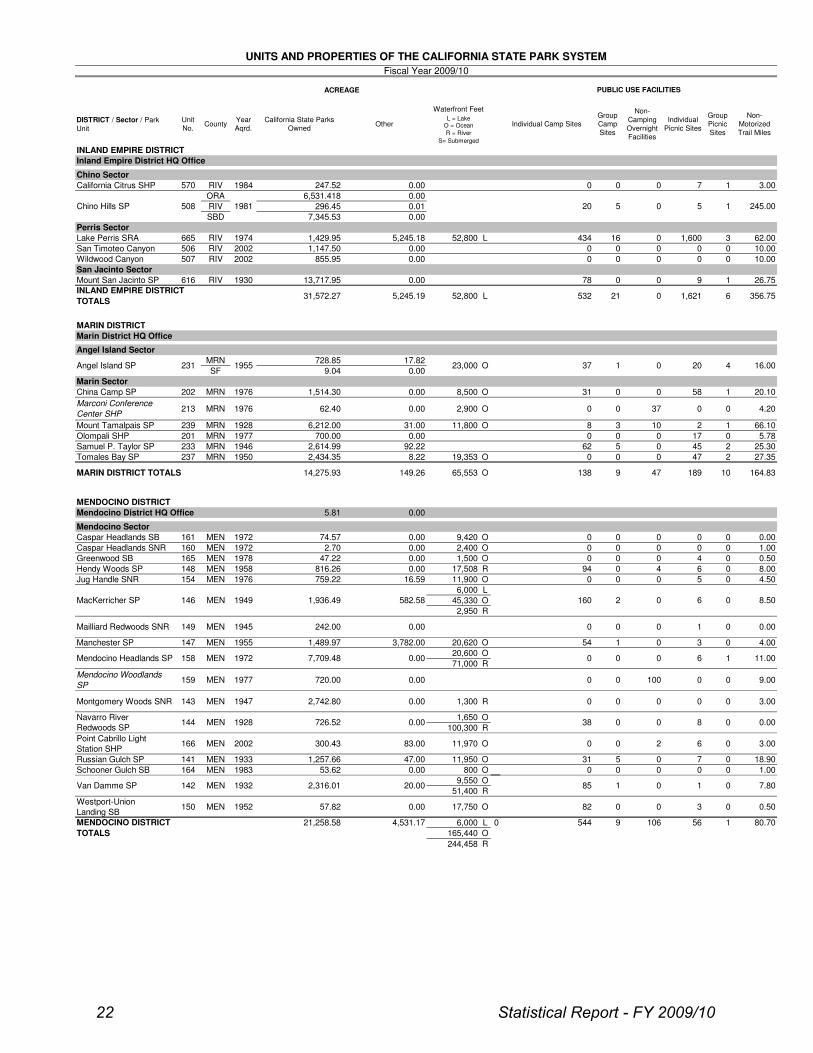
INLAND EMPIRE DISTRICT
Inland Empire District HQ Office
Chino Sector
California Citrus SHP 570 RIV 1984 247.52 0.00 0 0 0 7 1 3.00
ORA 6,531.418 0.00
RIV 296.45 0.01
SBD 7,345.53 0.00
Perris Sector
Lake Perris SRA 665 RIV 1974 1,429.95 5,245.18 52,800 L 434 16 0 1,600 3 62.00
San Timoteo Canyon 506 RIV 2002 1,147.50 0.00 0 0 0 0 0 10.00
Wildwood Canyon 507 RIV 2002 855.95 0.00 0 0 0 0 0 10.00
San Jacinto Sector
Mount San Jacinto SP 616 RIV 1930 13,717.95 0.00 78 0 0 9 1 26.75
31,572.27 5,245.19 52,800 L 532 21 0 1,621 6 356.75
MARIN DISTRICT
Marin District HQ Office
Angel Island Sector
MRN 728.85 17.82
SF 9.04 0.00
Marin Sector
China Camp SP 202 MRN 1976 1,514.30 0.00 8,500 O 31 0 0 58 1 20.10
Marconi Conference
Center SHP213 MRN 1976 62.40 0.00 2,900 O 0 0 37 0 0 4.20
Mount Tamalpais SP 239 MRN 1928 6,212.00 31.00 11,800 O 8 3 10 2 1 66.10
Olompali SHP 201 MRN 1977 700.00 0.00 0 0 0 17 0 5.78
Samuel P. Taylor SP 233 MRN 1946 2,614.99 92.22 62 5 0 45 2 25.30
Tomales Bay SP 237 MRN 1950 2,434.35 8.22 19,353 O 0 0 0 47 2 27.35
MARIN DISTRICT TOTALS 14,275.93 149.26 65,553 O 138 9 47 189 10 164.83
MENDOCINO DISTRICT
Mendocino District HQ Office 5.81 0.00
Mendocino Sector
Caspar Headlands SB 161 MEN 1972 74.57 0.00 9,420 O 0 0 0 0 0 0.00
Caspar Headlands SNR 160 MEN 1972 2.70 0.00 2,400 O 0 0 0 0 0 1.00
Greenwood SB 165 MEN 1978 47.22 0.00 1,500 O 0 0 0 4 0 0.50
Hendy Woods SP 148 MEN 1958 816.26 0.00 17,508 R 94 0 4 6 0 8.00
Jug Handle SNR 154 MEN 1976 759.22 16.59 11,900 O 0 0 0 5 0 4.50
6,000 L
45,330 O
2,950 R
Mailliard Redwoods SNR 149 MEN 1945 242.00 0.00 0 0 0 1 0 0.00
Manchester SP 147 MEN 1955 1,489.97 3,782.00 20,620 O 54 1 0 3 0 4.00
20,600 O
71,000 R
Mendocino Woodlands
SP159 MEN 1977 720.00 0.00 0 0 100 0 0 9.00
Montgomery Woods SNR 143 MEN 1947 2,742.80 0.00 1,300 R 0 0 0 0 0 3.00
1,650 O
100,300 R
Point Cabrillo Light Station SHP
166 MEN 2002 300.43 83.00 11,970 O 0 0 2 6 0 3.00
Russian Gulch SP 141 MEN 1933 1,257.66 47.00 11,950 O 31 5 0 7 0 18.90
Schooner Gulch SB 164 MEN 1983 53.62 0.00 800 O 0 0 0 0 0 1.00
9,550 O
51,400 R
Westport-Union Landing SB
150 MEN 1952 57.82 0.00 17,750 O 82 0 0 3 0 0.50
21,258.58 4,531.17 6,000 L 0 544 9 106 56 1 80.70
165,440 O
244,458 R
O
0
0.00
7.80MENVan Damme SP
Navarro River Redwoods SP
158
1,936.49
231
144
142
MENDOCINO DISTRICT
TOTALS
MEN 0.00
MEN
20.00
1972
582.58
Chino Hills SP
MacKerricher SP MEN
Mendocino Headlands SP
2,316.011932
726.52
1949
1928 38
508
0
1 16.00
0
160
Angel Island SP 1955 20
2 0
INLAND EMPIRE DISTRICT
TOTALS
0
0
120
23,000
1981
37
6
245.00
4
8.50
11.001
5
0
146
0
185 1
7,709.48 0.00
0
5
0
0
8
6
0
22 Statistical Report - FY 2009/10
VISITOR ATTENDANCE
Paid Day Use
AUTHORIZED
STAFFING LEVELS
Camping ConcessionsFree Day Use Total
REVENUE
UNITS AND PROPERTIES OF THE CALIFORNIA STATE PARK SYSTEM
Fiscal Year 2009/10
User Fees Total Temp.
Revenue as % of Oper. Cost
Operating Costs ($)
AUTHORIZED BASE
BUDGET
Perm Full TimeMisc.
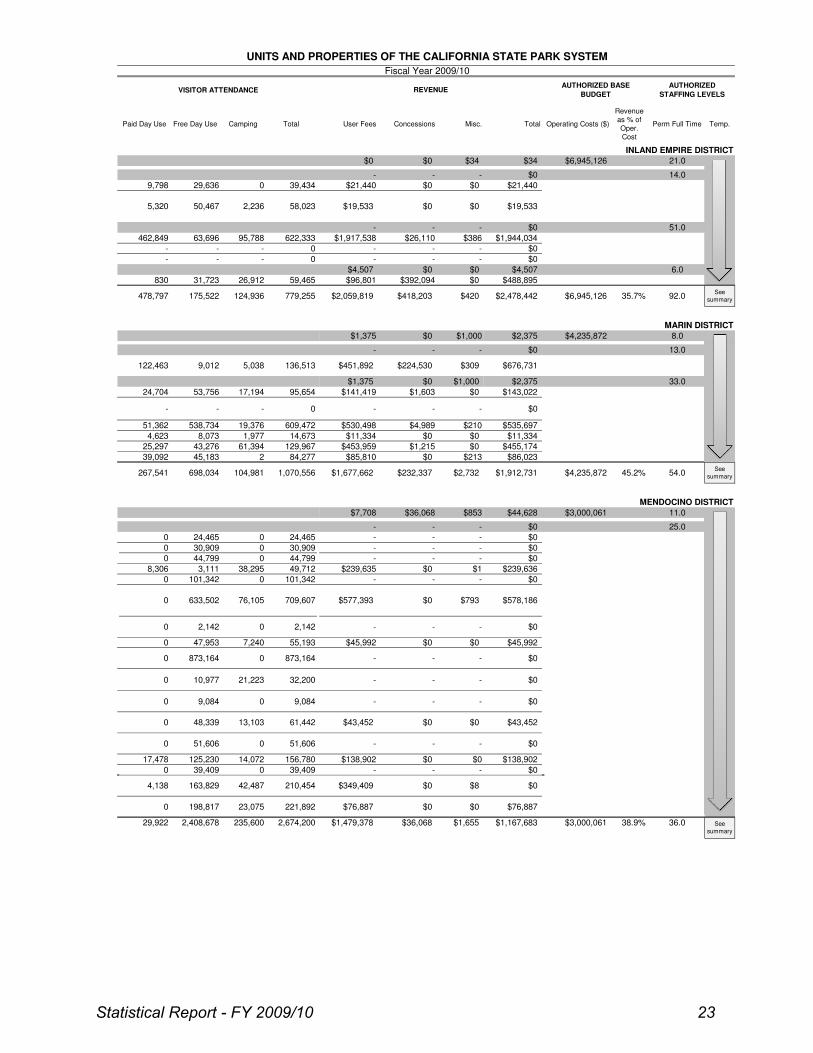
INLAND EMPIRE DISTRICT
$0 $0 $34 $34 $6,945,126 21.0
- - - $0 14.0
9,798 29,636 0 39,434 $21,440 $0 $0 $21,440
- - - $0 51.0
462,849 63,696 95,788 622,333 $1,917,538 $26,110 $386 $1,944,034
- - - 0 - - - $0
- - - 0 - - - $0
$4,507 $0 $0 $4,507 6.0
830 31,723 26,912 59,465 $96,801 $392,094 $0 $488,895
478,797 175,522 124,936 779,255 $2,059,819 $418,203 $420 $2,478,442 $6,945,126 35.7% 92.0See
summary
MARIN DISTRICT
$1,375 $0 $1,000 $2,375 $4,235,872 8.0
- - - $0 13.0
$1,375 $0 $1,000 $2,375 33.0
24,704 53,756 17,194 95,654 $141,419 $1,603 $0 $143,022
- - - 0 - - - $0
51,362 538,734 19,376 609,472 $530,498 $4,989 $210 $535,697
4,623 8,073 1,977 14,673 $11,334 $0 $0 $11,334
25,297 43,276 61,394 129,967 $453,959 $1,215 $0 $455,174
39,092 45,183 2 84,277 $85,810 $0 $213 $86,023
267,541 698,034 104,981 1,070,556 $1,677,662 $232,337 $2,732 $1,912,731 $4,235,872 45.2% 54.0See
summary
MENDOCINO DISTRICT
$7,708 $36,068 $853 $44,628 $3,000,061 11.0
- - - $0 25.0
0 24,465 0 24,465 - - - $0
0 30,909 0 30,909 - - - $0
0 44,799 0 44,799 - - - $0
8,306 3,111 38,295 49,712 $239,635 $0 $1 $239,636
0 101,342 0 101,342 - - - $0
0 2,142 0 2,142 - - - $0
0 47,953 7,240 55,193 $45,992 $0 $0 $45,992
0 10,977 21,223 32,200 - - - $0
0 9,084 0 9,084 - - - $0
0 51,606 0 51,606 - - - $0
17,478 125,230 14,072 156,780 $138,902 $0 $0 $138,902
0 39,409 0 39,409 - - - $0
0 198,817 23,075 221,892 $76,887 $0 $0 $76,887
29,922 2,408,678 235,600 2,674,200 $1,479,378 $36,068 $1,655 $1,167,683 $3,000,061 38.9% 36.0
$0
$0
$578,186
122,463
5,320
9,012
$793
$19,533
$676,731
$0
$43,452$0
709,607 $0
-
4,138 163,829
50,467
-
$8
0
$577,393633,5020
873,164
48,3390
0
See
summary
$309
$0
$349,409
$224,530
76,105
$0
$43,452
-
58,023
136,513
210,454
61,442
873,164
13,103
$0$19,5332,236
$451,892
42,487
5,038
Statistical Report - FY 2009/10 23
ACREAGE
Waterfront Feet
R = River
L = LakeIndividual Camp SitesO = Ocean
Year Aqrd.
S= Submerged
OtherGroup Camp Sites
Non-Camping Overnight Facilities
UNITS AND PROPERTIES OF THE CALIFORNIA STATE PARK SYSTEM
Fiscal Year 2009/10
PUBLIC USE FACILITIES
DISTRICT / Sector / Park Unit
Unit No.
CountyCalifornia State Parks
OwnedIndividual
Picnic Sites
Group Picnic Sites
Non-Motorized Trail Miles
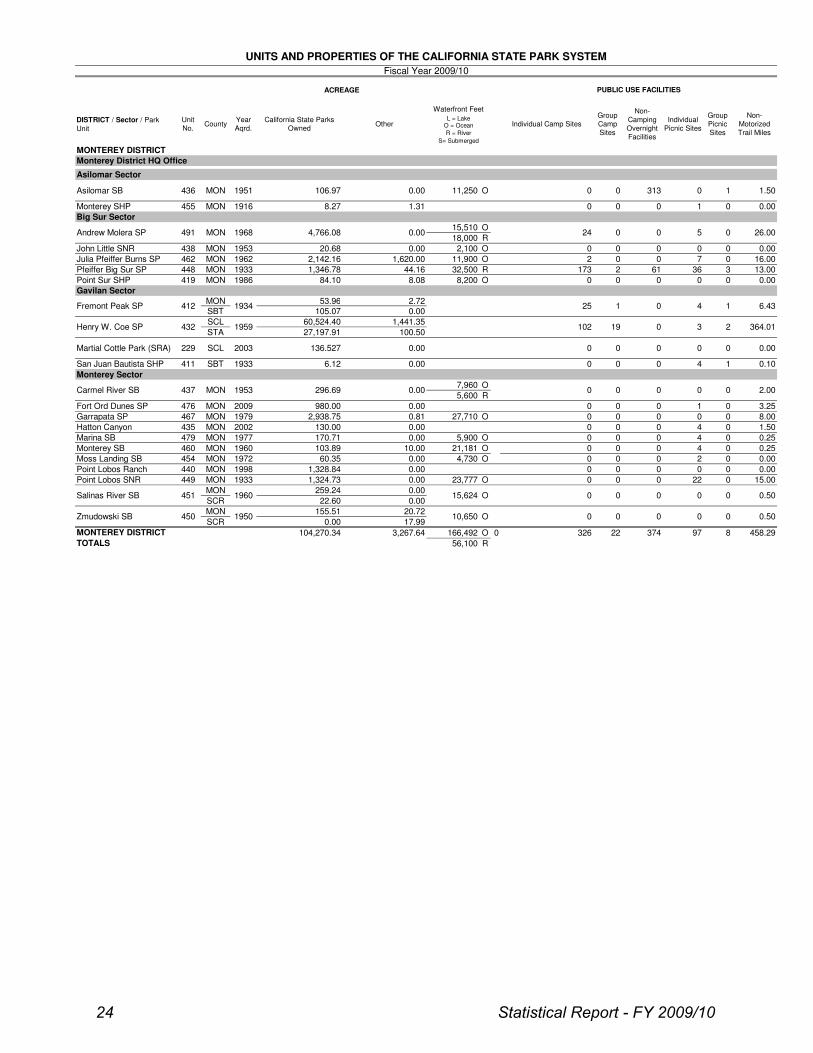
MONTEREY DISTRICT
Monterey District HQ Office
Asilomar Sector
Asilomar SB 436 MON 1951 106.97 0.00 11,250 O 0 0 313 0 1 1.50
Monterey SHP 455 MON 1916 8.27 1.31 0 0 0 1 0 0.00
Big Sur Sector
15,510 O
18,000 R
John Little SNR 438 MON 1953 20.68 0.00 2,100 O 0 0 0 0 0 0.00
Julia Pfeiffer Burns SP 462 MON 1962 2,142.16 1,620.00 11,900 O 2 0 0 7 0 16.00
Pfeiffer Big Sur SP 448 MON 1933 1,346.78 44.16 32,500 R 173 2 61 36 3 13.00
Point Sur SHP 419 MON 1986 84.10 8.08 8,200 O 0 0 0 0 0 0.00
Gavilan Sector
MON 53.96 2.72SBT 105.07 0.00
SCL 60,524.40 1,441.35
STA 27,197.91 100.50
Martial Cottle Park (SRA) 229 SCL 2003 136.527 0.00 0 0 0 0 0 0.00
San Juan Bautista SHP 411 SBT 1933 6.12 0.00 0 0 0 4 1 0.10
Monterey Sector
7,960 O
5,600 R
Fort Ord Dunes SP 476 MON 2009 980.00 0.00 0 0 0 1 0 3.25
Garrapata SP 467 MON 1979 2,938.75 0.81 27,710 O 0 0 0 0 0 8.00
Hatton Canyon 435 MON 2002 130.00 0.00 0 0 0 4 0 1.50
Marina SB 479 MON 1977 170.71 0.00 5,900 O 0 0 0 4 0 0.25
Monterey SB 460 MON 1960 103.89 10.00 21,181 O 0 0 0 4 0 0.25
Moss Landing SB 454 MON 1972 60.35 0.00 4,730 O 0 0 0 2 0 0.00
Point Lobos Ranch 440 MON 1998 1,328.84 0.00 0 0 0 0 0 0.00
Point Lobos SNR 449 MON 1933 1,324.73 0.00 23,777 O 0 0 0 22 0 15.00
MON 259.24 0.00
SCR 22.60 0.00
MON 155.51 20.72
SCR 0.00 17.99
104,270.34 3,267.64 166,492 O 0 326 22 374 97 8 458.29
56,100 R
3 364.01
10,650
0
6.43
0.50
0.50
15,624Salinas River SB
450
Carmel River SB
Zmudowski SB
1953
0
O
O
26.00491
MON437
451
432
MONTEREY DISTRICT
TOTALS
1968 4,766.08MON
1934
0
2.00
Fremont Peak SP
Henry W. Coe SP
0412
Andrew Molera SP 0
0
0
0
2
0
19 0
0
1
1950
24
0
0
0
1959
1960
0.00
0
0296.69 0.00
0 0 5
25 1
102
0
0
4
24 Statistical Report - FY 2009/10

VISITOR ATTENDANCE
Paid Day Use
AUTHORIZED
STAFFING LEVELS
Camping ConcessionsFree Day Use Total
REVENUE
UNITS AND PROPERTIES OF THE CALIFORNIA STATE PARK SYSTEM
Fiscal Year 2009/10
User Fees Total Temp.
Revenue as % of Oper. Cost
Operating Costs ($)
AUTHORIZED BASE
BUDGET
Perm Full TimeMisc.
MONTEREY DISTRICT
$5,705 $44,823 $200 $50,728 $7,383,909 22.0
- - - $0 18.0
0 474,803 147,987 622,790 $0 $1,932,994 $0 $1,932,994
0 171,161 0 171,161 - - - $0
$511 $81 $0 $592 20.0
0 0 0 0 - - - $0
49,230 24,285 2,190 75,705 $169,111 $0 $0 $169,111
91,263 59,464 231,956 382,683 $1,298,228 $628,495 $0 $1,926,723
4,196 689 0 4,885 $3,923 $0 $0 $3,923
- - - $0 19.0
- - - 0 - - - $0
24,742 76,178 0 100,920 $23,668 $0 $0 $23,668
$199 $9,060 $0 $9,259 18.0
- - - 0 - - - $0
0 132,109 0 132,109 - - - $0
- - - 0 - - - $0
0 473,118 0 473,118 - - - $0
0 443,641 0 443,641 - - - $0
0 212,560 0 212,560 - - - $0
0 0 0 0 - - - $0
234,277 99,154 0 333,431 $623,063 $963 $0 $624,026
449,480 2,497,710 414,864 3,362,054 $2,589,627 $2,634,371 $246 $5,224,244 $7,383,909 70.8% 97.0
58,955
-
-
-
-
- $0
1,955 $28,993
-
0
5,734
12,316
Attendance data for Asilomar Dunes NP located within
Asilomar SB
$106,924
$28,993
$0
$0
$106,878
25,455 18,819
0
$46
$0
-
0
244,828
34,764
0
6,592
$0
-
-
$17,955
$0
$012,707
Monterey Sector data includes revenue and staffing
from the Multi-Agency Facility
See
summary
$347,303
0
34,764
244,828
$329,34814,681
23,590
34,207
5,018
0
23,590
15,299
Statistical Report - FY 2009/10 25
ACREAGE
Waterfront Feet
R = River
L = LakeIndividual Camp SitesO = Ocean
Year Aqrd.
S= Submerged
OtherGroup Camp Sites
Non-Camping Overnight Facilities
UNITS AND PROPERTIES OF THE CALIFORNIA STATE PARK SYSTEM
Fiscal Year 2009/10
PUBLIC USE FACILITIES
DISTRICT / Sector / Park Unit
Unit No.
CountyCalifornia State Parks
OwnedIndividual
Picnic Sites
Group Picnic Sites
Non-Motorized Trail Miles
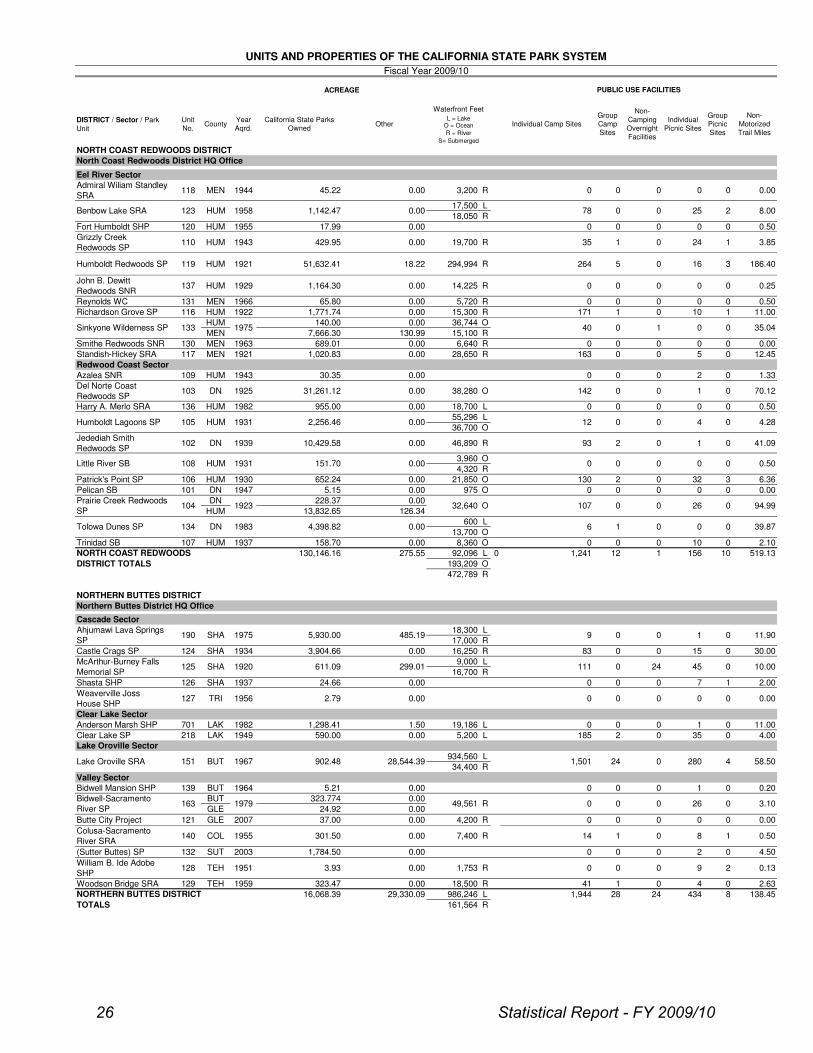
NORTH COAST REDWOODS DISTRICT
North Coast Redwoods District HQ Office
Eel River Sector
Admiral Wiliam Standley SRA
118 MEN 1944 45.22 0.00 3,200 R 0 0 0 0 0 0.00
17,500 L
18,050 R
Fort Humboldt SHP 120 HUM 1955 17.99 0.00 0 0 0 0 0 0.50
Grizzly Creek Redwoods SP
110 HUM 1943 429.95 0.00 19,700 R 35 1 0 24 1 3.85
Humboldt Redwoods SP 119 HUM 1921 51,632.41 18.22 294,994 R 264 5 0 16 3 186.40
John B. Dewitt Redwoods SNR
137 HUM 1929 1,164.30 0.00 14,225 R 0 0 0 0 0 0.25
Reynolds WC 131 MEN 1966 65.80 0.00 5,720 R 0 0 0 0 0 0.50
Richardson Grove SP 116 HUM 1922 1,771.74 0.00 15,300 R 171 1 0 10 1 11.00
HUM 140.00 0.00 36,744 O
MEN 7,666.30 130.99 15,100 R
Smithe Redwoods SNR 130 MEN 1963 689.01 0.00 6,640 R 0 0 0 0 0 0.00
Standish-Hickey SRA 117 MEN 1921 1,020.83 0.00 28,650 R 163 0 0 5 0 12.45
Redwood Coast Sector
Azalea SNR 109 HUM 1943 30.35 0.00 0 0 0 2 0 1.33
Del Norte Coast Redwoods SP
103 DN 1925 31,261.12 0.00 38,280 O 142 0 0 1 0 70.12
Harry A. Merlo SRA 136 HUM 1982 955.00 0.00 18,700 L 0 0 0 0 0 0.50
55,296 L
36,700 OJedediah Smith Redwoods SP
102 DN 1939 10,429.58 0.00 46,890 R 93 2 0 1 0 41.09
3,960 O
4,320 R
Patrick's Point SP 106 HUM 1930 652.24 0.00 21,850 O 130 2 0 32 3 6.36
Pelican SB 101 DN 1947 5.15 0.00 975 O 0 0 0 0 0 0.00
DN 228.37 0.00
HUM 13,832.65 126.34
600 L
13,700 O
Trinidad SB 107 HUM 1937 158.70 0.00 8,360 O 0 0 0 10 0 2.10
130,146.16 275.55 92,096 L 0 1,241 12 1 156 10 519.13
193,209 O
472,789 R
NORTHERN BUTTES DISTRICT
Northern Buttes District HQ Office
Cascade Sector
18,300 L
17,000 R
Castle Crags SP 124 SHA 1934 3,904.66 0.00 16,250 R 83 0 0 15 0 30.00
9,000 L
16,700 R
Shasta SHP 126 SHA 1937 24.66 0.00 0 0 0 7 1 2.00
Weaverville Joss House SHP
127 TRI 1956 2.79 0.00 0 0 0 0 0 0.00
Clear Lake Sector
Anderson Marsh SHP 701 LAK 1982 1,298.41 1.50 19,186 L 0 0 0 1 0 11.00
Clear Lake SP 218 LAK 1949 590.00 0.00 5,200 L 185 2 0 35 0 4.00
934,560 L
34,400 R
Valley Sector
Bidwell Mansion SHP 139 BUT 1964 5.21 0.00 0 0 0 1 0 0.20
BUT 323.774 0.00
GLE 24.92 0.00
Butte City Project 121 GLE 2007 37.00 0.00 4,200 R 0 0 0 0 0 0.00
Colusa-Sacramento River SRA
140 COL 1955 301.50 0.00 7,400 R 14 1 0 8 1 0.50
(Sutter Buttes) SP 132 SUT 2003 1,784.50 0.00 0 0 0 2 0 4.50
William B. Ide Adobe SHP
128 TEH 1951 3.93 0.00 1,753 R 0 0 0 9 2 0.13
Woodson Bridge SRA 129 TEH 1959 323.47 0.00 18,500 R 41 1 0 4 0 2.63
16,068.39 29,330.09 986,246 L 1,944 28 24 434 8 138.45
161,564 R
0 0
4.28
0.50
0
0
299.01
24
0
902.48
10.0045
26
58.504
49,561
0
0.00
0
0
0
1,501
0 39.87
8.00
94.99
35.04
3.10
11.905,930.00 9
0.00 78
Tolowa Dunes SP
151
NORTHERN BUTTES DISTRICT
TOTALS
1979
1975
1920
Lake Oroville Sector
BUT
163
108
4,398.82
Benbow Lake SRA
NORTH COAST REDWOODS
DISTRICT TOTALS
190
HUM
SHA
Lake Oroville SRA
134
151.70
123
Bidwell-Sacramento River SP
1967
Humboldt Lagoons SP 105
HUM
6
0
Sinkyone Wilderness SP
0.00
0.002,256.46
1958
1931
12
125 611.09SHA
1923104
Ahjumawi Lava Springs SP
McArthur-Burney Falls Memorial SP
40
28,544.39
111
DN
Prairie Creek Redwoods SP
Little River SB
133
HUM
1
1931
32,640 107 0
0
26
0
1983
250
0
1975
R
1,142.47
485.19
0
O
0
1
0
1
0
4 0
0
2
0
0
280
0
0
0
0
24
0
26 Statistical Report - FY 2009/10

VISITOR ATTENDANCE
Paid Day Use
AUTHORIZED
STAFFING LEVELS
Camping ConcessionsFree Day Use Total
REVENUE
UNITS AND PROPERTIES OF THE CALIFORNIA STATE PARK SYSTEM
Fiscal Year 2009/10
User Fees Total Temp.
Revenue as % of Oper. Cost
Operating Costs ($)
AUTHORIZED BASE
BUDGET
Perm Full TimeMisc.
NORTH COAST REDWOODS DISTRICT
$17,235 $0 $2 $17,237 $6,316,652 19.0
$0 $0 $0 $0 28.0
0 0 0 0 - - - $0
0 36,911 0 36,911 - - - $0
2,366 14,414 6,985 23,765 $51,028 $0 $0 $51,028
1,860 350,355 47,045 399,260 $540,707 $1,547 $521 $542,775
0 10,185 0 10,185 - - - $0
0 0 0 0 - - - $0
3,137 17,457 29,289 49,883 $250,672 $3,771 $0 $254,443
0 2,779 0 2,779 - - - $0
564 195 6,906 7,665 $159,330 $0 $0 $159,330
$40 $7,427 $0 $7,467 27.0
0 7,280 0 7,280 - - - $0
249 14,316 28,765 43,330 $242,796 $0 $0 $242,796
0 54,263 0 54,263 - - - $0
15,915 45,408 37,141 98,464 $356,883 $0 $9 $356,892
52,948 14,446 50,670 118,064 $559,660 $0 $0 $559,660
0 12,028 0 12,028 - - - $0
0 54,216 0 54,216 - - - $0
92,449 929,514 249,957 1,271,920 $2,839,685 $12,785 $2,169 $2,854,639 $6,316,652 45.2% 74.0
NORTHERN BUTTES DISTRICT
$37,776 $16,809 $1,535 $56,120 $5,905,073 18.0
- - - $0 14.0
15,104 29,709 15,966 60,779 $136,258 $0 $0 $136,258
4,500 31,417 0 35,917 $12,878 $4,644 $0 $17,522
3,591 5,246 0 8,837 $8,730 $0 $0 $8,730
- - - $0 10.0
5,244 1,482 0 6,726 $3,092 $0 $0 $3,092
15,578 10,048 40,487 66,113 $351,062 $5,235 $0 $356,297
$23,995 $0 $0 $23,995 23.0
- - - $0 11.0
8,721 24,903 0 33,624 $51,674 $0 $0 $51,674
- - - 0 - - - $0
15,059 16,875 7,631 39,565 $51,632 $0 $11,000 $62,632
- - - 0 - - - $0
1,045 23,860 20 24,925 $2,139 $0 $0 $2,139
1,742 6,422 4,913 13,077 $39,603 $0 $0 $39,603
338,296 1,037,196 168,164 1,543,656 $2,092,089 $305,836 $98,791 $2,496,716 $5,905,073 42.3% 76.0
Revenue data for the Lake Oroville Sector office
includes the Lake Oroville Visitor Center.
137,098
26,496
46,069
$5,795
$35,249
$87,891
47,36264
7,969
4,824
21,808
$485,014
-
$850,975
150,961 $5,835
$34,511
$0
1,523
14,7821,750 $87,891
152,646
19,855
$40150,961
1,229
$0$34,511
13,080
26,4960
1,836
3,595
11,824
93,258 $58,514
838,294
$0
36,855
51,785
0
$121,388
$534,774
$0
$1,071,726
$0
$0
0
1,691
0
0
0
4,610
See
summary
Waterfront footage for Colusa-Sacramento River SRA
includes data from Butte City Project.
$0
-
$220,634
$0
$543,528
$2,012
$86,139
$0
$0
$0
-
$117
- -
$1,637
$0
25,490
18,223
0
88,419
164,898
1,037,009
13,080
$533,137
-
$2,012
See
summary
Statistical Report - FY 2009/10 27

ACREAGE
Waterfront Feet
R = River
L = LakeIndividual Camp SitesO = Ocean
Year Aqrd.
S= Submerged
OtherGroup Camp Sites
Non-Camping Overnight Facilities
UNITS AND PROPERTIES OF THE CALIFORNIA STATE PARK SYSTEM
Fiscal Year 2009/10
PUBLIC USE FACILITIES
DISTRICT / Sector / Park Unit
Unit No.
CountyCalifornia State Parks
OwnedIndividual
Picnic Sites
Group Picnic Sites
Non-Motorized Trail Miles
OCEANO DUNES DISTRICT
Oceano Dunes District HQ
Oceano Dunes Sector
14,832 O
200 S
Pismo SB Sector
10,803 L
32,420 O
10,803 L
47,252 O
200 S
OCOTILLO WELLS DISTRICT
Ocotillo Wells District HQ
Heber Dunes Sector
Heber Dunes SVRA 444 IMP 1998 341.50 0.00 0 0 0 15 0 0.00
Ocotillo Wells Sector
IMP 37,817.13 0.00
SD 12,735.38 0.00
ORANGE COAST DISTRICT
Orange Coast District HQ Office
Crystal Cove Sector
Corona del Mar SB 532 ORA 1947 29.57 0.00 2,700 O 0 0 0 4 1 0.20
Crystal Cove SP 594 ORA 1979 2,786.4585 1,150.00 16,800 O 32 0 13 6 1 47.25
Bolsa Chica SB 534 ORA 1960 169.16 0.25 27,844 O 59 0 0 0 5 3.00
Huntington SB 564 ORA 1942 121.13 0.00 10,880 O 0 0 0 6 0 2.00
Orange Coast South Sector
Doheny SB 610 ORA 1931 62.34 192.00 6,567 O 121 1 0 134 17 2.00
San Clemente SB 611 ORA 1931 117.25 0.07 5,970 O 160 2 0 15 2 2.10
San Onofre SB 662 SD 1971 0.00 2,106.65 24,288 O 334 1 0 4 0 9.00
3,285.91 3,448.97 95,049 O 0 706 4 13 169 26 65.55
Russian River Sector
Armstrong Redwoods SNR
208 SON 1934 752.00 0.00 0 0 0 78 1 6.40
Austin Creek SRA 245 SON 1964 5,927.48 0.00 27 0 0 1 0 37.80
Fort Ross SHP 207 SON 1909 3,303.06 90.00 23,480 O 20 0 0 15 1 1.30
Kruse Rhododendron SNR
206 SON 1934 317.00 0.00 0 0 0 0 0 2.00
Salt Point SP 248 SON 1968 4,744.93 940.00 42,362 O 139 1 0 28 0 15.32
100,792 O
26,631 R
24,088.86 2,003.64 166,634 O 0 346 1 0 176 2 104.02
26,631 R
SAN DIEGO COAST DISTRICT
San Diego Coast District HQ Office 0.31 0.00
San Diego Historic Sector
Old Town San Diego SHP 667 SD 1967 29.00 0.08 0 0 0 8 0 0.00
San Pasqual Battlefield SHP
615 SD 1918 3.68 65.49 0 0 0 2 0 1.00
San Diego North Sector 1933
Cardiff SB 621 SD 1949 26.86 480.26 6,300 O 0 0 0 6 0 0.00
Carlsbad SB 612 SD 1933 34.13 10.00 7,119 O 0 0 0 4 0 0.25
Leucadia SB 634 SD 1949 10.60 0.00 5,380 O 0 0 0 0 0 0.10
Moonlight SB 638 SD 1949 15.32 0.00 1,555 O 0 0 0 12 0 0.10
San Elijo SB 654 SD 1952 42.62 545.00 7,100 O 169 0 0 16 0 0.00
South Carlsbad SB 652 SD 1949 118.40 0.00 17,875 O 222 0 0 0 0 0.00
Torrey Pines SB 631 SD 1952 61.36 0.00 8,841 O 0 0 0 0 0 0.00
Torrey Pines SNR 630 SD 1952 1,446.20 15.21 0 0 0 0 0 14.00
San Diego South Sector
Border Field SP 669 SD 1972 814.56 501.4492 6,040 O 0 0 0 20 1 6.50
Silver Strand SB 614 SD 1932 3,708.72 40.00 23,600 O 136 1 0 140 5 2.50
6,311.76 1,657.49 83,810 O 0 527 1 0 208 6 24.45
0
1974
1934 160
1,412.07
01,000
0
0
3.00
3.00
0
015
0
0 41.20
0.00
6.00
0
0
0
0
9,044.39
0
973.64
0.00
265.25392,409.59
446
Ocotillo Wells SVRA
264
OCEANO DUNES DISTRICT
TOTALS
Sonoma Coast SP 209
RUSSIAN RIVER DISTRICT
TOTALS
SAN DIEGO COAST DISTRICT
TOTALS
SLO
OCOTILLO WELLS DISTRICT
TOTALS
Oceano Dunes SVRA
SLO
439
Pismo SB
0
3,821.66 265.25
50,894.01 0.00
Russian River District HQ Office
RUSSIAN RIVER DISTRICT
Orange Coast North Sector
ORANGE COAST DISTRICT
TOTALS
SON
1,185
112
112
185
0
0
0
1976
1935 0
00
0
540
0
28 Statistical Report - FY 2009/10
VISITOR ATTENDANCE
Paid Day Use
AUTHORIZED
STAFFING LEVELS
Camping ConcessionsFree Day Use Total
REVENUE
UNITS AND PROPERTIES OF THE CALIFORNIA STATE PARK SYSTEM
Fiscal Year 2009/10
User Fees Total Temp.
Revenue as % of Oper. Cost
Operating Costs ($)
AUTHORIZED BASE
BUDGET
Perm Full TimeMisc.
$0 $0 $0 $0 $7,885,278 44.0
- - - $0
- - - $0
- - - $0 $5,724,712 32.0
- - - $0
0 20,068 0 20,068 - - - $0
- - - $0
ORANGE COAST DISTRICT
$31,748 $0 $322 $32,070 $12,866,588 22.0
- - - $0 19.0
- - - 0 - - - $0
652,959 344,444 43,386 1,040,789 $1,643,863 $188,118 $0 $1,831,981
$1,925 $0 $0 $1,925 32.0
1,079,738 1,226,866 66,448 2,373,052 $3,702,385 $40,851 $593 $3,743,829
1,021,721 1,161,048 0 2,182,769 $3,635,918 $38,619 $47 $3,674,584
- - - $0 45.0
750,758 812,557 131,688 1,695,003 $2,326,926 $77,328 $50 $2,404,304
135,486 175,177 134,721 445,384 $1,741,134 $4,460 $0 $1,745,594
997,126 606,001 160,213 1,763,340 $2,997,228 $0 $25 $2,997,253
4,637,788 4,326,093 536,456 9,500,337 $16,081,127 $349,376 $1,037 $16,431,540 $12,866,588 127.7% 118.0See
summary
RUSSIAN RIVER DISTRICT
$5,178 $2,325 ($28,063) ($20,560) $3,534,121 10.0
- - - $0 34.0
40,187 628,381 0 668,568 $158,694 $0 $0 $158,694
19,906 190,750 4,080 214,736 ($25) $0 $0 ($25)
47,176 138,019 6,641 191,836 $128,200 $0 $0 $128,200
0 15,383 0 15,383 - - - $0
14,374 190,511 36,438 241,323 $311,233 $0 $0 $311,233
147,748 4,135,131 117,484 4,400,363 $1,238,392 $2,325 ($28,063) $1,212,654 $3,534,121 34.3% 44.0
SAN DIEGO COAST DISTRICT
$7,418 $0 $208 $7,626 $9,219,642 22.0
- - - $0 13.0
0 5,585,474 0 5,585,474 $788 $2,907,467 $0 $2,908,255
0 6,421 0 6,421 - - - $0
- - - $0 38.0
1,272,540 265,798 0 1,538,338 $217,894 $972 $0 $218,866
0 1,387,963 0 1,387,963 $0 $0 $0 $0
- - - 0 - - - $0
- - - 0 - - - $0
276,651 345,157 238,898 860,706 $2,024,398 $99,988 $0 $2,124,386
169,498 799,841 259,457 1,228,796 $2,429,659 $124,928 $88 $2,554,675
1,086,431 625,969 0 1,712,400 - - - $0
328,615 190,947 0 519,562 $1,436,310 $2,400 $0 $1,438,710
- - - $0 14.0
3,545 47,664 0 51,209 $4,547 $0 $0 $4,547
220,134 170,954 90,269 481,357 $1,280,498 $8,830 $424 $1,289,752
3,357,414 9,426,188 588,624 13,372,226 $7,401,512 $3,144,586 $720 $10,546,817 $9,219,642 114.4% 87.0See
summary
1,614,189
158,619
$410,691
$410,691
$9,381
3,068,517
$90,698
$3,230
$90,698672,742
$1,122,613
$2,063,307
$0 $0
0
482,427
$5,457
2,972,08726,105 $635,112
$18,068
505,743
70,325
$0
337,174
0
672,742
0
168,569
404,844
918,131
138,551
See
summary
Revenue for Austin Creek SRA is included in the data
for Armstrong Redwoods SNR.
$5,457
$1,122,613
$2,564,696
$3,230
$1,442,083
$0
OCOTILLO WELLS DISTRICT
OCEANO DUNES DISTRICT
$18,068
$635,112
See
summary
Crystal Cove Sector referred to as the Orange Coast
Central Sector in staffing report.
See
summary
$5,724,712 0.3% 32.0
543,395
$940,694
2,096,616
604,273
$9,381
313,858
563,463404,844
$7,885,278 32.5% 44.0
Statistical Report - FY 2009/10 29

ACREAGE
Waterfront Feet
R = River
L = LakeIndividual Camp SitesO = Ocean
Year Aqrd.
S= Submerged
OtherGroup Camp Sites
Non-Camping Overnight Facilities
UNITS AND PROPERTIES OF THE CALIFORNIA STATE PARK SYSTEM
Fiscal Year 2009/10
PUBLIC USE FACILITIES
DISTRICT / Sector / Park Unit
Unit No.
CountyCalifornia State Parks
OwnedIndividual
Picnic Sites
Group Picnic Sites
Non-Motorized Trail Miles
SAN LUIS OBISPO COAST DISTRICT
San Luis Obispo District HQ Office
Coastal Sector
Cayucos SB 452 SLO 1940 15.63 0.00 1,980 O 0 0 0 0 0 0.00
Estero Bluffs SP 749 SLO 2000 353.30 0.00 23,000 O 0 0 0 0 0 5.00
Harmony Headlands SP 745 SLO 2003 748.30 0.00 10,300 O 0 0 0 0 0 1.40
Hearst San Simeon SP 487 SLO 1932 1,695.687 613.00 115,643 O 202 0 0 66 0 6.00
Limekiln SP 461 MON 1994 711.15 0.00 4,900 O 26 0 0 0 0 3.40
Los Osos Oaks SNR 746 SLO 1972 85.10 0.00 0 0 0 0 0 1.20
Montaña De Oro SP 441 SLO 1934 10,365.12 1.00 59,360 O 54 6 0 1 0 47.60
Morro Bay SP 443 SLO 1934 2,192.93 590.26 13,715 O 139 2 0 0 4 14.60
Morro Strand SB 442 SLO 1932 183.01 0.00 19,460 O 85 0 0 0 0 0.50
Museum Sector
Hearst San Simeon SHM 494 SLO 1958 161.07 47.50 0 0 0 55 0 0.00
16,511.30 1,251.76 238,058 O 0 506 8 0 122 4 79.70
SANTA CRUZ DISTRICT
Santa Cruz District HQ Office
Pajaro Coast Sector
Lighthouse Field SB 474 SCR 1978 37.60 0.00 0 0 0 0 0 0.50
Manresa SB 416 SCR 1948 137.87 0.00 11,800 O 64 0 0 7 0 0.00
Natural Bridges SB 407 SCR 1933 62.37 0.00 1,800 O 0 0 0 50 0 0.00
New Brighton SB 408 SCR 1933 157.33 0.06 3,900 O 115 3 0 14 1 0.50
Rancho San Andréas (Castro Adobe)
434 SCR 2002 1.00 0.00 0 0 0 0 0 0.00
Santa Cruz Mission SHP 433 SCR 1959 1.94 0.00 0 0 0 0 2 0.00
Seacliff SB 409 SCR 1931 86.69 2.14 9,483 O 61 0 0 131 1 0.00
Sunset SB 410 SCR 1931 299.84 2.27 18,600 O 91 1 0 3 2 0.00
The Forest of Nisene Marks SP
465 SCR 1963 10,222.70 0.00 5 0 0 17 0 32.40
10,620 L
4,285 O
Wilder Ranch SP 456 SCR 1974 8,341.81 0.00 60,896 O 0 0 0 7 0 0.00
San Mateo Coast Sector
Año Nuevo SP 222 SM 1985 4,209.00 0.00 0 0 0 8 0 12.25Bean Hollow SB 266 SM 1958 44.00 0.00 9,806 O 0 0 0 7 0 1.00
Burleigh H. Murray Ranch 285 SM 1979 1,325.45 0.00 0 0 0 1 0 2.13
Butano SP 423 SM 1956 4,727.50 0.40 45 0 0 10 0 43.07
Gray Whale Cove SB 270 SM 1966 3.10 0.00 390 O 0 0 0 0 0 0.15
Half Moon Bay SB 277 SM 1956 180.71 0.22 13,158 O 64 1 0 47 0 5.00
Montara SB 278 SM 1959 773.47 6.80 12,485 O 0 0 0 4 0 7.70
Pacifica SB 230 SM 1979 20.73 0.00 1,930 O 0 0 0 0 0 0.00
Pescadero SB 227 SM 1958 664.89 34.86 9,800 O 0 0 0 3 0 2.50
Pigeon Point Light
Station SHP281 SM 1981 63.54 12.00 9,050 O 0 0 3 0 0 0.10
Point Montara Light
Station282 SM 1982 0.00 6.00 0 0 3 0 0 0.25
Pomponio SB 226 SM 1960 420.64 0.00 11,750 O 0 0 0 10 0 0.00
San Gregorio SB 273 SM 1958 413.98 0.00 4,900 O 0 0 0 11 0 0.06
Thornton SB 275 SM 1955 58.00 0.00 3,160 O 0 0 0 0 0 0.00
Santa Cruz Mountains Sector
SCR 17,146.24 0.00
SM 904.11 0.00
SCL 103.95 0.00
SCR 5,100.42 13.02
SM 24.83 0.00
Henry Cowell Redwoods SP
418 SCR 1953 4,623.06 0.00 44,553 R 111 0 0 45 2 45.00
Portola Redwoods SP 405 SM 1945 2,607.82 0.00 67 4 0 26 1 16.00
62,858.31 79.41 10,620 L 0 832 19 44 529 9 319.61
193,293 O
58,953 R
R
10
26
105
0 37.50
183
0
14,400
2.00
0O
1.64
SAN LUIS OBISPO COAST
DISTRICT TOTALS
Castle Rock SP
422
406
1955
1906
1968
SANTA CRUZ DISTRICT
TOTALS
6,100
404
Big Basin Redwoods SP
Twin Lakes SB SCR
0
93.72 00 0
0 0
23
38 111.50
30 Statistical Report - FY 2009/10
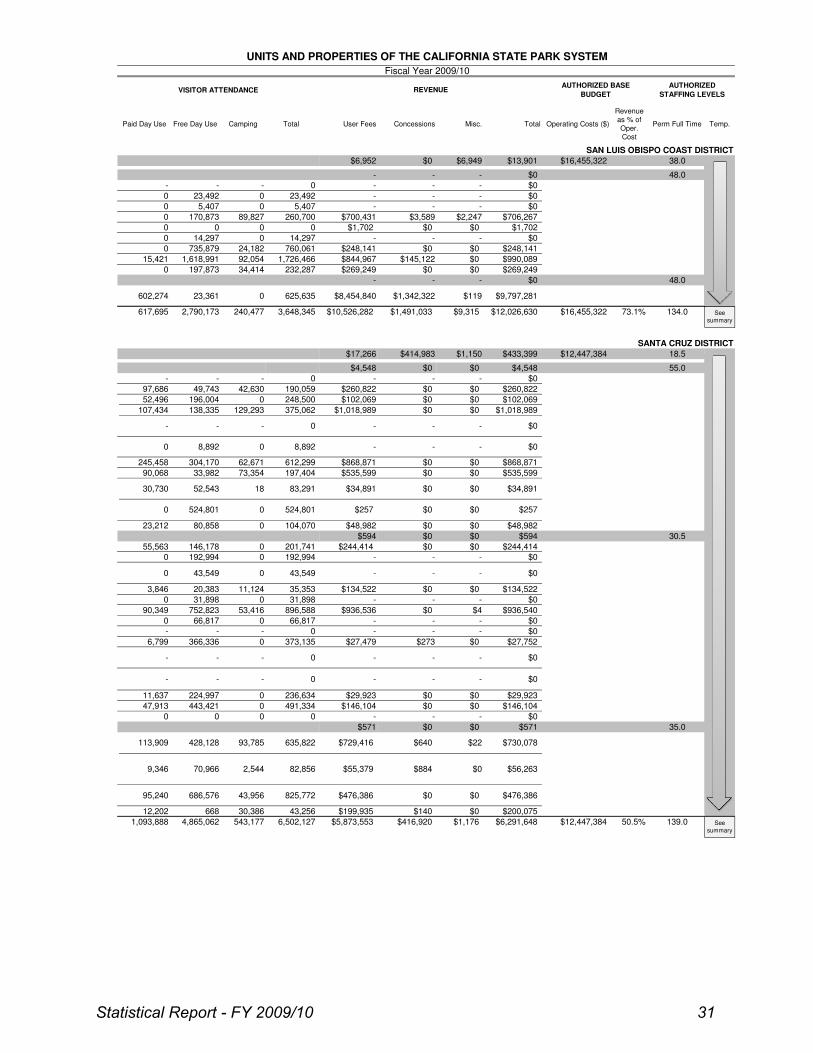
VISITOR ATTENDANCE
Paid Day Use
AUTHORIZED
STAFFING LEVELS
Camping ConcessionsFree Day Use Total
REVENUE
UNITS AND PROPERTIES OF THE CALIFORNIA STATE PARK SYSTEM
Fiscal Year 2009/10
User Fees Total Temp.
Revenue as % of Oper. Cost
Operating Costs ($)
AUTHORIZED BASE
BUDGET
Perm Full TimeMisc.
SAN LUIS OBISPO COAST DISTRICT
$6,952 $0 $6,949 $13,901 $16,455,322 38.0
- - - $0 48.0
- - - 0 - - - $0
0 23,492 0 23,492 - - - $0
0 5,407 0 5,407 - - - $0
0 170,873 89,827 260,700 $700,431 $3,589 $2,247 $706,267
0 0 0 0 $1,702 $0 $0 $1,702
0 14,297 0 14,297 - - - $0
0 735,879 24,182 760,061 $248,141 $0 $0 $248,141
15,421 1,618,991 92,054 1,726,466 $844,967 $145,122 $0 $990,089
0 197,873 34,414 232,287 $269,249 $0 $0 $269,249
- - - $0 48.0
602,274 23,361 0 625,635 $8,454,840 $1,342,322 $119 $9,797,281 316.8
617,695 2,790,173 240,477 3,648,345 $10,526,282 $1,491,033 $9,315 $12,026,630 $16,455,322 73.1% 134.0
SANTA CRUZ DISTRICT
$17,266 $414,983 $1,150 $433,399 $12,447,384 18.5
$4,548 $0 $0 $4,548 55.0
- - - 0 - - - $0
97,686 49,743 42,630 190,059 $260,822 $0 $0 $260,822
52,496 196,004 0 248,500 $102,069 $0 $0 $102,069
107,434 138,335 129,293 375,062 $1,018,989 $0 $0 $1,018,989
- - - 0 - - - $0
0 8,892 0 8,892 - - - $0
245,458 304,170 62,671 612,299 $868,871 $0 $0 $868,871
90,068 33,982 73,354 197,404 $535,599 $0 $0 $535,599
30,730 52,543 18 83,291 $34,891 $0 $0 $34,891
23,212 80,858 0 104,070 $48,982 $0 $0 $48,982
$594 $0 $0 $594 30.5
55,563 146,178 0 201,741 $244,414 $0 $0 $244,4140 192,994 0 192,994 - - - $0
0 43,549 0 43,549 - - - $0
3,846 20,383 11,124 35,353 $134,522 $0 $0 $134,522
0 31,898 0 31,898 - - - $0
90,349 752,823 53,416 896,588 $936,536 $0 $4 $936,540
0 66,817 0 66,817 - - - $0
- - - 0 - - - $0
6,799 366,336 0 373,135 $27,479 $273 $0 $27,752
- - - 0 - - - $0
- - - 0 - - - $0
11,637 224,997 0 236,634 $29,923 $0 $0 $29,923
47,913 443,421 0 491,334 $146,104 $0 $0 $146,104
0 0 0 0 - - - $0
$571 $0 $0 $571 35.0
95,240 686,576 43,956 825,772 $476,386 $0 $0 $476,386
12,202 668 30,386 43,256 $199,935 $140 $0 $200,075
1,093,888 4,865,062 543,177 6,502,127 $5,873,553 $416,920 $1,176 $6,291,648 $12,447,384 50.5% 139.0
82,856
635,822 $729,416
524,801
428,128
9,346 2,544
0 $0$0524,801
70,966
$257
$55,379
0
$884
93,785
$0
$22
$56,263
$640 $730,078
$257
113,909
See
summary
See
summary
Statistical Report - FY 2009/10 31

ACREAGE
Waterfront Feet
R = River
L = LakeIndividual Camp SitesO = Ocean
Year Aqrd.
S= Submerged
OtherGroup Camp Sites
Non-Camping Overnight Facilities
UNITS AND PROPERTIES OF THE CALIFORNIA STATE PARK SYSTEM
Fiscal Year 2009/10
PUBLIC USE FACILITIES
DISTRICT / Sector / Park Unit
Unit No.
CountyCalifornia State Parks
OwnedIndividual
Picnic Sites
Group Picnic Sites
Non-Motorized Trail Miles
SIERRA DISTRICT
Sierra District HQ Office
Alpine Mono Sector
Bodie SHP 324 MNO 1962 1,015.91 0.00 0 0 0 8 0 7.50
Grover Hot Springs SP 322 ALP 1959 553.42 0.00 76 0 0 20 0 3.00
Mono Lake Tufa SNR 366 MNO 1982 0.00 55,300.00 245,995 L 0 0 0 4 0 5.20
Lake Tahoe Sector
Burton Creek SP 348 PLA 1976 1,890.29 0.00 0 0 0 0 0 12.00
D.L. Bliss SP 303 ELD 1929 888.93 1,260.00 19,380 L 154 1 0 10 0 3.50
NEV 415.74 0.00 9,000 L
PLA 2,876.78 0.00 2,580 R
Ed Z'berg Sugar Pine Point SP
339 ELD 1965 2,324.46 0.00 7,700 L 121 10 0 32 1 10.50
Emerald Bay SP 313 ELD 1953 662.71 870.00 21,050 L 122 0 0 0 0 6.40
Kings Beach SRA 343 PLA 1974 7.74 0.00 879 L 0 0 0 26 0 0.00
Lake Valley SRA 382 ELD 1985 155.39 0.00 2,750 R 0 0 0 0 0 0.00
1,245 L
80 R
Ward Creek Project 349 PLA 1978 173.00 0.00 0 0 0 0 0 0.00
Washoe Meadows SP 390 ELD 1985 627.73 0.00 3,750 R 0 0 0 0 0 3.00
Sierra Gold Sector
Empire Mine SHP 383 NEV 1975 852.98 0.00 0 0 0 25 0 25.00
Malakoff Diggins SHP 356 NEV 1965 3,142.88 0.00 2,640 L 30 1 3 3 1 19.00
Plumas-Eureka SP 321 PLU 1959 4,424.30 0.00 67 1 0 12 0 10.25
2,100 L
145,960 R
23,608.16 62,616.18 309,989 L 0 749 13 3 190 2 122.85
155,120 R
TEHACHAPI DISTRICT
Mojave Sector
Antelope Valley California Poppy Reserve (SNR)
560 LA 1976 1,781.23 0.00 0 0 0 6 0 7.40
Antelope Valley Indian Museum SHP
579 LA 1979 157.34 240.00 0 0 0 17 0 1.50
Arthur B. Ripley Desert Woodland SP
595 LA 1993 566.08 0.00 0 0 0 1 0 1.00
Colonel Allensworth SHP 341 TUL 1973 1,023.36 2,691.83 15 0 0 17 0 2.00
Fort Tejon SHP 351 KER 1940 647.38 0.00 0 1 0 10 0 2.25
Red Rock Canyon SP 577 KER 1970 19,147.36 6,177.29 51 1 0 9 0 69.70
Saddleback Butte SP 543 LA 1957 2,875.07 78.92 50 1 0 30 0 13.00
Tomo-Kahni SHP 368 KER 1993 560.00 0.00 0 0 0 0 0 2.12
Tule Elk SNR 350 KER 1932 983.60 0.00 0 0 0 8 0 0.00
Silverwood Sector
Providence Mountains SRA
538 SBD 1956 5,890.46 0.00 6 0 0 2 0 2.80
Silverwood Lake SRA 592 SBD 1978 2,201.00 0.00 68,640 L 142 7 0 603 0 21.70
TEHACHAPI DISTRICT 35,832.88 9,188.04 68,640 L 264 10 0 703 0 123.47
TWIN CITIES DISTRICT
Twin Cities District HQ
Carnegie Sector
ALA 3,812.96 0.00
SJ 1,225.82 36.00
Clay Pit Sector
Clay Pit SVRA 155 BUT 1981 0.00 220.14 0 0 0 0 0 0.00
Twin Cities Sector
Prairie City SVRA 367 SAC 1990 1,714.56 1,071.23 0 0 0 57 0 0.00
NEV
0 0
1,327.37 24
0
1979
TWIN CITIES DISTRICT
TOTALS
0
0
6,753.34
0.00
152
0
2
5.50
46
0 0.00103
0270.00
5,186.183,534.19
Carnegie SVRA 272
Tehachapi District HQ Office
South Yuba River SP 359
SIERRA DISTRICT TOTALS
PLA 1899
1928
Tahoe SRA
301
302
Donner Memorial SP
0 0.00
0
0
24
0 0
1979
0
61.7063
0
0 12.00
48
0
32 Statistical Report - FY 2009/10

VISITOR ATTENDANCE
Paid Day Use
AUTHORIZED
STAFFING LEVELS
Camping ConcessionsFree Day Use Total
REVENUE
UNITS AND PROPERTIES OF THE CALIFORNIA STATE PARK SYSTEM
Fiscal Year 2009/10
User Fees Total Temp.
Revenue as % of Oper. Cost
Operating Costs ($)
AUTHORIZED BASE
BUDGET
Perm Full TimeMisc.
SIERRA DISTRICT
$1,808 $16,183 $17 $18,008 $6,834,181 26.0
- - - $0 6.0
107,729 20,192 0 127,921 $489,159 $1,287 $0 $490,446
52,194 54 31,303 83,551 $412,154 $68 $0 $412,222 8.0
0 271,590 0 271,590 $0 $2,357 $0 $2,357
- - - $0 17.0
0 0 0 0 - - - $0
35,178 7,195 36,396 78,769 $329,589 $0 $0 $329,589
29,747 7,014 42,084 78,845 $397,669 $2,513 $52 $400,234
46,980 14,663 23,164 84,807 $301,799 $2,044 $0 $303,843
35,871 15,716 0 51,587 - - - $0
0 0 0 0 $0 $537,800 $0 $537,800
0 0 0 0 - - - $0
0 0 0 0 - - - $0
- $186 - $186 20.0
34,587 66,502 0 101,089 $148,622 $587 $0 $149,209
5,358 1,139 5,439 11,936 $43,585 $0 $0 $43,585
0 42,460 21,704 64,164 $112,914 $0 $0 $112,914 4.0
411,340 876,917 194,049 1,482,306 $2,710,913 $573,607 $69 $3,284,589 $6,834,181 48.1% 86.0
$266 $0 $5 $271 $3,930,298 7.0
0 3,184 0 3,184 - - - $0 11.0
44,733 180 0 44,913 $135,172 $0 $0 $135,172
65 239 0 304 $200 $0 $0 $200
0 790 0 790 - - - $0
4,202 2,396 1,160 7,758 $12,605 $0 $0 $12,605
5,298 29,749 1,328 36,375 $13,270 $0 $0 $13,270 12.0
4,380 13,446 11,722 29,548 $94,627 $0 $0 $94,627
961 78 1,028 2,067 $11,528 $0 $0 $11,528
229 46 0 275 $981 $0 $0 $981
1,025 5,344 0 6,369 $1,990 $0 $1 $1,991
- - - $0 24.5
8,089 6,128 1,290 15,507 $52,334 $1,325 $0 $53,659
243,843 17,956 52,241 314,040 $1,185,982 $38,553 $96 $1,224,631
312,825 79,536 68,769 461,130 $1,508,689 $39,878 $97 $1,548,664 $3,930,298 39.4% 54.5
- - - $0 $6,612,517 21.0
$0 $0 $833 $833 16.0
$0 $0 $833 $833
0 26,706 0 26,706 - - - $0
$0 $0 $833 $833
155,296 909 0 156,205 $120,795 $47,083 $46 $167,924
$6,612,517 2.6% 37.0
-354,871
261,067 $120,795
0 $73,662
$879
$0
30,609217,754
0
3,636
62,458
10,089
$47,083
63,696
12,704
5.0$10,582 $410,534$399,952163,087
0
6,453
2,994
354,871
71,885 27,506
12,704
$0
$0
$73,662
$168,757
-
TEHACHAPI DISTRICT
TWIN CITIES DISTRICT
$0
See
summary
See
summary
See
summary
Attendance for the Mojave Desert Info Center reported
in Mojave Sector data.
78,156 $247,999$16$33,235$214,748
-
Statistical Report - FY 2009/10 33
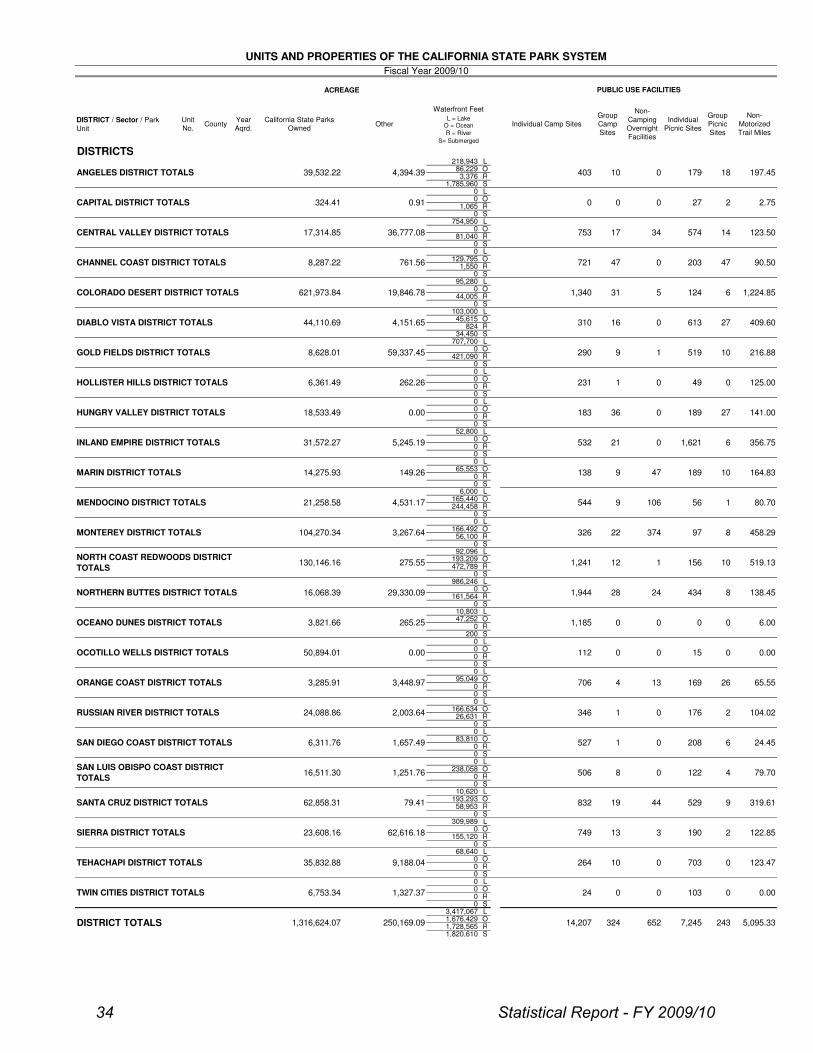
ACREAGE
Waterfront Feet
R = River
L = LakeIndividual Camp SitesO = Ocean
Year Aqrd.
S= Submerged
OtherGroup Camp Sites
Non-Camping Overnight Facilities
UNITS AND PROPERTIES OF THE CALIFORNIA STATE PARK SYSTEM
Fiscal Year 2009/10
PUBLIC USE FACILITIES
DISTRICT / Sector / Park Unit
Unit No.
CountyCalifornia State Parks
OwnedIndividual
Picnic Sites
Group Picnic Sites
Non-Motorized Trail Miles
218,943 L86,229 O3,376 R
1,785,960 S0 L0 O
1,065 R0 S
754,950 L0 O
81,040 R0 S0 L
129,795 O1,550 R
0 S95,280 L
0 O44,005 R
0 S103,000 L45,615 O
824 R34,450 S
707,700 L0 O
421,090 R0 S0 L0 O0 R0 S0 L0 O0 R0 S
52,800 L0 O0 R0 S0 L
65,553 O0 R0 S
6,000 L165,440 O244,458 R
0 S0 L
166,492 O56,100 R
0 S92,096 L
193,209 O472,789 R
0 S986,246 L
0 O161,564 R
0 S10,803 L47,252 O
0 R200 S
0 L0 O0 R0 S0 L
95,049 O0 R0 S0 L
166,634 O26,631 R
0 S0 L
83,810 O0 R0 S0 L
238,058 O0 R0 S
10,620 L193,293 O58,953 R
0 S309,989 L
0 O155,120 R
0 S68,640 L
0 O0 R0 S0 L0 O0 R0 S
3,417,067 L1,676,429 O1,728,565 R1,820,610 S
TWIN CITIES DISTRICT TOTALS 6,753.34 1,327.37 24 0 0
122.85
OCEANO DUNES DISTRICT TOTALS 0 0 6.00
50,894.01 0.00 112 0 0
6
18,533.49 0.00 183 36 0
8 458.29
53231,572.27
149.26
56
1,621
1
1
138
706
1,185
0
1,944
5,245.19
544
262.26 231
4,531.17
290
4,151.65
19,846.78 1,340
0
16,068.39
6,361.49
203
1,224.856
18
80.70
43428
37422
346
12
13
49
27
1 125.00
23,608.16
6,311.76
21,258.58
409.60
141.00
15
8,287.22 761.56
753
721 90.50
1
0
24
21
138.45
169
104.02
189
9
0
0 0
65.55
79.41
1,241
3,267.64
16,511.30 1,251.76
29,330.09
326
44,110.69
17,314.85
324.41
39,532.22
0.91
36,777.08
4,394.39
1,657.49
2,003.64
3,285.91
14,275.93
59,337.458,628.01
3,821.66 265.25
275.55
104,270.34
62,858.31
621,973.84
24,088.86
130,146.16
3,448.97
216.88
519.13
10
10
2
6
27
0
0.00
356.75
24.45
319.61
176
10
8
97
156
26
4
189 164.83
0.00103
506 79.70
9529
8
832
527 1
44
0
0 122
208
1,316,624.07 250,169.09 14,207
9,188.04 264
262,616.18 749 3
652 7,245
703 0 123.47
243 5,095.33
35,832.88 0
13
10
0
310 16
31 5
123.50
197.45
613
124
CAPITAL DISTRICT TOTALS
CENTRAL VALLEY DISTRICT TOTALS 17 34
0
47
47
574
190
47
9
0
1 519
0
10
0
179
MARIN DISTRICT TOTALS
MENDOCINO DISTRICT TOTALS
GOLD FIELDS DISTRICT TOTALS
HOLLISTER HILLS DISTRICT TOTALS
270
9
106
SIERRA DISTRICT TOTALS
TEHACHAPI DISTRICT TOTALS
CHANNEL COAST DISTRICT TOTALS
COLORADO DESERT DISTRICT TOTALS
DIABLO VISTA DISTRICT TOTALS
SAN DIEGO COAST DISTRICT TOTALS
SAN LUIS OBISPO COAST DISTRICT
TOTALS
SANTA CRUZ DISTRICT TOTALS
HUNGRY VALLEY DISTRICT TOTALS
INLAND EMPIRE DISTRICT TOTALS
DISTRICT TOTALS
NORTHERN BUTTES DISTRICT TOTALS
ORANGE COAST DISTRICT TOTALS
RUSSIAN RIVER DISTRICT TOTALS
MONTEREY DISTRICT TOTALS
NORTH COAST REDWOODS DISTRICT
TOTALS
OCOTILLO WELLS DISTRICT TOTALS
0
4
403
324
19
DISTRICTS
2.75
14
ANGELES DISTRICT TOTALS
2
34 Statistical Report - FY 2009/10
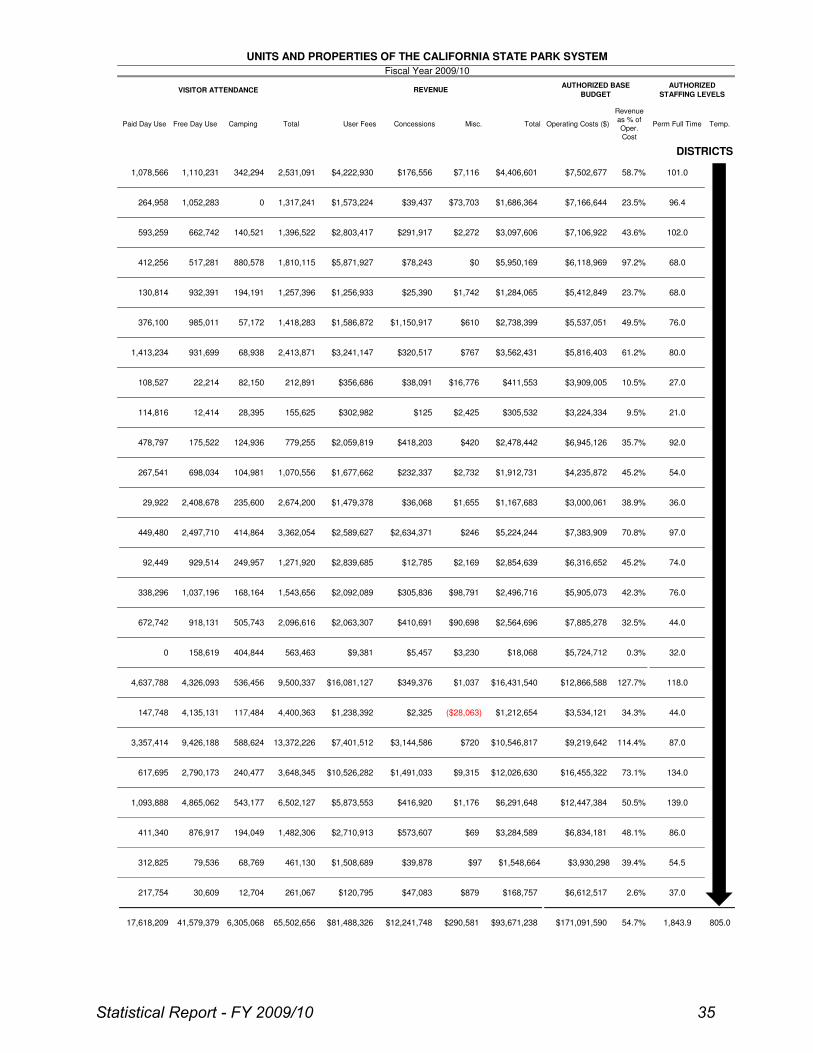
VISITOR ATTENDANCE
Paid Day Use
AUTHORIZED
STAFFING LEVELS
Camping ConcessionsFree Day Use Total
REVENUE
UNITS AND PROPERTIES OF THE CALIFORNIA STATE PARK SYSTEM
Fiscal Year 2009/10
User Fees Total Temp.
Revenue as % of Oper. Cost
Operating Costs ($)
AUTHORIZED BASE
BUDGET
Perm Full TimeMisc.
$6,612,517 2.6% 37.012,704 261,067 $879
$9,381 $5,457 $3,230
$120,795
$416,920
$411,553 $3,909,005
28,395 155,625
108,527 $38,091
$1,677,6621,070,556
$2,059,819 $420
235,600 $1,479,378 $36,068
104,981
$125
1,810,115
1,396,522
0
$302,982
140,521
194,191
342,2941,110,231
$25,390932,391
$78,243 $0
$176,556
130,814
1,052,283
$320,517
$4,222,9302,531,091 $7,116
27.0
80.0
76.0
96.4
338,296
114,816 12,414
264,958
1,413,234
412,256
58.7% 101.0$7,502,677
102.0
DISTRICTS
23.7%
68.0
68.0
97.2%
54.5
36.038.9%$3,000,061
54.7%
32.0
76.0
1,843.9
86.0
44.0
$7,885,278 32.5% 44.0
92.035.7%
$9,219,642
10.5%
9.5%
87.0
127.7%
805.0
21.0
54.0
118.0
$5,724,712 0.3%
45.2%
134.0
50.5%$12,447,384
$16,455,322
74.0
97.0
139.0
48.1%
39.4%
$12,866,588
$6,316,652
$3,534,121 34.3%
114.4%
70.8%
$4,235,872
45.2%
$7,383,909
$2,425 $305,532
478,797
517,281 880,578
$6,945,126
$7,106,922
$5,412,849
$3,224,334
$7,166,644
$5,537,051
23.5%
43.6%
49.5%
$1,284,065
$6,118,969
$1,742
$291,917
$39,437
$2,803,417
$1,256,933
2,413,871
1,317,241
$2,854,639
$2,496,716
$1,655
$2,478,442
$1,912,731
$2,634,371 $246
$2,169
57,172 $1,586,8721,418,283
931,699 $5,816,403$767
267,541
779,255
$2,732
124,936
$232,337
2,674,20029,922
68,938
698,034
2,408,678 $1,167,683
$2,738,399
$3,562,431
985,011
$418,203
82,150 212,891 $356,686
672,742 918,131
$12,785
$305,836
249,957
1,037,196 $2,092,089
147,748 4,135,131
168,164
92,449 929,514
449,480 2,497,710 414,864
$1,238,392
2,096,616 $2,063,307
$2,839,685
0
117,484
$410,691
$5,873,553
158,619 404,844
505,743
$2,589,627
4,326,093 9,500,337 $16,081,1274,637,788
3,362,054
1,543,656
536,456
563,463
4,400,363
3,357,414
411,340 876,917
1,093,888
240,477
4,865,062 543,177 6,502,127
$10,526,282
9,426,188 588,624 13,372,226
2,790,173 3,648,345617,695
$7,401,512
$1,037
$1,491,033 $9,315
$98,791
79,536
41,579,37917,618,209
312,825
217,754 30,609
461,130 $1,508,689
$2,710,913 $3,284,589 $6,834,1811,482,306
6,305,068 $12,241,74865,502,656 $81,488,326
$3,930,298 $97 $1,548,664 68,769 $39,878
$93,671,238 $171,091,590$290,581
$573,607
$47,083
194,049
$168,757
$69
$10,546,817
$1,176
73.1%$12,026,630
$2,272
$1,212,654($28,063)
$90,698 $2,564,696
$6,291,648
$3,144,586 $720
1,271,920
1,257,396
$610
$16,776
42.3%$5,905,073
$1,150,917
$5,950,169
$4,406,601
$73,703 $1,686,364
$3,097,606
$16,431,540
$5,224,244
$349,376
$2,325
175,522
22,214
662,742
1,078,566
593,259
$18,068
$1,573,224
$3,241,147 61.2%
376,100
$5,871,927
Statistical Report - FY 2009/10 35
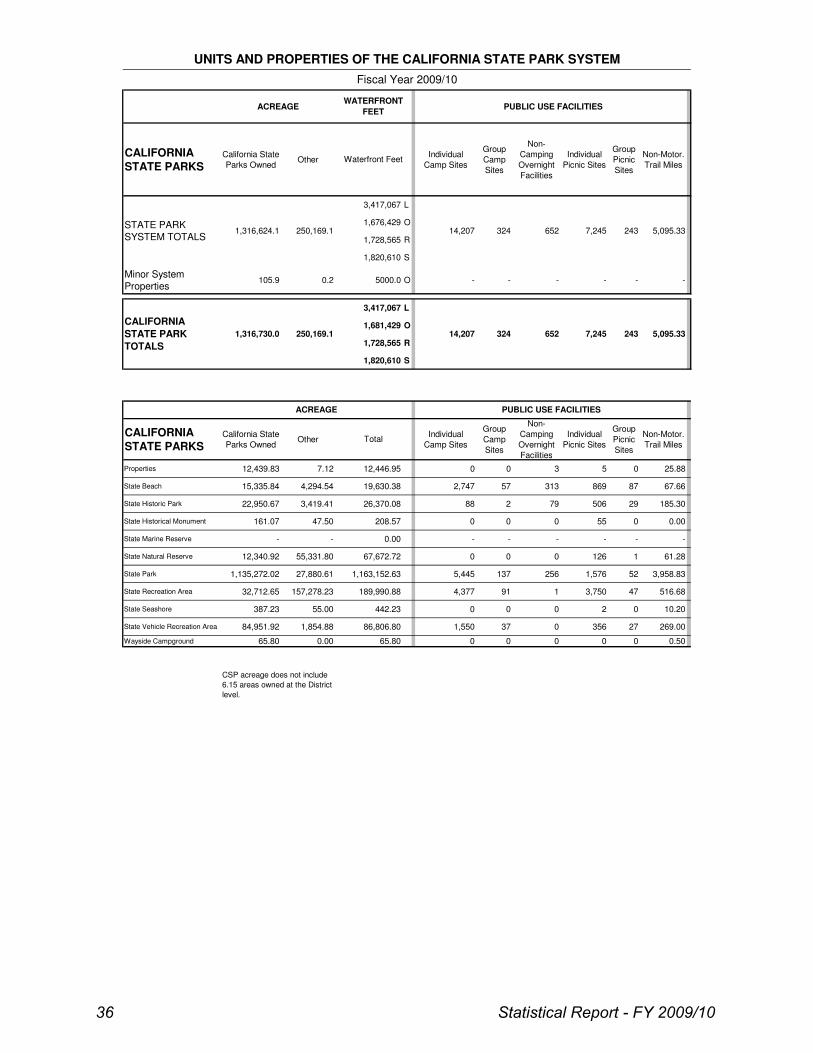
ACREAGE PUBLIC USE FACILITIES
CALIFORNIA
STATE PARKSCalifornia State
Parks OwnedOther
Individual
Camp Sites
Group
Camp
Sites
Non-
Camping
Overnight
Facilities
Individual
Picnic Sites
Group
Picnic
Sites
Non-Motor.
Trail Miles
3,417,067 L
1,676,429 O
1,728,565 R
1,820,610 S
Minor System Properties
105.9 0.2 5000.0 O - - - - - -
3,417,067 L
1,681,429 O
1,728,565 R
1,820,610 S
CALIFORNIA
STATE PARKSCalifornia State
Parks OwnedOther
Individual
Camp Sites
Group
Camp
Sites
Non-
Camping
Overnight
Facilities
Individual
Picnic Sites
Group
Picnic
Sites
Non-Motor.
Trail Miles
Properties 12,439.83 7.12 12,446.95 0 0 3 5 0 25.88
State Beach 15,335.84 4,294.54 19,630.38 2,747 57 313 869 87 67.66
State Historic Park 22,950.67 3,419.41 26,370.08 88 2 79 506 29 185.30
State Historical Monument 161.07 47.50 208.57 0 0 0 55 0 0.00
State Marine Reserve - - 0.00 - - - - - -
State Natural Reserve 12,340.92 55,331.80 67,672.72 0 0 0 126 1 61.28
State Park 1,135,272.02 27,880.61 1,163,152.63 5,445 137 256 1,576 52 3,958.83
State Recreation Area 32,712.65 157,278.23 189,990.88 4,377 91 1 3,750 47 516.68
State Seashore 387.23 55.00 442.23 0 0 0 2 0 10.20
State Vehicle Recreation Area 84,951.92 1,854.88 86,806.80 1,550 37 0 356 27 269.00
Wayside Campground 65.80 0.00 65.80 0 0 0 0 0 0.50
CSP acreage does not include
6.15 areas owned at the District
level.
652 7,245 243 5,095.33
PUBLIC USE FACILITIES
CALIFORNIA
STATE PARK
TOTALS
1,316,730.0 250,169.1 14,207 324
UNITS AND PROPERTIES OF THE CALIFORNIA STATE PARK SYSTEM
Fiscal Year 2009/10
14,207 324STATE PARK SYSTEM TOTALS
1,316,624.1
Waterfront Feet
5,095.33250,169.1 652 7,245
Total
WATERFRONT
FEET
243
ACREAGE
36 Statistical Report - FY 2009/10
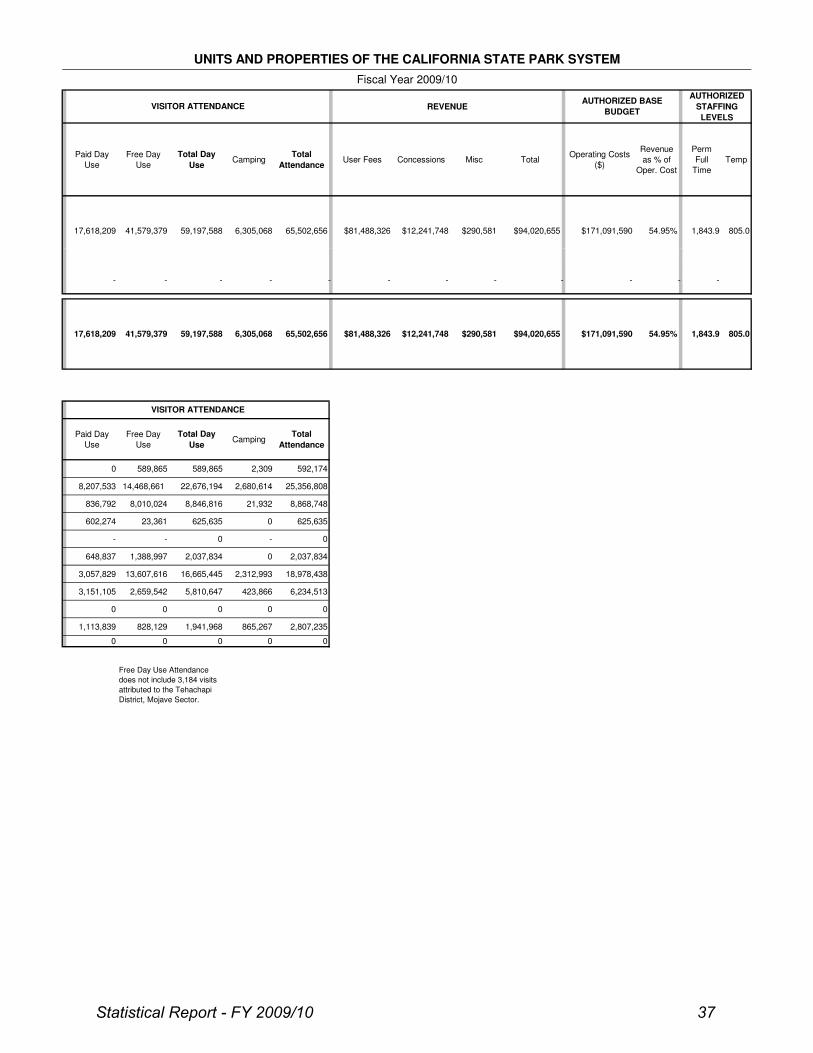
REVENUE
AUTHORIZED
STAFFING
LEVELS
Paid Day
Use
Free Day
Use
Total Day
UseCamping
Total
AttendanceUser Fees Concessions Misc Total
Operating Costs
($)
Revenue
as % of
Oper. Cost
Perm
Full
Time
Temp
- - - - - - - - - - - -
Paid Day
Use
Free Day
Use
Total Day
UseCamping
Total
Attendance
0 589,865 589,865 2,309 592,174
8,207,533 14,468,661 22,676,194 2,680,614 25,356,808
836,792 8,010,024 8,846,816 21,932 8,868,748
602,274 23,361 625,635 0 625,635
- - 0 - 0
648,837 1,388,997 2,037,834 0 2,037,834
3,057,829 13,607,616 16,665,445 2,312,993 18,978,438
3,151,105 2,659,542 5,810,647 423,866 6,234,513
0 0 0 0 0
1,113,839 828,129 1,941,968 865,267 2,807,235
0 0 0 0 0
VISITOR ATTENDANCE
1,843.9 805.065,502,656 $290,581 $94,020,655
UNITS AND PROPERTIES OF THE CALIFORNIA STATE PARK SYSTEM
Fiscal Year 2009/10
41,579,37917,618,209
VISITOR ATTENDANCE
$171,091,590 54.95%17,618,209 41,579,379 59,197,588 6,305,068
805.0$94,020,655 $171,091,590 1,843.954.95%
Free Day Use Attendance
does not include 3,184 visits
attributed to the Tehachapi
District, Mojave Sector.
AUTHORIZED BASE
BUDGET
$290,581$12,241,74865,502,656 $81,488,32659,197,588 6,305,068
$81,488,326 $12,241,748
Statistical Report - FY 2009/10 37

38 Statistical Report - FY 2009/10

This page intentionally left blank.
CHAPTER 4 - BASIC STATISTICS – DEFINITION OF TERMS This chapter provides definitions or characterizations of each of this report’s data categories, along with how their information is created and processed within California State Parks. Where appropriate, background information on certain data categories is provided to allow the reader to know something of what is behind the data and to understand the strengths and weaknesses of the numbers that are available for use. These definitions appear below.
* * * * * Park Name – With rare exception, classified units are named by the California State Park and Recreation Commission, based on recommendations made by the Director. Very few units have been named by the California Legislature. The unit’s name usually reflects a geographic feature or an individual or group of people historically associated with the unit. Prior to their classification, newly acquired properties are given temporary names for working purposes. Information source: California State Park and Recreation Commission; Office of Acquisition and Real Property Services, California State Parks. Park Classification - With rare exception, units are classified by the California State Park and Recreation Commission, based on recommendations made by the Director. Very few units have been classified by the California Legislature. These recommendations are based on the options found in Public Resources Code Section 5019 et seq. Each unit is given a classification that best reflects the unit’s primary values and the purposes for which the property was acquired and is to be managed. Information source: California State Park and Recreation Commission Unit Number - The “unit number” is the last three digits of a unique six-digit number assigned by the Accounting Services Section to each of the classified units and major unclassified properties of the State Park System. Such six-digit numbers are also assigned to California State Parks’ various other organizational components - divisions, sections, and offices. A major purpose of these numbers is to identify and track money, staff and other resources allocated to and used by these various activity centers. Information source: Accounting Services Section, California State Parks. County - This shows the county or counties in which the unit or property is located. The abbreviations for the county names conform to the standard used throughout California state government. Information source: Office of Acquisition and Real Property Services, California State Parks. Acreage- This is the surface acreage of the lands and waters which constitute each classified unit and major unclassified property. This information is based on county assessor’s maps, descriptions, and any notations regarding easements or claims on these properties. The acreage of the lands in the California State Park
Statistical Report - FY 2009/10 39
System is also recorded, on a parcel-by-parcel basis, in the assessor’s books of the counties where the lands are situated. The addition or removal of acreage from the State Park System’s database is a continuous process. In any instance, it is accomplished at the time that the appropriate records are received and processed by California State Parks. This may not coincide with the time of the recording of deeds, payment of funds, or movement of other paperwork. Information source: Office of Acquisition and Real Property Services, California State Parks. • DPR-Owned – those lands which are owned in fee by California State Parks.
Some of these lands, however, may be subject to easements and certain other restrictions.
• Other – those lands which are owned in fee by another government agency, non-profit organization or private entity, but which are operated as part of the State Park System through an agreement with California State Parks. The form of these agreements includes leases, permits, easements, operating agreements and memorandums of understanding.
Waterfront Feet - Water, in the form of lakes, streams and ocean shoreline is an important park feature, from both an environmental and recreational standpoint. Data on the presence and magnitude of this feature is measured in terms of its frontage, the edge it presents to or within the unit or property. The four types of waterfront feet are reported separately - for natural lakes and reservoirs (“L”), for rivers (“R”), for the shore of the Pacific Ocean and its major estuaries (“O”) and for waterfront feet that are submerged (“S”). The data in this column is presented in actual footage. Information source: Office of Acquisition and Real Property Services, California State Parks. Public Use Facilities - The properties of the State Park System provide a wide range of public use facilities, including picnic sites, camp sites, overnight shelters, trails, boat launching ramps, restrooms, roads, parking areas, interpretive centers and campfire centers. The three most common general types of public use facilities are those used by visitors for overnight use, for picnicking and for moving about the park on trails, by means of foot, horse or bicycle. Earlier statistical reports were inconsistent in their definitions of these three types of facilities. Such reports did not have data on certain subcategories of facilities; in the case of overnight use facilities, group camps were seldom reported and data on structural overnight facilities had never been collected. Commencing with the 2001/02 Statistical Report, data for public use facilities of those used by visitors for overnight use, for picnicking and for moving about the park on trails, by means of foot, horse or bicycle have been specifically included. To obtain the current and detailed data that was needed for this report, a special unit-by-unit web survey was accomplished in the fall of 2010, seeking information that was
40 Statistical Report - FY 2009/10
current as of June 30, 2010. The details of this survey are contained in Appendix B. Information source: Planning Division, California State Parks. • Individual/Family Camp Sites - This category is the sum of eight survey
subcategories. Each subcategory is briefly described here and fully described in Appendix B.
1. Primitive/Undeveloped – each site accommodates up to eight people and
two vehicles; tent space, stove, table and nearby piped water, chemical or vault toilet. Some of these amenities may not be available in every case.
2. Developed (standard) – each site accommodates up to eight people and two vehicles; designated parking, tent or RV space, stove, table and nearby piped water, and restroom with flush toilets and hot water; may include showers and laundry sinks. This site can accommodate recreation vehicles that are under 30 feet in length.
3. Developed (oversized) – each site accommodates up to eight people and two vehicles; designated parking, tent or RV space, stove, table and nearby piped water, and restroom with flush toilets and hot water; may include showers and laundry sinks. This site can accommodate recreation vehicles that are over 30 feet in length.
4. RV Hookup – each site accommodates up eight people and two vehicles in a designated space and provides paved spur for RV, as well as hookups for electricity, water and sewage disposal.
5. Environmental/Trail – a designated primitive site in a relatively undisturbed setting, accessible by foot path or trail.
6. Hike/Bike – a designated area with tent space, table, fire rings or stove with water and toilet facilities nearby, accessible by foot path or trail.
7. Floating Campsites – tent space, table, stove, and toilet facilities on a floating platform, accessible only by boat.
8. Dock Berths, Offshore Mooring Buoys – a place to tie up a boat, which itself may serve for overnight use; some units with mooring buoys have an assigned campsite on land.
• Group Camp Sites – This category is the sum of two subcategories. Each
subcategory is briefly described here and fully described in Appendix B.
1. Tent or RV Use - primitive or developed – an area with space for many tents or RVs, providing many tables, stoves, water sources, and restrooms, designed to be used by a large group of people; often available by reservation only.
2. Horse camps – primitive or developed – as above, but with added facilities needed for the management of horses.
• Non-Camping Overnight Facilities - This includes tent cabins, rustic cabins,
shelters, yurts and bark houses, as well as lodges, motel facilities, hostel facilities, and modern cabins.
Statistical Report - FY 2009/10 41

• Individual or Family Picnic Sites – These are small areas with tables, stoves
or fire rings, with nearby parking, water and restrooms. These sites are sometimes used by groups but are intended mainly for individuals or families.
• Group Picnic Sites - These are large areas with a number of tables, stoves or
fire rings, with nearby parking, water and restroom facilities, often used by reservation only.
• Non-Motorized Trails – This category is the sum of five subcategories. Each
subcategory is briefly described here and fully described in Appendix B. 1. Multiple Use Trails - these facilities are unpaved pathways or trails for use
by all three types of users: pedestrian, horse and bicycle. 2. Equestrian/Pedestrian - this category includes pathways or trails
designated for equestrians and pedestrians thereby excluding bicycles. 3. Bicycle/Pedestrian - this category includes pathways or trails designated
for bicycles and pedestrians thereby excluding horses. 4. Pedestrian only - this category includes pathways or trails designated for
pedestrians only thereby excluding horses and bicycles. 5. Primitive/Administrative Roads Used as Trails – this category includes
unimproved (dirt or gravel) service roads and fire roads which are designated for trail use.
Note that the State Park System Planning Division’s survey of public use facilities provided certain figures that were different from those which had been developed in recent years. The data developed by the Planning Division’s survey will be considered to be correct and official. Visitor Attendance - Data on visitor attendance reflects an estimate of the number of individual visits (not the number of individual visitors) to the units of the State Park System during the fiscal year. Using this approach, an individual visiting three units in a day is recorded in the attendance data three times rather than one. Attendance data is collected at the unit level, sent to the district offices, and thereafter conveyed to the Field Services Division in headquarters. Some units or districts may collect a variety of more detailed attendance or visitor use data (e.g. attendance at a specific area or facility, like a boat launching ramp), but only the unit-wide data on three required categories – free day use, paid day use, overnight use - are conveyed to headquarters to be used for system-wide records. Source: Field Services Division, California State Parks. The two different categories of visitor attendance reported in this statistical report are generated in different ways, and their consistency and accuracy differ widely.
42 Statistical Report - FY 2009/10
• Day Use – This is the number of day (non-overnight) visits to the unit in question. “Day use”, as used in this column, includes both free day use and day use for which a fee is paid for entry into the park. Day use includes park entry by any means, by motor vehicle of any type, on foot, on bicycle, by boat or on horseback. A single visit is counted regardless of the length of stay or variety of activities undertaken. Historically, approximately 30% of day use is paid and the remainder is free. Day use admission based on the use of annual passes is included in this data.
• Camping - This is the number of overnight visits to the unit in question by
visitors using the many types of sites and structures listed above, as well as using temporary overflow areas.
Not all units collect visitor attendance information for day use and overnight use in the same way. In a few instances, usually historic units with per-person admission charges, there are actual counts of visits. In most units, however, attendance figures are the result of making estimates, using various techniques and producing results of widely different levels of accuracy. The estimation techniques may range in quality from one unit to the next and they may be changed at any unit at any time. While the accuracy of these figures has substantial limitations, it is believed that in the aggregate, over time, orders-of-magnitude and broad trends in visitor use can be determined with some validity. It is clear that, for the entire State Park System, total attendance is underestimated for three reasons.
1. Little or no data is collected from State Park System-operated units which are small, remote and little used, where gathering this information would not be cost-effective;
2. Data is rarely collected from units which, in large part or in their entirety, are managed not by the State Park System but by another agency or organization through an operating agreement. Many of these units are heavily used ocean beach units with substantial attendance.
3. The failure to report all of the visitors who spend the night in a unit not through traditional camping but instead through the occupancy of such structures as lodges, cabins, yurts, and hostels.
Revenue - Revenue at the field level is the income flowing into a park unit, or into a sector or a district office as a result of parklands and facilities being used by visitors or organizations for a wide range of approved purposes. Information on field-level revenue is generated at the district level and is reported to the Accounting Section and subsequently to the Budget Section in Headquarters. Information source: Budget Section, California State Parks. The revenue figures used in this report are year-end totals, current as of June 30 of the year, as reported each year in the “Actual” column in the Governor’s
Statistical Report - FY 2009/10 43
Budget. Four of the six CalStars revenue categories shown there are needed for this statistical report, reflecting revenue coming directly from the “field.” In the budget document, there is separate information for the 20 districts in the State Park System and for the 5 districts in the OHMVR Division, information which is combined for the purposes of this statistical report. A third and very small revenue category, from California State Parks’ systems of Sno-park facilities, is not included. • User Fees – These are admissions and use fees paid by the visitor, including
fees for admission, parking, camping and the use of other park facilities such as boat launch ramps and pay showers. This category includes money from the sale of day use admission passes and Hearst Castle ® tours. This revenue source is represented by CalStars category 140600, State Beach and Park Service Fees.
• Concessions – The bulk of this revenue category is the income from the
rentals paid by concessionaires, private entrepreneurs who under contract provide goods and services to park visitors on State Park lands. This category also includes the leases of System lands, dwelling rental, and receipts for special events and filming. In the OHMVR Division, the bulk of their money comes from the sale of OHV licenses (“green stickers”) and from the interest on funds which it has in reserve. The revenue category is represented by CalStars category 152300, Miscellaneous Revenues from Use of Property & Money.
• Miscellaneous – This revenue is the combination of two CalStar categories,
161400, Miscellaneous Revenue, and 164200, Parking Violations. Revenue earned by or funds transferred to the State Park System at the headquarters level is not reported in this statistical report. Operating Costs - These are funds from California State Parks’ annual budget which provide for the operation and management of the “field” portion of the State Park System, as described in the Introduction to this report. These monies fund the staff, equipment, utilities and supplies needed to serve the visiting public, to maintain and renovate facilities, and to protect and manage the System’s natural and cultural resource base. The operating costs reported in this statistical report are reported each year in the “Actual” column in the Governor’s Budget. Information Source: Budget Section, California State Parks. These funds are allocated by California State Parks Field Services Division directly to the individual districts, thereby allowing each district the flexibility to make allocations and reallocations throughout the year to its various units based on changing need.
44 Statistical Report - FY 2009/10

Revenue as % of Operating Costs - A computation made to indicate in a rough way the degree to which the State Park System as a whole or any of its districts are “self-supporting”, a point where revenue equals or exceeds operating costs. The district figure ranges widely, depending largely on the revenue-generating capability of the units and properties within a district. Also important in determining the size of this figure is the degree to which the operation of the district’s set of units is particularly labor-intensive and whether the district’s units and properties are located close to one another or are widely distributed. Source: Planning Division, California State Parks computations. Staffing - The operation and management of the units and properties of the State Park System, as well as the district and sector offices, requires a large and diverse professional staff. The two staffing categories of concern here are permanent full-time staff (indicated as the number of positions) and temporary staff (measured in terms of person-year equivalents). Information on the annual quantity of what might be deemed another type of staffing, that of non-paid volunteer work, is available from the Interpretation and Education Division. The data provided in this report is for positions that were authorized rather than those that were actually filled during the fiscal year. These figures are reported annually in the Governor’s Budget. Information source: Budget Section, California State Parks. • Permanent, full time – These are individuals who have permanent civil service
status in a wide range of job classifications. They work year-around for the standard 2,080 hours per year.
• Temporary/PY equivalent – “Temporary” includes permanent intermittent,
seasonal and retired annuitant positions. Many of these employees are normally required during the parks’ busy season, when visitor use is heaviest.
Statistical Report - FY 2009/10 45

46 Statistical Report - FY 2009/10

This page intentionally left blank.

CHAPTER 5 - OTHER AVAILABLE STATISTICS In addition to the basic statistics or data sets shown in the table in Chapter 3, the State Park System regularly collects a wide variety of other useful information which records and measures many of its activities and operations. Some of this information is portrayed in descriptive or graphic terms as well as in numerical form. Certain material is available through California State Parks’ Internet and Intranet sites, with a wider range being available directly from specific sources within California State Parks.
A. Internet/Intranet
Two general sources of information about California State Parks and the State Park System are the State Parks’ Internet web site and its Intranet site. These sites contain useful information about California State Parks and the State Park System. They contain information about the individual park units and their attractions, and about a variety of special topics of current relevance to the State Park System. Also available is information about California State Parks’ organizational components and some of the work which they do. These latter references make available the contents of a variety of reports, studies and data sets, as well as general information about California State Parks and its State Park System. Most of the contents of the Internet and Intranet are expanded and updated on a periodic basis. The Internet site is available to the general public at http://www.parks.ca.gov. The Intranet is available only for those with access to California State Parks’ internal communication system, and is found at http://isearch.parks.ca.gov.
B. Direct Sources
A wide variety of specialized data and information can be obtained directly from the organizational units of California State Parks that produce it. In the following listing, selected areas or topics of information are specified and very briefly described. In the case of each item, California State Parks’ organizational source or location of the information is indicated, in terms of the appropriate division, office, section or unit. In addition, a specific resource person is indicated, along with their phone number and email address. These organizational and personal references are current as of the time of this writing but are subject to change over time. Most of the information referred to below may be made available upon request. Some of it may be available immediately in hard copy, while much of it exists only in a computer database which can be accessed only by the program
Statistical Report - FY 2009/10 47
manager. In many cases, the level and format of the data can be tailored to the specific needs of the individual making the request. These more specialized areas of information and their organizational sources are as follows. Accidents - Included here is information from the field on calls for assistance, reports taken and filed, and actions taken as a matter of public safety. Assistance may include first aid, getting needed help, search-and-rescue efforts and finding lost individuals. Incidents involving motor vehicles and boats are reported separately in two different categories. • Contact: Frank Spear, Law Enforcement & Emergency Services Division,
California State Parks, Sacramento (916) 653-0398; [email protected]. Aerial Photo Files - Aerial photographs provide important information on land use and conditions in and around State Park System lands. Aerial photographs are routinely purchased by California State Parks for many planning and management purposes. The primary repository and catalogue system for 9"x9" color, infrared, and black and white aerial prints are maintained by the Natural Resources Division in Sacramento. • Contact: James Suero, Research Program Specialist I (Geographic
Information Systems), Natural Resources Division, California State Parks, Sacramento (916) 651-6941; [email protected].
Archaeological Collections - This database contains a master list of all archaeological artifact collections, by park unit, which is maintained by California State Parks’ Archaeological Collections Research Facility. This archive also includes all of the notes, records and photos related to archaeological collections and fieldwork. • Contact Richard Fitzgerald, Archaeology, History & Museums Division,
California State Parks, West Sacramento (916) 375-5921; [email protected].
Condition Assessment Database - In 2002, California State Parks conducted an extensive system-wide survey of natural resources in the State Park System to establish a baseline on the general condition of park lands and detailed information on selected natural resource features. Information on such things as rare and endangered species, non-native plants and animals, natural habitats, geologic features and pollution, was collected from park resource specialists and entered into a database. Information on over 195 of the System’s park units is included in the database. • Contact: Art Fong Jr., Natural Resources Division, California State Parks,
Sacramento (916) 653-9454; [email protected]. Cooperating Associations - This database contains information on the formal independent nonprofit citizens’ groups which contract with one or more park units
48 Statistical Report - FY 2009/10
to assist in the funding of those units’ interpretive and educational programs and services. Information is available on the identity of each association, its name, address, phone number(s) and email address. Financial information, as reported by the associations, is also available. • Contact: Wayne Breece, Partnership Support, Interpretation and Education
Division, California State Parks, Sacramento (916) 654-5397; [email protected].
Crimes - This database contains information on calls made, reports made, and actions taken by park staff relative to crime in and near State Park System units. Data includes information on investigations, warnings given, and arrests for alleged misdemeanors and crimes. • Contact: Frank Spear, Law Enforcement & Emergency Services Division,
California State Parks, Sacramento (916) 653-0398; [email protected]. Cultural Resources: Sites, Structures, Registrations - Information on the number and type of cultural resources in the State Park System is found in the Index to Historic and Archaeological Resources Owned by California State Parks. This index lists, by park unit, the number of (1) archaeological sites, (2) historic structures, (3) California Historic Landmarks, (4) National Register and California Register properties, (5) National Historic Landmarks, and (6) Cultural Preserves. • Contact: Blaine Lamb, Archaeology, History and Museums Division, California
State Parks, Sacramento (916) 653-5910; [email protected].
Facilities – Accessibility - In compliance with the federal Americans with Disabilities Act, California State Parks in 2001 completed a very detailed Transition Plan for accessibility in the then-266 California state parks. The Transition Plan identifies the physical barriers to access throughout the Department’s programs, services, and activities, and establishes a plan for barrier removal, including costs and timelines, to ensure programmatic access by people with disabilities. • Contact Jennifer Harris, Accessibility Section, Acquisition and Development,
California State Parks, Sacramento (916) 445-4144; [email protected].
Facilities – Data for Maintenance Purposes - For the purpose of programming California State Parks’ facility maintenance activity, the tens of thousands of structures, utilities and other built facilities in the State Park System were inventoried and recorded. In this particular information system, numbers of similar facilities (e.g. individual campsites) were defined as a single facility. • Contact Joe Rogers, Facilities Management Division, California State Parks,
Sacramento; [email protected]. Facilities – Museum Collections - Data on the condition of facilities used to house museum collections in the State Park System is found in the Museum Collections Facility Index (MCFI) database. Facilities which house collections are surveyed
Statistical Report - FY 2009/10 49
each year for compliance with museum standards for environmental conditions, security, fire protection, and documentation. • Contact: Rebecca Carruthers, Museum Services Section, Archaeology,
History & Museums Division, California State Parks, Sacramento (916) 653-8893; [email protected].
Facilities – Three Visitor Facility Types in Detail - Through specific annual surveys, actual counts are made of the numerous different types of (1) overnight accommodation facilities, (2) picnic facilities and (3) the number and cumulative length of non-motorized trails in each classified unit and major unclassified property of the State Park System. This data includes information on the capacity of overnight and picnic facilities to accommodate visitors. • Contact Barry Trute, Planning Division, California State Parks, Sacramento
(916) 653-3495; [email protected].
Incidents - This database contains information on public assistance events in park units that are not covered in any other public safety category, such as accidents or crimes. • Contact: Frank Spear, Law Enforcement & Emergency Services Division,
California State Parks, Sacramento (916) 653-0398; [email protected]. Interpretive programs - Data is available on types of formal and informal programs that take place in park units, things such as guided hikes, craft demonstrations, Junior Ranger programs and off-site school programs. Information is provided on the number of each type of program given, hours of programming completed, the characteristics of the presenters and visitor attendance at the programs. • Contact: Carolyn Schimandle, Interpretation and Education Division,
California State Parks, Sacramento (916) 651-8451; [email protected].
Legislative Districts - Each State Park System unit and property is located in one or more of three types of legislative districts - U. S. Congressional districts, State Senate districts and State Assembly districts. Information is available on the districts in which any park or property is located. • Contact Megan Florida, Legislation Office, California State Parks,
Sacramento (916) 653-8380; [email protected]. The Museum System (TMS) database – This database contains museum collections information at California State Parks including historic artifacts, photographic collections, Indian baskets, art objects, horse-drawn vehicles, archaeological specimens, archaeological and paleontological sites. TMS currently contains over 930,000 objects records with over 200,000 linked to digital images and documents of the related objects, and 16,000 site records. The database is accessible to authorized State Park employees through the Internet.
50 Statistical Report - FY 2009/10
• Contact: Yuk-Hoi (Winnie) Yeung, Archaeology, History & Museums Division, California State Parks, Sacramento (916) 654-4728; [email protected]
Park Features, Attractions and Associations - Information on a wide range of categories of features and attractions found in units of the State Park System (e.g. visitor centers, Native American sites, habitat types, blacksmithing demonstrations) is found in the 310-page Park-to-Park Index .
• Contact: Ty Smith, Interpretation and Education Division, California State Parks, Sacramento (916) 653-3913; [email protected].
Photographic Archives - Thousands of images of park units, cultural artifacts and important park-related persons are available. Media includes b/w prints and negatives, color prints and negative, 35mm slides and born digital images. • Contact: Wil Jorae, Interpretation and Education Division, California State
Parks, West Sacramento (916) 375-5930; [email protected]. Reservations for Campsites, Hearst Castle ® - A large share of the system’s campsites and all of the tours of Hearst Castle ® are available by reservation. Information is available on the number of camp units subject to reservation and the number of reservations actually made for camping or Hearst Castle ® tours. • Contact Jimmy Low, Concessions, Reservations, and Fees Division,
California State Parks, Sacramento (916) 654-1603; [email protected].
Statistical Report - FY 2009/10 51

52 Statistical Report - FY 2009/10

This page intentionally left blank.

CHAPTER 6 - HISTORY OF THIS REPORT The first annual Statistical Report for the State Park System was published for the 1961-62 fiscal year. Prior to that, information on the System’s acreage, facilities, attendance, income, expenditures and staffing was available largely from scattered sources within California State Parks and were on various occasions combined into a single publication for use in special studies or reports. Exhibit 1 provides a list of the documents which are recognizable as earlier statistical reports. Following the publication of the State Park System’s first specific annual statistical report, for fiscal year 1961-62, identical or similar reports were issued covering the years through 1989-90. Most of these reports provided information for a single fiscal year, although some covered three or four fiscal years in a single volume. In a multi-year report, some items of data for a given fiscal year may be different than that which had been presented for that particular fiscal year in a previous year’s report. This reflects the fact that the data was modified after the close of the original fiscal year by the addition of new information arriving after the end of the year. By convention, the data that is considered valid and used is that which is reported for the year in which the report was published, usually the smallest figure in any such series. Over this 29-year period, these statistical reports were altered somewhat as to their title, the range of their information and their formatting. As the series developed, there was more analysis of the subject year’s data and its comparison with that from previous years. Due to an administrative reorganization and subsequent budgetary limitations, the creation and publication of the series of annual statistical reports ceased in 1990. During the following years, it became clear that such a report was needed, that it was very useful to have such information assembled annually and made readily available to staff at all levels, as well as to interested persons outside of California State Parks. In late 2002, California State Parks’ Planning Division undertook to reinstitute this publication, to develop and publish once again a State Park System statistical report with at least the scope of the last one in the series, published eleven years earlier. The 2001/02 Statistical Report was the first product of this new effort. The scope of the document was expanded to provide information and analysis well beyond that found in any prior statistical report for the State Park System. Among these additions are: • The formatting of each district’s units and properties (where appropriate) in
terms of the sectors into which the district was organized at the end of the fiscal year;
Statistical Report - FY 2009/10 53
• Very detailed information on the definitions, source of and quality of each set of basic data, often with cautions as to its use;
• Information on the availability, source and quality of a wide range of regularly collected State Park System data that is important but the inclusion of which was beyond the scope of the basic data set of the statistical report; and
• A more detailed analysis of the year’s basic data and some comparison with relevant data from earlier years, an effort that will be more useful in the coming years.
As mentioned in the Introduction, the statistics in this report are considered California State Parks’ data “of record” and will be used as the basis for the reports, studies and analyses subsequently developed by Department staff.
54 Statistical Report - FY 2009/10
EXHIBIT 1 - STATISTICAL REPORTS FOR THE STATE PARK SYSTEM Year Document Title
A. Division of Beaches and Parks
1949-50 1950-51 1951-52 1952-53 1953-54 Report on A Decade – May 2, 1960 1954-55 1955-56 1956-57 1957-58 1958-59 1959-60 not available 1960-61 not available 1961-62 Annual Report 1961-62 1962-63 Annual Report 1962-63 1963-64 News and Views Statistical Report for the Division of Beaches and
Parks 1963-64 1964-65 Statistical Information for the Division of Beaches and Parks: Fiscal
Year 1964-65 1965-66 Division of Beaches and Parks: Statistical Report 1965-66 Fiscal
Year
B. State Parks
1966-67 Statistical Report for 1966-67 Fiscal Year 1967-68 Statistical Report for 1967-68 Fiscal Year 1968-69 Statistical Report for 1968-69 Fiscal Year 1969-70 1969-70 Fiscal Year Statistical Report 1970-71 1970-71 FY Statistical Report 1971-72 Statistical Report 1971-72 Fiscal Year 1972-73 Statistical Report 1972-73 Fiscal Year 1973-74 Statistical Report 1973-74 Fiscal Year 1974-75 Statistical Report 74-75 Fiscal Year 1975-76 Statistical Report 1975-76 Fiscal Year 1976-77 Statistical Report 1976-77 Fiscal Year 1977-78 Statistical Report – Fiscal Years 1976-1977, 1977-1978, 1978-1979 1978-79
Statistical Report - FY 2009/10 55
1979-80 Statistical Report – Fiscal Year 1979-80 1980-81 1981-82 1982-83 Statistical Report - Fiscal Years 1980-81, 1981-82, 1982-83, 1983-
84 1983-84 1984-85 1985-86 Statistical Report – Fiscal Years 1984-85, 1985-86, 1986-87 1986-87 Statistical Report –Fiscal Years 1985-86, 1986-87, 1987-88 1987-88 1988-89 State Park System Statistical Report – Fiscal Year 1988/89 1989-90 Statistical Report – Fiscal Year 1989/90 1990-91 not published 1991-92 not published 1992-93 not published 1993-94 not published 1994-95 not published 1995-96 not published (see Appendix A in California State Parks 1996-97 not published Statistical Report – 2001/02 1997-98 not published 1998-99 not published 1999-00 not published 2000-01 not published 2001-02 California State Park System Statistical Report: 2001/02 Fiscal
Year 2002-03 California State Park System Statistical Report: 2002/03 Fiscal
Year 2003-04 California State Park System Statistical Report: 2003/04 Fiscal
Year 2004-05 California State Park System Statistical Report: 2004/05 Fiscal
Year 2005-06 California State Park System Statistical Report: 2005/06 Fiscal
Year 2006-07 California State Park System Statistical Report: 2006/07 Fiscal
Year 2007-08 California State Park System Statistical Report: 2007/08 Fiscal
Year 2008-09 California State Park System Statistical Report: 2008/09 Fiscal
Year 2009-10 California State Park System Statistical Report: 2009/10 Fiscal
Year
56 Statistical Report - FY 2009/10

This page intentionally left blank.

APPENDIX A - SELECTED DATA – 1990/91 TO 2000/01 As indicated in Exhibit 1, there were no issues of the State Park System annual statistical report published during the eleven fiscal years from 1990/1991 through 2000/2001. Thus, the important data which they would have contained is not available. This data gap makes it difficult to quickly find or construct a year-by-year series for the report’s critical data categories, such as acreage, visitor attendance, revenue, operating costs and the like. So that this missing data would not remain forever unavailable, an effort was made to locate it in California State Parks’ hardcopy or electronic records. To locate or to create after the event at least some portion of these missing data sets, a search was made of the active or archived records of California State Parks. Appendix A of the 2001/02 Statistical Report contains a number of important categories of State Park System information that were located or created, thereby filling in as well as is possible the gap caused by the missing statistical reports. Those needing these data should consult that report. As indicated in the 2001/02 Statistical Report, there are a variety of problems which made impossible the creation of some of the missing data in a context and format which matches that of this present document. There are many limitations in the historic data, and some of these limitations would apply even if the annual figures were readily available. In many cases, the definitions of data terms were not clear or have changed over time, making difficult a good transition in a data set from one fiscal year to a subsequent year where new definitions apply. In other cases, there may be changes in the methods of collecting data from the original field sources and processing it at headquarters. Below the system-wide level of data, at the district-level of information, there is an insurmountable problem of consistency in the geographic aggregation of earlier unit-level data. It is not possible to be consistent because of the various field-level management reorganizations which have taken place over the eleven-year period. These reorganizations have altered the number and configurations (and even names) of the districts, and thus changed the number and identity of the units and properties which each contains. With these factors in mind, the eleven years of missing information for the key data sets which were identified or created were presented only at the level of aggregation which reflects the State Park System as a whole. Where, over the course of the eleven years there were changes in data definitions or collection processes, these matters were noted below the data tables as warning to the reader. In spite of the recognized, albeit unavoidable, shortcomings in this data, it was considered the official data, the data “of record”, for the purposes they represent.
Statistical Report - FY 2009/10 57
As indicated above, these eleven-year data sets were made available in Appendix A of the 2001/02 Statistical Report in five sections, using in the same sequence in which the data sets appear in the table in this report’s Chapter 3. These sections are:
1. Acreage 2. Public Use Facilities 3. Visitor Attendance 4. Revenue - Fees, Concessions, Miscellaneous 5. Operating Costs and Staff Levels
Where the reader seeks more detailed data than was provided in these tables, contact should be made with California State Parks’ most appropriate division, office or section identified in Chapter 5.
58 Statistical Report - FY 2009/10
APPENDIX B - PUBLIC USE FACILITY SURVEY – FY 2009/10 To obtain the Public Use Facility information needed for the present statistical report, the Planning Division made an exhaustive online unit-by-unit survey in the fall/winter of 2010 to get exact figures for the following types of visitor facilities:
• Overnight use facilities – individual (or “family”) and group campsites, as well as a variety of specific types of shelters, structures and commercial lodging accommodations
• Picnic facilities – individual (or “family”) and group • Trails – number and mileage of paths and unimproved roadways available
to users other than those using off-highway vehicles. An online survey was completed by appropriate field staff for every classified unit and major unclassified property; information provided would reflect the situation as it was on June 30, 2010. An example of this survey including totals for each question appears on the following pages. As shown on the survey, this instrument broke these three broad categories down into twenty-four subcategories, each of which was carefully defined so as to be mutually exclusive of the others. The instrument also sought information on the “visitor capacity” of each subcategory of overnight use and day use facility. This figure reflects the number of people (or in one case, boats) who could occupy the facilities at one time, a factor that is sometimes termed a facility’s “instantaneous capacity.” The following 2009/10 Unit Facility Survey summary indicates the totals for each category and grouping of categories. As indicated in the definition of public use facilities in Chapter 4, twenty-two of the twenty-four subcategories were combined into the six categories of public use facilities reported in Chapter 3. Because they were by their nature open-ended and poorly defined, and thus not subject to being precisely counted, the two subcategories of overflow camping were not used in the report. This survey did not seek information on trails used by off-highway vehicles because many of these facilities are not well defined and in some cases are indistinguishable from the “volunteer trails” from cross-country riding. The “Trails” data in statistical reports in fiscal years 1989-90 and earlier had contained trails used by off-highway vehicles.
Statistical Report - FY 2009/10 59

I. Overnight Use Facilities
A. Individual/Family Camp SitesNumber of
Sites
Visitor
Capacity: # of
people
1Primitive/undeveloped: accommodates up to 8 people and two vehicles with a tent space, stove, table and nearby piped
water and a chemical or vault toilet3,425 128,698
2
Developed (standard): up to 8 people and two vehicles with a tent space, stove, table, nearby piped water and a
restroom with flush toilets and hot water; may include showers and laundry sinks. Can accommodate smaller RVs
(~under 30 feet)
6,443 49,810
3
Developed (oversized): up to 8 people and two vehicles with a tent space, stove, table, nearby piped water and a
restroom with flush toilets and hot water; may include showers and laundry sinks. Can accommodate smaller RVs
(~over 30 feet)
1,480 11,904
4RV Hookup: up to 8 people and two vehicles with a paved spur for RV, stove, table and restroom with flush toilets and hot
water; each site with electricity and water; sewer connection on site or in unit961 7,053
5Environmental/Trail Campsite: designated primitive site with a tent space, table, fire ring or stove and a pit toilet in a
relatively undisturbed setting406 2,922
6Hike-in or Bike Campsite: designated area with a tent space, table, fire ring or stove, with water and toilet facilities
nearby243 1,811
7 Floating Campsite: tent space, table, stove and toilet facilities located on a floating platform, accessible only by boat 13 156
8Dock Berths or Off-shore Mooring Buoys: please indicate the number of boats that can be accommodated; the
vessels can be self-contained or the overnight usage may be on a site on-shore1,236 3,808
14,207 206,162
B. Group Camp SitesNumber of
Sites
Visitor
Capacity: # of
people
9Tent or RV use - primitive or developed: an area with space for many tents or RVs, providing tables, stoves or fire rings,
access to water and toilet facilities; often used by reservation only247 10,391
10Horse Camps - primitive or developed: a group area reserved only or mainly for the use of horse groups, providing
facilities needed for managing the horses; often used by reservation only77 1,143
324 11,534
C. Overflow Camping AreasNumber of
Sites
Visitor
Capacity: # of
people
11Enroute/Wayside Camping: overnight, self-contained RV occupancy of day-use or other paved areas, limited and
specified sites, single-night only; day-use tables and sanitation facilities available367 3,082
12Open, Casual Areas: unmarked portions of open fields, dirt or gravel areas where tents and RVs may be used
sometimes; support facilities may be limited5,255 330,731
5,622 333,813
2009-10 Survey
Responses
2009-10 Survey
Responses
STATE PARK SYSTEM: 2009-2010 FACILITY SURVEY SUMMARY
2009-10 Survey
Responses
60 Statistical Report - FY 2009/10

D. Overnight (non-camping) Facilities - StructuresNumber of
Sites
Visitor
Capacity: # of
people
13Tent Cabins/Shelters: semi-permanent tent on raised wood platform or three-sided shelter with roof, with a supporting
table, cooking and restroom facilities60 392
14Rustic Cabins: enclosed building with appropriate facilities, some of which (restrooms) may be located outside of the
building139 774
15 Yurts: shelter with appropriate facilities, some of which (restrooms) may be located outside the structure 0 0
16Bark Houses: Native American-type shelter with appropriate facilities, some of which (restrooms) may be located outside
the structure7 42
17Modern Lodge/Motel/Detached Cabins: with rooms, usually for two occupants, with heating, electricity, hot and cold
running water and restrooms; may be operated by concessionaires446 1,561
652 2,769
II. Day-Use Facilities
A. Picnic FacilitiesNumber of
Sites
Visitor
Capacity: # of
people
18Family Picnic Sites: a small area with a table, stove or fire rings, with nearby parking, water and restrooms (sometimes
used by groups but intended for individuals or families)7,245 64,554
19Group Picnic Sites: a large area with a number of tables, stoves or fire rings, with nearby parking, water and restroom
facilities, often arranged for group use and often used by reservation only243 18,082
7,488 82,636
III. Trail Use Facilities (on DPR lands only)
Number of
Trails
Total Miles of
Trail
20 Multiple Use Trails: pathways/trails designated for all three user types: pedestrian, horse and bicycle 494 1,365
21 Equestrian/Pedestrian: pathways/trails where designated use excludes bicycles 293 751
22 Bicycle/Pedestrian: pathways/trails where designated use excludes horses. 182 362
23 Pedestrian only: pathways/trails where designated use excludes horses and bicycles. 776 916
24 Primitive/Administrative Roads Used as Trails: dirt/gravel routes maintained as a road but designated for trail use. 557 1,701
2,302 5,095.33
2009-10 Survey
Responses
STATE PARK SYSTEM: 2009-2010 FACILITY SURVEY SUMMARYContinued
2009-10 Survey
Responses
2009-10 Survey
Responses
Statistical Report - FY 2009/10 61

62 Statistical Report - FY 2009/10
APPENDIX C - INTERNAL UNITS, MINOR SYSTEM PROPERTIES
Internal Units As indicated in Chapter 2, during the 2009/10 fiscal year, the State Park System consists of 260 classified units and 18 major unclassified properties, for a total of 278 units and properties. Not included in these figures are three kinds of classified units, Cultural Preserves, Natural Preserves and State Wildernesses. These units, informally termed “internal units”, are portions of or lands internal to one of the System’s basic 260 classified units. The purpose of creating such units is to provide a higher level of protection to the resources than would be required by the classification of the “parent unit”, the unit in which it is located. Internal classified units are not listed in the table in Chapter 3. They appear in List 3 of each annual edition of California State Parks’ Planning Milestones publication. There were 87 internal units in the State Park System on July 1, 2009 protecting 500,046 acres within 55 parent units. Since internal units are operated as an integral part of the parent unit in which they are located, there is little data available which applies to internal units alone, other than for their classification date, county of location and acreage. There is no information available for internal units in other data categories such as public use facilities, visitor attendance, operating costs, staffing, and the like. Any information of this type which is relevant to an internal unit would be included as part of that type of information which is relevant to the parent unit as a whole. Table C-1, following, provides the available data for internal units. Minor System Properties In addition to the State Park System’s 278 classified units and major unclassified properties, there are a handful of minor, frequently very small properties, which are managed by the State Park System. Not being part of the standard Department, they are not listed in the table in Chapter 3. They are usually managed by the headquarters office of the State Park System district in which they are located. Table C-2, below, provides the basic information on these properties.
Statistical Report - FY 2009/10 63

64 Statistical Report - FY 2009/10
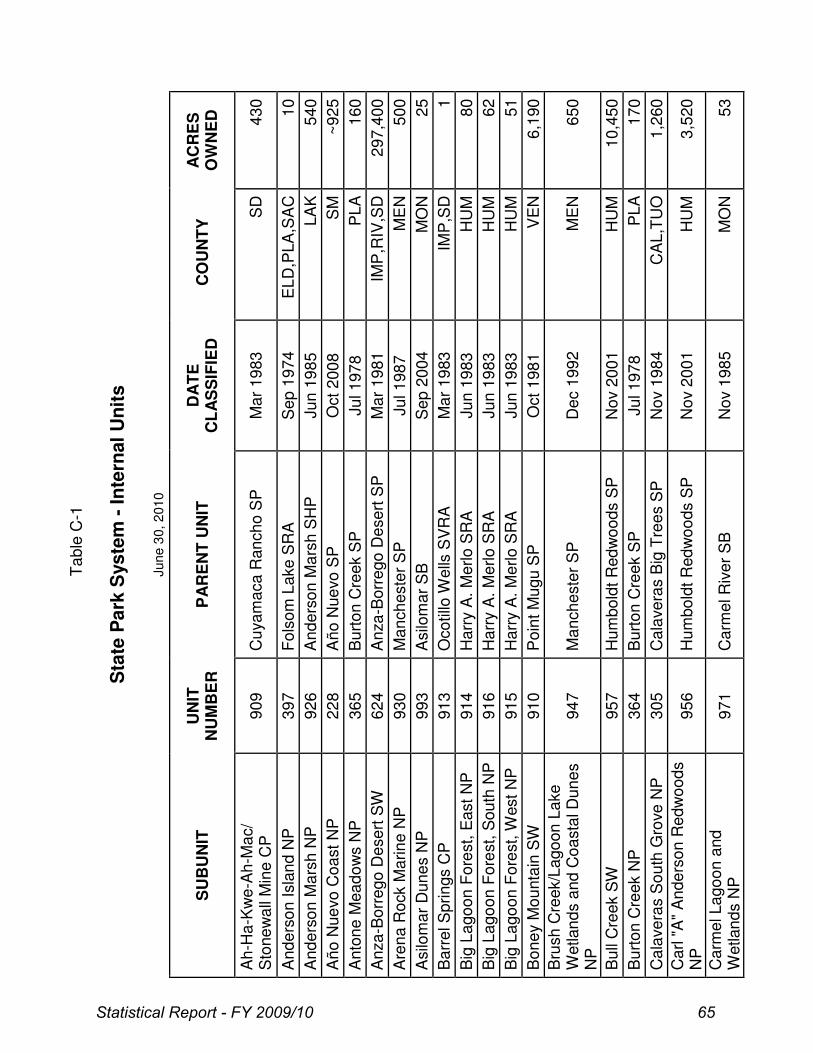
T
ab
le C
-1 –
Sta
te P
ark
Sys
tem
– I
nte
rna
l U
nits
Sta
te P
ark
Syste
m -
In
tern
al
Un
its
June 3
0, 2
010
SU
BU
NIT
U
NIT
N
UM
BE
R
PA
RE
NT
UN
IT
DA
TE
C
LA
SS
IFIE
D
CO
UN
TY
A
CR
ES
O
WN
ED
Ah
-Ha
-Kw
e-A
h-M
ac/
Sto
ne
wa
ll M
ine
CP
9
09
Cu
yam
aca
Ran
ch
o S
P
Ma
r 1
983
SD
4
30
An
de
rso
n I
sla
nd
NP
3
97
Fo
lso
m L
ake S
RA
S
ep
19
74
EL
D,P
LA
,SA
C
10
An
de
rso
n M
ars
h N
P
92
6
An
de
rso
n M
ars
h S
HP
Ju
n 1
98
5
LA
K
54
0
Añ
o N
ue
vo C
oa
st
NP
2
28
Añ
o N
ue
vo S
P
Oct
200
8
SM
~
92
5
An
ton
e M
ea
do
ws N
P
36
5
Bu
rto
n C
ree
k S
P
Ju
l 1
97
8
PL
A
16
0
An
za-B
orr
ego
De
se
rt S
W
62
4
An
za-B
orr
ego
De
se
rt S
P
Ma
r 1
981
IMP
,RIV
,SD
2
97
,40
0
Are
na
Ro
ck M
arin
e N
P
93
0
Ma
nch
este
r S
P
Ju
l 1
98
7
ME
N
50
0
Asilo
ma
r D
un
es N
P
99
3
Asilo
ma
r S
B
Se
p 2
004
MO
N
25
Ba
rre
l S
prin
gs C
P
91
3
Oco
tillo
Wells
SV
RA
M
ar
19
83
IMP
,SD
1
Big
La
go
on
Fo
rest,
East
NP
9
14
Ha
rry
A.
Me
rlo
SR
A
Ju
n 1
98
3
HU
M
80
Big
La
go
on
Fo
rest,
Sou
th N
P
91
6
Ha
rry
A.
Me
rlo
SR
A
Ju
n 1
98
3
HU
M
62
Big
La
go
on
Fo
rest,
West
NP
9
15
Ha
rry
A.
Me
rlo
SR
A
Ju
n 1
98
3
HU
M
51
Bo
ne
y M
ou
nta
in S
W
91
0
Po
int
Mu
gu
SP
O
ct
198
1
VE
N
6,1
90
Bru
sh
Cre
ek/L
ago
on
La
ke
W
etla
nd
s a
nd C
oa
sta
l Du
ne
s
NP
9
47
Ma
nch
este
r S
P
De
c 1
99
2
ME
N
65
0
Bu
ll C
ree
k S
W
95
7
Hu
mbo
ldt
Red
wo
od
s S
P
No
v 2
00
1
HU
M
10
,45
0
Bu
rto
n C
ree
k N
P
36
4
Bu
rto
n C
ree
k S
P
Ju
l 1
97
8
PL
A
17
0
Ca
lave
ras S
ou
th G
rove
NP
3
05
Ca
lave
ras B
ig T
ree
s S
P
No
v 1
98
4
CA
L,T
UO
1
,260
Ca
rl "
A"
An
de
rso
n R
edw
oo
ds
NP
9
56
Hu
mbo
ldt
Red
wo
od
s S
P
No
v 2
00
1
HU
M
3,5
20
Ca
rme
l La
go
on
and
W
etla
nd
s N
P
97
1
Ca
rme
l R
ive
r S
B
No
v 1
98
5
MO
N
53
Statistical Report - FY 2009/10 65
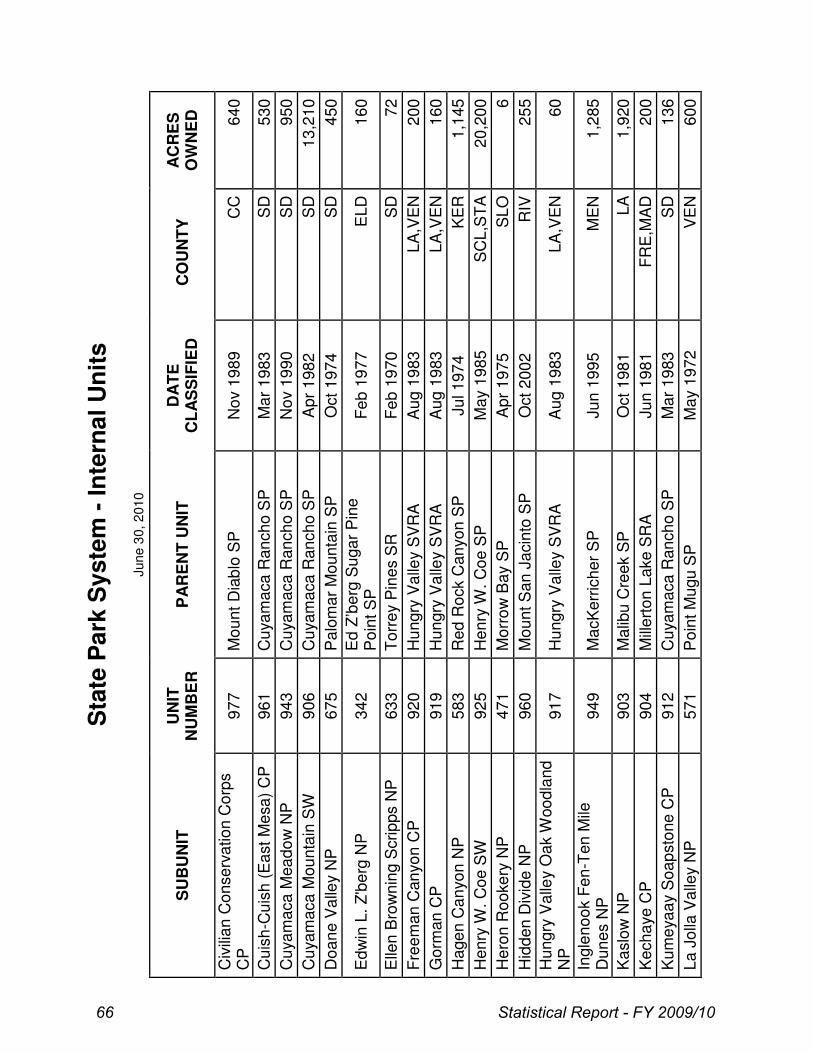
Sta
te P
ark
Syste
m -
In
tern
al
Un
its
June 3
0, 2
010
SU
BU
NIT
U
NIT
N
UM
BE
R
PA
RE
NT
UN
IT
DA
TE
C
LA
SS
IFIE
D
CO
UN
TY
A
CR
ES
O
WN
ED
Civ
ilia
n C
on
se
rva
tio
n C
orp
s
CP
9
77
Mo
un
t D
iab
lo S
P
No
v 1
98
9
CC
6
40
Cu
ish
-Cu
ish
(E
ast
Me
sa)
CP
9
61
Cu
yam
aca
Ran
ch
o S
P
Ma
r 1
983
SD
5
30
Cu
yam
aca
Mea
do
w N
P
94
3
Cu
yam
aca
Ran
ch
o S
P
No
v 1
99
0
SD
9
50
Cu
yam
aca
Mou
nta
in S
W
90
6
Cu
yam
aca
Ran
ch
o S
P
Ap
r 1
98
2
SD
1
3,2
10
Do
an
e V
alle
y N
P
67
5
Pa
lom
ar
Mo
un
tain
SP
O
ct
197
4
SD
4
50
Ed
win
L.
Z'b
erg
NP
3
42
Ed
Z’b
erg
Su
ga
r P
ine
P
oin
t S
P
Fe
b 1
97
7
EL
D
16
0
Elle
n B
row
nin
g S
crip
ps N
P
63
3
To
rre
y P
ine
s S
R
Fe
b 1
97
0
SD
7
2
Fre
em
an
Can
yon
CP
9
20
Hu
ngry
Va
lley
SV
RA
A
ug 1
983
LA
,VE
N
20
0
Go
rman
CP
9
19
Hu
ngry
Va
lley
SV
RA
A
ug 1
983
LA
,VE
N
16
0
Ha
ge
n C
an
yon
NP
5
83
Re
d R
ock C
an
yon
SP
Ju
l 1
97
4
KE
R
1,1
45
He
nry
W.
Co
e S
W
92
5
He
nry
W.
Co
e S
P
Ma
y 1
98
5
SC
L,S
TA
2
0,2
00
He
ron
Ro
oke
ry N
P
47
1
Mo
rro
w B
ay
SP
A
pr
197
5
SL
O
6
Hid
de
n D
ivid
e N
P
96
0
Mo
un
t S
an J
acin
to S
P
Oct
200
2
RIV
2
55
Hu
ngry
Va
lley
Oa
k W
oo
dla
nd
N
P
91
7
Hu
ngry
Va
lley
SV
RA
A
ug 1
983
LA
,VE
N
60
Ingle
no
ok F
en
-Ten
Mile
D
un
es N
P
94
9
Ma
cK
err
ich
er
SP
Ju
n 1
99
5
ME
N
1,2
85
Ka
slo
w N
P
90
3
Ma
libu
Cre
ek S
P
Oct
198
1
LA
1
,920
Ke
ch
aye
CP
9
04
Mill
ert
on
La
ke S
RA
Ju
n 1
98
1
FR
E,M
AD
2
00
Ku
me
yaa
y S
oa
psto
ne
CP
9
12
Cu
yam
aca
Ran
ch
o S
P
Ma
r 1
983
SD
1
36
La
Jo
lla V
alle
y N
P
57
1
Po
int
Mu
gu
SP
M
ay
19
72
VE
N
60
0
66 Statistical Report - FY 2009/10

Sta
te P
ark
Syste
m -
In
tern
al
Un
its
June 3
0, 2
010
SU
BU
NIT
U
NIT
N
UM
BE
R
PA
RE
NT
UN
IT
DA
TE
C
LA
SS
IFIE
D
CO
UN
TY
A
CR
ES
O
WN
ED
La
ke
Da
vis W
etla
nd
s a
nd
C
oa
sta
l D
un
es N
P
94
8
Ma
nch
este
r S
P
De
c 1
99
2
ME
N
43
5
Le
ast T
ern
NP
9
88
Hu
ntin
gto
n S
B
Ju
l 1
97
5
OR
A
5
Lib
ert
y C
an
yon
NP
9
02
Ma
libu
Cre
ek S
P
Oct
198
1
LA
8
10
Lo
s P
en
asqu
itos M
ars
h N
P
64
0
To
rre
y P
ine
s S
R
Fe
b 1
97
0
SD
2
18
Ma
rin
a D
un
es
NP
9
32
Ma
rin
a S
B
Au
g 1
987
MO
N
11
1
Mitch
ell
Ca
vern
s N
P
63
1
Pro
vid
en
ce
Mo
un
tain
s S
RA
S
ep
19
63
SB
D
62
8
Mo
na
rch
Bu
tte
rfly
NP
9
24
Na
tura
l B
rid
ge
s S
B
Ma
y 1
98
4
SC
R
16
Mo
ore
Cre
ek W
etla
nd N
P
93
7
Na
tura
l B
rid
ge
s S
B
Oct
198
8
SC
R
14
Mo
rmo
n Isla
nd
Wetland
s N
P
94
6
Fo
lso
m L
ake S
RA
Ju
n 1
99
2
EL
D,P
LA
,SA
C
11
0
Mo
rro
Du
ne
s N
P
93
6
Mo
nta
na
de
Oro
SP
Ju
n 1
98
8
SL
O
90
0
Mo
rro
Estu
ary
NP
4
45
Mo
rro
Ba
y S
P
Ju
n 1
98
8
SL
O
42
0
Mo
rro
Ro
ck N
P
44
5
Mo
rro
Ba
y S
P
Se
p 1
969
SL
O
45
Mo
un
t S
an J
acin
to S
W
61
9
Mo
un
t S
an J
acin
to S
P
Ja
n 1
97
4
RIV
1
2,4
65
Mu
rre
let
SW
9
54
Pra
irie
Cre
ek R
ed
wo
od
s
SP
N
ov
19
99
DN
,HU
M
6,6
00
Nic
ho
las F
lat
NP
9
51
Le
o C
arr
illo
SP
O
ct
199
6
LA
,VE
N
60
0
Oh
lone
Co
asta
l C
P
92
9
Ca
rme
l R
ive
r S
B
Ju
n 1
98
7
MO
N
25
Pa
-nu
CP
9
42
Sa
n S
imeo
n S
P
Oct
199
0
SL
O
14
Pa
jaro
Riv
er
Mo
uth
NP
9
34
Zm
udo
wski S
B
Au
g 1
987
MO
N
73
Pe
sca
de
ro M
ars
h N
P
28
3
Pe
sca
de
ro S
B
No
v 1
97
4
SM
2
35
Pilc
ha
(W
est
Me
sa
) C
P
91
0
Cu
yam
aca
Ran
ch
o S
P
Ma
y 1
98
3
SD
1
,400
Pis
mo
Du
ne
s N
P
45
9
Pis
mo
SB
Ju
l 1
97
4
SL
O
40
0
Statistical Report - FY 2009/10 67

Sta
te P
ark
Syste
m -
In
tern
al
Un
its
June 3
0, 2
010
SU
BU
NIT
U
NIT
N
UM
BE
R
PA
RE
NT
UN
IT
DA
TE
C
LA
SS
IFIE
D
CO
UN
TY
A
CR
ES
O
WN
ED
Po
int
Dum
e N
P
99
1
Po
int
Dum
e S
B
Ma
r 1
992
VE
N
34
Po
int S
ur
Du
ne
s N
P
99
2
Po
int S
ur
SH
P
Se
p 2
004
MO
N
15
Qu
iro
ste
Va
lley
CP
2
32
Añ
o N
ue
vo S
P
Oct
200
8
SM
~
22
5
Re
d C
liffs
NP
5
85
Re
d R
ock C
an
yon
SP
Ju
l 1
97
4
KE
R
36
5
Re
dw
oo
d H
erita
ge
SW
9
55
Je
ded
iah
Sm
ith R
ed
wo
od
s
SP
N
ov
19
99
DN
5
,500
Sa
lina
s R
ive
r D
un
es N
P
93
1
Sa
lina
s R
ive
r S
B
Au
g 1
987
MO
N
10
5
Sa
lina
s R
ive
r M
ou
th N
P
93
3
Sa
lina
s R
ive
r S
B
Au
g 1
987
MO
N
72
Sa
n L
ore
nzo
Hea
dw
ate
rs N
P
95
3
Ca
stle
Ro
ck S
P
Ma
r 2
000
SC
L,S
CR
,SM
3
65
Sa
n S
imeo
n N
P
94
1
Sa
n S
imeo
n S
P
Oct
199
0
SL
O
36
5
Sa
nta
Cla
ra E
stu
ary
NP
5
68
McG
rath
SB
Ju
l 1
97
9
VE
N
16
0
Sa
nta
Ro
sa C
ree
k N
P
94
0
Sa
n S
imeo
n S
P
Oct
199
0
SL
O
40
Sa
nta
Ro
sa M
ou
nta
ins
SW
6
27
An
za-B
orr
ego
De
se
rt S
P
Fe
b 1
97
4
IMP
,RIV
,SD
8
7,0
00
Silv
er
Str
an
d N
P
92
1
Silv
er
Str
an
d S
B
No
v 1
98
3
SD
2
6
Sin
kyo
ne
SW
1
33
Sin
kyo
ne
Wild
ern
ess S
P
No
v 2
00
6
ME
N
7,1
00
So
uth
am
pto
n B
ay
Wetla
nd
N
P
94
4
Be
nic
ia S
RA
Ju
n 1
99
1
SO
L
21
0
Su
nset W
etlan
ds N
P
93
9
Su
nset
SB
M
ay
19
90
SC
R
40
Tata
via
m C
P
91
8
Hu
ngry
Va
lley
SV
RA
A
ug 1
983
LA
,VE
N
45
0
The
odo
re J
. H
oo
ver
NP
9
05
Big
Ba
sin
Re
dw
oo
ds S
P
Ja
n 1
98
2
SC
R,S
M
23
Tiju
an
a E
stu
ary
NP
9
28
Bo
rde
r F
ield
SP
Ja
n 1
98
7
SD
3
27
Tre
stle
s W
etla
nd
s N
P
95
3
Sa
n O
nofr
e S
B
Ap
r 1
98
4
SD
8
2
Ud
ell
Go
rge
NP
9
07
Ma
libu
Cre
ek S
P
Ju
n 1
98
2
LA
2
87
68 Statistical Report - FY 2009/10

Sta
te P
ark
Syste
m -
In
tern
al
Un
its
June 3
0, 2
010
SU
BU
NIT
U
NIT
N
UM
BE
R
PA
RE
NT
UN
IT
DA
TE
C
LA
SS
IFIE
D
CO
UN
TY
A
CR
ES
O
WN
ED
Va
n D
am
me
Pyg
my
Fo
rest
NP
9
82
Va
n D
am
me
SP
Ju
n 1
99
5
ME
N
20
0
Wate
r C
an
yon
NP
9
84
Ch
ino
Hill
s S
P
Fe
b 1
99
9
OR
A,
RIV
, S
BD
1
,425
We-n
els
ch C
P
A
nza
-Bo
rre
go
De
se
rt S
P
Fe
b 2
00
5
SD
4
43
West
Wadde
ll C
ree
k S
W
90
8
Big
Ba
sin
Re
dw
oo
ds S
P
No
v 1
98
2
SC
R,S
M
5,8
10
Wild
er
Be
ach
NP
4
66
Wild
er
Ra
nch
SP
M
ay
19
80
SC
R
67
Wild
er
Da
iry
CP
4
64
Wild
er
Ra
nch
SP
M
ay
19
80
SC
R
20
Woodson
Brid
ge
NP
1
22
Woodson
Brid
ge
SR
A
Se
p 1
974
TE
H
26
0
Statistical Report - FY 2009/10 69

70 Statistical Report - FY 2009/10
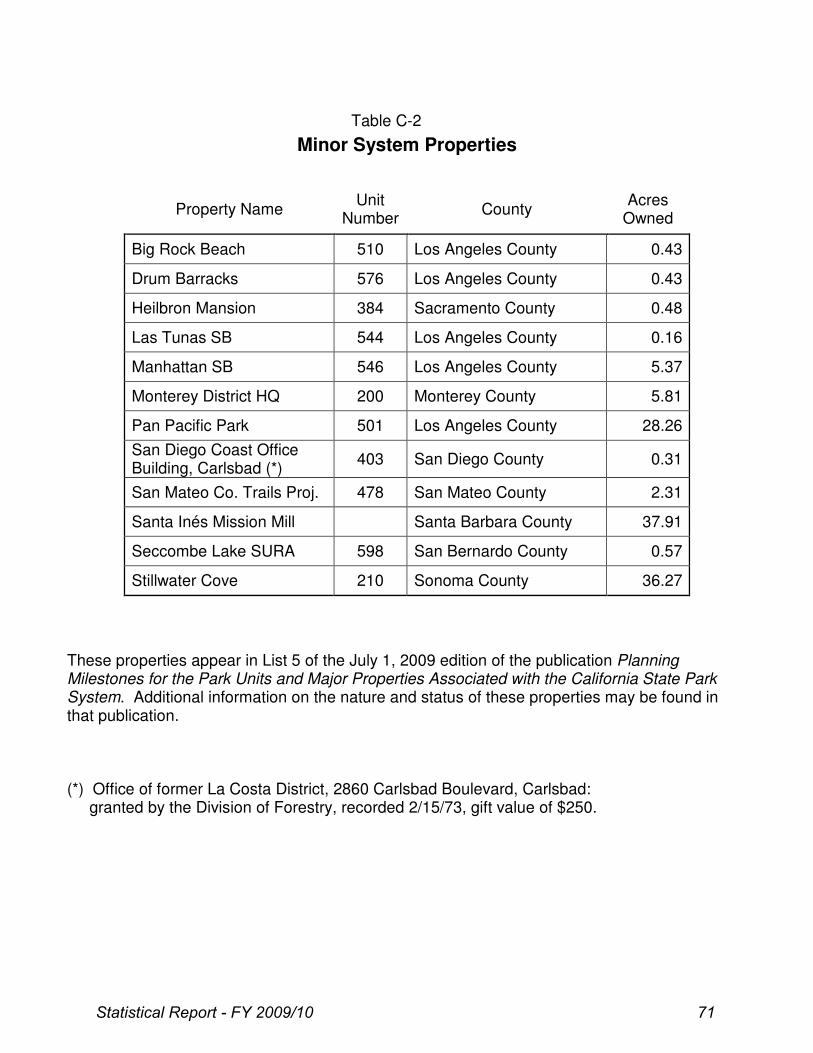
Table C-2 – Minor System Properties
Minor System Properties
Property Name Unit
Number County
Acres Owned
Big Rock Beach 510 Los Angeles County 0.43
Drum Barracks 576 Los Angeles County 0.43
Heilbron Mansion 384 Sacramento County 0.48
Las Tunas SB 544 Los Angeles County 0.16
Manhattan SB 546 Los Angeles County 5.37
Monterey District HQ 200 Monterey County 5.81
Pan Pacific Park 501 Los Angeles County 28.26
San Diego Coast Office Building, Carlsbad (*)
403 San Diego County 0.31
San Mateo Co. Trails Proj. 478 San Mateo County 2.31
Santa Inés Mission Mill Santa Barbara County 37.91
Seccombe Lake SURA 598 San Bernardo County 0.57
Stillwater Cove 210 Sonoma County 36.27
These properties appear in List 5 of the July 1, 2009 edition of the publication Planning Milestones for the Park Units and Major Properties Associated with the California State Park System. Additional information on the nature and status of these properties may be found in that publication. (*) Office of former La Costa District, 2860 Carlsbad Boulevard, Carlsbad: granted by the Division of Forestry, recorded 2/15/73, gift value of $250.
Statistical Report - FY 2009/10 71

72 Statistical Report - FY 2009/10

APPENDIX D - DEPARTMENT ORGANIZATION CHART The following page shows an organization chart for California State Parks that was still current as of June 30, 2010.
Statistical Report - FY 2009/10 73

74 Statistical Report - FY 2009/10
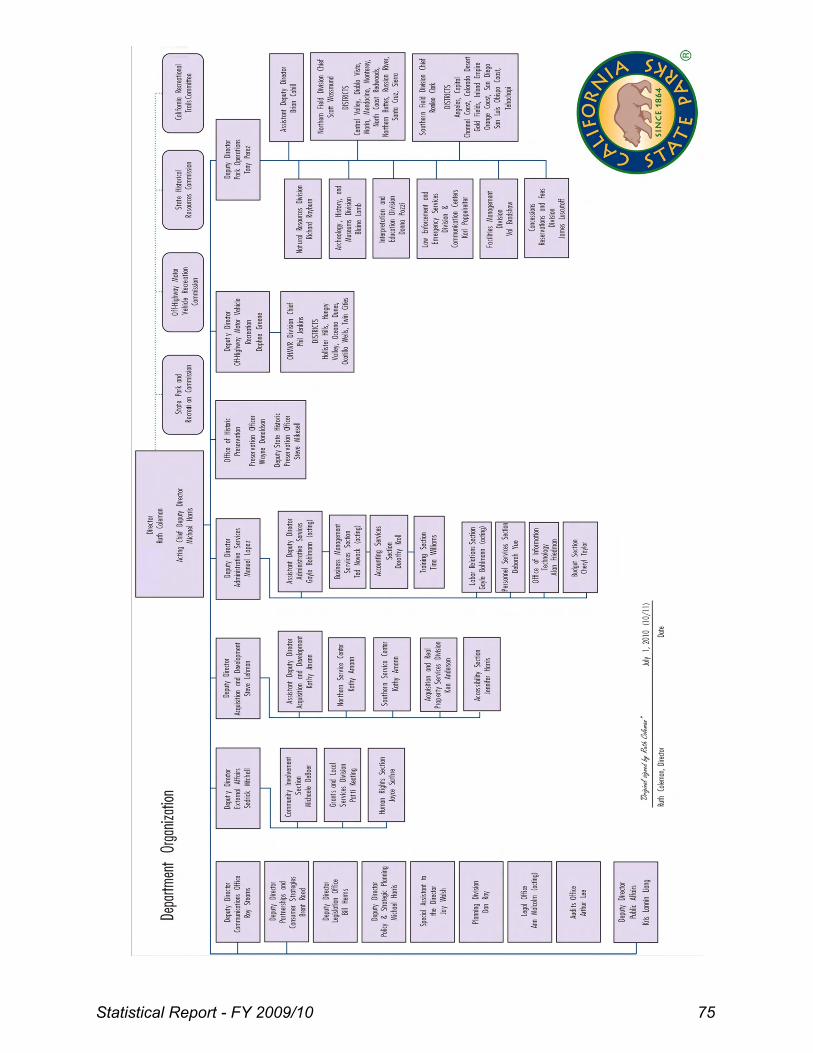
Statistical Report - FY 2009/10 75

76 Statistical Report - FY 2009/10

APPENDIX E - OTHER SOURCES OF PARK SYSTEM DATA Chapter 5 identified departmental sources that continually generate data and information about many of the field activities and operations that take place in the State Park System. In addition, there exist other sources – libraries, depositories and archives – which house collections of published materials which may contain relevant information. These sources emphasize past, historic data. The most important ones are listed below.
A. California State Parks
Archives - California State Parks’ Archives collects, organize, preserves, and makes accessible documents with long-term or permanent value. A variety of California State Parks’ statistical reports, resource surveys, planning studies, interpretive reports, acquisition files, leases and deeds are located in the Archives, which also houses California State Parks’ Cultural Heritage Library. This library contains a wide variety of books and other publications, of both a scholarly and general nature, published by sources outside of California State Parks. Contact: Elizabeth Raspino-Leber, Archaeology, History, and Museums Division, California State Parks, (916) 653-9921, [email protected] . Central Records Office - This office is responsible for the systematic control of the creation, maintenance, use, and disposition of all departmental records relevant to California State Parks’ decision-making and activities. Records include documentary materials, books, electronic data, maps, moving images, papers, photographs, sound recordings, made or received by California State Parks in the transaction of public business. This activity is in response to the State Records Management Act. • Ted Holm, Records Management Analyst II (Specialist), Central Records Office,
Administrative Services Division, California State Parks (916) 445-9017; [email protected]
Internal Departmental “Libraries” - Certain of California State Parks’ organizational components house reference libraries and collections containing materials of value to the performance of their function. Information on various aspects of the State Park System may be sought from these sources, which are located as follows: • Archaeology, History and Museums Division • Interpretation and Education Division • Natural Resources Division • Northern Service Center • Planning Division
Statistical Report - FY 2009/10 77

B. Other Sources
California State Library (Sacramento) – This library’s Government Publications Section contains a vast collection of reports, surveys, special studies and yearbooks containing information on the full range of California’s agencies, departments, bureaus and boards. • Contact: Reference Desk, Government Publications Section, California State Library, 914
Capitol Mall, MS E-29, P.O. Box 942837, Sacramento, CA 94237-0001; 916-654-0069; 916-653-6114 (fax); email: [email protected]. Hours of operation: 9:30 AM-4 PM, Monday-Friday.
National Association of State Park Directors – Annual Information Exchange series. – Starting with fiscal year 1979, this organization has produced an annual statistical report which encompasses all of the nation’s state park systems. Each lengthy report contains many data series, including acreage, facilities, attendance, and information on each system’s fiscal and personnel matters. In some categories, this Department’s definitions (and thus its data) must be altered to fit the needs of the NASPD publication. • Contact: NASPD, 8829 Woodyhill Road, Raleigh, NC 27613; (919) 676-8365
http://www.naspd.org
78 Statistical Report - FY 2009/10

PUBLICATION CREDITS
The following staff members contributed to the development and publication of the California State Park System Statistical Report: 2009/10 Fiscal Year. Creation of the Basic Document
• Barry R. Trute, Associate Park and Recreation Specialist, Planning Division Editors
• Alexandra Stehl, Associate Park and Recreation Specialist, Planning Division • Philomene C. Smith, Staff Park and Recreation Specialist, Planning Division
Providers of Data, Information and Other Valuable Assistance
• Sharon Dennis, Associate Governmental Program Analyst, Business Management Services Section
• Debra Elam, Business Service Assistant (Specialist), Park Operations • Balenda Gray, Associate Governmental Program Analyst, Facilities Support Division • James Low III, Staff Services Manager I, Concessions, Reservations & Fees Division • Wendy Nodohara, Research Analyst II (Economics), Budget Section, Administrative
Services Division • Kim Snyder, Associate Governmental Program Analyst, Acquisition and Real Property
Services Division • Mary Veliquette, Staff Services Manager I (Supervisory), Facilities Support Division • Cathy Mundy, Accounting Administrator I (Specialist), Accounting Services Section
Contributions from Individuals Outside of California State Parks:
• Bruce Kennedy, retired from Department – original text • Jim Maddox, retired from Department - back cover drawing • Dale Wilson, retired from Department - historic postmarks • Phil Carey, retired from Department – front cover and chapter separations
Statistical Report - FY 2009/10 79

80 Statistical Report - FY 2009/10

NOTES


