

7/26/2019 09 Resource Guide3
http://slidepdf.com/reader/full/09-resource-guide3 1/36
UNFCCC
RESOURCE GUIDE
MODULE 3: NATIONAL GREENHOUSE GAS INVENTORIES
FOR PREPARING THE
NATIONAL COMMUNICATIONS
OF NON-ANNEX I PARTIES
MODULE 3NATIONAL GREENHOUSE GAS
INVENTORIES
United Nations Framework Convention on Climate Change

7/26/2019 09 Resource Guide3
http://slidepdf.com/reader/full/09-resource-guide3 2/36

7/26/2019 09 Resource Guide3
http://slidepdf.com/reader/full/09-resource-guide3 3/36
RESOURCE GUIDE FOR PREPARING
THE NATIONAL COMMUNICATIONS OF
NON-ANNEX I PARTIES
MODULE 3:
NATIONAL GREENHOUSE GAS INVENTORIES
UNFCCC
United Nations Framework Convention on Climate Change

7/26/2019 09 Resource Guide3
http://slidepdf.com/reader/full/09-resource-guide3 4/36

7/26/2019 09 Resource Guide3
http://slidepdf.com/reader/full/09-resource-guide3 5/36
3
UNFCCC RESOURCE GUIDE
MODULE 3: NATIONAL GREENHOUSE GAS INVENTORIES
I. INTRODUCTION 4
1.1 Greenhouse Gases and Climate Change 4
1.2 About the Module 4
1.3 Main sources of related information 4
II. WHAT IS A NATIONAL GREENHOUSE GAS INVENTORY? 5
III. THE INVENTORY PROCESS 7
3.1 Planning 7
3.2 Preparation 9
3.3 Reporting 11
3.4 Documentation and Archiving 11
3.5 Inventory Improvement Strategy 11
IV. SECTOR-SPECIFIC METHODOLOGIES 12
4.1 Energy 12
4.2 Industrial Processes 20
4.3 Agriculture 22
4.4 Land Use, Land-Use Change and Forestry 24
4.5 Waste 26
V. QUALITY CONTROL AND COMPLETENESS 28
VI. UNCERTAINTY 29
VII. NATIONAL COMMUNICATIONS OF NON-ANNEX I PARTIES 30
7.1 UNFCCC Guidelines for non-Annex I National Communications and User Manual 30
7.2 Financial and Technical Assistance 30
VIII. UNFCCC NON-ANNEX I GREENHOUSE GAS INVENTORY SOFTWARE 31
TABLE OF CONTENTS
7/26/2019 09 Resource Guide3
http://slidepdf.com/reader/full/09-resource-guide3 6/36
4
UNFCCC RESOURCE GUIDE
MODULE 3: NATIONAL GREENHOUSE GAS INVENTORIES
1.1 GREENHOUSE GASES AND CLIMATE CHANGE
The UNFCCC defines climate change as a change of
climate that is attributed directly or indirectly to
human activity that alters the composition of the global
atmosphere and which is in addition to natural climate
variability observed over comparable time periods. Human
activities are changing the atmospheric concentrations
and distributions of greenhouse gases (GHGs) and aerosols
(i.e. airborne solid or liquid particles). These changes can
cause radiative forcing by changing the reflection or
absorption of solar radiation, or the absorption or emission
of terrestrial radiation (IPCC 1996). The objective of a
national GHG inventory is to determine the magnitude of
national GHG emissions and removals that are directly
attributable to human activity.
As required by decision 17/CP.8, each Party not included
in Annex I to the Convention (Non-Annex I Party) shall,
as appropriate and to the extent possible, provide in itsnational inventory, on a gas-by-gas basis and in units
of mass, estimates of anthropogenic emissions of carbon
dioxide (CO2), methane (CH4) and nitrous oxide (N2O)
by sources and removals by sinks. Non-Annex I Parties are
encouraged, as appropriate, to provide information on
anthropogenic emissions by sources of hydrofluorocarbons
(HFCs), perfluorocarbons (PFCs) and sulphur hexafluoride (SF6).
I. INTRODUCTION
1Available at <http://unfccc.int/essential_background/background_publications_htmlpdf/items/2625.php>.
2Available at <http://unfccc.int/national_reports/non-annex_i_natcom/guidelines_and_user_manual/items/2607.php>.
3Available at <http://www.ipcc-nggip.iges.or.jp/public/gl/invs1.html>.
4Available at <http://ncsp.undp.org/docs/461.pdf>.
5Available at <http://unfccc.int/resource/cd_roms/na1/start.htm>.
1.2 ABOUT THE MODULE
This module was developed as a guide to assist non-Annex I
Parties in the preparation of the GHG inventories for
their national communications. It forms part of the Resource
Guide for Preparing the National Communications of
Non-Annex I Parties (hereinafter referred to as the Resource
Guide).1 It aims to provide a brief overview of some
of the main methods, tools and data being used by non-
Annex I Parties to prepare their national GHG inventory.
After reading this module, readers should be able
to understand a number of key issues related to GHG
inventories, including sector-specific emission estimation
considerations.
1.3 MAIN SOURCES OF RELATED INFORMATION
Main sources of information used throughout the module
are listed below. Further sources are also provided where
relevant, within each section.
• Reporting on Climate Change: User Manual for
the Guidelines on National Communication from
Non-Annex I Parties 2
• Intergovernmental Panel on Climate Change (IPCC)
Methodologies for National GHG Inventories 3
• Managing the National Greenhouse Gas Inventory
Process: National Communications Support Unit Handbook ; 4
• Materials for the hands-on training workshops
of the Consultative Group of Experts on national
communications from Parties not included in
Annex I to the Convention (CGE) (hereinafter
referred to as the CGE GHG Inventory Handbook).5
7/26/2019 09 Resource Guide3
http://slidepdf.com/reader/full/09-resource-guide3 7/36
5
UNFCCC RESOURCE GUIDE
MODULE 3: NATIONAL GREENHOUSE GAS INVENTORIES
6Available at <http://www.ipcc-nggip.iges.or.jp/public/gp/english/>.
A national GHG inventory is a key element of the national
communication. In the context of the UNFCCC, it is a
comprehensive listing, by source, of annual GHG emissions
and removals resulting directly from human activities.
An inventory may estimate emissions and removals for one
year or a number of years. A GHG inventory could contain
the following information:
• Tables of annual emission and removal estimates by
source, with estimates expressed in units of mass per
year, and the year or years represented clearly noted;
• Worksheets (i.e. calculation sheets) showing how
emissions are calculated, including all parameters
used for calculations;
• For each source, a description of the methodology,
the sources of data (e.g. activity data, emission
factors (EFs), methodologies), the actual data and a
description of uncertainties, including, if possible,
quantitative assessment of uncertainties; and
• Other informative background data (e.g. a nationalenergy balance, a description of GHG sources
that are believed to be important but cannot be
estimated).
The IPCC inventory guidance applicable to non-Annex I
Parties (IPCC Guidelines: 1997, 2000 and 2003) defines
six inventory sectors: Energy; Industrial Processes; Solvent
and Other Product Use; Agriculture; Land Use, Land-Use
Change and Forestry (LULUCF); and Waste. Nonetheless, no
method for the calculation of GHGs from solvent and other
product use is available. Within these sectors, individual
source and sinks categories are defined. Parties to the
UNFCCC are required to report their inventories in line
with the definitions and structure of these sectors, and
the source and sink categories within each sector, so that
reporting is comparable across Parties. Updated guidance
for the development of national GHG inventories can be
found in the 2006 IPCC Guidelines for National Greenhouse
Gas Inventories (hereinafter referred to as the 2006 IPCC
Guidelines), although these are not yet adopted for use by
Parties to the UNFCCC.
II. WHAT IS A NATIONAL
GREENHOUSE GAS
INVENTORY?
In order to ensure precision and reliability, national GHG
inventories are required to fulfil certain criteria, as
laid out in the IPCC Good Practice Guidance and Uncertainty
Management in National Greenhouse Gas Inventories
(hereinafter referred to as the IPCC good practice
guidance).6 Thus, the inventories must be transparent,
consistent, comparable, complete and accurate (TCCCA).
In the context of the UNFCCC “Guidelines for the
preparation of national communications from Parties not
included in Annex I to the Convention” (hereinafter
referred to as the UNFCCC reporting guidelines for non-
Annex I Parties), and specifically the section addressing
national GHG inventories:
• Transparency means that the assumptions and
methodologies used for an inventory are clearly
explained to facilitate replication and assessment
of the inventory by users of the reported
information. The transparency of inventories is
fundamental to the success of the process for the
communication and consideration of information;
• Consistency means that an inventory is internally
consistent in all its elements with inventories of
other years. An inventory is consistent if the same
methodologies are used for the base and all
subsequent years and if consistent data sets are used
to estimate emissions or removals from sources
or sinks. Under certain circumstances, an inventory
using different methodologies for different yearscan be considered to be consistent if it has been
recalculated in a transparent manner, in accordance
with the IPCC good practice guidance;
• Comparability means that estimates of emissions and
removals reported by Parties in their inventories are
comparable;
• Completeness means that an inventory covers all
sources and sinks, as well as all gases, included in
the IPCC Guidelines, as well as other existing
relevant source/sink categories which are specific
to individual Parties and, therefore, may not be
included in the IPCC Guidelines. Completeness also
means full geographic coverage of sources and sinks
of a Party;

7/26/2019 09 Resource Guide3
http://slidepdf.com/reader/full/09-resource-guide3 8/36
WHAT IS A NATIONAL GREENHOUSE GAS INVENTORY?
6
UNFCCC RESOURCE GUIDE
MODULE 3: NATIONAL GREENHOUSE GAS INVENTORIES
• Accuracy is a relative measure of the exactness of an
emission or removal estimate. Estimates should
be accurate in the sense that they are systematically
neither over nor under true emissions or removals,
as far as can be judged, and that uncertainties are
reduced as far as practicable.
According to the IPCC good practice guidance, inventory
estimates should be the best attainable, given current
scientific knowledge and available resources. The IPCC
good practice guidance (i.e. 2000 and 2003) manuals
assist countries in meeting these requirements by providing
guidance on:
• Choice of estimation method;
• Quality assurance and quality control procedures to
provide cross-checks during inventory compilation;
• Data and information to be documented, reported and
archived to facilitate assessment of emission estimates;
• Quantification of uncertainties at the source level and
for the inventory as a whole, so that the resources
available for research can be directed toward reducing
uncertainties over time, and the improvement can
be tracked;
• Determination of the most significant sources so that
appropriate decisions can be made about the
allocation of resources for inventory improvements.

7/26/2019 09 Resource Guide3
http://slidepdf.com/reader/full/09-resource-guide3 9/36
7
UNFCCC RESOURCE GUIDE
MODULE 3: NATIONAL GREENHOUSE GAS INVENTORIES
7For more detailed information, see <http://ncsp.undp.org/docs/461.pdf>.
3.1 PLANNING
There are two components to the planning process:
• Planning the overall preparation of the inventory;
• Planning the preparation of individual source and
sink categories.
The outputs of the first component are an inventory
workplan and the overall inventory preparation
instructions. The output of the second component is
the source(s) preparation instructions.
Each component of planning includes a set of tasks: 7
III. THE INVENTORY
PROCESS
Figure III-1. Steps for planning of GHG inventory
Complete Overall Inventory Preparation Instructions and Distribute with Supporting Materials
Complete and Distribute Workplan
Prepare Budget
Establish Major Legal and/or Collaboration Arrangements
Establish Overall Inventory Preparation Schedule
Establish Rules of Procedure for Overall Inventory Preparation
Assign Other Inventory Personnel
Define Inventory Products and Plan Results Dissemination
Appoint "National Entity" and "Inventory Co-ordinator"

7/26/2019 09 Resource Guide3
http://slidepdf.com/reader/full/09-resource-guide3 10/36
THE INVENTORY PROCESS
8
UNFCCC RESOURCE GUIDE
MODULE 3: NATIONAL GREENHOUSE GAS INVENTORIES
Figure III-2. Source-Specific Planning Tasks
Complete Overall Inventory Preparation Instructions and Distribute with Supporting Materials
Establish Source(s) Preparation Schedule
Establish Rules of Procedures for Source Preparation
Asses Sources, Determine Priorities and and Assign Staff Responsibilities
Box III-1. Tasks in the Planning Phase 8
In general, inventory planning tasks will need to be completed
before the category-specific planning tasks can begin. However,
in cases where the inventory team is mature, i.e. the team has
completed several versions of the inventory; the category-specific
tasks may be started in parallel to with the overall inventory tasks.
Typically, the institution with the legal responsibility for producing
the inventory, which is referred to here as the “National Entity”,
will appoint an overall “Inventory Coordinator”, who oversees the
entire inventory. The Inventory Coordinator is responsible forplanning the overall preparation of the inventory (except the first
task) and, as the inventory is prepared, provides overall
coordination, management and technical oversight. In addition,
there are individual source(s) team leaders, each of whom is
responsible for inventory planning for his or her source(s), as well
as overseeing the inventory preparation for his or her source(s).
During planning, the schedule for completion of the inventory
and the procedures that are to be followed by category team
leaders are set, and the resource budget is established. In some
countries, category team leaders may have control over their
own separate budgets. Therefore, the overall planning, in effect,
drives the category-specific planning.
Completing both the inventory planning tasks and the category-
specific planning tasks requires an understanding of not only
how to administer a large and complex analytical process, but alsothe technical requirements of compiling a national GHG inventory.
Therefore, the Inventory Coordinator and the category team leaders
should possess both administrative and technical expertise.
In addition, they should confer with one another throughout the
planning process to ensure that the planning is internally
coordinated, complete and logical.

7/26/2019 09 Resource Guide3
http://slidepdf.com/reader/full/09-resource-guide3 11/36
9
THE INVENTORY PROCESSUNFCCC RESOURCE GUIDE
MODULE 3: NATIONAL GREENHOUSE GAS INVENTORIES
3.2 PREPARATION
3.2.1 EMISSIONS ESTIMATION
Once the inventory planning tasks have been performed
and data collection is under way, it is time to begin the
process of calculating emission estimations. In its most
basic form, the method commonly used to estimate
emissions or removals from a specific source category is
as follows: 9
In many cases, the activity data available are not exactly
what is required given the particular emission factors
that will be used. In these cases, the activity data must be
derived by applying “conversion factors” to other data,which are referred to here as “proxy activity data” . In this
case, the basic method is:
Figure III-3. Possible structure for GHG inventory team
Task group for
Energy Sector
Task group for
Land Use,
Land-Use Change,
and Forestry Sector
Task group for
Transport Sector
Task group for
Industrial
Processes Sector
Task group for
Agriculture Sector
Task group for
Waste Sector
Task group
leader
Task group
leader
Task group
leader
Task group
leader
Task group
leader
Task group
leader
Task group
leader
Task group
leader
Task group
leader
Task group
leader
Task group
leader
Task group
leader
Inventory Co-ordinator(should have both technical and administrative expertise,
in addition to governmental authority)
National Entity(Typically a government ministry, department, or agency)
Equation 1 – Emissions estimate
Emissions estimate = Activity data x Emission factor
where:
Activity data describe the annual, national magnitude of an activity
(e.g. tonnes of coal mined nationally in a given year); and the
Emission factor is the mass of GHG emitted per unit of activity
(e.g. Gg CH4 per tonne of coal mined).
Equation 2 – Emissions estimate using proxy activity data
Emissions estimate =
[Proxy activity data x Conversion Factor(s)] x Emission
8 Managing the National Greenhouse Gas Inventory Process, page 9,<http://ncsp.undp.org/docs/461.pdf>.
9Except in cases where emission estimates are based on direct measurement.

7/26/2019 09 Resource Guide3
http://slidepdf.com/reader/full/09-resource-guide3 12/36
THE INVENTORY PROCESS
10
UNFCCC RESOURCE GUIDE
MODULE 3: NATIONAL GREENHOUSE GAS INVENTORIES
3.2.2 TIERS
Different methods can be used to estimate emissions or
removals from most source and sink categories. The
selection of a particular method will depend on the desired
degree of estimation detail, the availability of activity
data and emission factors, and the financial and human
resources available to complete the inventory. In IPCC
terminology, the lowest ranking or simplest method is
“Tier 1”, while more elaborate methods are “Tier 2” and
“Tier 3.”
Tier 1 methods typically utilize IPCC default emission
factors and require the most basic, and least disaggregated,
activity data. Higher tiers usually utilize more elaborate
methods and source-specific, technology-specific, region-
specific and/or country-specific emission factors, which
are often based on measurements, and normally require
more highly disaggregated activity data. Tier 2 and 3
methods require more detailed data and/or measurements
for their application. In cases where a national
methodology exists, which is consistent with the IPCC
Guidelines, it is highly advisable to use the national
methodology. This methodology should be fully
documented in order to allow the reader to understand
why this particular method is better than the default
one proposed by the IPCC.
3.2.3 GHG PROFILES
A GHG profile is a summary of most representative GHG
data for a Party. It contains the following elements:
• Data table;
• Graph with trends for GHG totals;
• Graph with sectoral changes in GHG emissions;
• Graph with the GHG shares by gas;
• Graph with the GHG shares by sector;
• Graph with the GHG shares by category.
In order to allow the comparison of emissions between
different years of the inventory, the GHG profile must
be internally consistent; i.e. the methods, emission factors
and assumptions should be the same for all inventory
years. Ideally, the data sources used for activity data will
be the same for all years .
3.2.4 UNCERTAINTY ANALYSIS
Proper estimates of uncertainty associated with GHG
emission quantification are essential; not to dispute
estimations, but to improve future estimations and allow
for better comparison. The use of the IPCC good practice
guidance is encouraged by the UNFCCC reporting
guidelines for non-Annex I Parties in order to assess the
uncertainty related to their national GHG inventories.
The IPCC good practice guidance provides Parties with
two tiers for combining individual source category
uncertainties into an uncertainty estimate for the
inventory as a whole, and identifies the following three
sources of uncertainty:
• Uncertainties from definitions;
• Uncertainties from natural variability of the process
that produces an emission or uptake;
• Uncertainties resulting from the assessment of
the process or quantity, including, depending on
the method used:
a) Uncertainties from measuring;
b) Uncertainties from sampling;
c) Uncertainties from reference data that may be
incompletely described;
d) Uncertainties from expert judgement.
The IPCC good practice guidance provides extensive detail
on both identifying uncertainties which may be associatedwith a national GHG inventory, and methods for estimating
identified uncertainties for source categories, as well as the
complete inventory.
3.2.5 RECALCULATIONS
An inventory may be recalculated for different reasons.
Sometimes, improved methodologies, emission factors
and/or activity data become available; e.g. as a result of
new research or emission measurements. In addition,
earlier estimates are sometimes found to have been based
on wrong assumptions or miscalculations. If improved
methods or emission factors are used, they should be used
to recalculate the entire inventory time series. To avoid
confusion, it is important to report and document
recalculations clearly, including when recalculations were
performed and which methods, emission factors and
activity data were used in the different versions of the
inventory.

7/26/2019 09 Resource Guide3
http://slidepdf.com/reader/full/09-resource-guide3 13/36
11
THE INVENTORY PROCESSUNFCCC RESOURCE GUIDE
MODULE 3: NATIONAL GREENHOUSE GAS INVENTORIES
10<http://unfccc.int/national_reports/non-annex_i_natcom/items/2979.php>.
3.2.6 KEY CATEGORIES
A key category is one that is prioritized within the national
inventory system because its estimate has a major
influence on a country’s total inventory of direct GHGs
in terms of the absolute level of emissions, or trends
in emissions, or both. By identifying these key categories,
Parties can prioritize their efforts and resources in order
to improve their overall estimates. Such a process will lead
to improved quality, as well as greater confidence in the
emissions/removal estimates that are calculated. It is good
practice for each Party to identify its national key
categories in a systematic and objective manner.
3.3 REPORTING
One of the main purposes for compiling a national GHG
inventory is to report to national or international
entities. Reported information should be transparent
and complete, with all the information required to
produce the national inventory estimates documented
and archived. It is not practical to include all this
information in the inventory report; however summary
information and references to source data could
be included.
The IPCC good practice guidance is a beneficial tool, as
it provides useful advice for selecting methods (tieredapproaches), emission factors and activity data. Furthermore,
it can aid the selection of appropriate methods and
emission factors, the quantifying and analysis of uncertainty,
the determination of key categories, the recalculation
of emissions data, and the development of quality assurance
and quality control plans.
The IPCC good practice guidance can be found at
<http://www.ipcc-nggip.iges.or.jp/public/gp/gpgaum.htm>
3.4 DOCUMENTATION AND ARCHIVING
Once the GHG inventory and other components of the
national communications are completed, the document(s)
must be submitted to the Conference of the Parties (COP)
in both hard copy and soft (electronic) format. The
information must be submitted as a single document with
an executive summary (maximum 10 pages) outlining the
information contained in the full document. Non-Annex I
Parties may submit their national communications in
any of the official languages of the United Nations, but
are encouraged to translate the document into English;
however, the executive summary must be translated into
English. Often, a Party will have additional information
which supports or adds to the national communication;
such documents may be submitted as technical annex(es)
or as an addendum.
Once submitted to the UNFCCC, national communications
from non-Annex I Parties are held by the UNFCCC and
made publicly available through the Convention website.10
3.5 INVENTORY IMPROVEMENT STRATEGY
Improvements may arise from various aspects of the
national communication process and, may or may
not be, immediately feasible. In addition to sources
of improvement which may be identified duringthe uncertainty assessment, non-Annex I Parties should
describe any constraints and gaps and related financial,
technical and capacity needs, associated with the
implementation of activities and preparation and
improvement of national communications.
7/26/2019 09 Resource Guide3
http://slidepdf.com/reader/full/09-resource-guide3 14/36
12
UNFCCC RESOURCE GUIDE
MODULE 3: NATIONAL GREENHOUSE GAS INVENTORIES
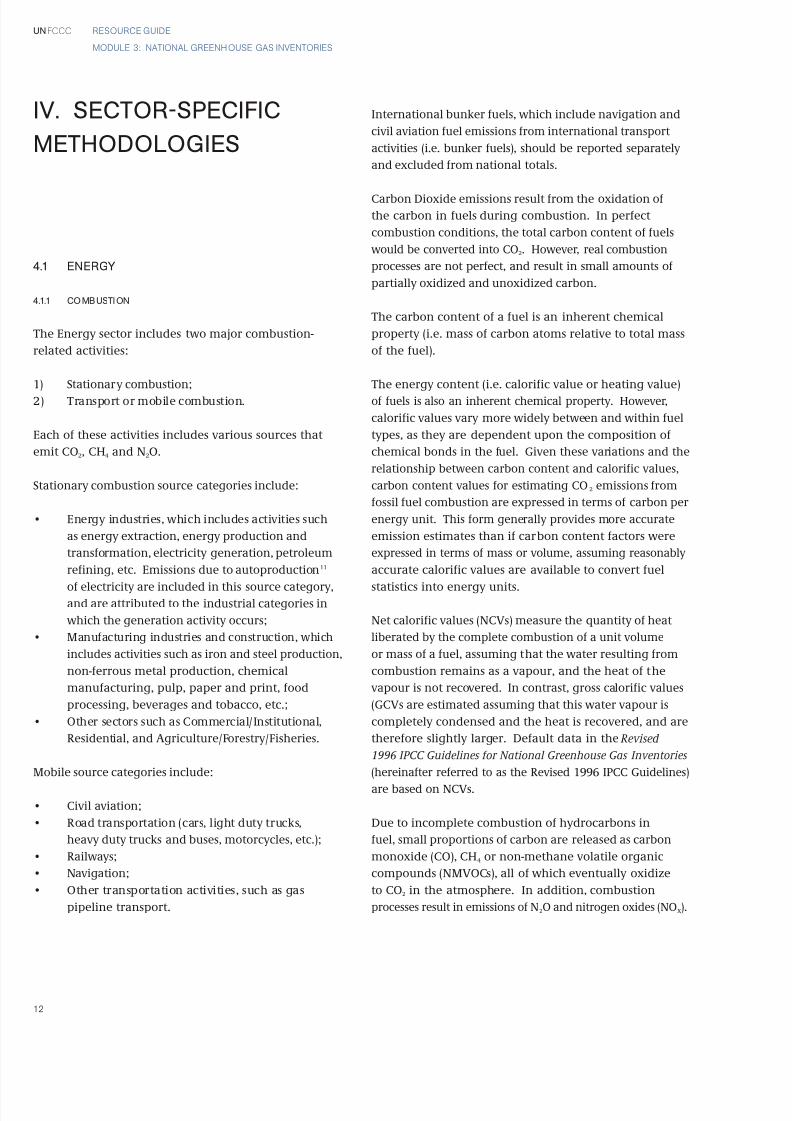
4.1 ENERGY
4.1.1 COMBUSTION
The Energy sector includes two major combustion-
related activities:
1) Stationary combustion;
2) Transport or mobile combustion.
Each of these activities includes various sources that
emit CO2, CH4 and N2O.
Stationary combustion source categories include:
• Energy industries, which includes activities such
as energy extraction, energy production and
transformation, electricity generation, petroleum
refining, etc. Emissions due to autoproduction11
of electricity are included in this source category,and are attributed to the industrial categories in
which the generation activity occurs;
• Manufacturing industries and construction, which
includes activities such as iron and steel production,
non-ferrous metal production, chemical
manufacturing, pulp, paper and print, food
processing, beverages and tobacco, etc.;
• Other sectors such as Commercial/Institutional,
Residential, and Agriculture/Forestry/Fisheries.
Mobile source categories include:
• Civil aviation;
• Road transportation (cars, light duty trucks,
heavy duty trucks and buses, motorcycles, etc.);
• Railways;
• Navigation;
• Other transportation activities, such as gas
pipeline transport.
IV. SECTOR-SPECIFIC
METHODOLOGIES
International bunker fuels, which include navigation and
civil aviation fuel emissions from international transport
activities (i.e. bunker fuels), should be reported separately
and excluded from national totals.
Carbon Dioxide emissions result from the oxidation of
the carbon in fuels during combustion. In perfect
combustion conditions, the total carbon content of fuels
would be converted into CO2. However, real combustion
processes are not perfect, and result in small amounts of
partially oxidized and unoxidized carbon.
The carbon content of a fuel is an inherent chemical
property (i.e. mass of carbon atoms relative to total mass
of the fuel).
The energy content (i.e. calorific value or heating value)
of fuels is also an inherent chemical property. However,
calorific values vary more widely between and within fuel
types, as they are dependent upon the composition of
chemical bonds in the fuel. Given these variations and the
relationship between carbon content and calorific values,
carbon content values for estimating CO2 emissions from
fossil fuel combustion are expressed in terms of carbon per
energy unit. This form generally provides more accurate
emission estimates than if carbon content factors were
expressed in terms of mass or volume, assuming reasonably
accurate calorific values are available to convert fuel
statistics into energy units.
Net calorific values (NCVs) measure the quantity of heat
liberated by the complete combustion of a unit volume
or mass of a fuel, assuming that the water resulting from
combustion remains as a vapour, and the heat of the
vapour is not recovered. In contrast, gross calorific values
(GCVs are estimated assuming that this water vapour is
completely condensed and the heat is recovered, and are
therefore slightly larger. Default data in the Revised
1996 IPCC Guidelines for National Greenhouse Gas Inventories
(hereinafter referred to as the Revised 1996 IPCC Guidelines)
are based on NCVs.
Due to incomplete combustion of hydrocarbons in
fuel, small proportions of carbon are released as carbon
monoxide (CO), CH4 or non-methane volatile organic
compounds (NMVOCs), all of which eventually oxidize
to CO2 in the atmosphere. In addition, combustion
processes result in emissions of N2O and nitrogen oxides (NOX).
7/26/2019 09 Resource Guide3
http://slidepdf.com/reader/full/09-resource-guide3 15/36
13
SECTOR-SPECIFIC METHODOLOGIESUNFCCC RESOURCE GUIDE
MODULE 3: NATIONAL GREENHOUSE GAS INVENTORIES
11Autoproduction refers to electricity, heat or steam produced by an industrial facility for itsown consumption or sale to other consumers or to the electricity grid. Autoproduction issometimes also called autogeneration, self-generation or self-production.
Unlike CO2, emission estimates of CH4, N2O, NOX, CO and
NMVOCs require detailed process information. Accurate
estimation of their emissions depends on knowledge of
several interrelated factors, including combustion conditions,
size and age of the combustion technology, maintenance,
operational practices, emission controls, as well as fuel
characteristics. The methods should be applied at a detailed
activity/technology level so as to take, to the extent
possible, these factors into account.
The reference approach (Tier 1) estimates only CO2 emissions
from fuel combustion. The reference approach for CO2
can be performed quickly, provided that the basic energy
balance sheet for a country is available. CO2 emissions
may also be calculated at the more detailed (i.e. sectoral)
level. Non-Annex I Parties are encouraged to estimate
and report CO2 emissions using both the sectoral and
reference approaches, and explain any large differences
between the two approaches.
The reference approach provides a potentially useful way
of cross-checking emission estimates of CO2 with those
calculated using the sectoral approach and thus helps to
identify inconsistencies or mistakes. The sectoral
approach provides greater detail on the combustion
activities responsible for emissions.
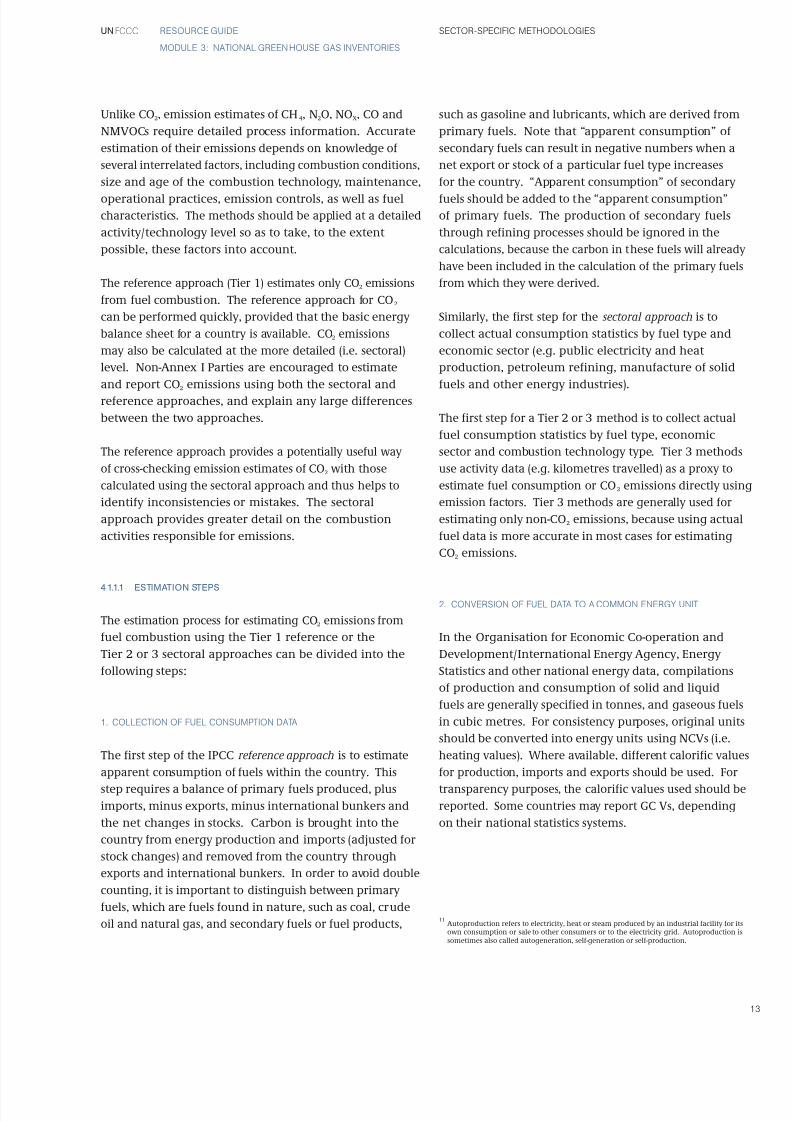
4.1.1.1 ESTIMATION STEPS
The estimation process for estimating CO2 emissions from
fuel combustion using the Tier 1 reference or the
Tier 2 or 3 sectoral approaches can be divided into the
following steps:
1. COLLECTION OF FUEL CONSUMPTION DATA
The first step of the IPCC reference approach is to estimate
apparent consumption of fuels within the country. This
step requires a balance of primary fuels produced, plus
imports, minus exports, minus international bunkers and
the net changes in stocks. Carbon is brought into the
country from energy production and imports (adjusted for
stock changes) and removed from the country through
exports and international bunkers. In order to avoid double
counting, it is important to distinguish between primary
fuels, which are fuels found in nature, such as coal, crude
oil and natural gas, and secondary fuels or fuel products,
such as gasoline and lubricants, which are derived from
primary fuels. Note that “apparent consumption” of
secondary fuels can result in negative numbers when a
net export or stock of a particular fuel type increases
for the country. “Apparent consumption” of secondary
fuels should be added to the “apparent consumption”
of primary fuels. The production of secondary fuels
through refining processes should be ignored in the
calculations, because the carbon in these fuels will already
have been included in the calculation of the primary fuels
from which they were derived.
Similarly, the first step for the sectoral approach is to
collect actual consumption statistics by fuel type and
economic sector (e.g. public electricity and heat
production, petroleum refining, manufacture of solid
fuels and other energy industries).
The first step for a Tier 2 or 3 method is to collect actual
fuel consumption statistics by fuel type, economic
sector and combustion technology type. Tier 3 methods
use activity data (e.g. kilometres travelled) as a proxy to
estimate fuel consumption or CO2 emissions directly using
emission factors. Tier 3 methods are generally used for
estimating only non-CO2 emissions, because using actual
fuel data is more accurate in most cases for estimating
CO2 emissions.
2. CONVERSION OF FUEL DATA TO A COMMON ENERGY UNIT
In the Organisation for Economic Co-operation and
Development/International Energy Agency, Energy
Statistics and other national energy data, compilations
of production and consumption of solid and liquid
fuels are generally specified in tonnes, and gaseous fuels
in cubic metres. For consistency purposes, original units
should be converted into energy units using NCVs (i.e.
heating values). Where available, different calorific values
for production, imports and exports should be used. For
transparency purposes, the calorific values used should be
reported. Some countries may report GC Vs, depending
on their national statistics systems.
7/26/2019 09 Resource Guide3
http://slidepdf.com/reader/full/09-resource-guide3 16/36
SECTOR-SPECIFIC METHODOLOGIES
14
UNFCCC RESOURCE GUIDE
MODULE 3: NATIONAL GREENHOUSE GAS INVENTORIES
3. SELECTION OF CARBON CONTENT FACTORS FOR EACH FOSSIL
FUEL/PRODUCT TYPE AND ESTIMATION OF THE TOTAL CARBON CONTENT
OF FUELS CONSUMED
There is considerable variation in the energy and carbon
content by weight and volume of fuels. However,
expressing carbon content on a per-unit-of-energy basis
reduces this variation because of the close link between
the carbon content and energy value of the fuel. Carbon
content factors may vary considerably both between and
within primary fuel types.
4. SUBTRACTION OF THE AMOUNT OF CARBON STORED IN PRODUCTS
FOR LONG PERIODS OF TIME (E.G. NON-ENERGY USES).
The reference approach requires information on the
consumption of fuels used for non-energy purposes
where carbon may be stored (i.e. not oxidized and emitted
to the atmosphere). The reference approach uses a
simple assumption: once carbon is brought into a national
economy in the form of a fuel, it is either saved in some
way (e.g. in increases of fuel stocks, stored in products, or
left unoxidized in ash), or it is emitted into the atmosphere.
Some of the fuels supplied to an economy can be used for
non-energy purposes or as raw materials (i.e. feedstocks)
for the manufacture of products. A wide variety of products
are produced from oil refineries, including asphalt andbitumen for road construction, naphthas, lubricants, plastics
and fertilizers. Natural gas is used for ammonia production.
Liquified petroleum gas (LPG) is used to produce solvents
and synthetic rubber. By-products of the coking process,
such as oils and tars, are used in the chemical industry.
In some of these cases, the carbon in these fuels is oxidized
to CO2 within the non-energy process (e.g. carbon from
natural gas used in ammonia production). In other cases,
the carbon is indefinitely stored (i.e. sequestered), although
the carbon in some products may be oxidized as the
product ages or is disposed of. The amounts stored for
long periods are called stored carbon and should
be deducted from the carbon emissions calculation.
Several approaches for estimating the amount of carbon
stored in products are contained in the Revised 1996
IPCC Guidelines. The IPCC recommends that, whenever
possible, Parties should use country-specific data and
assumptions instead of relying on IPCC default factors.
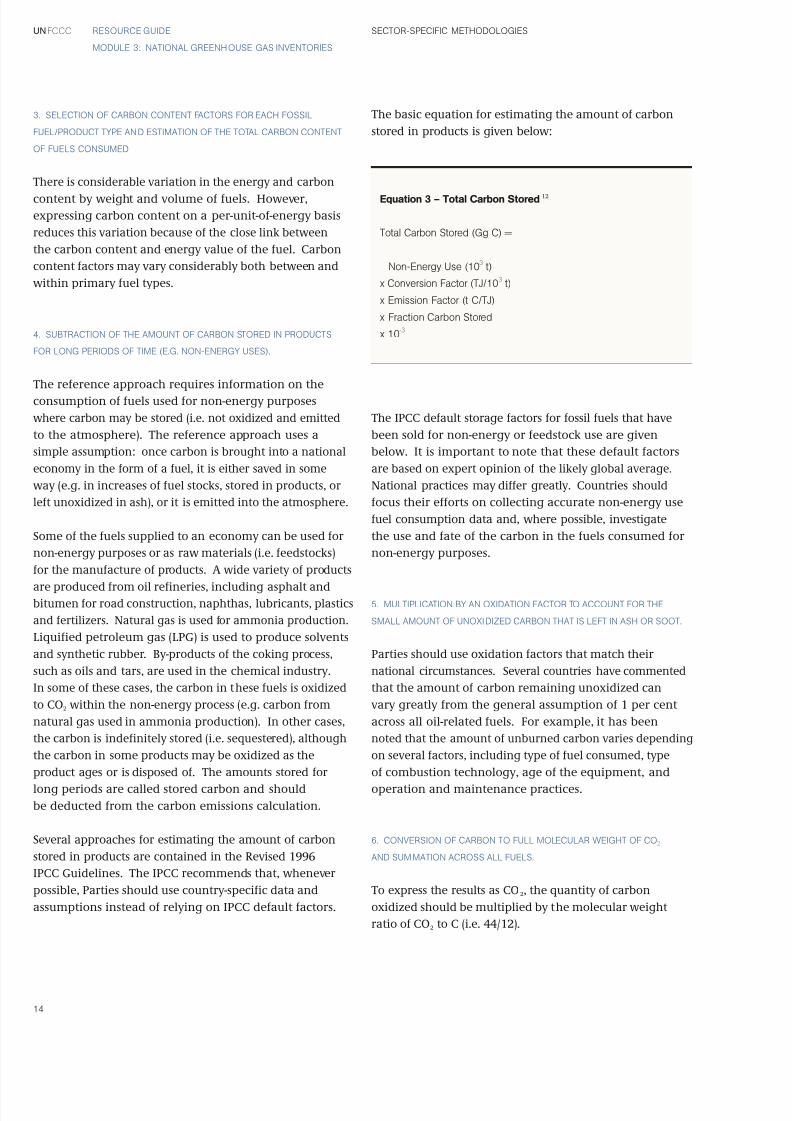
The basic equation for estimating the amount of carbon
stored in products is given below:
The IPCC default storage factors for fossil fuels that have
been sold for non-energy or feedstock use are given
below. It is important to note that these default factors
are based on expert opinion of the likely global average.
National practices may differ greatly. Countries should
focus their efforts on collecting accurate non-energy use
fuel consumption data and, where possible, investigate
the use and fate of the carbon in the fuels consumed for
non-energy purposes.
5. MULTIPLICATION BY AN OXIDATION FACTOR TO ACCOUNT FOR THE
SMALL AMOUNT OF UNOXIDIZED CARBON THAT IS LEFT IN ASH OR SOOT.
Parties should use oxidation factors that match their
national circumstances. Several countries have commented
that the amount of carbon remaining unoxidized can
vary greatly from the general assumption of 1 per cent
across all oil-related fuels. For example, it has been
noted that the amount of unburned carbon varies depending
on several factors, including type of fuel consumed, type
of combustion technology, age of the equipment, and
operation and maintenance practices.
6. CONVERSION OF CARBON TO FULL MOLECULAR WEIGHT OF CO2
AND SUMMATION ACROSS ALL FUELS.
To express the results as CO2, the quantity of carbon
oxidized should be multiplied by the molecular weight
ratio of CO2 to C (i.e. 44/12).
Equation 3 – Total Carbon Stored 12
Total Carbon Stored (Gg C) =
Non-Energy Use (103
t)
x Conversion Factor (TJ/103
t)
x Emission Factor (t C/TJ)
x Fraction Carbon Stored
x 10-3

7/26/2019 09 Resource Guide3
http://slidepdf.com/reader/full/09-resource-guide3 17/36
15
SECTOR-SPECIFIC METHODOLOGIESUNFCCC RESOURCE GUIDE
MODULE 3: NATIONAL GREENHOUSE GAS INVENTORIES
In addition to the steps described above, emissions of CO2
from international bunker fuels and biomass used as a fuel
should be handled as follows:
• Bunker fuels: CO2 emissions arising from fuels used
in ships or aircraft for international transport should
not be included in the national total. The quantities
of fuels delivered to and consumed by international
bunkers should be subtracted from the fuel supply to
the country. The calculated bunker fuel emissions
should be mentioned as a memo item.
• Biomass fuels: Biomass fuels are included in the
national energy and emissions accounts for
completeness only. The resultant CO2 emissions
should not be included in national CO2 emissions
from fuel combustion. The release of carbon due to
biomass used as energy should be accounted in
the LULUCF sector. Non-CO2 emissions from biomass
combustion, however, should be reported under
the Energy sector.
Because of the difficulties many Parties have in allocating
marine and aviation transport emissions between
international and domestic categories, the IPCC has provided
a detailed decision tree and guidance for each in the
IPCC good practice guidance. The CGE GHG Inventory
Handbook, Energy sector – Fuel Combustion document
contains decision trees and a table describing how
to distinguish individual travel segments betweeninternational and domestic, starting on page 15. It is
understood that many Parties will have difficulty
strictly applying this guidance due to lack of detailed data.
Non-CO2 emissions. The methods (i.e. tiers) for estimating
non-CO2 emissions require different levels of detail for
activities and technology.
Tier 1. Emissions from all sources of combustion are
estimated by multiplying the quantity of fuel consumed
by an average emission factor. Tier 1 methods do not
require detailed activity data.
Tiers 2/3. Emissions are estimated by multiplying the
quantity of fuel consumed by detailed fuel type and
technology-specific emission factors.
Tier 1 methods rely on widely available fuel supply data
that assume an average combustion technology is used.
The difference between Tiers 2 and 3 is mainly an increase
in the degree of detail required by the method. In
general, Tier 2 methods use fuel consumption data
that are disaggregated according to technology types and
that are sufficiently homogenous to permit the use of
representative emission factors. Tier 3 methods generally
estimate emissions according to activity types (km travelled
or tonne-km carried) and specific fuel efficiency, fuel rates,
emission factor or factors expressed directly in terms of a
unit of activity.
All tier methods rely on the same fundamental equation:
Alternatively, countries may use national emission models
or continuous emission measurement of CH4 and N2O,
which is consistent with good practice. However, in most cases, continuous emission measurements are not justified
because of the high cost of performing the measurements.
It is good practice to use the most disaggregated technology -
specific and country-specific emission factors available,
particularly those derived from direct measurements for
stationary combustion sources. Using a Tier 2 approach,
there are three possible types of emission factors:
• National emission factors;
• Regional emission factors;
• IPCC default emission factors, provided that a careful
review of the applicability of these factors to the
country’s conditions has been made. IPCC default
factors may be used when no other information
is available.
Equation 4 – Total Carbon Stored 13
Emissions = ∑ (Emission Factora bc x Fuel Consumptiona bc )
Where:
a = fuel type
b = sector activity
c = technology type
12Materials for the hands-on training workshops of the CGE Energy sector – Fuel Combustion,page 12. Available at <http://unfccc.int/resource/cd_roms/na1/ghg_inventories/index.htm>.
13Materials for the hands-on training workshops of the CGE Energy sector – Fuel Combustion,page 20.
7/26/2019 09 Resource Guide3
http://slidepdf.com/reader/full/09-resource-guide3 18/36
SECTOR-SPECIFIC METHODOLOGIES
16
UNFCCC RESOURCE GUIDE
MODULE 3: NATIONAL GREENHOUSE GAS INVENTORIES
4.1.1.2 STATIONARY COMBUSTION
Default emission factors for CH4, N2O, NOX, CO and NMVOCs
by major technology and fuel types are presented in the
Revised 1996 IPCC Guidelines, Reference Manual – Volume 3.
Data are also presented on typical sulphur contents of
fossil and biomass fuels. Alternative control technologies,
with representative percentage reductions are also shown.
These data show the range and variation of sources
and emission rates, as well as the impact of the control
technologies.
Of particular importance for many countries are CH4
emissions from various types of open burning and biomass
combustion because of the highly inefficient nature of the
combustion process in many cases. In particular, charcoal
production is likely to produce methane emissions at a
rate that is several orders of magnitude greater than other
combustion processes.
4.1.1.3 MOBILE COMBUSTION
Emissions of GHGs from mobile sources can be estimated
by major transport activity (road, air, rail and ships).
However, as road transportation accounts for the majority
of mobile-source fuel consumption, followed by air transport,
greater priority has been attached to the development
of emission models and inventories for road vehicles andaircraft. The diversity of mobile sources and the range of
characteristics that affect emission factors are demonstrated
and can be seen in the tables included in the Revised 1996
IPCC Guidelines.
Of particular importance for many countries are N2O
emissions from road transportation, which are considerably
affected by the type of emission control technologies in
use. Some catalyst-type control technologies can increase
the rate of N2O emissions relative to an uncontrolled
vehicle. Non-Annex I Parties should focus their efforts
on collecting data on the number of vehicles with
catalytic emission-control devices that operate in their
country. The type of catalytic control equipment can
often be approximated by the age and make of the vehicle
if it is not known. As shown in the table on page 26 of
the Materials for the hands-on training workshops of the
CGE, GHG Inventory: Energy Sector – Fuel Combustion
document, N2O emission rates can vary dramatically (i.e.
by an order of magnitude) due to the effect of different
vehicle control technologies.
4.1.2 FUGITIVES
In the Energy sector, fugitive emissions from fuels can be
divided into source categories related to solid fuels (primarily
coal) and oil and natural gas systems. The dominant GHG
emitted from all of these source categories is CH4, although
smaller amounts of CO2 are also emitted from some sources.
For solid fuels, venting and disposal of coal-bed methane is
the primary source of fugitive emissions. Most of these
emissions occur at the mine with some residual emissions
occurring from post-mining handling/processing activities.
4.1.2.1 COAL MINING
There are two types of coal mines: surface and underground.
The specific emission rates from coal mining depend
primarily on the relative contribution of surface and
underground mining to a country’s total coal production.
CH4 emissions from surface mines are usually an order of
magnitude lower than from those underground mines. For
underground mines, the amount of emissions tends to
increase with the depth of the mine. For both types of mines,
the potential for emissions is determined by the gas
content of the coal. Some gas may remain in the coal until
combustion; however, most (60% – 75%) is released during
the mining activity. Emissions from coal handling are related
to the type of mine from which the coal was produced,and are primarily associated with crushing operations.
Emissions from coal mines may continue after the mines
have stopped producing coal (i.e. abandoned mines).
Typically, the amount of emissions declines rapidly once
deep mine coal production stops; however, in some cases,
CH4 emissions from the surrounding strata may be
substantial and continue for years afterwards. Coal waste
or reject piles are only a minor source of CH4 emissions.
There are practicable options for controlling emissions from
coal mining and handling. These may include the use
of degasification wells with either conservation or flaring
of the produced gas or the use of catalytic combustors
on the outlet of ventilation systems for underground mines.
Useful monitoring and activity data for developing
emissions estimates including the CH4 content of
exhausted ventilation air, coal production, imports and
exports by type of coal, and information on the depth
of each mine, may be available.

7/26/2019 09 Resource Guide3
http://slidepdf.com/reader/full/09-resource-guide3 19/36
17
SECTOR-SPECIFIC METHODOLOGIESUNFCCC RESOURCE GUIDE
MODULE 3: NATIONAL GREENHOUSE GAS INVENTORIES
4.1.2.2 OIL AND NATURAL GAS
Oil and natural gas systems are potentially very complex
and diverse. Specific fugitive emission rates may vary
greatly according to:
1) The type of oil or gas being produced, processed or
handled (e.g. conventional crude oil, heavy oil,
crude bitumen, dry gas, sour gas, associated gas);
2) The stage of the system;
3) The type and age of facility;
4) Operating, maintenance and design practices;
5) Local regulatory requirements and enforcement.
The primary types of fugitive emission sources at oil and
gas facilities are fugitive equipment leaks, process venting
and flaring, evaporation losses (e.g. from product storage
and handling, particularly where flashing losses occur),
and accidental releases or equipment failures.
Accidental releases are difficult to predict, but can be a
substantial contributor where major well blowouts or
pipeline ruptures have occurred. Accidental releases or
equipment failures can include:
• Well blowouts;
• Pipeline breaks;
• Tanker accidents;
• Tank explosions;• Gas migration to the surface around the outside
of wells;
• Surface casing vent blows: a surface casing vent blow
may be caused by a leak from the production
casing into the surface casing or by fluid migration
up into the surface casing from below;
• Leakage from abandoned wells: emissions from
abandoned wells result from unsuccessful
abandonment procedures.
Gas migration to the surface may be caused by a leak in
the production string at some point below the surface
casing or by the migration of material from one or more
of the hydrocarbon-bearing zones that were penetrated
(e.g. a coal seam).
Storage losses are primarily a source of non-methane
hydrocarbons, but can contribute substantial amounts
of CH4 emissions where flashing or boiling losses occur.
Such losses occur when a hydrocarbon liquid is sent from
a pressure vessel where it has been in contact with a gas
phase, which is the case at most production facilities.
Thereafter, the hydrocarbon liquids contain little CH4.
In general, the amount of fugitive emissions from oil and
gas activities tends to correlate poorly with production
levels or system throughputs. It is more closely related to
the amount, type, and age of process infrastructure (i.e.
equipment); the characteristics of the hydrocarbons being
produced, processed or handled; and the industry
design, operating and maintenance practices. Emissions
from venting and flaring depend on:
• The amount of process activity;
• Operating practices;
• On-site utilization opportunities;
• Economic access to markets;
• The local regulatory environment.
With the exception of petroleum refineries, integrated
oil sands mining and upgrading operations, oil and
gas systems tend to be characterized more by multiple
smaller facilities and installations rather than a few
large ones. Moreover, while reasonable information is
typically available for the larger facilities, it is usually
the smaller facilities that contribute most of the fugitive
emissions, and information on these smaller facilities is
much less likely to be available.
Generally, the relative amount of fugitive emissions depends
on many factors, but emissions tend to increase as you
go upstream through a system, and decrease with the
concentration of hydrogen sulphide (H2S) in the produced
oil and gas. Typically, raw natural gas and crude oil both
contain a mixture of hydrocarbons and various impurities
including H2O, N2), argon (Ar), hydrogen sulphide (H2S)
and CO2. If natural gas contains more than 10 ppmv
(parts per million by volume) of H2S it is generally referred
to as sour gas, and otherwise is called sweet gas. The
impurities are removed by processing, treating or refining,
as appropriate. The raw CO2 that is removed from
hydrocarbons is normally vented into the atmosphere
and is a source of fugitive emissions. This fact has
been overlooked by some countries. Contributions of raw
CO2 emissions occur primarily at sour gas processing
plants. Offshore production and production from foothills
or mountainous regions tends to be sour or have high
CO2 concentrations. The concentration of H2S tends to
increase with the depth of the well.

7/26/2019 09 Resource Guide3
http://slidepdf.com/reader/full/09-resource-guide3 20/36
SECTOR-SPECIFIC METHODOLOGIES
18
UNFCCC RESOURCE GUIDE
MODULE 3: NATIONAL GREENHOUSE GAS INVENTORIES
Two major issues concerning the reported fugitive
emissions from oil and gas systems are:
1) The generally poor quality and completeness of
available venting and flaring data;
2) The fact that much of the infrastructure
contributing to equipment leaks is at minor facilities
for which statistics are either unavailable or
incomplete (e.g. well-site facilities and field facilities).
FUGITIVE EQUIPMENT LEAKS
Unintentional leaks from equipment components include, but
are not limited to: valves, flanges and other connections,
pumps, compressors, pressure relief devices, process drains,
open-ended valves, pump and compressor seal system
degassing vents, accumulator vessel vents, agitator seals, and
access door seals. Fugitive sources tend to be continuous
emitters and have low to moderate emission rates. Essentially,
all equipment components leak to some extent; however,
only a few per cent of the potential sources at a site leak a
sufficient amount to require repair or replacement. If the
number of leakers is less than 2% of the total number of
potential sources, the facility is normally considered to be well
maintained and fugitive equipment leaks, properly controlled.
Fugitive leaks from equipment are a large, if not the
largest, source of methane and non-methane hydrocarbonemissions at oil and gas facilities. Some of the common
trends identified in the available leak data are as follows:
• Components on fuel gas systems tend to leak more
than components on process gas systems. This likely
reflects a lower level of care and attention and use
of lower quality components in fuel gas applications;
• The potential for leaks tends to decrease as the value
or toxic nature of the process fluid increases, and
where gas has been odorized. Thus, leak frequencies
for equipment components in sour service are much
lower than for components in sweet service. At sour
gas plants, often only a small portion of the plant is
actually in sour service;
• The stem packing on control valves tends to leak
more than on block valves;
• Hydra-mechanical governors14 on compressor
engines tend to be the most leak-prone component
in control valve service;
• Components tend to have greater average emissions
when subjected to frequent thermal cycling,
vibrations or cryogenic service.
VENTING AND FLARING
Flare and vent systems exist in essentially all segments
of the oil and gas industry and are used for two basic
types of waste gas disposal: intermittent and continuous.
Intermittent applications may include:
• The disposal of waste volumes from emergency
pressure relief episodes;
• Operator initiated or instrumented depressurization
events (e.g. depressurization of process equipment
for inspection or maintenance, or depressurization
of piping for tie-ins);
• Plant or system upsets;
• Well servicing and testing;
• Pigging events;
• Routine blowdown of instruments, drip pots
and scrubbers.
Continuous applications may include:
• Disposal of associated gas and/or tank vapours at
oil production facilities where gas conservation
is uneconomical or until such economics can be
evaluated;
• Casing gas at heavy oil wells, process waste or by-
product streams that either have little or no value or
are uneconomical to recover (e.g. vent gas fromglycol dehydrators, acid gas from gas sweetening
units, and sometimes stabilizer overheads);
• Venting gas from gas-operated devices where natural
gas is used as the supply medium (e.g. instrument
control loops, chemical injection pumps, samplers).
Typically, waste gas volumes are flared if they pose an
odour, health or safety concern; in all other cases, they
are vented.
There are often inconsistencies in what individual
companies include in their reported vented and flared
volumes. In some cases, this is due to differences in
reporting requirements between jurisdictions. In other
cases, it is due to a lack of specificity in the current
requirements, inconsistent industry practice and only
superficial auditing of the results.
All measured quantities are likely to be fully accounted.
However, flow meters are normally only installed on
larger continuous vent or flare systems, if at all. Where

7/26/2019 09 Resource Guide3
http://slidepdf.com/reader/full/09-resource-guide3 21/36
19
SECTOR-SPECIFIC METHODOLOGIESUNFCCC RESOURCE GUIDE
MODULE 3: NATIONAL GREENHOUSE GAS INVENTORIES
flow meters are installed on intermittent flares, they are
usually sized, due to limitations in their operating range,
to measure only peak flow rates. As a result, there is the
potential for substantial leakage into vent and flare
systems to persist undetected.
Where there is no measurement data the volumes must be
estimated using expert judgment. The main problems with
this approach are the lack of detailed estimation guidelines,
the lack of any formal tracking of the activity data needed
to make many of these judgments (e.g. frequency and details
of equipment or piping blowdown events, frequency of
compressor engine starts), and differences regarding which
sources individual operators take into account.
Historically, there has been a problem with some vented
volumes being reported as flared. The actual split has a
substantial impact on the total CO2 equivalent emissions
from these activities because unburned CH4 contributes
approximately 7.6 times more radiative forcing on a 100 year
time horizon than fully combusted CH4 (i.e. the oxidized
carbon from 1 tonne of CH4 produces 2.75 tonnes of CO2 in
the atmosphere, but when weighted by their global warming
potential (GWP) values, the CO2 has 7.6 times less
cumulative radiative forcing impact than the methane).
ACID GAS
Acid gas is a by-product of the sweetening process at
sour gas processing plants and refineries, and may contain
large amounts of raw CO2 extracted from process gas
(typically, from 20 to 95 mol per cent CO 2). The rest of the
acid gas tends to be mostly H2S. The amount of acid
gas production is usually metered and the CO2 content,
although not normally tracked by regulatory agencies,
is known by the facility operators. Regardless of whether
the acid gas is processed by a sulphur recovery unit,
flared or vented, the raw CO2 passes through the system
unchanged and is ultimately released into the atmosphere.
STORAGE LOSSES
Storage tanks are typically only a source of CH4 emissions
where boiling or flashing losses occur (i.e. the product
contains some natural gas in solution). This occurs at
production and processing facilities where a hydrocarbon
liquid flows directly from a pressure vessel, where it has
been in contact with natural gas (e.g. an inlet separator or
oil treater), to an atmospheric storage tank. Once placed
in storage tanks, the solution gas quickly volatilizes,
leaving a weathered, more stable product that is essentially
free of CH4. Pipeline and marine terminals and refineries
normally receive weathered products.
Other less recognized and often unaccounted for
contributors to atmospheric emissions of CH4 from
storage tanks may include the following:
• Leakage of process gas or volatile hydrocarbon
liquids past a closed drain or blowdown valves into
the product header leading to the tanks;
• Inefficient separation of gas and liquid phases
upstream of the tanks allowing some gas carry
through (by entrainment) to the tanks. This usually
occurs where inlet liquid production (e.g. produced
water) has increased substantially over time resulting
in a facility’s inlet separators being undersized for
current conditions;
• Piping changes resulting in the unintentional
placement of high vapour pressure product in tanks
not equipped with appropriate vapour controls;
• Displacement of large volumes of gas to storage
tanks during pigging operations;
• Malfunctioning or improperly set blanket gas
regulators and vapour control valves can result
in excessive blanket gas consumption and,
consequently, increased flows to the end controldevice (e.g. vent, flare or vapour recovery
compressor). The blanket gas is both a carrier of
product vapours and a potential pollutant itself
(i.e. natural gas is usually used as the blanket
medium for blanketed tanks at gas processing plants).
4.1.2.3 OTHER FUGITIVE SOURCES
Other less common sources of fugitive emissions from fuels
include peat production and geothermal energy-related
emissions. Checks should be performed to determine if
these additional sources occur, and if so, whether their
emissions have been reported.
14The engine governor controls engine speed, and in some generator applications, generatorload. Hydra-mechanical governors sense engine speed mechanically, and use the engine’s oilpressure to hydraulically move the actuator controlling fuel flow to the cylinders.

7/26/2019 09 Resource Guide3
http://slidepdf.com/reader/full/09-resource-guide3 22/36
SECTOR-SPECIFIC METHODOLOGIES
20
UNFCCC RESOURCE GUIDE
MODULE 3: NATIONAL GREENHOUSE GAS INVENTORIES
All fugitive source categories tend to emit substantial
quantities of CH4 and/or CO2, but are only minor
contributors of N2O, if at all. Fugitive emissions of N2O can
result from flaring activities. Some emission factors are
available in the literature for estimating N2O emissions
from flaring; these are generally comparable to or less
than the values published for small heaters and boilers.
4.2 INDUSTRIAL PROCESSES
The chemical reactions involved in the source categories
listed below are described in the specified sections of the
Revised 1996 IPCC Guidelines, Volume 3. The respective
chemical equations generally indicate energy/heat
requirement initiation and/or sustaining the chemical
reaction kinetically and thermodynamically. The
emissions associated with the energy input are not
regarded as Industrial Process sector emissions and
therefore are not included in the emission factor
estimation. They are accounted for under source
category 1A2 – Manufacturing industries and
construction in the Energy sector. To avoid double
counting, it is recommended that the non-energy
use (NEU) related emissions reported in the Industrial
Processes sector be calculated based on the use of
reducing agents, particularly for the source categories
in metal production:
Cement Production (2.3.1)
Lime production (2.4.1)
Soda ash production and use (2.6.1)
Ammonia production (2.8.1 and 2.8.2)
Silicon carbide (2.11.1)
Calcium carbide (2.11.2)
Iron and steel (2.13.3.2)
Ferroalloys (2.13.5.1)
Aluminium (2.13.5.1)
The most important source of non-energy industrial process emissions. CO2 is produced during the
production of clinker and intermediate product from which cement is made, as clinker is produced
from raw materials at high temperatures inside a kiln. Calcium carbonate from a calcium-rich material
forms lime and CO2 during the calcination process.
CO2 emissions are released during the production of calcined limestone as it is formed by heating
at high temperatures in a rotary kiln.
Soda ash, which is used as a raw material in many industries, emits CO2 during both its production and
use. Emissions from the production of soda ash vary greatly according to the manufacturing method,
as four different processes are commercially used. CO2 is emitted during the production of soda ash
because the reaction produces more CO2 than is stoichiometrically required. CO2 emissions arealso released during the use of soda ash for processes such as the manufacture of glass, chemicals,
soaps, detergents and flue gas desulphurization. A 1:1 ratio of soda ash use to CO2 emissions is
assumed by the United States Environmental Protection Agency.
Ammonia is typically produced by catalytic steam reforming of natural gas (CH4) or other fossil fuels,
which results in the production of CO2.
CO2 is released as a by-product of the reaction between quartz and carbon during the production
of silicon carbide. More carbon than is indicated in the stoichiometric reaction is actually required
for silicon carbide production, with the excess carbon being oxidized during the process. Petrol coke,
which is often used as a carbon source, may contain volatile compounds which form CH4 that may
escape into the atmosphere. Some carbon (about 35%) is sequestered in the product.
Calcium carbide is produced through a two-step process which includes heating calcium carbonate and
then reducing calcium oxide (CaO) with carbon, both of which lead to CO2 emissions. Furthermore,
the use of calcium carbonate (typically for acetylene production) releases CO2 emissions. While some
carbon is sequestered in the product, it may be ignored as this is for a short time only.
Iron production requires raw ore to be heated to form molten pig ore through heating in the presence
of carbon and oxygen. Steel may be produced in one of four types of furnaces, with different carbon
contents associated with each.
Ferroalloys (alloys of iron and one or more metals) are produced by smelting together raw ore, coke
and slagging materials. The smelting process results in significant CO emissions, which are assumed
to be converted to CO2 within days afterwards.
Aluminium is made in a two-step process. Bauxite ore is ground, purified and calcined to produce
alumina, which is then electrically reduced to aluminium by smelting. The main gaseous reaction
product of the process is CO2.
DescriptionSource (IPCC Guidelines, Volume 3)
7/26/2019 09 Resource Guide3
http://slidepdf.com/reader/full/09-resource-guide3 23/36
21
SECTOR-SPECIFIC METHODOLOGIESUNFCCC RESOURCE GUIDE
MODULE 3: NATIONAL GREENHOUSE GAS INVENTORIES
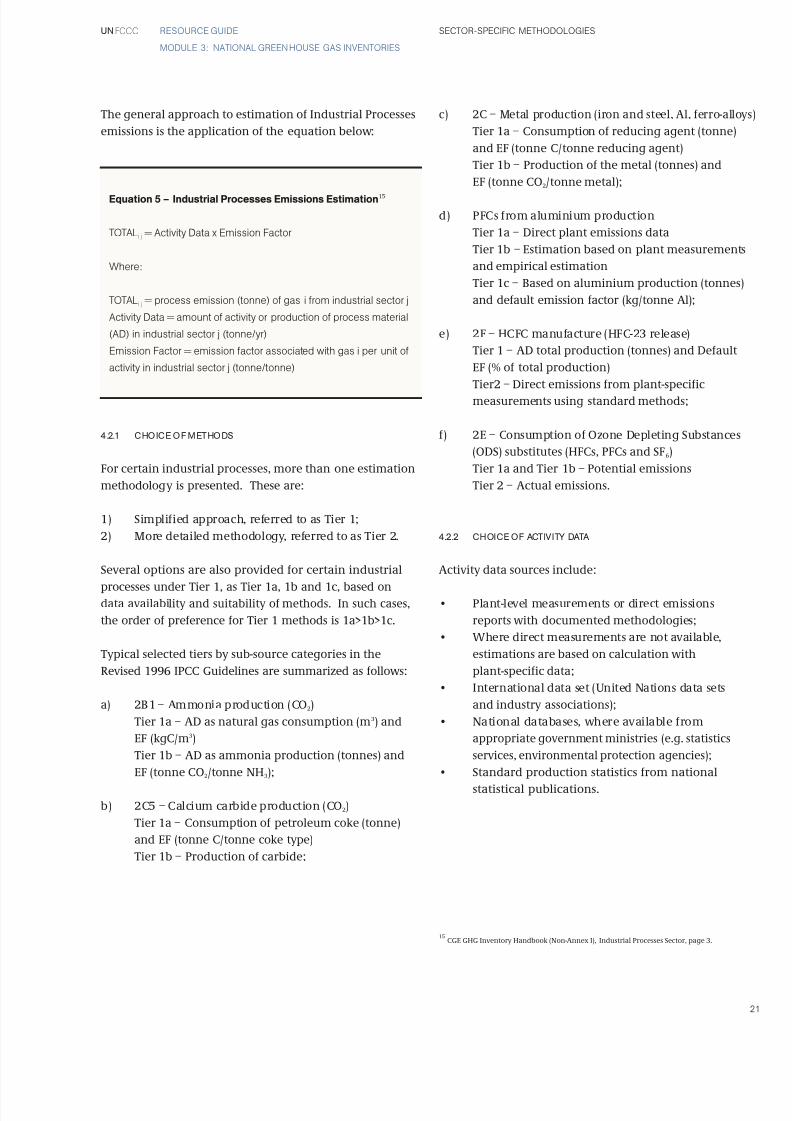
The general approach to estimation of Industrial Processes
emissions is the application of the equation below:
4.2.1 CHOICE OF METHODS
For certain industrial processes, more than one estimation
methodology is presented. These are:
1) Simplified approach, referred to as Tier 1;
2) More detailed methodology, referred to as Tier 2.
Several options are also provided for certain industrial
processes under Tier 1, as Tier 1a, 1b and 1c, based ondata availability and suitability of methods. In such cases,
the order of preference for Tier 1 methods is 1a>1b>1c.
Typical selected tiers by sub-source categories in the
Revised 1996 IPCC Guidelines are summarized as follows:
a) 2B1 – Ammonia production (CO2)
Tier 1a – AD as natural gas consumption (m3) and
EF (kgC/m3)
Tier 1b – AD as ammonia production (tonnes) and
EF (tonne CO2/tonne NH3);
b) 2C5 – Calcium carbide production (CO2)
Tier 1a – Consumption of petroleum coke (tonne)
and EF (tonne C/tonne coke type)
Tier 1b – Production of carbide;
c) 2C – Metal production (iron and steel, Al, ferro-alloys)
Tier 1a – Consumption of reducing agent (tonne)
and EF (tonne C/tonne reducing agent)
Tier 1b – Production of the metal (tonnes) and
EF (tonne CO2/tonne metal);
d) PFCs from aluminium production
Tier 1a – Direct plant emissions data
Tier 1b – Estimation based on plant measurements
and empirical estimation
Tier 1c – Based on aluminium production (tonnes)
and default emission factor (kg/tonne Al);
e) 2F – HCFC manufacture (HFC-23 release)
Tier 1 – AD total production (tonnes) and Default
EF (% of total production)
Tier2 – Direct emissions from plant-specific
measurements using standard methods;
f) 2E – Consumption of Ozone Depleting Substances
(ODS) substitutes (HFCs, PFCs and SF6)
Tier 1a and Tier 1b – Potential emissions
Tier 2 – Actual emissions.
4.2.2 CHOICE OF ACTIVITY DATA
Activity data sources include:
• Plant-level measurements or direct emissions
reports with documented methodologies;
• Where direct measurements are not available,
estimations are based on calculation with
plant-specific data;
• International data set (United Nations data sets
and industry associations);
• National databases, where available from
appropriate government ministries (e.g. statistics
services, environmental protection agencies);
• Standard production statistics from national
statistical publications.
Equation 5 – Industrial Processes Emissions Estimation15
TOTALi j = Activity Data x Emission Factor
Where:
TOTALi j = process emission (tonne) of gas i from industrial sector j
Activity Data = amount of activity or production of process material
(AD) in industrial sector j (tonne/yr)
Emission Factor = emission factor associated with gas i per unit of
activity in industrial sector j (tonne/tonne)
15CGE GHG Inventory Handbook (Non-Annex I), Industrial Processes Sector, page 3.

7/26/2019 09 Resource Guide3
http://slidepdf.com/reader/full/09-resource-guide3 24/36
SECTOR-SPECIFIC METHODOLOGIES
22
UNFCCC RESOURCE GUIDE
MODULE 3: NATIONAL GREENHOUSE GAS INVENTORIES
4.2.3 CHOICE OF EMISSION FACTORS
The various types of emission factors can be classified
as follows:
• Process-reaction-based EFs (stoichiometric ratios);
• Production-based EFs;
• Technology-specific EFs;
• Reported country/region-specific plant-level
measurements.
4.3 AGRICULTURE16
The Agriculture sector includes all anthropogenic emissions
associated with agriculture activities except for fuel
combustion and sewage emissions, which are covered in
Energy and Waste sectors, respectively.
The following categories are included in this sector:
• Enteric fermentation;
• Manure management;
• Rice cultivation;
• Agricultural soils;
• Prescribed burning of savannahs;
• Field burning of agricultural residues;
• Other.
Details of each category are contained in the following:
Enteric fermentation (4A): CH4 production from herbivores
as a by-product of enteric fermentation, a digestive
process by which carbohydrates are broken down by micro-
organisms into simple molecules for absorption into
the bloodstream. Both ruminant (e.g. cattle, sheep) and
non ruminant animals (e.g. pigs, horses) produce CH4,
although ruminants are the largest source (per unit of feed
intake). Information to be reported under this category
is organized by animal groups: Cattle (Dairy and Non-dairy),
Buffalo, Sheep, Goats, Camels and Llamas, Horses, Mules
and Asses, Swine, Poultry, and Other.
Manure management (4B): CH4 and N2O are produced from
the decomposition of manure under low oxygen or
anaerobic conditions. These conditions often occur when
large numbers of animals are managed in a confined
area (e.g. dairy farms, beef feedlots, and swine and poultry
farms), where manure is typically stored in large piles
or disposed of in lagoons and other types of manure
management systems. This category includes the same
subcategories as 4A, plus the following Anaerobic, Liquid
systems, and Solid storage and Drylot.
Rice cultivation (4C): The anaerobic decomposition of
organic material in flooded rice fields produces CH4, which
escapes into the atmosphere by ebullition (bubbling up)
through the water column, diffusion across the water-air
interface and transport through the rice plants. It is
suggested that these CH4 emissions be based on lowland
rice ecosystems without organic amendments relating
to water regime, where lowland refers to fields flooded for
a significant period of time. Correction factors for soils
with organic amendments should be applied as necessary.
Any N2O emissions from the use of nitrogen-based fertilizers
in rice cultivation should be reported under category 4D
Agricultural soils. This category encompasses the following
subcategories: Irrigated (both Continuously flooded and
Intermittently flooded), Rain fed (Flood-prone and Drought-
prone), Deepwater and Other.
Agricultural soils (4D): Emissions and removals of CH4 and
N2O from agricultural soil/land and NMVOCs from crops.
These are influenced by irrigation practices, climatic
variables, soil temperature and humidity. CO2 emissions
from, and removals by, agricultural soils are reported
under the LULUCF sector. Any N2O emissions from the use
of nitrogen-based fertilizers in rice cultivation should be
reported here. N2O emissions may be related to the use ofboth organic and inorganic fertilizers, biological nitrogen
fixation, and return of crop residues to the field or to animal
production. Non-CO2 GHG emissions associated with the
use of compost and human waste as fertilizers should also be
recorded in this category. Emissions of N2O from sewage
are to be reported under Waste (6B) and N2O emissions from
animal waste management systems other than grazing,
under manure management (4B). Emissions of N2O from
manure used for fuel are reported under Energy (1A).
Prescribed burning of savannas (4E): Emissions of CH4, CO,
N2O and NOX from the burning of savannas (tropical
and subtropical formations with continuous grass cover,
occasionally interrupted by trees and shrubs). Savannas
are burned to control the growth of vegetation, remove
pests and weeds, promote the nutrient cycle and
encourage the growth of new grass for animal grazing.
CO2 from prescribed savanna burning is noted for
information purposes, but is not included in the inventory
total, since it is assumed that an equivalent amount of CO2
is removed by re-growing vegetation in the following year.

7/26/2019 09 Resource Guide3
http://slidepdf.com/reader/full/09-resource-guide3 25/36
23
SECTOR-SPECIFIC METHODOLOGIESUNFCCC RESOURCE GUIDE
MODULE 3: NATIONAL GREENHOUSE GAS INVENTORIES
Field burning of agricultural residues (4F): Emissions of non-
CO2 GHGs from burning (in the field) of crop residue
and other agricultural wastes on site. These include: woody
crop residues (e.g. coconut shells, jute sticks, etc.); cereal
residues (e.g. rice and wheat straw, maize stalks, etc.); and
green crop residues (e.g. groundnut straw, soybean
tops, etc.). The burning of agricultural waste for energy
is excluded here, but included under fuel combustion
activities in Section 1A. CO2 from vegetal or biomass
burning is noted for information purposes, but is not
included in the inventory total, since it is assumed that
a roughly equivalent amount of CO2 is removed by
re-growth of the next crop. The following sub modules
are included in this category: Cereals, Pulses, Tubers
and roots, Sugar cane and Other.
Other (4G): This includes other sources in the Agriculture
sector not covered by any of the other categories that may
be relevant in certain countries.
4.3.1 CHOICE OF METHOD
Enteric fermentation (4A): Tier 1 and Tier 2 methods are
provided for this category. Tier 1 consists in determining
the number of animals in each group, and multiplying
the figure by an emission factor. The Tier 2 method (for
cattle only, although a Tier 2 method for sheep was
also provided by the IPCC good practice guidance) uses anenhanced characterization of livestock population, which
results in an estimation of the average annual feed intake
for every group of animals, which is in turn used for
calculating the emission factor.
Manure management (4B): For CH4 emissions, the IPCC
Guidelines provide both a Tier 1 and a Tier 2 method.
Both tiers use an emission factor that is combined with
the number of animals in each category to obtain the
amount of emissions. Tier 1 requires livestock population
data by climate region and uses default emission factors,
whereas Tier 2 estimates the emission factor from manure
characteristics (volatile solids excreted, maximum CH4
production capacity, and methane conversion factor).
Tier 2 also requires detailed information on animal
characteristics and the manner in which the manure
is handled.
For N2O only a Tier-1 method is provided, which involves
five steps:
1) Livestock characterization;
2) Determination of total nitrogen (N) excretion rate
per head for each livestock category;
3) Determination of the fraction of N excretion that
is managed in each manure management system;
4) Determination of an emission factor for each
manure management system;
5) Calculation of emissions by multiplying activity
data by emission factors.
Rice cultivation (4C): The IPCC Guidelines provide only one
method for CH4 from rice production. It uses annual
harvested data (broken down by rice ecosystem or water
management type) and use of organic amendments and
soil types as activity data. Emission factor is calculated by
first estimating a basic factor for continuously flooded
fields without organic amendments, which is then scaled
to account for several production characteristics (i.e.
cropping practices, use of multiple crops, ecosystem type,
water management regime, addition of organic
amendments, and soil type).
Agricultural soils (4D): The IPCC Guidelines provide
one method for direct, and one for indirect, N2O emissions
from agricultural soils. No methods are provided
for CH4 emissions or removals, or for N2O removals by agricultural soils.
For direct N2O emissions due to N inputs to soils (synthetic
fertilizers, animal manure, use of N-fixing crops, incorporation
of crop residues into soil and N mineralization in organic
soils), the IPCC Guidelines provide a Tier 1 method (later
classified into Tier 1a and Tier 1b by the IPCC good
practice guidance). Two emission factors are required for
this method, one to account for emissions from N inputs,
and another to account for N mineralized from organic soil
cultivation. Regarding activity data, several parameters
need to be estimated: annual use of synthetic fertilizers,
annual use of manure, amount of N fixed by crops, amount
of crop residues returned to soil, and area of organic soils
cultivated annually.
16Source: CGE GHG Inventory Handbook (Non-Annex I), Agriculture Sector, page 10.
7/26/2019 09 Resource Guide3
http://slidepdf.com/reader/full/09-resource-guide3 26/36
SECTOR-SPECIFIC METHODOLOGIES
24
UNFCCC RESOURCE GUIDE
MODULE 3: NATIONAL GREENHOUSE GAS INVENTORIES
For indirect N2O emissions, the IPCC Guidelines describe
how to estimate emissions from three sources:
a) Volatilization of applied synthetic fertilizer and
animal manure N, and its subsequent atmospheric
deposition as NOX and NH4;
b) Leaching and runoff of applied fertilizer and
manure N;
c) Discharge of human sewage N into rivers or estuaries.
A Tier 1 method (later classified into Tier 1a and Tier 1b
by the IPCC good practice guidance) is provided for each
of these sources.
Prescribed burning of savannas (4E): A simple method is
provided in the IPCC Guidelines, based on estimation
of activity data (the area burned annually and biomass
burned) and emission ratios for CH4, CO, N2O and NOX.
Field burning of agricultural residues (4F): The IPCC method
for non-CO2 gases from burning of agricultural residues
is similar to that for burning of savannas, consisting of the
multiplication of activity data by emission ratios.
Other (4G): Varies depending on source.
4.3.2 CHOICE OF ACTIVITY DATA
In many cases, the main barrier to elaborate an accurate
inventory is the availability of activity data. Many Parties
do not have institutional arrangements to systematically
collect and regularly publish the activity data that the IPCC
Guidelines ask for. If this is the case, it may be necessary
or the Party to improve its institutional framework, given
that the capacity FOR data collection and reporting is
important not only for the inventory elaboration, but also
for the national decision-making process in all the sectors
of the national life.
However, if there is no time and/or the Party lacks in
financial resources to overcome this deficiency in its
institutional framework, the activity data (such as animal
populations, crop surface/yield, animal population,
national consumption of nitrogen fertilizers, among others),
might be identified within the United Nations Food
and Agriculture Organization database17 which may provide
alternate activity data, allowing the Party to build up
its inventory.
When dealing with partitioning parameters (such as amount
of manure produced per animal species, N content of
manure, manure by animal waste management system,
crop/residue ratio, carbon content in crop residues,
fraction of surface burned, among others), there are two
ways to produce the values:
• The use of the IPCC default values (included in the
guidelines and the IPCC Emission Factor Database
[EFDB]), or
• National expertise.
The availability of activity data is the primary driving
factor that conditions the accuracy and reliability of
the inventory.
4.3.3 CHOICE OF EMISSION FACTOR
For Tier 1, default emission factors are used while Tier 2
emission factors are derived from available data.
4.4 LAND USE, LAND-USE CHANGE AND FORESTRY
The IPCC Guidelines provide approaches, methodologies and
technical guidance for preparing a GHG inventory for
the LULUCF sector. The fundamental basis for the inventory
methodology rests upon two linked assumptions:
i. The flux of CO2 to/from the atmosphere is equal
to changes in carbon stocks in the existing biomass
and soils,
ii. Changes in carbon stocks can be estimated by first
establishing the rates of change in land use and
the practice used to bring about the change (e.g.
burning, clear-cutting, selective cutting, change
in silviculture or management practice, etc.).
This requires the estimation of the land use in the inventory
year, conversion of forest or grasslands, and the stocks of
carbon in the land-use categories (those that are subjected
to change and those that are not).
7/26/2019 09 Resource Guide3
http://slidepdf.com/reader/full/09-resource-guide3 27/36
25
SECTOR-SPECIFIC METHODOLOGIESUNFCCC RESOURCE GUIDE
MODULE 3: NATIONAL GREENHOUSE GAS INVENTORIES
4.4.1 CHOICE OF METHOD
The IPCC Guidelines provide a default approach,
methodology and default data for a GHG inventory for
the LULUCF sector. The default approach involves
estimating the GHG inventory using four categories, namely:
• Changes in forest and other woody biomass stocks –
the most important effects of human interactions
with existing forests are considered in a single, broad
category, which includes commercial management,
harvest of industrial roundwood (logs) and fuelwood,
production and use of wood commodities, and
establishment and operation of forest plantations
as well as planting of trees in urban, village and
other non-forest locations;
• Forest and grassland conversion – the conversion
of forests and grasslands to pasture, cropland
or other managed uses can substantially change
carbon stores in vegetation and soil;
• Abandonment of croplands, pastures, plantation forests,
or other managed lands – which regrow into
their prior natural grassland or forest condition;
• CO2 emissions and removals from soils – this category
covers CO2 emissions or removals from:
i) cultivation of mineral soils,
ii) cultivation of organic soils, and
iii) liming of agricultural soils.
The IPCC Guidelines briefly describe general issues and
methodological approaches for other possible categories,
such as natural disturbances (including fire), shifting
cultivation, and flooding and drainage of wetlands. The
inventory estimates:
• CO2 emissions/removals in the above four categories;
• Immediate release of non-CO2 trace gases (CH4, CO,
N2O and NOX) from open burning of biomass from
forest clearing.
The approach, methodology and steps involved in estimating
a GHG inventory in the LULUCF sector using the IPCC default
methods are as follows:
• Step 1: The Revised 1996 IPCC Guidelines do not
provide a key category analysis approach. However,
inventory experts are encouraged to conduct key
category analysis using the Good Practice Guidance for
Land Use, Land-Use Change and Forestry (hereinafter
referred to as the IPCC good practice guidance for
LULUCF), where the LULUCF sector is compared
to other source sectors, such as energy, agriculture,
industrial processes and waste. Firstly, estimate the
LULUCF sector’s share of the national GHG inventory.
Key source/sink sector identification could be adopted
by Parties who have already prepared their initial
national communications, and have the inventory
estimates. Parties that have not prepared an
initial national communication can use inventories
prepared under other programs. Parties that
have not prepared any inventory, may not be able
to carry out the key source/sink sector analysis;
• Step 2: Select the land use categories (forest/
plantations), the vegetation types subjected to
conversion (forest and grassland), and the land-
use/management systems (for soil carbon inventory);
• Step 3: Assemble the required activity data,
depending on the tier selected, from local, regional,
national and global databases, including the EFDB;18
• Step 4: Collect emission/removal factors, depending
on the tier level selected, from local, regional,
national and global databases, including EFDB;
• Step 5: Estimate the uncertainty involved;
• Step 6: Report GHG emissions and removals;
• Step 7: Report all the procedures, equations and
sources of data adopted for the GHG inventory
estimation.
17Available at <http://faostat.fao.org/?alias=faostatclassic>.
18<http://www.ipcc-nggip.iges.or.jp/EFDB/main.php>.
7/26/2019 09 Resource Guide3
http://slidepdf.com/reader/full/09-resource-guide3 28/36
SECTOR-SPECIFIC METHODOLOGIES
26
UNFCCC RESOURCE GUIDE
MODULE 3: NATIONAL GREENHOUSE GAS INVENTORIES
4.4.2 CHOICE OF ACTIVITY DATA
Various sources of data may be used to quantify GHG
emissions in the LULUCF sector. In practice, activity data
are most commonly acquired from datasets that have
already been prepared for different purposes. When this
is done, the datasets should be combined into a unified
dataset which covers all aspects of the LULUCF category, as
defined in the IPCC Guidelines. A land-use survey may
be conducted in order to provide a national or regional
assessment while a complete mapping would yield the
most comprehensive dataset.
• Tier 1: Nationally or globally available estimates of
deforestation rates, agricultural production statistics,
and global land-cover maps
• Tier 2: Activity data defined by the country for the
most important land uses/activities. This level
requires higher resolution activity data to correspond
to specific regions and land-use categories
• Tier 3: Very high resolution data, often obtained
from a global information system (GIS) -based
(or similar) source to acquire data from a fine grid
4.4.3 CHOICE OF EMISSION FACTOR
• Tier 1: The default emission factors provided in
the IPCC Guidelines;• Tier 2: Applies emission factors defined by the
country for the most important land uses/activities;
• Tier 3: Derived emission factors from models and
inventory measurement systems
4.5 WASTE
Approximately 10 – 23 per cent (IPCC Guidelines, 2001) of
annual global anthropogenic CH4 produced and released
into the atmosphere is a by-product of the anaerobic
decomposition of landfilled waste. Wastewater treatment
may account for another 10 per cent of anthropogenic
CH4 emissions, both from domestic and industrial waste
sources. From industrial sources, pulp and paper, as
well as food and beverage, processing industries account
for most of the emissions.
4.5.1 CHOICE OF METHOD
The IPCC Guidelines provide approaches, methodologies
and technical guidance for preparing a GHG inventory for
the Waste sector. The fundamental basis for the inventory
methodology rests upon three assumptions:
i. The flux of CH4 to the atmosphere is assumed to be
equal to the sum of emissions from solid waste
disposal sites, wastewater treatment and emissions
from waste incineration (considered to be
negligible);
ii. The flux of N2O to the atmosphere is assumed to
be equal to the sum of emissions from wastewater
treatment and emissions from waste incineration;
iii. CO2 can be estimated by first establishing the
rates of organic content in waste incinerated.
This requires the estimation of the amounts and composition
of waste and wastewater produced and treated each
year, and the conditions in which the treatment is applied.
The IPCC Guidelines provide a default approach,
methodology and default data for a GHG inventory for
the Waste sector. The default approach involves
estimating the GHG inventory using three categories,
namely:
Land disposal of solid waste: The common, most important effects of human in waste production are considered
in a single broad category, which includes household,
yard/garden, and commercial/market as well as industrial
waste if it is significant.
Wastewater handling: The CH4 emissions from activities
that should be calculated separately are from: domestic
and commercial wastewater, and industrial wastewater,
including sludge streams.
Nitrous oxide from human sewage – which uses a method
developed for the Agriculture sector.
The IPCC Guidelines briefly describe general issues and
methodological approaches for other possible categories
such as waste incineration (for this category it is explained
that if the waste is used directly as fuel or converted into
a fuel, then emissions should be calculated and reported
under the Energy sector). CO2 emissions from decomposition

7/26/2019 09 Resource Guide3
http://slidepdf.com/reader/full/09-resource-guide3 29/36
27
SECTOR-SPECIFIC METHODOLOGIESUNFCCC RESOURCE GUIDE
MODULE 3: NATIONAL GREENHOUSE GAS INVENTORIES
of organic materials are assigned to the Agriculture and
Land-Use Change and Forestry sectors. It is also
recognized that no method is provided to calculate
NMVOC. The inventory contains:
• CH4 emissions from the first two categories
mentioned above;
• N2O from human sewage.
4.5.2 CHOICE OF ACTIVITY DATA
Solid waste generation is the common basis for data used
to quantify GHG emissions from solid waste disposal,
biological treatment, and incineration and open burning
of waste. Data collection practices are divided into
four subcategories: municipal solid waste (MSW), sludge,
industrial and other waste.
MUNICIPAL SOLID WASTE
• Tier 1: Although not mandatory, default data for
region-specific per capita MSW generation and
management practices are provided in the 2006
IPCC Guidelines, Volume 5;
• Tier 2: It is good practice to apply country-specific
data (region-specific for large countries) on MSW
generation and management practices for inventory estimation. The data may be obtained from sources
such as waste statistics, surveys, and research projects.
• Tier 3: Data can be acquired from waste-stream
analysis, by observing and analysing waste as it moves
between steps in the MSW treatment process.
This approach should be combined with high quality
country-specific data.
SLUDGE
Default data for sludge generation are not available and,
as such, country-specific data should be used to estimate
GHG emissions from sludge generation; however, this data
may also be unavailable. If no country-specific data are
readily available, the multi-tier methodology presented in
the 2006 IPCC Guidelines, Volume 6 may be applied; this
guidance uses the total amount of organically degradable
material in waste.
INDUSTRIAL WASTE
• Tier 1: Although not mandatory, default data for
industrial waste are provided in the 2006 IPCC
Guidelines, Volume 5 for some countries, countries
for which default data are not available should
use data from a country or multiple countries in a
similar situation;
• Tier 2: It is good practice to apply country-specific
data for industrial waste generation, waste
composition and management practices for inventory
estimation. The data should by collected and
divided by industry type;
• Tier 3: Data can be acquired from waste-stream
analysis, by observing and analysing waste as it
moves between steps in the MSW treatment process.
Data can be collected using surveys of collected
on a plant-by-plant basis.
OTHER WASTE
GHG emissions from other sources of waste, including
clinical waste and hazardous waste , appear to be
insignificant in most countries. Should countries wish
to include these waste sources, carbon content data
are provided in the 2006 IPCC Guidelines, Volume 5.
Carbon content data for agricultural waste can
be found in the 2006 IPCC Guidelines, Volume 4.
4.5.3 CHOICE OF EMISSION FACTOR
Emission factors are derived from the degradable
organic carbon (DOC) in waste that is accessible
to biochemical decomposition. Although not mandatory,
default DOC values are provided in the 2006 IPCC
Guidelines, Volume 5. Parties are, however, encouraged
to use country-specific values if available. Country-
specific data may be obtained by sampling at solid waste
disposal sites with analysis of the DOC within the country.
7/26/2019 09 Resource Guide3
http://slidepdf.com/reader/full/09-resource-guide3 30/36
28
UNFCCC RESOURCE GUIDE
MODULE 3: NATIONAL GREENHOUSE GAS INVENTORIES
Quality control (QC) and completeness are important not
only for the reliability of the inventory results, but also
for providing a reliable comparison from one year to the
next. The quality and completeness of the inventory
should be as high as possible, with continuous improvements
and retroactive corrections when new data become available.
Before finalizing their inventory submissions, countries
should consider the following QC and completeness issues
with regard to fuel combustion:
• Have estimates for all gases (CO2, CH4 and N2O),
source categories, and sub-source categories been
provided?
• Have emissions from all of its territory, including
territories and islands abroad been included?
• Have emissions from bunker fuels been reported
under the Memo Items section of the Summary
tables and in the sectoral reporting table for the
Energy sector?• Have all fossil-fuel-fired power plants been included
in the country’s emission estimates?
• Have emissions due to the combustion of fuels in
the iron and steel industry been reported in
the Energy sector as requested in the Revised 1996
IPCC Guidelines?
• Does the inventory avoid any double-counting or
omission of emissions from blast furnaces and
coke production (i.e. if allocated to the Industrial
Processes sector have emissions been excluded
from Energy sector)?
• Does the inventory report emissions from waste
combustion with energy recovery under the Energy
sector? Do the CO2 emission estimates from this
waste combustion exclude the fraction of biogenic
carbon in the waste?
Companies in the oil and natural gas industry often burn
unprocessed or partially processed natural gas for fuel
(i.e. non-marketable fuel). The consumption of these fuels
may not be accounted for in sectoral consumption
statistics. For instance, consumption of non-marketable
gas is much less likely to be metered and may have
substantially different carbon factors and calorific values
than marketable gas, due to greater concentrations
of impurities and heavier-than-methane hydrocarbons.
Compressor stations on gas transmission systems may
not necessarily meter the fuel they draw from the pipeline.
In these cases, fuel consumption at the compressor
stations is either estimated based on equipment duties,
or counted as normal process shrinkage. Although
not as common, similar situations can occur on oil
transmission pipelines, where product may sometimes
be drawn from the pipeline to fuel the pumps. Theft,
particularly from natural gas systems, may be a significant
unaccounted source of fuel use in some countries.
In theory, a thorough comparison of reference and sectoral
approach calculations should identify many completeness
issues. In practice, however, the energy statistics used for
both approaches tend to come from similar government
statistics, and therefore are likely to contain similar errors.
V. QUALITY CONTROL AND
COMPLETENESS

7/26/2019 09 Resource Guide3
http://slidepdf.com/reader/full/09-resource-guide3 31/36
29
UNFCCC RESOURCE GUIDE
MODULE 3: NATIONAL GREENHOUSE GAS INVENTORIES
Uncertainty estimates are an essential element of a
complete emissions inventory. Uncertainty information
is not intended to dispute the validity of the inventory
estimates, but to help prioritize efforts to improve
the accuracy of inventories in the future and guide
decisions on methodological choice.
There are many reasons that actual emissions and sinks
may differ from the number calculated in a national
inventory. Some sources of uncertainty (i.e. sampling error
or limitations on instrument accuracy) may generate
well-defined, easily characterized estimates of the range
of potential error. However, other sources of uncertainty
may be much more difficult to characterize.
Ideally, emissions estimates and uncertainty ranges would
both be derived from source-specific measured data.
Since it is not practical to measure every emission source
in this way, estimates are often based on the known
characteristics of typical sources taken to be representativeof the population. This introduces additional uncertainties,
because it must be assumed that the population of these
sources behave, on average, like the sources that have been
measured. Sometimes enough will be known about these
typical sources to determine their uncertainty distributions
empirically. In practice, however, expert judgement
will often be necessary to define the uncertainty ranges.
The pragmatic approach to producing quantitative
uncertainty estimates in this situation is to use the best
available estimates: a combination of the available
measured data and expert judgement. Detailed guidance
on how to assess uncertainties is provided in the IPCC
good practice guidance and the IPCC good practice
guidance for LULUCF.
The estimation of uncertainty uses two key statistical
concepts:
• The probability density function – the range and
likelihood of possible values;
• Confidence limits (or confidence interval) – the
range within which a value is expected to lie
for a specified probability. The IPCC Guidelines
suggest a 95 per cent confidence interval (CI).
Appropriate statistical tests should be applied, based
on the factor being examined and the data available for
assessment, with the key variable being sample size.
Annex 1 of the 2000 IPCC good practice guidance provides
some guidance on selection of statistical distribution for
uncertainty assessment, but expert judgement will often be
required. Expert judgement involves the forming of an
estimate of uncertainty by a person who has special skills
or knowledge of the particular field and often will require
both statistical and technical experts.
Upon the determination of individual uncertainties
(activity level, emission factors, and other variables
for each source category), uncertainties must be combined
in order to provide uncertainty estimates for the entire
inventory. Guidance on the combination of uncertainties
is provided in the 2000 IPCC good practice guidance.
VI. UNCERTAINTY

7/26/2019 09 Resource Guide3
http://slidepdf.com/reader/full/09-resource-guide3 32/36
30
UNFCCC RESOURCE GUIDE
MODULE 3: NATIONAL GREENHOUSE GAS INVENTORIES
According to Article 4.1 (a) of the Convention, all Parties
shall develop, periodically update, publish and make
available to the Conference of the Parties (COP), national
inventories of anthropogenic emissions by sources
and removals by sinks of all GHGs not controlled by the
Montreal Protocol, using comparable methodologies
to be agreed upon by the COP.
7.1 UNFCCC GUIDELINES FOR NON-ANNEX I
NATIONAL COMMUNICATIONS AND USER MANUAL
According to Article 12.1 of the Convention, each Party
shall communicate to the COP three elements of information:
• A national inventory of anthropogenic GHG
emissions by sources, and removals by sinks;
• A general description of steps taken or envisaged
by the Party to implement the Convention;
• Any other information the Party considers relevant to the achievement of the objectives of the
Convention.
Guidelines for the preparation of national communications
were adopted at COP 8 and are available in the annex
of decision 17/CP.8. To facilitate the use of decision 17/CP.8
and assist Parties and national experts in preparing
national reports, the secretariat developed a user manual
(Reporting on Climate Change: User Manual for the Guidelines
on National Communications from Non-Annex I Parties) 19
7.2 FINANCIAL AND TECHNICAL ASSISTANCE
Both financial and technical assistance can be provided
through the UNFCCC to ensure that non-Annex I Parties
have the necessary resources to complete accurate and
reliable national reports.
Financial assistance is provided by the Global Environmental
Facility (GEF) through its implementing agencies (such
as the United Nations Development Programme, the United
Nations Environment Programme and the World Bank).
More information on this issue is available in Module 1 of
the Resource Guide (“The Process of National Communications
from non-Annex I Parties”).
VII. NATIONAL
COMMUNICATION OF
NON-ANNEX I PARTIES
19The User Manual is available at <http://unfccc.int/national_reports/non-annex_i_natcom/guidelines_and_user_manual/items/2607.php>.
7/26/2019 09 Resource Guide3
http://slidepdf.com/reader/full/09-resource-guide3 33/36
31
UNFCCC RESOURCE GUIDE
MODULE 3: NATIONAL GREENHOUSE GAS INVENTORIES
The UNFCCC secretariat has produced an Excel-based
software program to facilitate the task of including
the inventory sectoral tables and worksheets in national
communications. The software is designed to be used
alongside decision 17/CP.8 to assist non-Annex I Parties
in the compilation of their national GHG inventories
and in the preparation of their national communications.
In order to be as flexible as possible, the software
incorporates all the elements that a national inventory may
contain. It can also aid the process of documenting
source-by-source information, as well as archiving data for
several years.
The GHG inventory software is designed in seven modules,
and also has an initialized routine, and an overview. All
worksheets have protected cells, so that only cells requiring
user input may be changed.
The software is to be used in conjunction with:
• Decision 17/CP.8;
• The Revised 1996 IPCC Guidelines;
• The IPCC good practice guidance for LULUCF
(where appropriate).
The use of the software results in:
• Complete national GHG inventory reports;
• Completed tables to be included in national
communications.
Accuracy:
• The software uses Tier 1 (lowest accepted accuracy)
methodologies for estimating GHG emissions and
removals.
The UNFCCC has prepared a complete user manual to
provide support for users of the non-Annex I GHG inventory
software. The manual, which is available to the public
on the UNFCCC website, provides introductory information
about the software as well as step-by-step instructions for
completing each module.
VIII. UNFCCC NON-ANNEX I
GREENHOUSE GAS
INVENTORY SOFTWARE20
20The latest version is 1.3.2 and is available at <http://unfccc.int/resource/cd_roms/na1/ghg_inventories/index.htm>.

7/26/2019 09 Resource Guide3
http://slidepdf.com/reader/full/09-resource-guide3 34/36
32
© 2009 UNFCCC
United Nations Framework Convention on Climate Change
All rights reserved
This publication is issued for public information purposes and is not an official text
of the Convention in any legal or technical sense. Unless otherwise noted, all materials
may be freely reproduced in part or in full, provided the source is acknowledged.
For further information contact
Climate Change Secretariat (UNFCCC)
Martin-Luther-King-Strasse 8
53175 Bonn, Germany
Telephone +49. 228. 815 10 00
Telefax +49. 228. 815 19 99
Email [email protected]
www.unfccc.int
Produced by the Financial and Technical Support Programme of the UNFCCC
Art direction and design: Heller & C
Printing: Color Gruppe, Munich
Paper: Classen-Papier Z-Script*
* Recycled paper

7/26/2019 09 Resource Guide3
http://slidepdf.com/reader/full/09-resource-guide3 35/36

7/26/2019 09 Resource Guide3
http://slidepdf.com/reader/full/09-resource-guide3 36/36
Produced by the Financial and Technical Support Programme of the UNFCCC.


