1
Precautionary Hoarding of Liquidity and Inter-Bank Markets: Evidence from the
Sub-prime Crisis
Ouarda MerroucheBank of England
(with Viral V. Acharya, London Business School)
PRELIMINARY-COMMENTS WELCOME
5 September 2008
FS252347
2
Importance of money markets
• Money markets lubricate credit flows in the economy– Well-functioning inter-bank markets ensure that liquidity travels to the
place where it is needed the most
– Central Banks, through their monetary policy operations (reserve requirements, averaging, and corridors) can target interest rates
• Conversely, a freeze in the money markets can– Impair or stagnate lending to the real sector
– Force Central Banks to undertake massive liquidity operations, possibly undertaking credit risk in the process
• This paper– View of money markets from the lens of “precautionary liquidity”
3
Liquidity hoarding and the freeze
• FT 12 August 2007: “Scramble for cash reflects fears for system”
• FT 26 March 2008: “Hoarding by banks stokes fear over crisis”
• FT 19 May 2008: “Loans to banks limited despite market thawing”
“ It is unclear to what extent hoarding of liquidity reflects a genuine need to stem rising losses, and to what extent it reflects an extremely precautionary behavior driven by high uncertainty…”
– Marco Annunziata, chief economist at UniCredit bank
4
Questions
• What is the impact of precautionary liquidity hoardings of banks on inter-bank markets? – The issue of reverse causation
• Can one establish that liquidity hoardings are indeed precautionary in nature?
• Does the variability in inter-bank rates induced by liquidity hoardings matter?– What are the policy implications for Central Banks?
5
Setting
• Sterling money markets – Overnight and 3-month secured and unsecured
– Rates as well as volumes
• Reserve balances of large, settlement banks – A good measure of daily liquidity
– Can add collateral to get a measure of total liquidity
• Payments and settlements activity– CHAPS
• Bank-level distress and funding liquidity stress
• Bank-level household and corporate lending rates, volumes
6
Tiered Structure of the Markets
• 400 banks active in the UK
• 15 direct participants in the large-value payment system (CHAPS) i.e. settlement banks
• Tiered structure reflected in money market activities
– Top 4 first-tier clearers intermediate liquidity – Horizontal flow at first-tier + Vertical flow between second-tier
and first-tier – Limited horizontal flow of liquidity at the second tier
7
Monetary Policy Framework
• No requirement to hold reserves (voluntary) i.e. choice of reserves targets (limited by a ceiling)
• 1 Month maintenance period
• Remuneration at policy rate
• Zero percent on average reserves above 101% of target. Equivalent penalty for average reserves below 99%
• Liquidity provided by weekly OMO (Thursdays)
8
Adjustments during the Crisis
• September 13th-18th 2007 OMOs: 25 % of reserves target additional liquidity injected in OMO
• September 19th: 3 months actions against wider range of collateral
• October 4th 2007: Widening of bands around target from 1% to 30 percent
• April 21st 2008: Special Liquidity Scheme
• May 8th 2008: Double reserves Target Ceiling
9
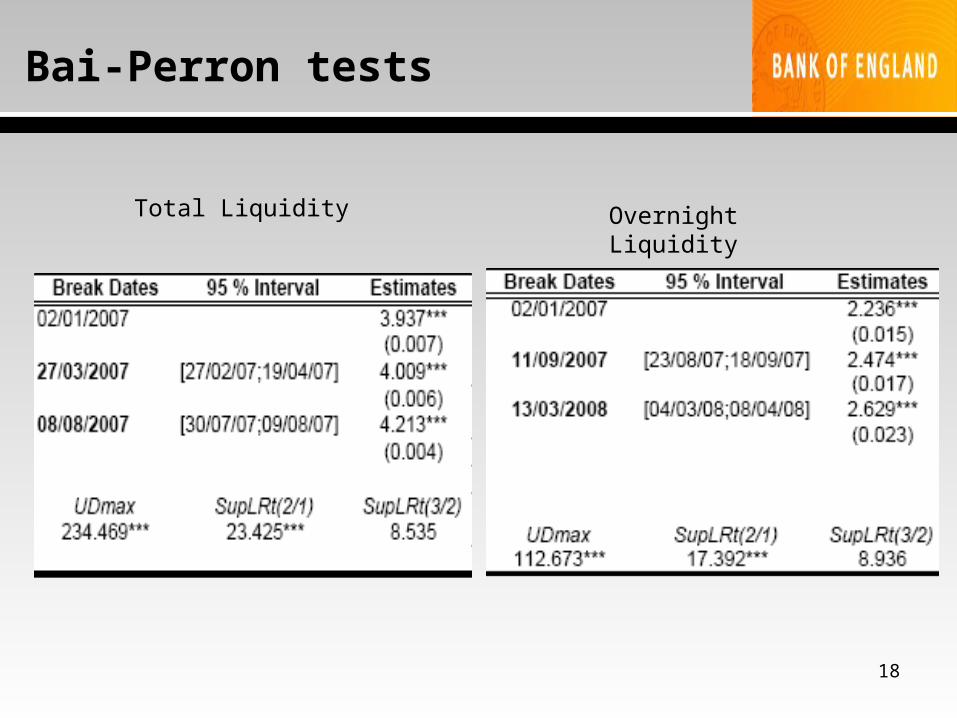
Results - I
• Regime shift in aggregate bank liquidity levels– Reserve targets have risen (August ’07, March ’08)– Also levels of daily and total liquidity
• Relationship between aggregate liquidity and rates has ALSO undergone a structural shift– Pre-crisis: Rise in liquidity caused rates to be lower
• Traditional money-market arbitrage argument– Post-crisis: Rise in liquidity caused rates to rise
• Private benefit of liquidity above the policy rate– Effect on secured as well as unsecured rates
• Unlikely due to counterparty risk on transactions
10
Theory of financial constraints
• Normal times: unconstrained banks– Reserves set primarily to meet regulatory requirements and to
some extent settlement uncertainty– Private benefit of liquidity relatively low– If reserves increase, banks “release” them pushing rates down
towards the policy rate
• Crisis times: banks are funding-constrained– Banks build up reserves for precautionary reasons
• Other than settlement uncertainty or more responsively so– Private benefit of liquidity relatively high– If reserves increase, banks “release” them ONLY IF return on
liquidity exceeds the private benefit
11
Revised arbitrage condition
• Inter-bank rate = Policy rate + Liquidity premium
• Implications– Should apply to secured as well as unsecured as liquidity
premium is about opportunity costs, not counterparty risk– Liquidity premium induces an additional source of uncertainty in
spread of inter-bank to policy rate– Unlikely due to differences in collateral– Contagion:
• Likely to affect ALL borrowing banks • Liquidity hoarding entails withdrawals elsewhere (other
banks, households, corporations)
12
Results - II
• Bank-level liquidity hoardings appear indeed to be precautionary in nature– Larger for banks that had
• Greater losses• Larger equity price decline• Greater reliance on wholesale funding
• There is evidence of contagion – Bank-level borrowing rates increase with liquidity hoardings of
other banks during the crisis– Bank-level lending rates rise in response to individual inter-bank
rate of borrowing
13
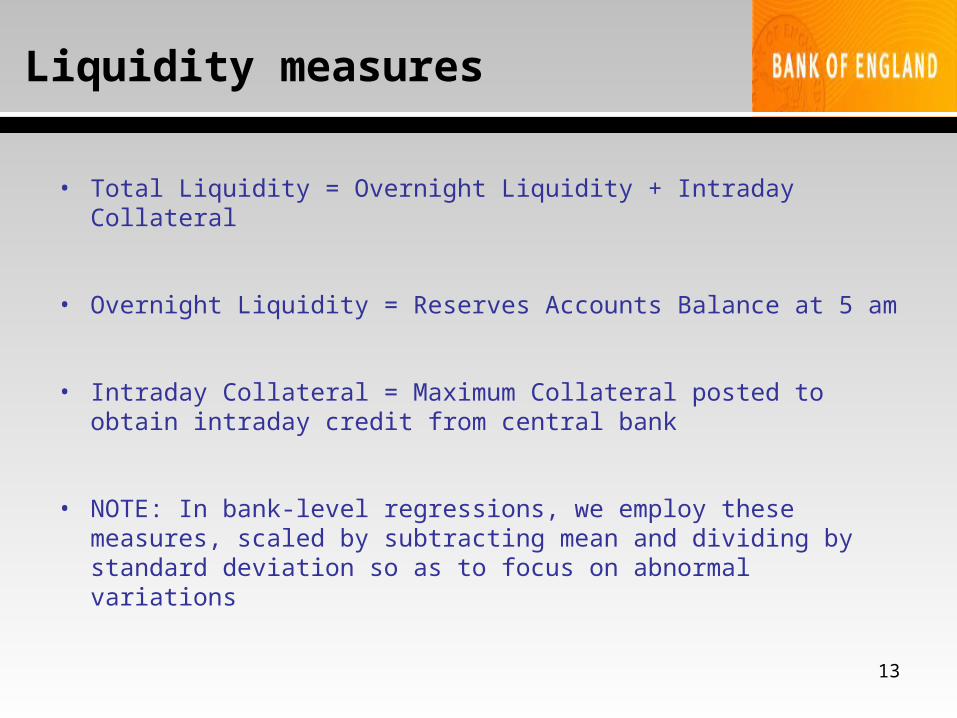
Liquidity measures
• Total Liquidity = Overnight Liquidity + Intraday Collateral
• Overnight Liquidity = Reserves Accounts Balance at 5 am
• Intraday Collateral = Maximum Collateral posted to obtain intraday credit from central bank
• NOTE: In bank-level regressions, we employ these measures, scaled by subtracting mean and dividing by standard deviation so as to focus on abnormal variations
14
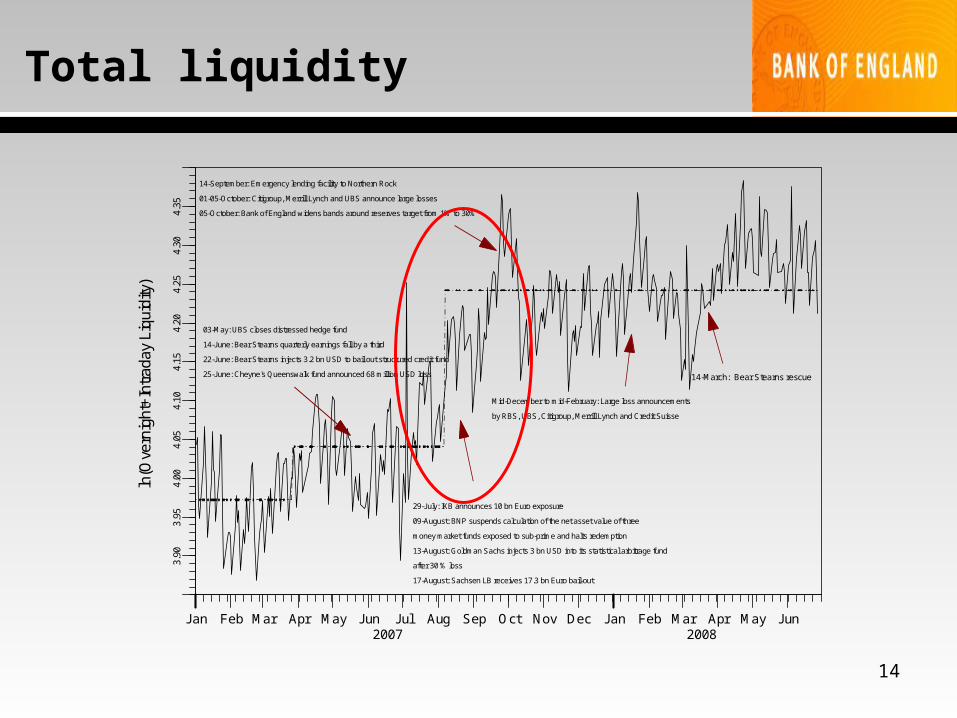
Total liquidity
ln(O
vern
ight
+In
trad
ay L
iqui
dity
)
Jan Feb Mar Apr May Jun Jul Aug Sep Oct Nov Dec Jan Feb Mar Apr May Jun2007 2008
3.90
3.95
4.00
4.05
4.10
4.15
4.20
4.25
4.30
4.35
03-May: UBS closes distressed hedge fund
14-June: Bear Stearns quarterly earnings fall by a third
22-June: Bear Stearns injects 3.2 bn USD to bail out structured credit fund
25-June: Cheyne's Queenswalk fund announced 68 million USD loss
29-July: IKB announces 10 bn Euro exposure
09-August: BNP suspends calculation of the net asset value of three
money market funds exposed to sub-prime and halts redemption
13-August: Goldman Sachs injects 3 bn USD into its statistical arbitrage fund
after 30 % loss
17-August: Sachsen LB receives 17.3 bn Euro bail-out
14-September: Emergency lending facility to Northern Rock
01-05-October: Citigroup, Merrill Lynch and UBS announce large losses
05-October: Bank of England widens bands around reserves target from 1% to 30%
Mid-December to mid-February: Large loss announcements
by RBS, UBS, Citigroup, Merrill Lynch and Credit Suisse
14-March: Bear Stearns rescue
15
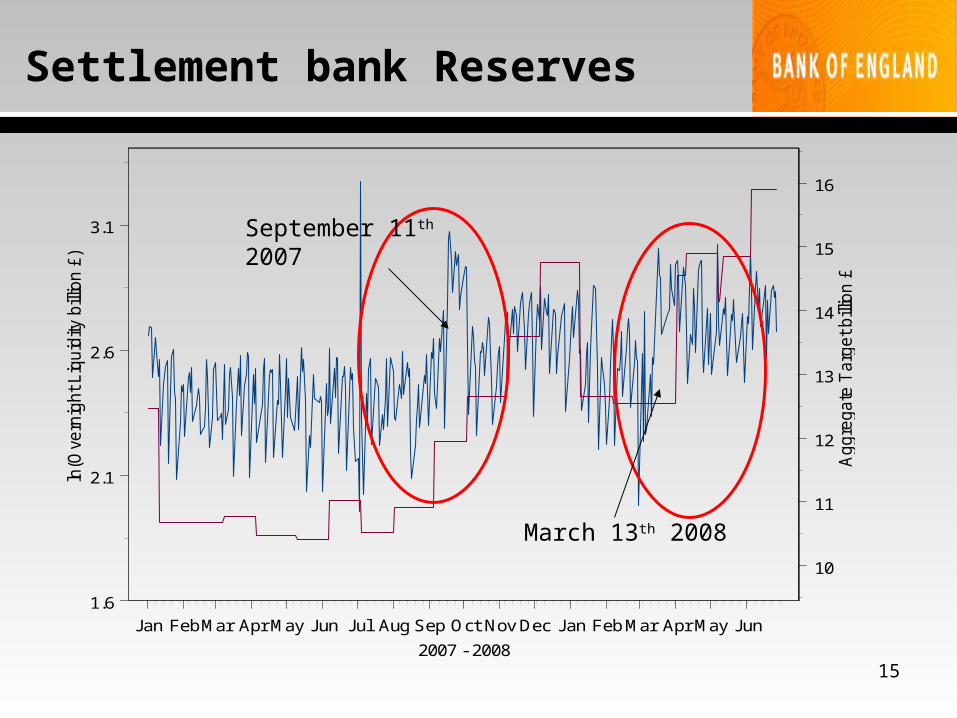
Settlement bank Reserves
Jan FebMar Apr May Jun Jul Aug Sep Oct Nov Dec Jan Feb Mar Apr May Jun
2007 - 2008
1.6
2.1
2.6
3.1
ln(O
vern
ight Liq
uid
ity b
illio
n £
)
10
11
12
13
14
15
16
Aggre
gate
Targ
et bill
ion £
September 11th 2007
March 13th 2008
16
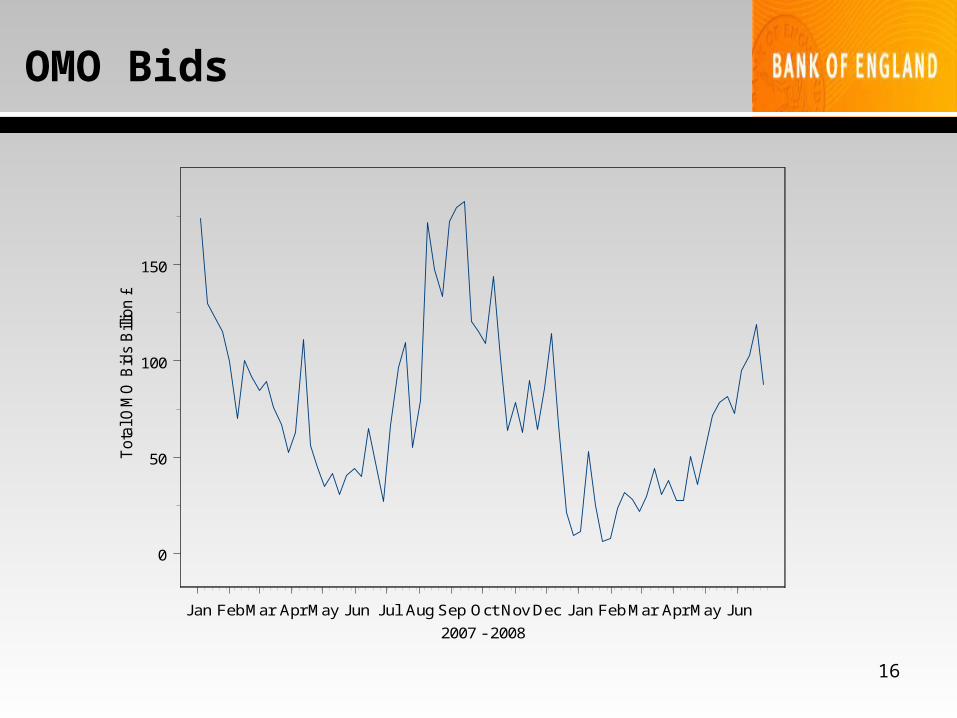
OMO Bids
Jan FebMar Apr May Jun Jul Aug Sep Oct Nov Dec Jan Feb Mar Apr May Jun
2007 - 2008
0
50
100
150
Tota
l OM
O B
ids
Bill
ion £
17
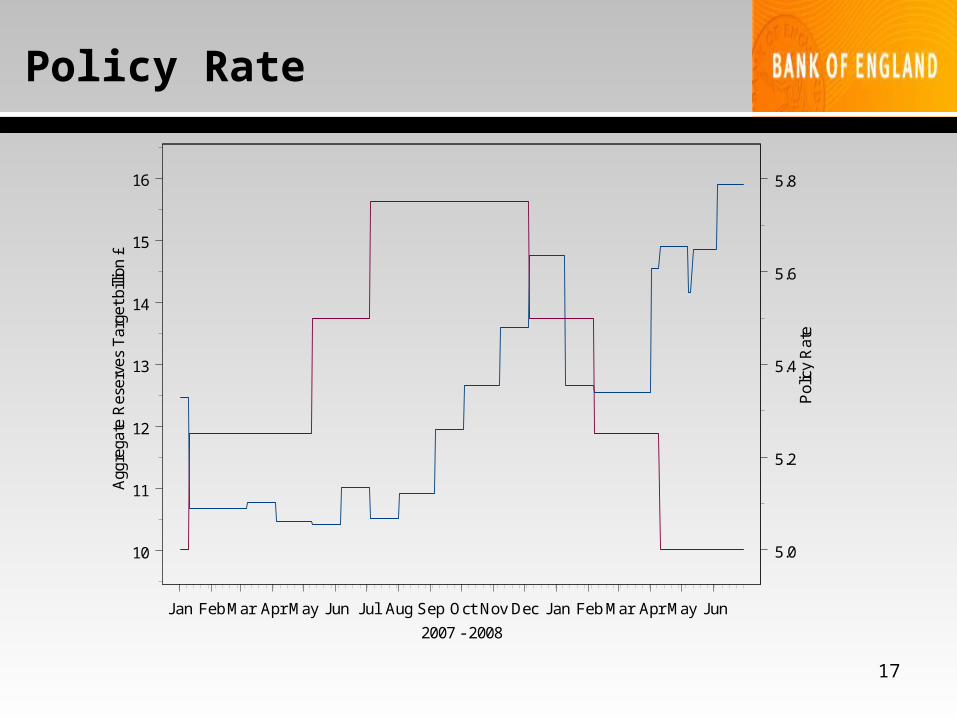
Policy Rate
Jan FebMar Apr May Jun Jul Aug Sep Oct Nov Dec Jan Feb Mar Apr May Jun
2007 - 2008
10
11
12
13
14
15
16
Agg
rega
te R
eser
ves
Tar
get b
illio
n £
5.0
5.2
5.4
5.6
5.8
Pol
icy
Rat
e
19
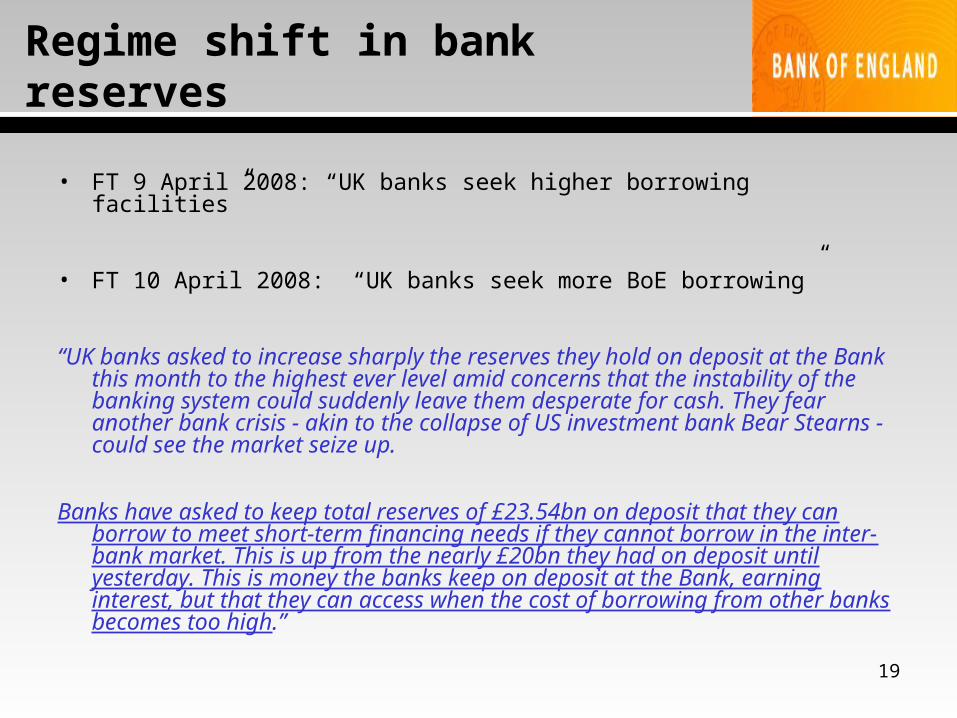
Regime shift in bank reserves
• FT 9 April 2008: “UK banks seek higher borrowing facilities”
• FT 10 April 2008: “UK banks seek more BoE borrowing”
“UK banks asked to increase sharply the reserves they hold on deposit at the Bank this month to the highest ever level amid concerns that the instability of the banking system could suddenly leave them desperate for cash. They fear another bank crisis - akin to the collapse of US investment bank Bear Stearns - could see the market seize up.
Banks have asked to keep total reserves of £23.54bn on deposit that they can borrow to meet short-term financing needs if they cannot borrow in the inter-bank market. This is up from the nearly £20bn they had on deposit until yesterday. This is money the banks keep on deposit at the Bank, earning interest, but that they can access when the cost of borrowing from other banks becomes too high.”
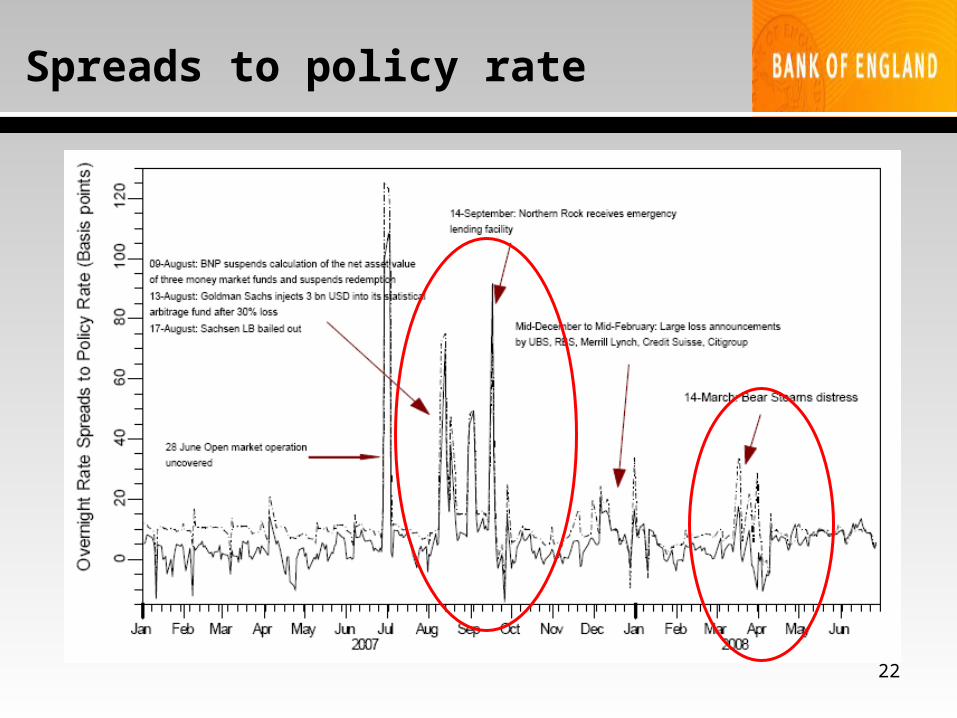
20
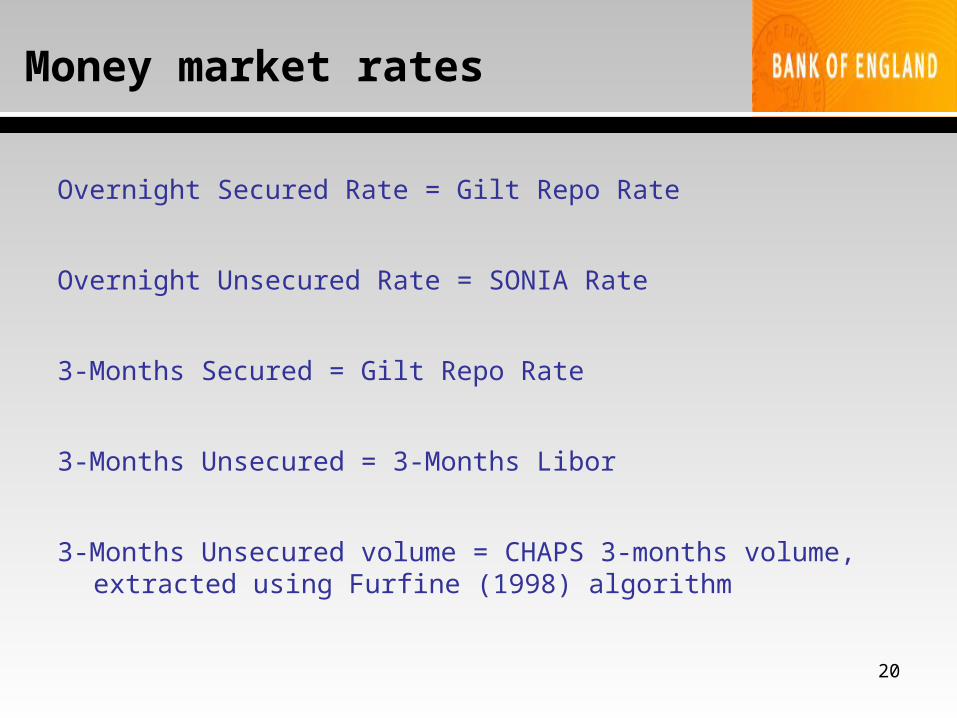
Money market rates
Overnight Secured Rate = Gilt Repo Rate
Overnight Unsecured Rate = SONIA Rate
3-Months Secured = Gilt Repo Rate
3-Months Unsecured = 3-Months Libor
3-Months Unsecured volume = CHAPS 3-months volume, extracted using Furfine (1998) algorithm
21
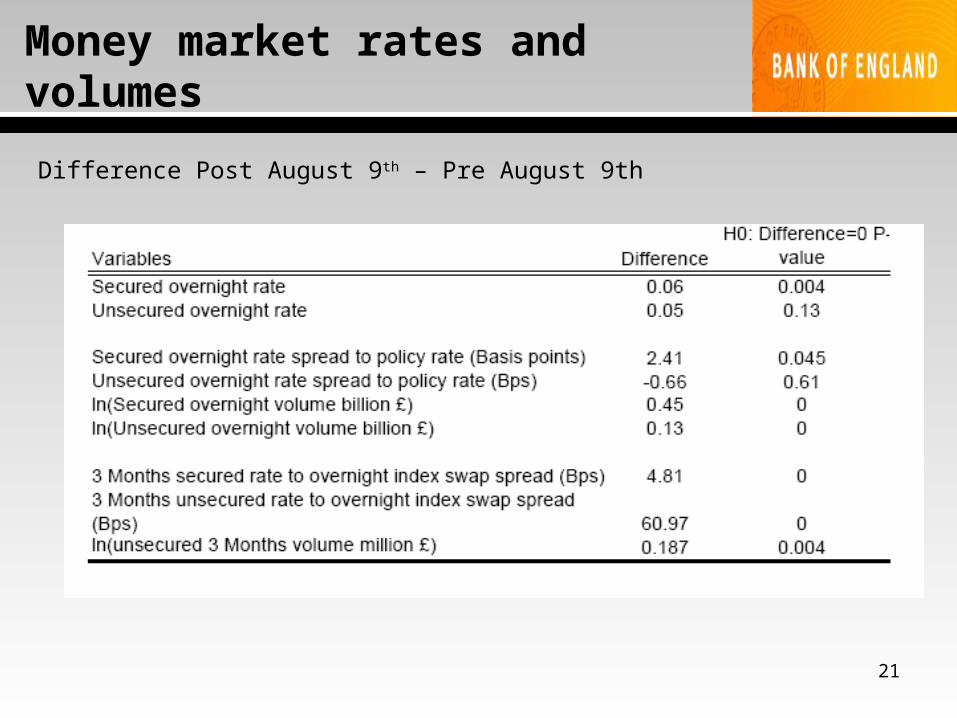
Money market rates and volumes
Difference Post August 9th – Pre August 9th
25
Identification problem
• Econometric problem– Liquidity responds to uncertainty and rate expectations– Rates may also rise due to uncertainty– Effect of liquidity on rates may thus be due to endogeneity or
omitted variable bias, rather than causal
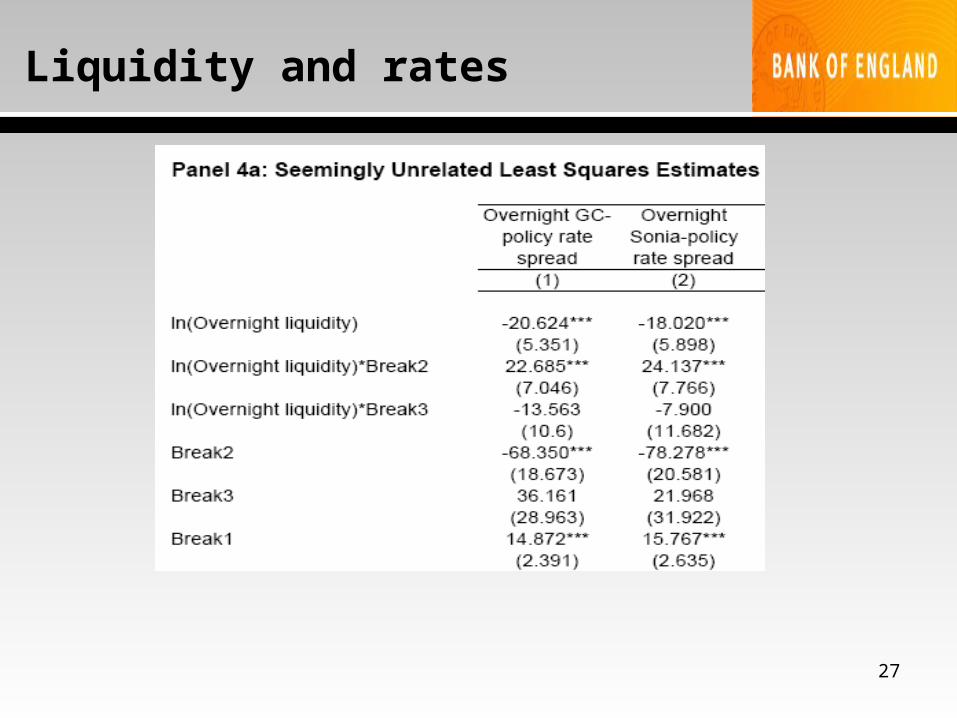
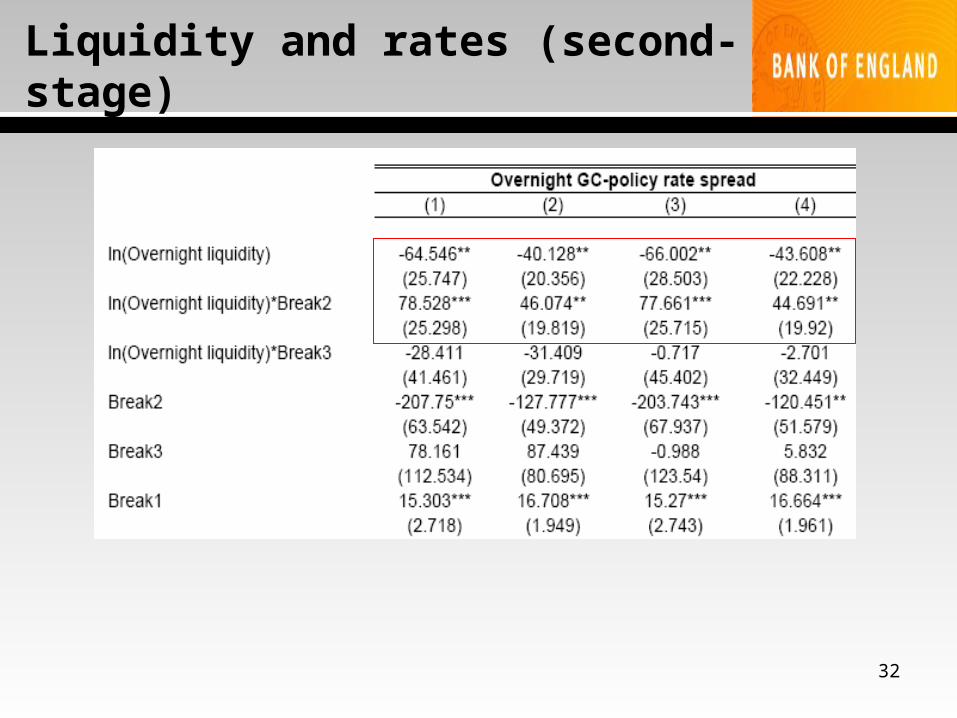
• Solutions – Examine overnight GILT secured rates– Correct for correlated shocks through SURE – Apply instrumental variable approach to correct endogeneity
biases
• We adopt all three
26
Control Variables
• OMO days
• Maintenance days fixed effects
• Adjustments to Monetary Policy Framework: (1) widening of bands; (2) higher reserves ceiling + liquidity scheme
• (Uncovered OMO on last week of June 2007)
28
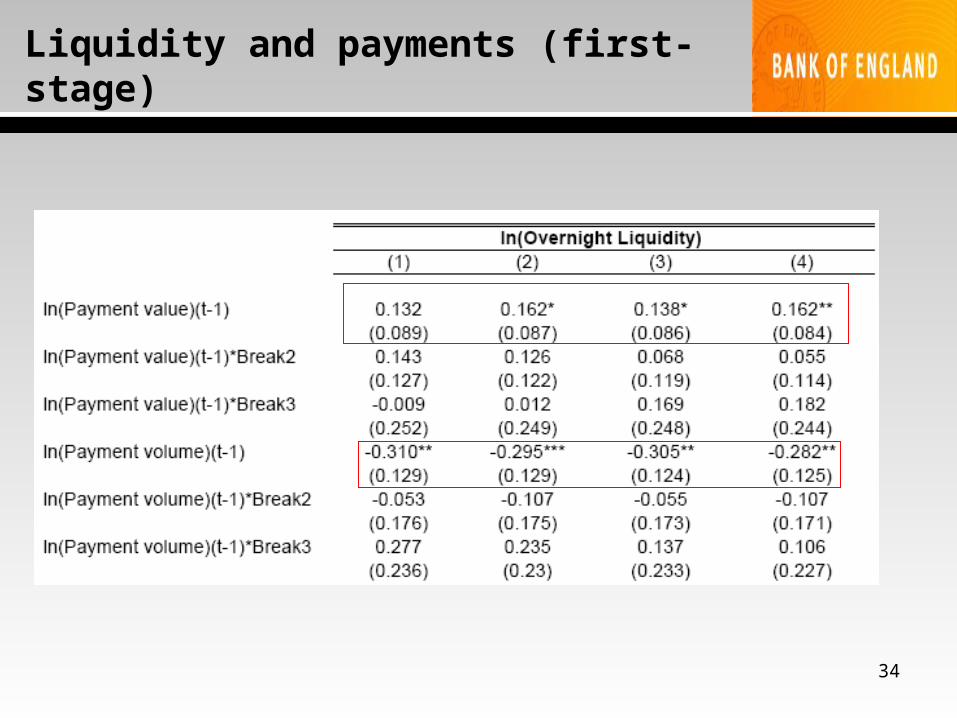
Instrument
• Lagged level of aggregate payment and settlement activity (value, volume)
• Rationale:– High settlement activity days are accompanied by higher liquidity
reserves• Buffer against greater reserves uncertainty in future
– If liquidity reserves are imperfectly adjusted on a day to day basis, there would be residual effect in liquidity reserves of past settlement activity
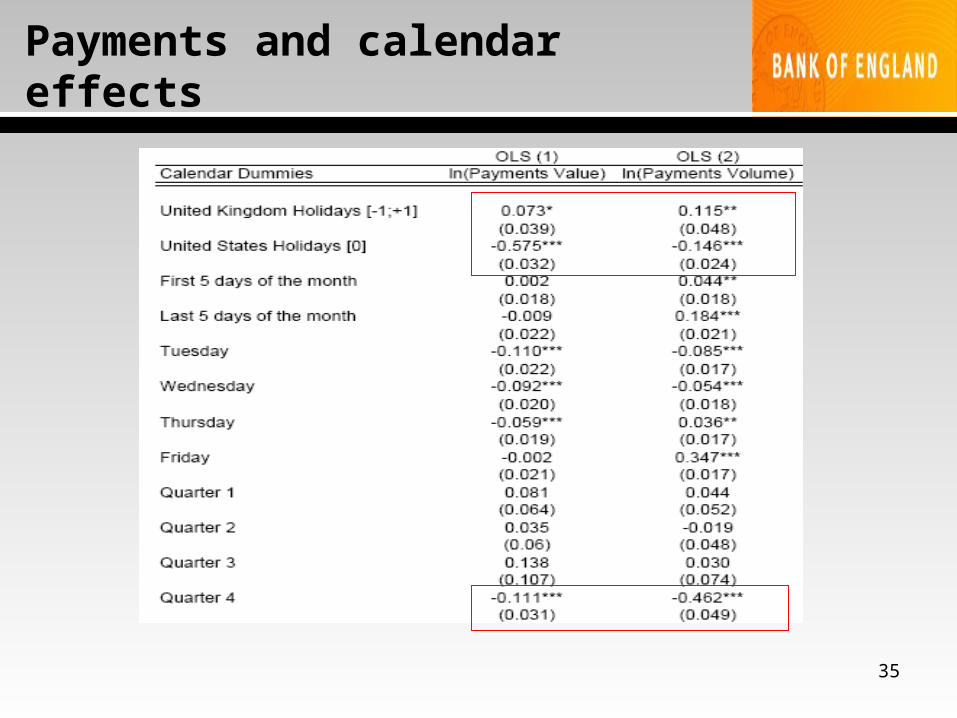
• Ultimately, an empirical question– Settlement activity driven by calendar-day effects, and thus
uncorrelated over time
29
Payment and settlement activity
CHAPS payment activity value and volume
Net of overnight inter-bank loans, in logarithm and in bank-level regressions, scaled by subtracting mean and dividing by standard deviation
High value for same volume = Larger transactions, greater risk
High volume for same value = Smaller transactions, lower risk
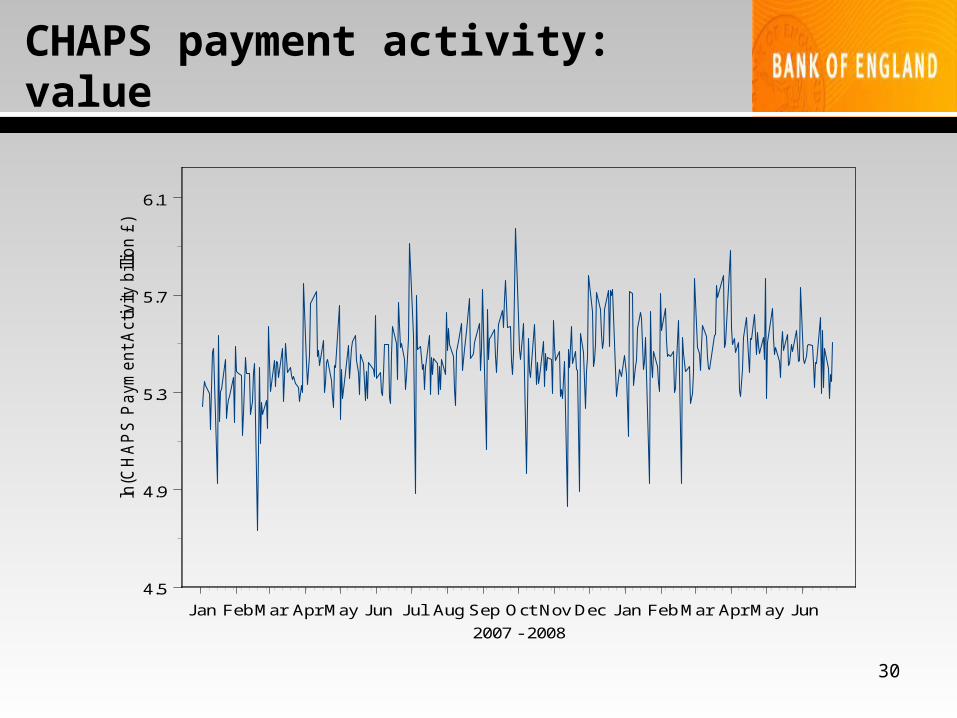
30
CHAPS payment activity: value
Jan FebMar Apr May Jun Jul Aug Sep Oct Nov Dec Jan Feb Mar Apr May Jun
2007 - 2008
4.5
4.9
5.3
5.7
6.1
ln(C
HA
PS
Paym
ent A
ctivity b
illio
n £
)
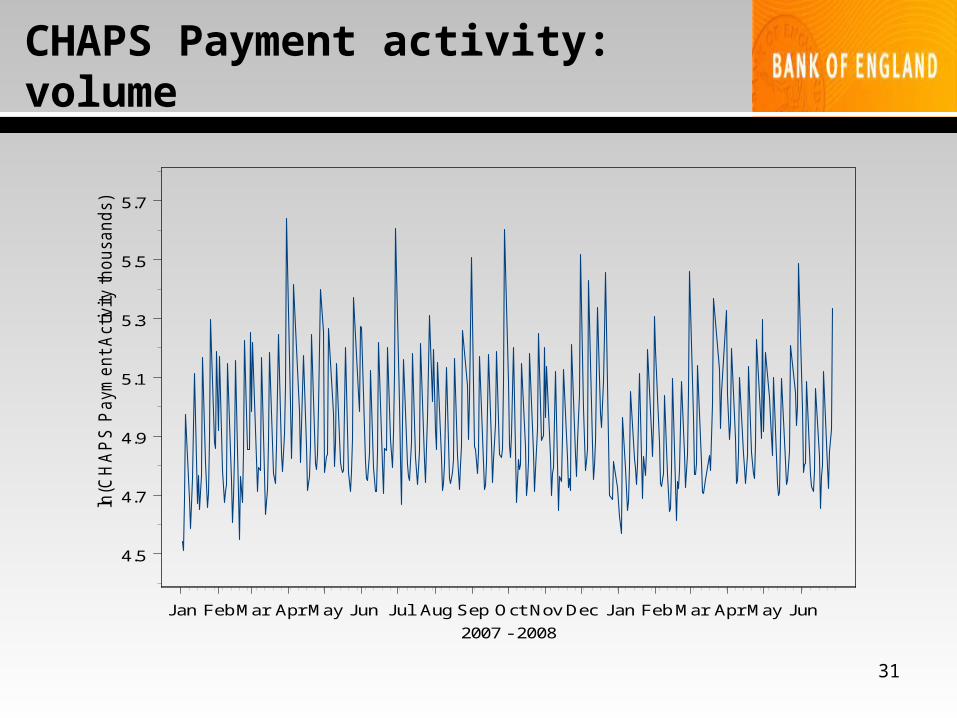
31
CHAPS Payment activity: volume
Jan FebMar Apr May Jun Jul Aug Sep Oct Nov Dec Jan Feb Mar Apr May Jun
2007 - 2008
4.5
4.7
4.9
5.1
5.3
5.5
5.7
ln(C
HA
PS
Paym
ent A
ctivity thousands)
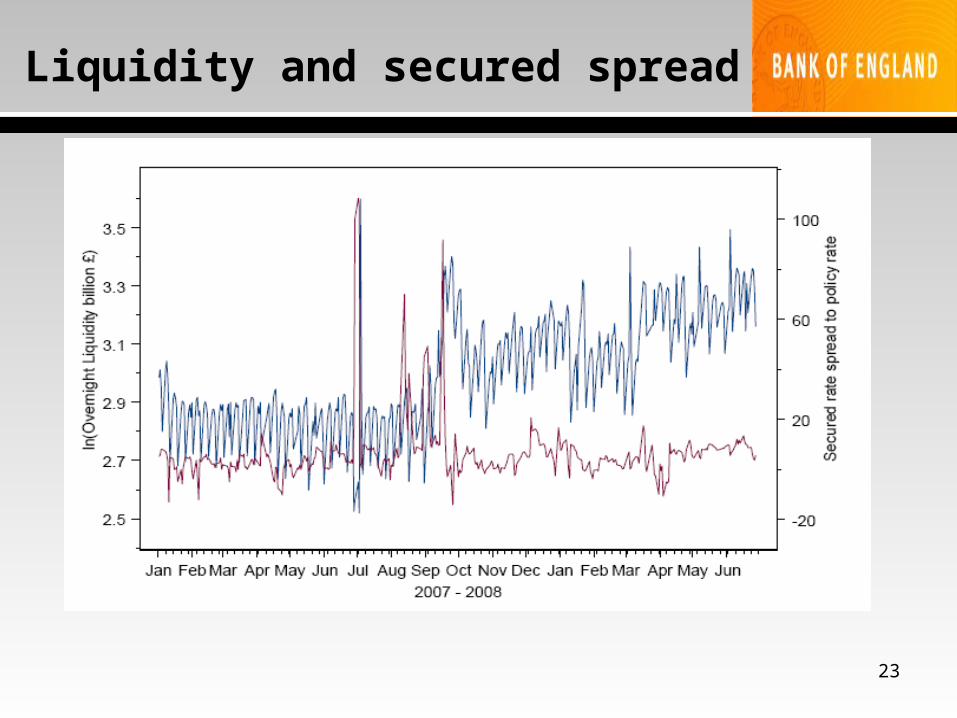
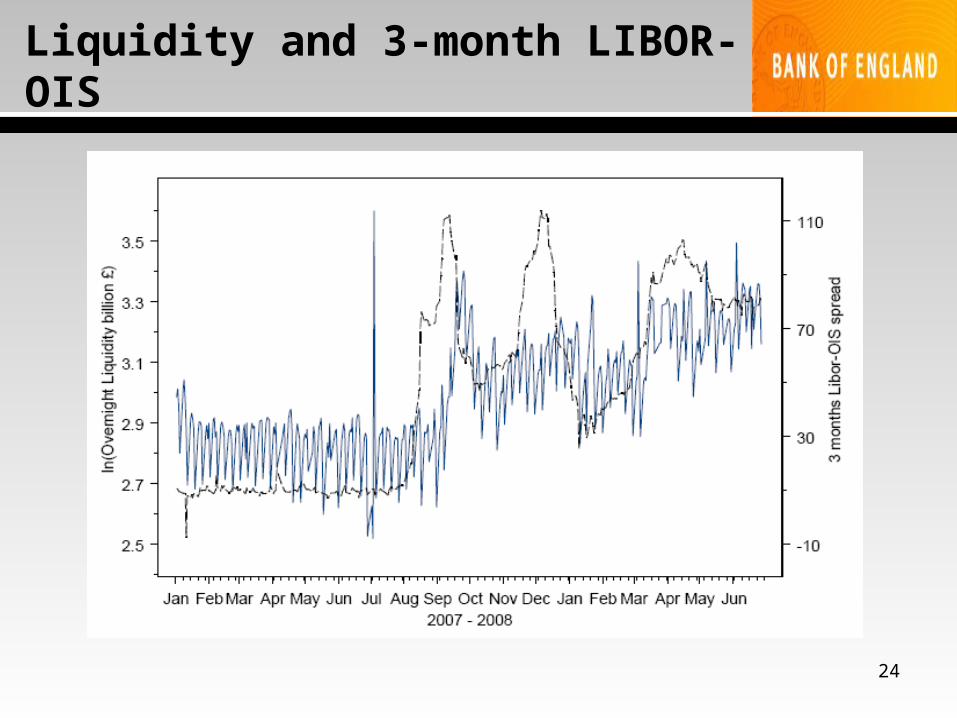
33
Economic significance
• Liquidity effect
– Pre-Crisis: a 10 per cent increase in overnight liquidity causes a 6.6 basis points decline in overnight secured spread
– During Crisis: a 1.1 basis points rise in overnight secured spread
– During Crisis: a 24 basis points rise in 3-M Libor-OIS spread
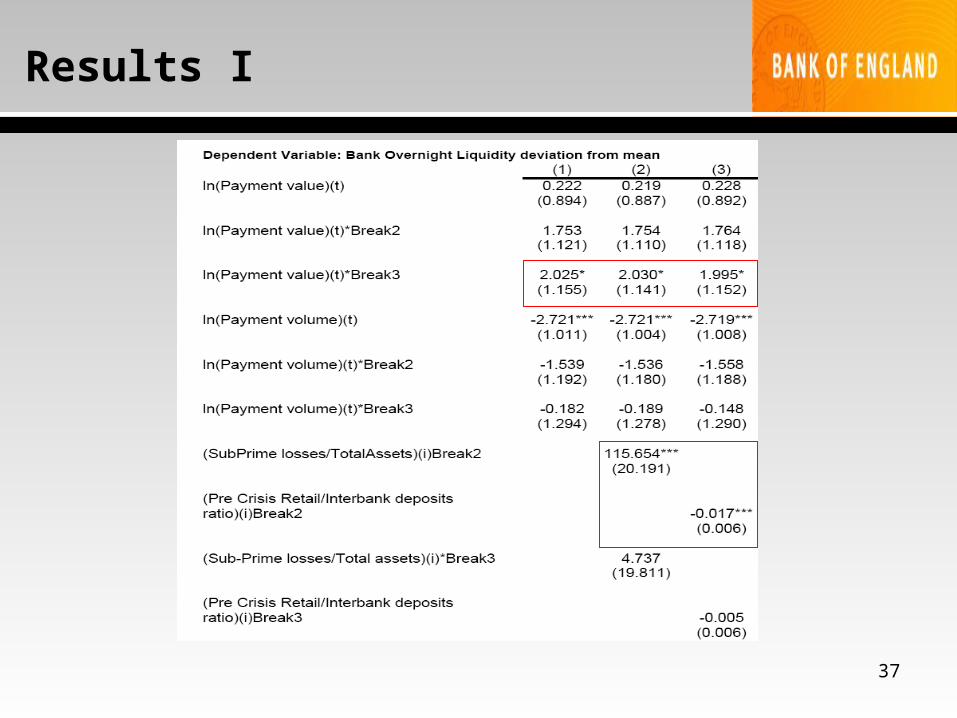
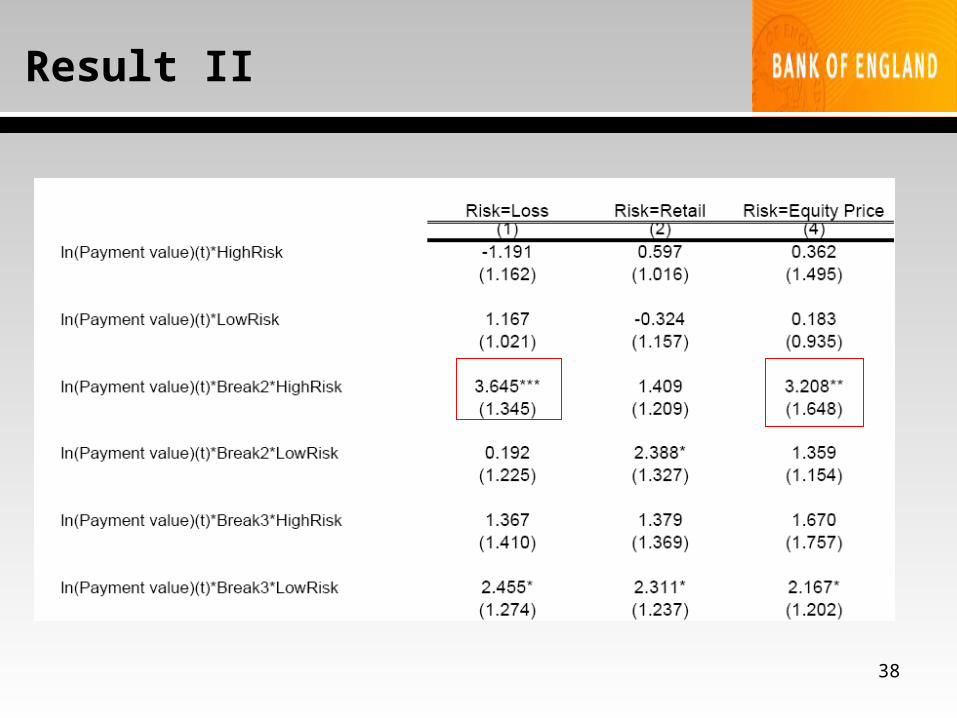
36
Precautionary nature of liquidity
• Approach 1: Assess contribution to structural break in liquidity by Loss Ratio and Retail Ratio
• Approach 2: Split sample of banks into two groups to allow heterogeneous reaction to aggregate fluctuations in payment activity– Higher and lower than median loss ratio to total assets – Higher and lower than median retail to inter-bank deposit ratio– Higher and lower than median bank equity price variation from
2006
39
Bank characteristics
• Losses Disclosed relative to Total Assets
1. Source: Bloomberg
2. Period: January 2007-June 2008
• Initial Retail over Inter-bank Deposits Ratio
1. Source: Interim reports as of June 2007
2. Period: Immediate Pre-Crisis Level
40
Economic significance
• Precautionary Hoarding
– During Crisis: a 1 percent rise in value of payment activity is associated with a 0.26 per cent rise in settlement banks’ overnight liquidity buffer
– Before Crisis: no reaction
– Banks that disclosed a loss ratio of one standard deviation above the mean increased their overnight liquidity by an additional 25 per cent of a standard deviation
41
Data on real-sector lending
• Fixed and Floating Rate – New loans to Households and PNFC – Spread to policy rate
• Growth rate of lending volume to Households and PNFC
• Source: Bank of England Statistics Department MFSD data
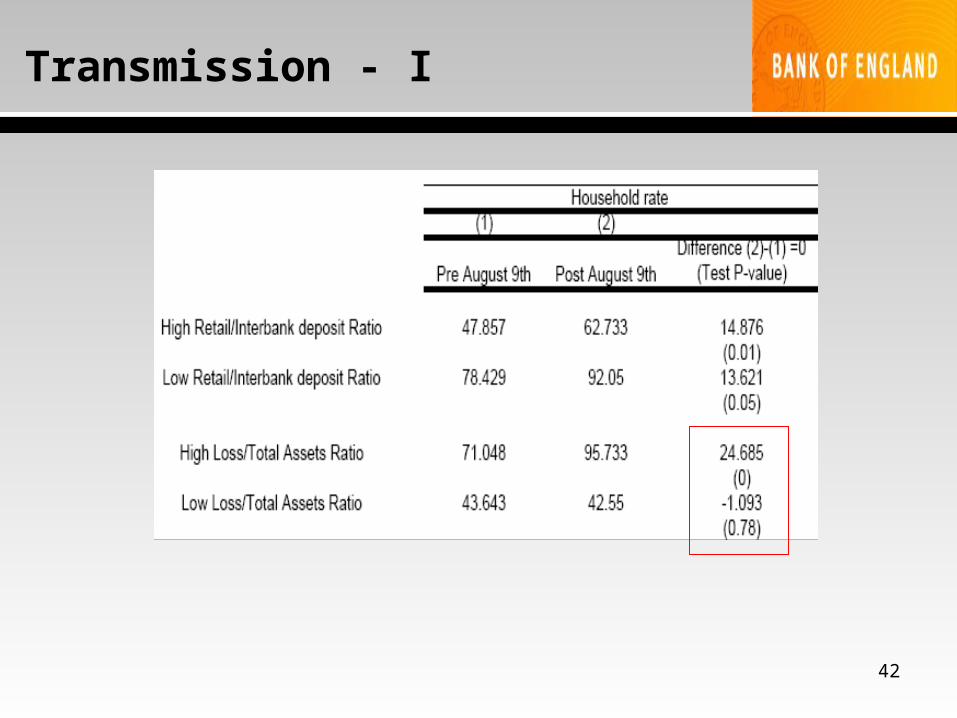
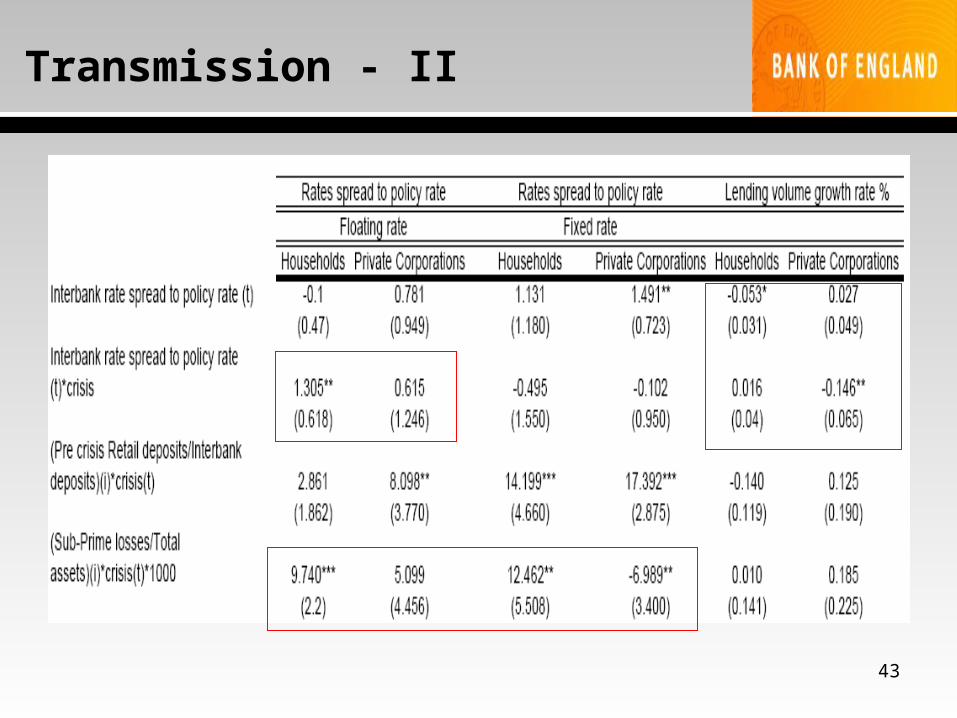
44
Economic significance
• Transmission
– Rates• During Crisis: A 1 basis point increase in secured spread
causes a 1.3 basis points increase in the retail floating rate • Before Crisis: no effect• All times: A 1 basis point increase in secured spread causes
a 1.4 basis points increase in corporate loans fixed rate
– Volumes • During Crisis: a 1 basis point rise in secured spread causes
a 0.146 % decline in growth rate corporate lending• Before Crisis: no effect
45
Conclusion
• Evidence of precautionary liquidity hoardings during the crisis, with effect on inter-bank rates (secured, unsecured)– The standard “money-market arbitrage” requires adjustment
• Why does the effect matter?– Contagion from liquidity-strapped banks to others
– Transmission through rates to households, corporations
• Policy implications– There seems at least an ex-post rationale for liquidity injections
– Can serve to eliminate liquidity-induced volatility and contagion
• Future work– Examine money-markets bilaterally (market power, cornering)
– Study term-structure effects (substitution), if any