
1
Predator identification methods in diet studies: Uncertain assignment produces 1
biased results? 2
P. G. Martínez-Gutiérrez, F. Palomares, N. Fernández 3
P. G. Martínez-Gutiérrez ([email protected]), 1 Department of Conservation 4
Biology, Doñana Biological Station (CSIC), Av. Américo Vespucio, S/N, Isla de la 5
Cartuja, 41092, Seville, Spain, and 2 PhD in Terrestrial Ecology, CREAF, Universitat 6
Autònoma de Barcelona, Building C, UAB Campus, 08193, Bellaterra, Barcelona, 7
Spain. – F. Palomares and N. Fernández, Department of Conservation Biology, 8
Doñana Biological Station (CSIC), Av. Américo Vespucio, S/N, Isla de la Cartuja, 9
41092, Seville, Spain. 10

2
Abstract 11
Knowledge on the diet is critical to understand the ecology of animal species, and also 12
to design management and conservation strategies. Nonetheless, diet studies of many 13
mammalian carnivores are usually based on indirect analyses (mostly through their 14
faeces) rather than on direct observations of their feeding behavior, which could 15
produce uncertain assignments of the predator species. Here, we tested the hypothesis 16
that differences in the diet between studies are not associated with the predator 17
identification method used by comparing results obtained in studies that used either 18
high confidence identification (HCI; i.e. stomach or colon content, or genetic or 19
chemical analyses of faeces) or low confidence identification methods (LCI; i.e. faeces 20
appearance) for jaguars and cougars. We reviewed the literature on diet of these 21
species and 1) assessed if similarity of the diet was related to the method used to 22
identify the species, and 2) the possible consequences that potential misidentification 23
of faeces could have on diet spectrums. Furthermore, we briefly summarized the most 24
reliable knowledge currently available about the diets of both species. Our analyses 25
indicated that the method used for predator identification significantly influences diet 26
similarity, with HCI studies being more similar among them than LCI studies or HCI-LCI 27
studies. Studies based on LCI methods apparently overemphasized the importance of 28
certain prey for both species, whereas other significant prey items were not detected. 29
Although approaches for a reliable identification of predators are expensive and require 30
specialized technicians and equipment, we highlight the need to invert on them in order 31
to accomplish a better ecological understanding of the feeding ecology of carnivore 32
species, which is a key factor to consider in conservation and management plans. 33

3
Introduction 34
Knowledge on the diet of mammalian carnivores is critical to understand predator-prey 35
relationships and species interactions (e. g. Gittleman and Harvey 1982, Bekoff et al. 36
1984, Sunquist and Sunquist 1989). However, obtaining data for diet studies through 37
direct observations is difficult for many carnivore species due to their elusive behavior, 38
and most studies are based on the use of indirect methods for the identification of prey 39
consumed, including the analysis of stomach and colon content and, most frequently, 40
the examination of prey remains in carnivore faeces (Mills 1996). 41
Diet analyses based on faeces requires the previous identification of the producer 42
species, which is often achieved by two general different methods: (1) the inspection of 43
morphology and appearance of faeces in the field and, eventually, other associated 44
evidences such as tracks, photo captures, scrapes, hairs and radio locations; and (2) 45
laboratory genetic or chemical analyses. The identification of the species in the field 46
often implies a high degree of uncertainty and subjectivity since it relies on the 47
experience of the observer, the degree of preservation of the faeces, the quantity and 48
quality of associated evidences and the presence of other carnivore species that may 49
deposit similar faeces (Farrell et al. 2000, Davison et al. 2002, Chame 2003). On the 50
contrary, it is generally accepted that laboratory techniques yield more accurate results 51
(e. g. Fernández et al. 1997, Kohn and Wayne 1997, Hansen and Jacobsen 1999, 52
Davison et al. 2002, Harrington et al. 2010), although it is known that they are not 53
exempt of misidentifications due to some uncertainty or variability of the processes 54
involved or to human error (Major et al. 1980, Quinn and Jackman 1994, Nauta and 55
Weissing 1996, Waits and Paetkau 2005, Witt et al. 2006, Chaves et al. 2012). Thus, 56
hereinafter traditional field methods for species identification based on appearance and 57
associated evidences will be referred as “low confidence identification (LCI)”, and 58
laboratory faecal analyses or stomach and colon content as “high confidence 59
identification (HCI)”. 60

4
Despite of its potential pitfalls, most information on mammalian carnivore diet 61
currently available comes from studies exclusively based on low confidence 62
identification methods (e. g. Harveson et al. 2000, Núñez et al. 2000, Pessino et al. 63
2001, Kuroiwa and Ascorra 2002, Bustamante-Ho 2008, Martins et al. 2008, McBride 64
et al. 2010), yet, there is a lack of knowledge about how the associated uncertainty 65
may bias results, since none study has explored the effect of predator identification 66
reliability on available diet descriptions. 67
In this study we analyzed the potential biases that may result from using low 68
confidence methods for the identification of carnivore faeces in diet studies. For this 69
purpose we reviewed the literature available on the diet of two large carnivore species, 70
the jaguar (Panthera onca) and the cougar (Puma concolor). Cougars and jaguars are 71
similar in body size, coexist over much of their range (basically along the jaguar 72
distribution), they are both generalist predators (see Seymour 1989, López-González 73
and González-Romero 1998, Laundré and Hernández 2010 for a review) and the 74
distinction of their faeces in the field is not straightforward. Furthermore, there is also 75
potential to misclassify faeces from both jaguars and cougars with several other 76
medium-large generalist carnivores with which they share distribution range, such as 77
coyotes (Canis latrans), bobcats (Lynx rufus), wolves (Canis lupus), ocelots 78
(Leopardus pardalis), jaguarundis (Puma yagouaroundi), and several fox species (e. g. 79
Farrell et al. 2000). To achieve our main objective we outlined two specific aims: 80
(1) We assessed if the similarity of the diet reported for jaguars and cougars 81
between the different studies was related or not to the method used to identify 82
these species. If the identification method had no effect, diet similarity between 83
studies would not differ significantly with the kind of pair compared, whether 84
they were HCI-HCI, LCI-LCI, or HCI-LCI. Since jaguars and cougars are 85
generalist predators with broad geographic distributions (see Seymour 1989, 86
Laundré and Hernández 2010 for a review) we also accounted for the effects of 87
geographic distances between the different studies. 88
5
(2) We evaluated the possible consequences of potential faeces misidentification 89
on the estimated diet spectrum. Misidentification of faeces would lead to omit 90
prey items that are actually consumed by the focal species (i.e. a potential 91
omission error), or to include prey items that are not actually consumed (i.e. a 92
potential inclusion error). We expected that the number of prey included in LCI 93
studies would be higher than the number of prey omitted due to a higher 94
probability of including prey not actually consumed by the focal predator of 95
interest (e. g. Fernández et al. 1997, Farrell et al. 2000, Davison et al. 2002). As 96
for the previous aim, we took into consideration in the analyses the potential 97
geographic differences in prey availability. 98
Methods 99
Data compilation and standardization 100
We reviewed diet studies of jaguars and cougars searching in the bibliographic 101
databases “Scopus”, “Google Scholar” and “Web of Science”, for the terms cougar, 102
diet, food habits, jaguar, Panthera onca, and Puma concolor. We discarded those 103
studies focusing on a single prey species or with poor discrimination and quantification 104
of the different food items. We included diet studies based on analyses of faeces, 105
stomachs and colon contents. The geographical location of each study was digitized 106
using a Geographic Information System (ARC/INFO v10.0, ESRI 2011). 107
In order to compare results from different studies, and attending to the most 108
frequent methodological approaches in publications, we considered those studies that: 109
(1) allowed calculation of the percentage of occurrence (PO) of each prey (with regard 110
to the sum of all prey items in all samples); and (2) provided information about the 111
method used for the identification of the predator. 112
We established two categories of confidence in predator identification method: 113
high confidence identification (HCI) and low confidence identification (LCI). HCI 114
methods included studies based on stomach and colon contents and on faeces 115

6
identified through genetic or biliary acids analyses. LCI methods included studies 116
based on faeces identified visually, using or no other associated evidences such as 117
tracks, scrapes, photo captures, radiolocations, etc. 118
Studies performed in the same study site and under the same category of 119
confidence identification were averaged. We also averaged data for those studies 120
informing on results for stomachs and colon content separately, and pooled data for 121
items of the same prey species differing in size (e.g. “small” vs. “large”). 122
Whenever possible we standardized the taxonomic resolution for the 123
identification of prey at the genus level. Food items for which the taxonomic level of 124
resolution was Class or Order were discarded unless they represented ≥10% of the 125
diet in at least one study or if they were present in the majority of the studies. 126
Data analysis 127
Effect of predator identification method on diet similarity 128
We tested whether differences in diet similarity between pairs of studies were 129
associated to the predator identification method using linear mixed models (LMM) 130
through the function lmer of the R package lme4 (Bates et. al. 2012, R Development 131
Core Team 2012). Trophic similarity between pairs of studies was modeled as a 132
function of the type of method used in each study of the pair, including also the 133
distance between study sites as a covariate. This covariate was included to account for 134
the fact that prey availability vary with distance between study areas. Similarity for each 135
pair was calculated using the Simplified Morisita index (Horn 1966) with the function 136
niche.overlap of the R package spaa (Zhang et al. 2010, R Development Core Team 137
2012). The resulting index ranges from 0 (completely distinct diets) to 1 (identical 138
diets). We removed data with similarity = 0 and then applied an arcsin-transformation 139
to the remaining data in order to comply with normality assumptions of LMM. The effect 140
of the difference in the predator identification method was included as a categorical 141
predictor with three factor levels: HCI-HCI, HCI-LCI and LCI-LCI. The geographical 142
7
distance was measured in km from the centroid of each study polygon using the 143
function spT.geo.dist of the R package spTimer (Bakar and Sahu 2012, R 144
Development Core Team 2012). In order to account for the effects of geographical 145
distance on trophic similarity (e. g. associated to differences in prey communities) we 146
also tested the distance effects and its interaction with the identification method. 147
Besides, we controlled for the use of the same study in the calculation of many 148
similarity pairs including the identity of each study of the pair as random intercepts in 149
LMM analyses. In order to test for the specific contribution of the predator identification 150
methods we compared the saturated model including all effects against a null model 151
including only the fixed effect of the geographic distance and the random effects of 152
study sites. Comparisons between these two models were performed using the 153
likelihood ratio test (Bolker et al. 2008) and the significance of each fixed effect in the 154
saturated model was assessed based on Markov Chain Monte Carlo sampling (Bolker 155
et al. 2008) using the R package languageR (Baayen 2011, R Development Core 156
Team 2012). 157
Prey mismatches between predator identification methods 158
We compared the prey items obtained in LCI with those obtained in HCI studies to 159
evaluate the possible inclusion and omission of prey as a consequence of potential 160
faeces misidentification using LCI methods. For that purpose, we compared each LCI 161
study with all available HCI studies, obtaining the percentages of prey items that 162
resulted from potential inclusion (i. e. exclusively found in LCI) and omission (i. e. 163
exclusively found in HCI) errors. The same was undertaken with all pairs of HCI studies 164
in order to compare the former results with the only difference that we obtained two 165
values per pair (equivalent to non-matching prey, rather than inclusion or omission) 166
since figures may be different depending of what element of the pair is used as 167
reference. If there were no errors in the identification of the predator by LCI methods, 168
we expected to find no significant difference between results obtained in HCI-LCI 169
comparisons from those obtain in HCI-HCI comparisons, which was examined by the 170
8
Mann-Whitney U test (Sokal and Rohlf 1981). To minimize the effect of differences in 171
prey availability between study sites we analyzed the data by ecoregions (Nearctic 172
and Neotropic) where large-scale patterns in prey availability are expected to be 173
more similar. In addition, we tested whether differences in percentages of exclusive 174
prey between pairs of studies were associated to distance using linear models through 175
the function lm of the R package Stats (R Development Core Team 2012). For jaguars 176
we only had one study in the Nearctic, so analyses were only undertaken for the 177
Neotropic. We assigned the ecoregions corresponded to each study site in a 178
Geographic Information System (ARC/INFO v10.0, ESRI 2011) using the digital map 179
of Terrestrial Ecoregions of the World (Olson et al. 2001). 180
In order to further control for the possible effect of differences in prey, we also 181
analyzed differences between diet studies undertaken within the distributional areas of 182
each prey item considered representative of the diet of jaguars and cougars. Thus, for 183
these analyses we first identified the set of representative prey items (PO ≥ 10% of the 184
total diet in any study excluding domestic prey and vegetable matter) for each predator 185
and delineated their distributions using the IUCN digital distribution maps (IUCN 2012). 186
Prey taken as potentially included in LCI studies were those recorded with PO ≥ 10% in 187
at least one LCI study and no recorded in any HCI study performed inside the 188
distributional area of the respective prey, and vice versa for prey potentially omitted. 189
The number of LCI and HCI studies overlapping the distribution of each representative 190
prey was obtained using a Geographic Information System (ARC/INFO v10.0, ESRI 191
2011). Differences between percentages of potential inclusion and omission of 192
representative prey for each predator were tested by the Z test (Sokal and Rohlf 1981). 193
Finally, we obtained a broad picture of the diet composition of jaguar and 194
cougar throughout their distribution ranges by analyzing which prey items were found in 195
HCI studies with PO ≥ 10%. Results were reported at the taxonomic identification level 196
originally achieved in those studies. 197

9
Results 198
Data compilation and standardization 199
We found a total of 61 studies on diet composition of jaguars and cougars published 200
between 1959 and 2013. From these studies we obtained 32 diet descriptions for 201
jaguars (with 54 food items identified) and 61 for cougars (with 79 food items 202
identified), from which only 9 descriptions (28.1% of the total) corresponded to studies 203
that used HCI methods to identify the predator for jaguars, all of them from the 204
Neotropic; and 16 for cougars (26.2% of the total), 8 in each ecoregion (Fig. 1). In most 205
cases prey items were identified to the genus level. See supplementary material 206
Appendix 1, Table A1 for a list of the studies used, and Appendix 2 for their complete 207
references. 208
Effect of the predator identification method on diet similarity 209
Full models (main effects and their interaction) were significant for both cougar and 210
jaguar (likelihood ratio test: 2 = 22.82, DF = 4, p < 0.001; and 2 = 21.11, DF = 4, p < 211
0.001, respectively), and each factor separately, i.e. predator identification method and 212
distance, also significantly affected the similarity between diet studies (Table 1). As 213
predicted, trophic similarity was higher between pairs of HCI studies and lower at 214
longer distances (Fig. 2, Table 1). 215
Prey mismatches between predator identification methods 216
For all cases, i. e. jaguar in the Neotropic and cougar in both ecoregions, the average 217
percentage of exclusive prey (i. e. mismatches between studies) was always lower 218
when comparing HCI-HCI studies than when comparing HCI-LCI studies (Table 2). 219
However, such differences were significant only for potential inclusion of prey items in 220
LCI studies for jaguars in the Neotropic (U = 5569.5, p = 0.006), and for both potential 221
inclusion (U = 3402, p = 0) and omission (U = 5826.5, p = 0.005) of prey for cougars in 222
the Neotropical region. Furthermore, when we represented the percentage of exclusive 223
prey as a function of distance between study areas, we observed a significant positive 224
10
trend in all HCI-HCI comparisons excepting for cougar’s studies in the Nearctic (Fig. 3, 225
Table 3). Nonetheless, in HCI-LCI comparisons such a response was significant for 226
inclusion of prey in LCI cougar’s studies of both ecoregions, and for omission of prey in 227
the Nearctic (Fig. 3, Table 3). The inclusion and omission of prey for jaguars did not 228
show a significant trend, and neither did the percentage of omission for cougar’s LCI 229
studies in the Neotropic (Fig. 3, Table 3). 230
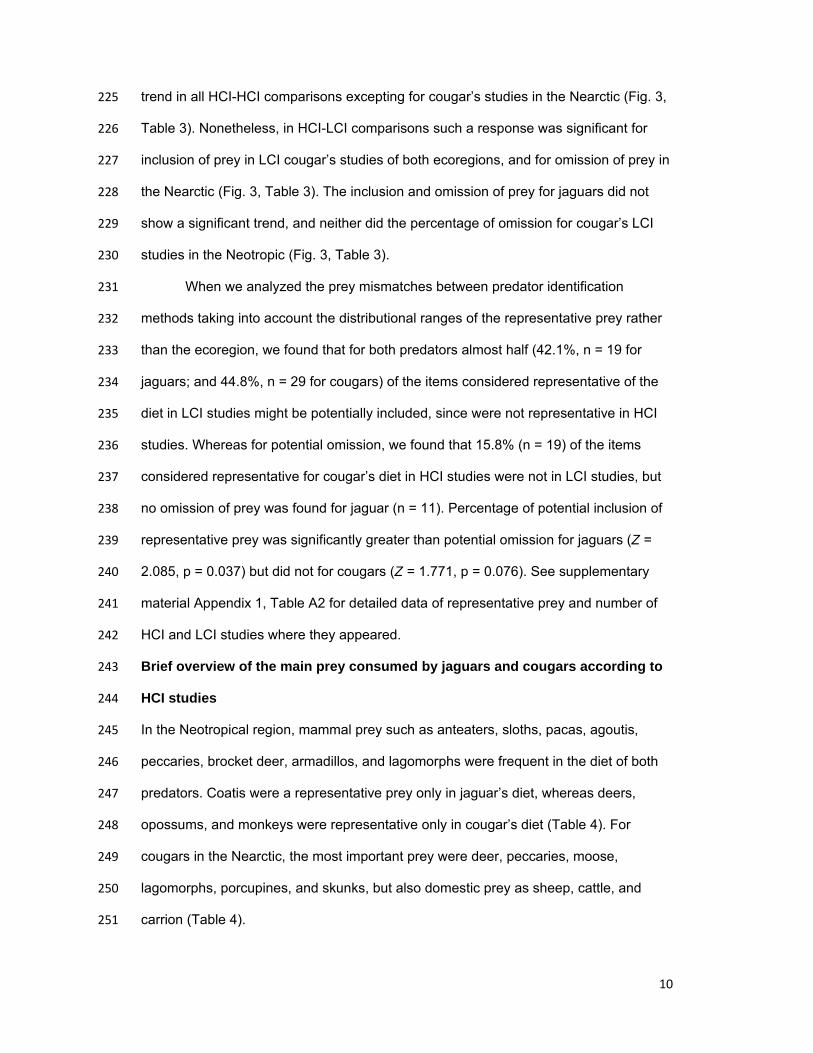
When we analyzed the prey mismatches between predator identification 231
methods taking into account the distributional ranges of the representative prey rather 232
than the ecoregion, we found that for both predators almost half (42.1%, n = 19 for 233
jaguars; and 44.8%, n = 29 for cougars) of the items considered representative of the 234
diet in LCI studies might be potentially included, since were not representative in HCI 235
studies. Whereas for potential omission, we found that 15.8% (n = 19) of the items 236
considered representative for cougar’s diet in HCI studies were not in LCI studies, but 237
no omission of prey was found for jaguar (n = 11). Percentage of potential inclusion of 238
representative prey was significantly greater than potential omission for jaguars (Z = 239
2.085, p = 0.037) but did not for cougars (Z = 1.771, p = 0.076). See supplementary 240
material Appendix 1, Table A2 for detailed data of representative prey and number of 241
HCI and LCI studies where they appeared. 242
Brief overview of the main prey consumed by jaguars and cougars according to 243
HCI studies 244
In the Neotropical region, mammal prey such as anteaters, sloths, pacas, agoutis, 245
peccaries, brocket deer, armadillos, and lagomorphs were frequent in the diet of both 246
predators. Coatis were a representative prey only in jaguar’s diet, whereas deers, 247
opossums, and monkeys were representative only in cougar’s diet (Table 4). For 248
cougars in the Nearctic, the most important prey were deer, peccaries, moose, 249
lagomorphs, porcupines, and skunks, but also domestic prey as sheep, cattle, and 250
carrion (Table 4). 251

11
According to the total number of studies that used HCI methods, armadillos 252
were the prey most widely consumed by jaguars (7 of 9 studies; representing up to 253
46% of occurrence in some studies), while pacas (6 of 8 studies; up to 58% of 254
occurrence) and deers (5 of 8 studies; up to 21% of occurrence) were the most 255
important prey for cougars in the Neotropic. In the Nearctic, deers were present in all 256
eight studies of cougars with an occurrence in the diet up to 69% (Table 4). 257
Taking into account only items identified to species level, 9 were representative 258
prey species in the diet of Neotropical jaguars, being Myrmecophaga tridactyla 259
(although only in one study) and Dasypus novemcinctus the ones which reached 260
higher percentages of occurrence (Table 4). Regarding cougars, Choloepus didactylus 261
and Cuniculus paca were the most important of the 8 prey species with PO ≥ 10%; 262
while in the Nearctic, Odocoileus hemionus and Pecari tajacu (although appeared in a 263
single study) presented the higher values of the 9 representative prey species (Table 264
4). 265
Discussion 266
Possible effects of predator identification reliability on diet studies 267
The determination of the diet of carnivores through faeces analyses is associated to a 268
level of uncertainty in the predator identification process, which may produce a bias in 269
the results. For cougars and jaguars, Fernandez et al. (1997) shown that only 38% of 270
jaguar and 30% of cougar faeces were identified correctly using subjective criteria as 271
compared with identification through bile acid analyses. Moreover, they found that 272
diameters of cougar and jaguar faeces overlapped at almost all sizes from 20 to 39 273
mm, making it difficult a morphological differentiation. In another study, Farrel et al. 274
(2000) found that 83% of faeces classified as jaguar or cougar on the basis of size 275
thresholds were actually produced by ocelots (Leopardus pardalis) or crab-eating foxes 276
(Cerdocyon thous). They concluded that using faeces size thresholds instead of DNA 277
analysis to identify a carnivore species is likely to result in misinterpretation of dietary 278
behavior. Studies in other carnivores support that high misclassification rates can be a 279

12
general source of bias in many other species. Davison et al. (2002) found that expert 280
naturalists failed to distinguish pine marten (Martes martes) and red fox (Vulpes 281
vulpes) faeces. Harrington et al. (2010), shown that none of 45 American mink 282
(Neovison vison) faeces identified by experienced surveyors in 31 study sites were 283
correctly identified, being confounded with a diversity of other species including pine 284
marten, red fox, Eurasian otter (Lutra lutra), polecat (Mustela putorius) and stoat 285
(Mustela erminea). Although these error rates are troubling, to our knowledge no 286
previous work has analyzed the effects on the results of diet studies. Our results show 287
that assuming equal confidence between the different identification methods 288
significantly influences how similar are the diets between different studies. 289
For both jaguars and cougars, similarity between diet studies that identified the 290
predator through HCI methods was higher than those using LCI methods, once the 291
effect of distance was controlled. This result supported our suspect that LCI methods 292
are including prey from predators different to the target one. Furthermore, it is 293
interesting to note that prey mismatch analyses indicated that LCI studies on both 294
species in the Neotropical region included prey items that may actually have not been 295
consumed by these predators. In the case of cougars the percentage of inclusion was 296
also influenced by the distance among sites, which is indicator of changes in prey 297
communities. We also found a significant omission of prey items in LCI studies for 298
cougars in the Neotropic, but not for jaguars, despite that the trend obtained in relation 299
to distance suggested a potential omission error. As expected, we found a significant 300
effect of distance on the percentage of exclusive prey in HCI-HCI comparisons, except 301
for cougar’s studies in the Nearctic, which might be due to similarities on prey 302
availability among sites. 303
On the other hand, we did not detect any significant difference in the inclusion-304
omission analysis for cougars in the Nearctic. Distance had a significant effect over the 305
percentage of exclusive prey, thus in this case the predator identification method could 306
not be biasing the trophic spectrum of cougars. Since cougars and jaguars overlap 307
13
their ranges mostly in the Neotropic (Seymour 1989, López-González and González-308
Romero 1998), this might be indicating that jaguar is the species which is most likely to 309
confound cougar’s faeces, as has been suggested by Fernandez et al. (1997) and 310
Farrel et al. (2000). Additionally, it could also be indicating that the diet of cougars in 311
the Nearctic is very similar to the diet of other carnivores with potentially similar faeces. 312
In fact, wolves and cougars seem to have similar diets in some areas (Kunkel et al. 313
1999, Kortello et al. 2007). 314
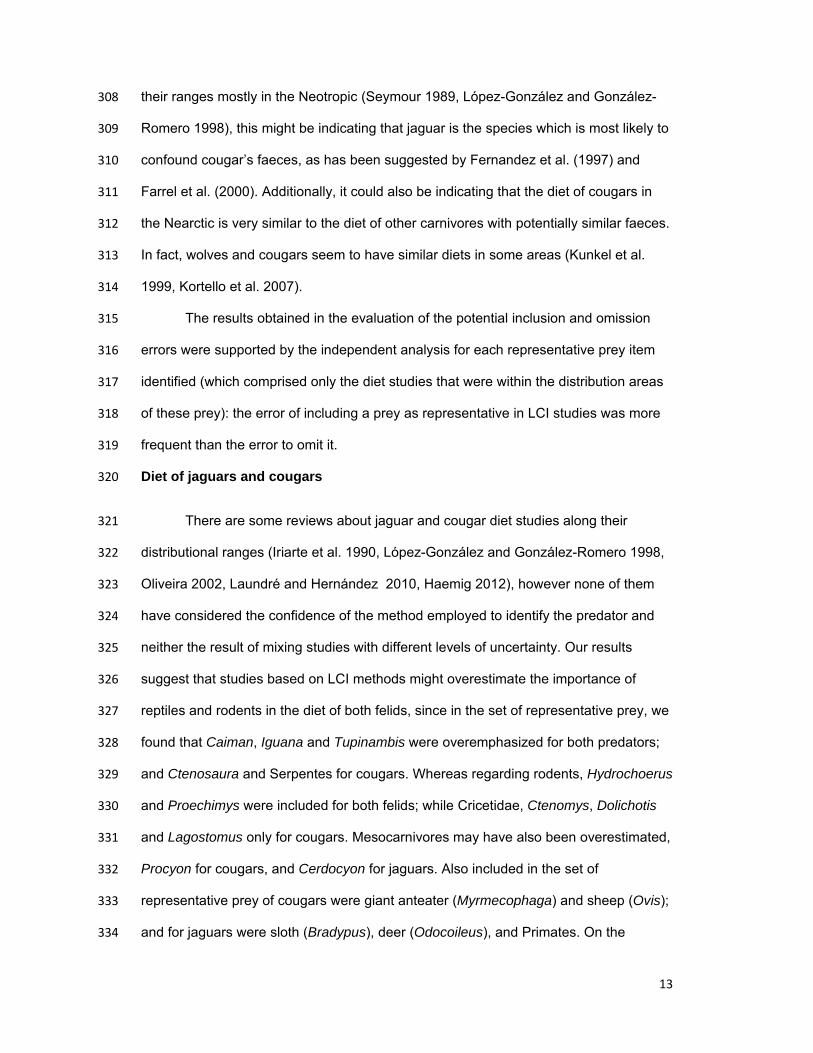
The results obtained in the evaluation of the potential inclusion and omission 315
errors were supported by the independent analysis for each representative prey item 316
identified (which comprised only the diet studies that were within the distribution areas 317
of these prey): the error of including a prey as representative in LCI studies was more 318
frequent than the error to omit it. 319
Diet of jaguars and cougars 320
There are some reviews about jaguar and cougar diet studies along their 321
distributional ranges (Iriarte et al. 1990, López-González and González-Romero 1998, 322
Oliveira 2002, Laundré and Hernández 2010, Haemig 2012), however none of them 323
have considered the confidence of the method employed to identify the predator and 324
neither the result of mixing studies with different levels of uncertainty. Our results 325
suggest that studies based on LCI methods might overestimate the importance of 326
reptiles and rodents in the diet of both felids, since in the set of representative prey, we 327
found that Caiman, Iguana and Tupinambis were overemphasized for both predators; 328
and Ctenosaura and Serpentes for cougars. Whereas regarding rodents, Hydrochoerus 329
and Proechimys were included for both felids; while Cricetidae, Ctenomys, Dolichotis 330
and Lagostomus only for cougars. Mesocarnivores may have also been overestimated, 331
Procyon for cougars, and Cerdocyon for jaguars. Also included in the set of 332
representative prey of cougars were giant anteater (Myrmecophaga) and sheep (Ovis); 333
and for jaguars were sloth (Bradypus), deer (Odocoileus), and Primates. On the 334
14
contrary, the importance of Alces, Erethizon and Mephitidae was underestimated for 335
cougar’s diet in LCI studies. 336
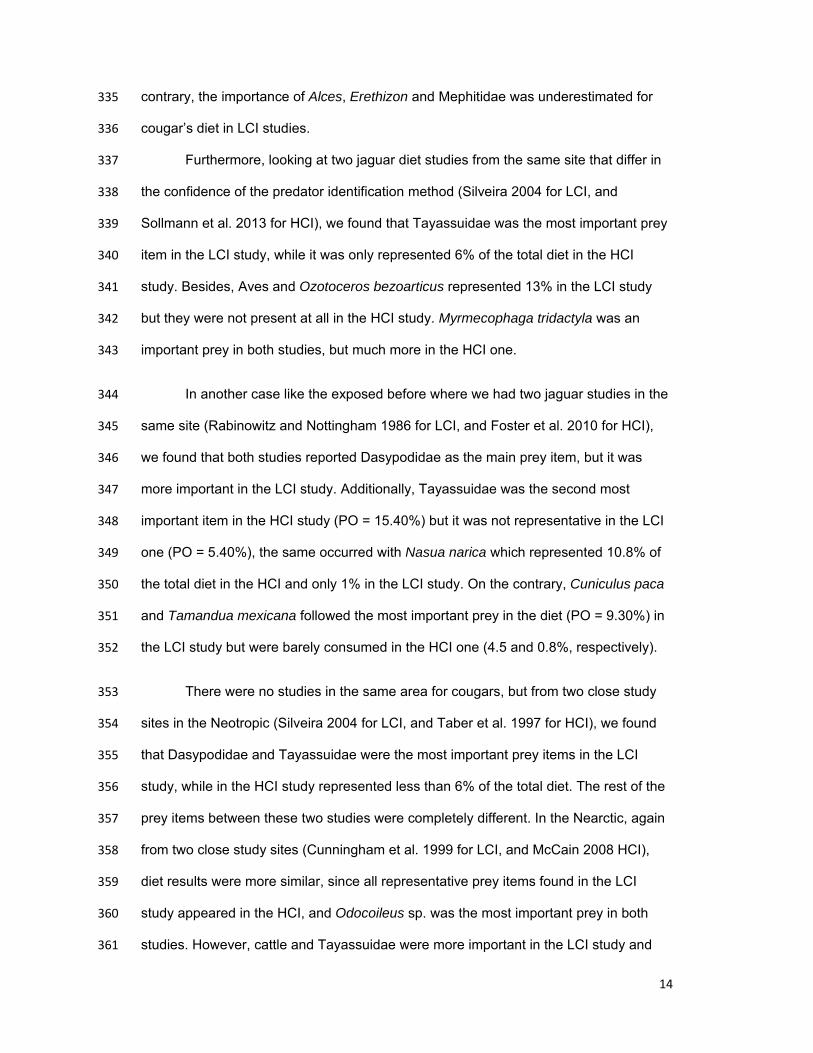
Furthermore, looking at two jaguar diet studies from the same site that differ in 337
the confidence of the predator identification method (Silveira 2004 for LCI, and 338
Sollmann et al. 2013 for HCI), we found that Tayassuidae was the most important prey 339
item in the LCI study, while it was only represented 6% of the total diet in the HCI 340
study. Besides, Aves and Ozotoceros bezoarticus represented 13% in the LCI study 341
but they were not present at all in the HCI study. Myrmecophaga tridactyla was an 342
important prey in both studies, but much more in the HCI one. 343
In another case like the exposed before where we had two jaguar studies in the 344
same site (Rabinowitz and Nottingham 1986 for LCI, and Foster et al. 2010 for HCI), 345
we found that both studies reported Dasypodidae as the main prey item, but it was 346
more important in the LCI study. Additionally, Tayassuidae was the second most 347
important item in the HCI study (PO = 15.40%) but it was not representative in the LCI 348
one (PO = 5.40%), the same occurred with Nasua narica which represented 10.8% of 349
the total diet in the HCI and only 1% in the LCI study. On the contrary, Cuniculus paca 350
and Tamandua mexicana followed the most important prey in the diet (PO = 9.30%) in 351
the LCI study but were barely consumed in the HCI one (4.5 and 0.8%, respectively). 352
There were no studies in the same area for cougars, but from two close study 353
sites in the Neotropic (Silveira 2004 for LCI, and Taber et al. 1997 for HCI), we found 354
that Dasypodidae and Tayassuidae were the most important prey items in the LCI 355
study, while in the HCI study represented less than 6% of the total diet. The rest of the 356
prey items between these two studies were completely different. In the Nearctic, again 357
from two close study sites (Cunningham et al. 1999 for LCI, and McCain 2008 HCI), 358
diet results were more similar, since all representative prey items found in the LCI 359
study appeared in the HCI, and Odocoileus sp. was the most important prey in both 360
studies. However, cattle and Tayassuidae were more important in the LCI study and 361
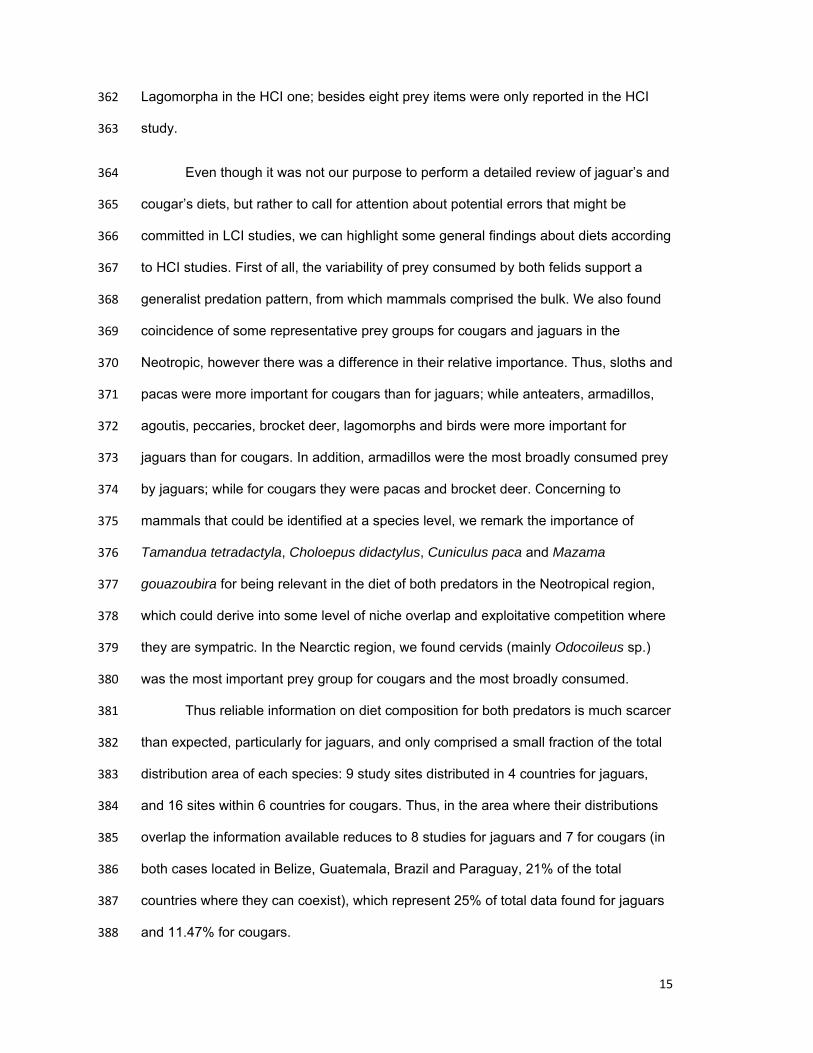
15
Lagomorpha in the HCI one; besides eight prey items were only reported in the HCI 362
study. 363
Even though it was not our purpose to perform a detailed review of jaguar’s and 364
cougar’s diets, but rather to call for attention about potential errors that might be 365
committed in LCI studies, we can highlight some general findings about diets according 366
to HCI studies. First of all, the variability of prey consumed by both felids support a 367
generalist predation pattern, from which mammals comprised the bulk. We also found 368
coincidence of some representative prey groups for cougars and jaguars in the 369
Neotropic, however there was a difference in their relative importance. Thus, sloths and 370
pacas were more important for cougars than for jaguars; while anteaters, armadillos, 371
agoutis, peccaries, brocket deer, lagomorphs and birds were more important for 372
jaguars than for cougars. In addition, armadillos were the most broadly consumed prey 373
by jaguars; while for cougars they were pacas and brocket deer. Concerning to 374
mammals that could be identified at a species level, we remark the importance of 375
Tamandua tetradactyla, Choloepus didactylus, Cuniculus paca and Mazama 376
gouazoubira for being relevant in the diet of both predators in the Neotropical region, 377
which could derive into some level of niche overlap and exploitative competition where 378
they are sympatric. In the Nearctic region, we found cervids (mainly Odocoileus sp.) 379
was the most important prey group for cougars and the most broadly consumed. 380
Thus reliable information on diet composition for both predators is much scarcer 381
than expected, particularly for jaguars, and only comprised a small fraction of the total 382
distribution area of each species: 9 study sites distributed in 4 countries for jaguars, 383
and 16 sites within 6 countries for cougars. Thus, in the area where their distributions 384
overlap the information available reduces to 8 studies for jaguars and 7 for cougars (in 385
both cases located in Belize, Guatemala, Brazil and Paraguay, 21% of the total 386
countries where they can coexist), which represent 25% of total data found for jaguars 387
and 11.47% for cougars. 388

16
Final considerations 389
Jaguars and cougars are considered to be declining; they are threatened by 390
habitat loss, fragmentation, over-hunting by people of their prey and themselves 391
(Sanderson et al. 2002, Negri and Quigley 2010). In this context, conservation and 392
management programs based on accurate ecological knowledge on their habitats and 393
feeding requirements are urgently required. Inaccurate results of diet assessments 394
could have far reaching implications, especially if they are used to explain processes 395
like coexistence, competition, conflict with humans, and resource partitioning (e. g. 396
Facure and Giaretta 1996, Núñez et al. 2000, Leite and Galvao 2002, De Azevedo 397
2008), since estimates like niche breath and/or overlap, mean prey weight, biomass 398
consumed, and issues of comparative ecology with other carnivores, or among sites, 399
depend on the number, kind and proportion of the items in the diet (e. g. Levins 1968, 400
Colwell and Futuyma 1971, Hurlbert 1978, Ackerman et al. 1984, Iriarte et al. 1990). 401
Thus, even so approaches for a reliable identification of predators are expensive and 402
require specialized technicians, materials, and equipment; we highlight the need to 403
invert on them in order to accomplish a better ecological understanding for these 404
species conservation. 405
Acknowledgements 406
The research was carried out under the project CGL2010-16902 of the Spanish 407
Ministry of Science and Innovation. P. G. Martínez-Gutiérrez enjoyed a Doctoral 408
fellowship (PhD in Terrestrial Ecology, Universitat Autònoma de Barcelona, NIU 409
1312441) from the Mexican National Council of Science and Technology (CONACYT). 410
N. Fernández was supported by the Excellence Research Program RNM-6685 of Junta 411
de Andalucia. 412
References 413

17
Ackerman, B. B. et al. 1984. Cougar food habits in southern Utah. - J. Wildl. Manage. 414
48: 147-155. 415
Baayen, R. H. 2011. languageR: Data sets and functions with "Analyzing Linguistic 416
Data: A practical introduction to statistics". - R package ver. 1.4 417
Bakar, K. S. and Sahu, S. K. 2012. spTimer: Spatio-Temporal Bayesian Modelling 418
Using R. - R package ver. 0.02. 419
Bates, D. et al. 2012. lme4: Linear mixed-effects models using S4 classes. - R package 420
ver. 0.999999-0. 421
Bekoff, M. et al. 1984. Life History Patterns and the Comparative Social Ecology of 422
Carnivores. - Annu. Rev. Ecol. Syst. 15: 191-232. 423
Bolker, B. M. et al. 2008. Generalized linear mixed models: a practical guide for 424
ecology and evolution. - Trends Ecol. Evol. 24: 127-135. 425
Bustamante-Ho, A. 2008. Densidad y uso de hábitat por los felinos en la parte sur del 426
área de amortiguamiento del Parque Nacional Corcovado, Península de Osa, 427
Costa Rica. - Master thesis, Universidad Nacional, Costa Rica. 428
Chame, M. 2003. Terrestrial mammal feces: a morphometric summary and description. 429
- Memórias do Instituto Oswaldo Cruz 98: 71-94. 430
Chaves, P. B. et al. 2012. DNA barcoding meets molecular fecesology: short mtDNA 431
sequences for standardized species assignment of carnivore noninvasive 432
samples. - Molecular Ecology Resources 12: 18-35. 433
Colwell, R. K. and Futuyma, D. J. 1971. On the measurement of niche breadth and 434
overlap. - Ecology 52: 567-576. 435
Cunningham, S. C. et al. 1997. Diet selection of mountain lions in southeastern 436
Arizona. -J. Range Manage. 52: 202-207. 437
Davison, A. et al. 2002. On the origin of faeces: morphological versus molecular 438
methods for surveying rare carnivores from their feces. - J. Zoology 257: 141-439
143. 440
18
De Azevedo, F. C. C. 2008. Food habits and livestock depredation of sympatric jaguars 441
and pumas in the Iguaçu National Park Area, South Brazil. - Biotrópica 40: 494-442
500. 443
De Oliveira, T. G. 2002. Ecología comparativa de la alimentación del jaguar y del puma 444
en el neotrópico. - In: Medellín, R. A. et al. (comps), El jaguar en el nuevo 445
milenio. UNAM, WCS, Fondo de Cultura Económica, pp. 265-288. 446
ESRI. 2011. ArcGIS Desktop: Release 10. Environmental Systems Research Institute. 447
- <http://www.esri.com/>. 448
Facure, K. G. and Giaretta, A. A. 1996. Food habits of carnivores in a coastal atlantic 449
forest of southeastern Brazil. - Mammalia 60: 499-502. 450
Farrell, L. E. et al. 2000. Dietary separation of sympatric carnivores identified by 451
molecular analysis of feces. - Mol. Ecol. 9: 1583-1590. 452
Fernández, G. J. et al. 1997. Identification of cougar and jaguar feces through bile acid 453
chromatography. - J. Wildl. Manage. 61: 506-510. 454
Foster, R. J. et al. 2010. Food habits of sympatric jaguars and pumas across a gradient 455
of human disturbance. - J. Zoology 280: 309-318. 456
Gittleman, J. L. and Harvey, P. H. 1982. Carnivore home-range size, metabolic needs 457
and ecology. - Behavioural ecology and sociobiology 10: 57-63. 458
Haemig, P. D. 2012. Sympatr ic Jaguar and Puma. Ecology.Info 6. - 459
<http://www.ecology.info/ecology-jaguar-puma.htm> 460
Hansen, M. M. and Jacobsen, L. 1999. Identification of mustelid species: otter (Lutra 461
lutra), American mink (Mustela vison) and Polecat (Mustela putorius), by 462
analysis of DNA from faecal samples. - J. Zoology 247: 177-181. 463
19
Harrington, L. A. et al. 2010. The accuracy of feces identification in distribution surveys: 464
American mink, Neovison vison, in the northern highlands of Scotland. - 465
European Journal of Wildlife Research 56: 377-384. 466
Harveson, L. A. et al. 2000. Prey use by mountain lions in southern Texas. - Southw. 467
Natural. 45: 472-476. 468
Horn, H. S. 1966. Measurement of "Overlap" in Comparative Ecological Studies. - Am. 469
Nat. 100: 419-424 470
Hurlbert, S. H. 1978. The measurement of niche overlap and some relatives. - Ecology 471
59: 67-77. 472
Iriarte, J. A. et al. 1990. Biogeographic variation of food habits and body size of the 473
America puma. - Oecologia 85: 185-190. 474
IUCN. 2012. IUCN Red List of Threatened Species. Ver 2012.1. - 475
<http://www.iucnredlist.org>. 476
Kohn, M. H. and Wayne, R. K. 1997. Facts from feces revisited. - Tree 12: 223-227. 477
Kortello, A. D. et al. 2007. Interactions between cougars (Puma concolor) and gray 478
wolves (Canis lupus) in Banff National Park, Alberta. - Ecoscience 14: 214-222. 479
Kunkel, K. E. et al. 1999. Winter prey selection by wolves and cougars in and near 480
Glacier National Park, Montana. - J. Wildl. Manage. 63: 901-910. 481
Kuroiwa, A. and Ascorra, C. 2002. Dieta y densidad de posibles presas de jaguar en 482
las inmediaciones de la zona de Reserva Tambopata-Candamo, Perú. - In: 483
Medellín, R. A. et al. (comps), El jaguar en el nuevo milenio. UNAM, WCS, 484
Fondo de Cultura Económica, pp. 199-207. 485
Laundré, J. W. and Hernández, L. 2010. What we know about pumas in Latin America. 486
- In: Hornocker, M. and Negri, S. (eds), Cougar Ecology and Conservation. The 487
Univ. of Chicago Press, pp. 76-90. 488
Leite, R. M. P. and Galvão, F. 2002. El jaguar, el puma y el hombre en tres áreas 489
protegidas del bosque atlántico costero de Paraná, Brasil. - In: Medellín, R. A. 490
20
et al. (comps), El jaguar en el nuevo milenio. UNAM, WCS, Fondo de Cultura 491
Económica, pp. 237-250. 492
Levins, R. 1968. Evolution in changing environments: some theoretical explorations. - 493
Princeton Univ. Press. 494
López-González, C. A. and González-Romero, A. 1998. A synthesis of current 495
literature and knowledge about the ecology of the puma (Puma concolor, 496
Linnaeus). - Acta Zoologica Mexicana (nueva serie) 75: 171-190. 497
Major, M. et al. 1980. Identifying feces by recovery of bile acids. - J. Wildl. Manage. 498
44: 290-293. 499
Martins, R. et al. 2008. Hábito alimentar e interferência antrópica na atividade de 500
marcação territorial do Puma concolor e Leopardus pardalis (Carnivora: 501
Felidae) e outros carnívoros na Estação Ecológica de Juréia-Itatins, São Paulo, 502
Brasil. - Rev. Bras. Zool. 25: 427-435. 503
McBride, R. et al. 2010. Note on the winter diet of Jaguar Panthera onca in the 504
Paraguayan transitional Chaco. Bellbird Vol 4. -505
<http://www.faunaparaguay.com/McBride.pdf>. 506
McCain, E. B. 2008. Daily activity patterns of mountain lions (Puma concolor) in 507
relation to the activity of their prey species in southern Arizona. - Master thesis, 508
Humboldt State University, USA. 509
Mills, M. G. L. 1996. Methodological advances in capture, census and food-habits 510
studies of large African carnivores. - In: Gittleman, J. L. (ed), Carnivore 511
behavior, ecology and evolution Volume 2. Cornell Univ. Press, pp. 223-242. 512
Nauta, M. J. and Weissing, F. J. 1996. Constraints on allele size at microsatellite loci: 513
implications for genetic differentiation. - Genetics 143: 1021-1032. 514
21
Negri, S. and Quigley, H. 2010. Cougar conservation: the growing role of citizens and 515
government. - In: Hornocker, M. and Negri, S. (eds), Cougar Ecology and 516
Conservation. The Univ. of Chicago Press, pp. 221-234. 517
Núñez, R. et al. 2000. Food habits of jaguars and pumas in Jalisco, Mexico. - J. 518
Zoology 252: 373-379. 519
Olson, D. M. et al. 2001. Terrestrial Ecoregions of the World: A New Map of Life on 520
Earth. BioScience 51:933-938. - 521
<http://www.worldwildlife.org/science/data/item1875.html>. 522
Pessino, M. E. M. et al. 2001. Respuesta a largo plazo del puma (Puma concolor) a 523
una declinación poblacional de la vizcacha (Lagostomus maximus) en el 524
desierto del Monte, Argentina. - Ecología Austral 11: 61-67. 525
Quinn, T. and Jackman, W. R. 1994. Influence of diet on detection of f e d bile acids by 526
thin-layer chromatography. - J. Wildl. Manage. 58: 295-299. 527
R Development Core Team. 2005. R: a language and environment for statistical 528
computing. R Foundation for statistical computing. - <http://www.r-project.org/>. 529
Rabinowitz, A. R. and Nottingham, B. G. 1986. Ecology and behaviour of the jaguar 530
(Panthera onca) in Belize, Central America. - J. Zoology 210: 149-159. 531
Sanderson, E. W. et al. 2002. Un análisis geográfico del estado de conservación y 532
distribución de los jaguares a través de su área de distribución. - In: Medellín, 533
R. A. et al. (comps), El jaguar en el nuevo milenio. UNAM, WCS, Fondo de 534
Cultura Económica, pp. 551-600. 535
Seymour, K. L. 1989. Panthera onca. - Mamm. Species 340: 1-9. 536
Silveira, L. 2004. Ecologia comparada e conservação da onça-pintada (Panthera onca) 537
e onça-parda (Puma concolor) no cerrado e pantanal. - PhD thesis, 538
Universidade de Brasília, Brasil. 539
Sokal, R. R. and Rohlf, F. J. 1981. Biometry. - W. H. Freeman and Company. 540
22
Sollmann, R. et al. 2013. Note on the diet of the jaguar in central Brazil. - European 541
Journal of Wildlife Research doi: 10.1007/s10344-013-0708-9. 542
Sunquist, M. E. and Sunquist, F. C. 1989. Ecological constraints on predation by large 543
felids. - In: Gittleman, J. L. (ed), Carnivore behavior, ecology and evolution 544
Volume 1. Cornell Univ. Press, pp. 283-301. 545
Taber, A. B. et al. 1997. The food habits of sympatric jaguar and puma in the 546
Paraguayan Chaco. - Biotropica 29: 204-221. 547
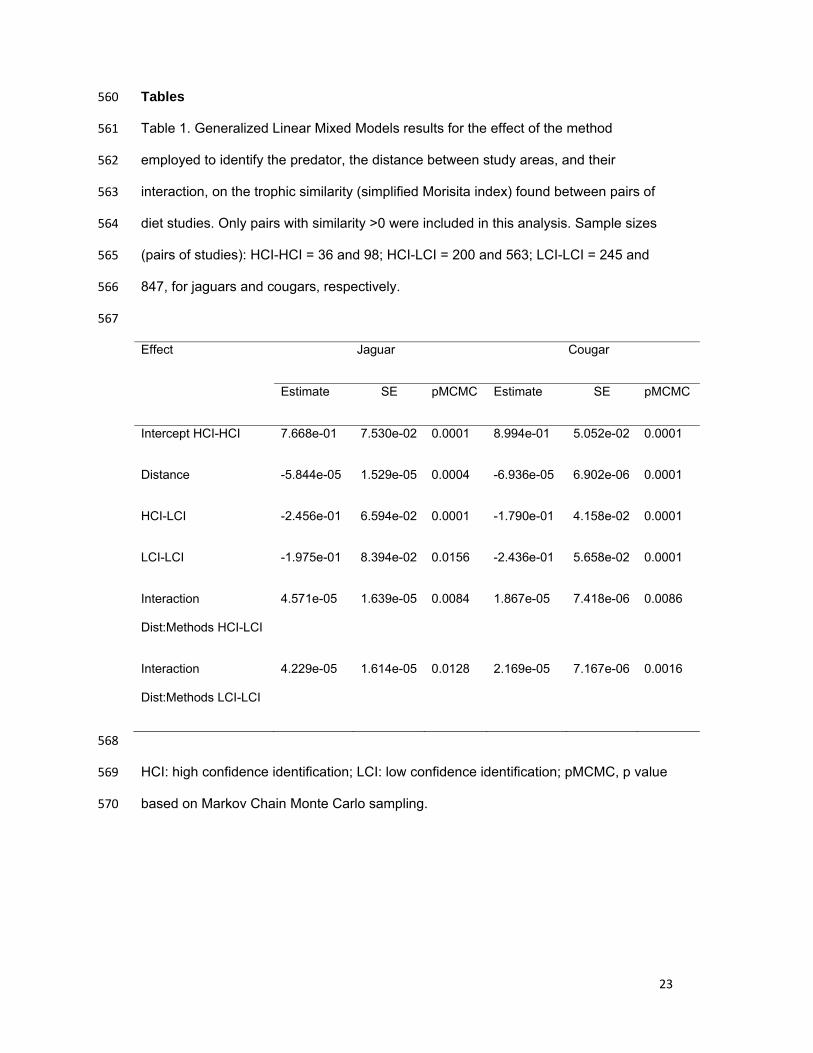
Uetz, P. (ed). The Reptile Database. - <http://www.reptile-database.org>. 548
Waits, L. P. and Paetkau, D. 2005. Noninvasive genetic sampling tools for wildlife 549
biologist: a review of applications and recommendations for accurate data 550
collection. - J. Wildl. Manage. 69: 1419-1433. 551
Witt, J. D. S. et al. 2006. DNA barcoding reveals extraordinary cryptic diversity in an 552
amphipod genus: implications for desert spring conservation. - Mol. Ecol. 15: 553
3073-3082. 554
Zeller, K. 2007. Jaguars in the New Millenium Data Set Update: The State of the 555
Jaguar in 2006. – WCS Report. 556
Zhang, J. et al. 2010. spaa: SPecies Association Analysis. - R package ver. 0.2.0. 557
Supplementary material (Appendix EXXXXX at <www.oikosoffice.lu.se/appendix>). 558
Appendix 1-2. 559
23
Tables 560
Table 1. Generalized Linear Mixed Models results for the effect of the method 561
employed to identify the predator, the distance between study areas, and their 562
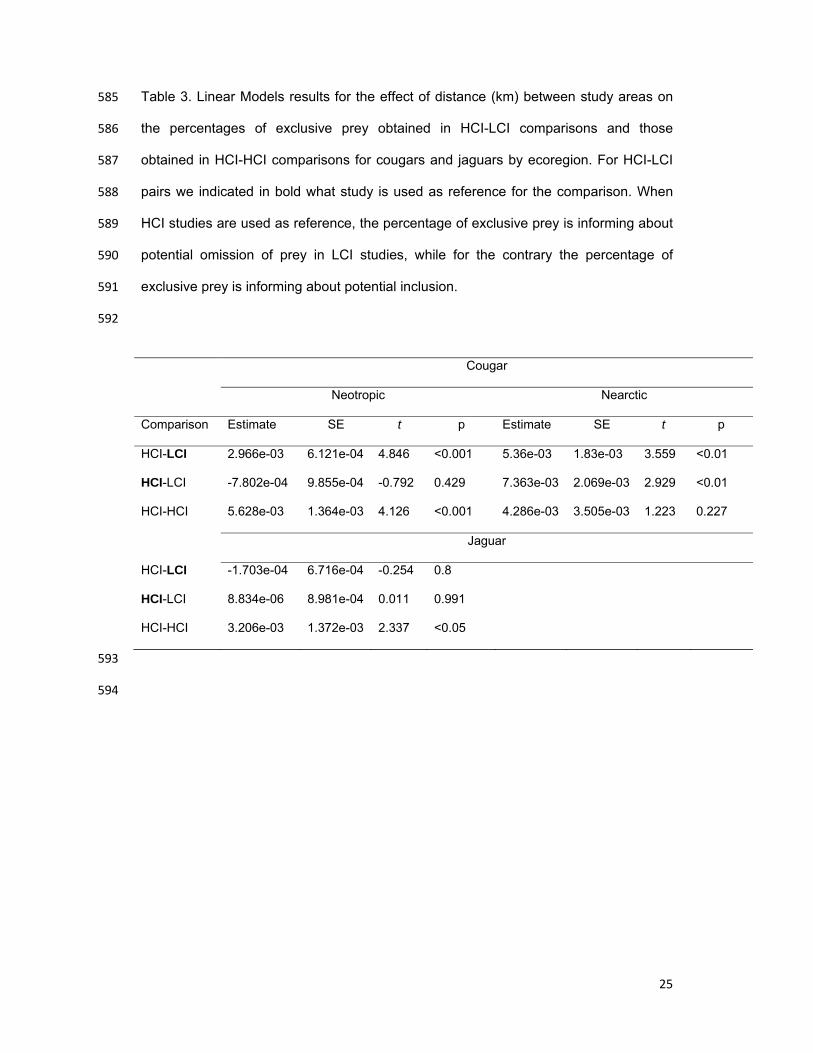
interaction, on the trophic similarity (simplified Morisita index) found between pairs of 563
diet studies. Only pairs with similarity >0 were included in this analysis. Sample sizes 564
(pairs of studies): HCI-HCI = 36 and 98; HCI-LCI = 200 and 563; LCI-LCI = 245 and 565
847, for jaguars and cougars, respectively. 566
567
Effect Jaguar Cougar
Estimate SE pMCMC Estimate SE pMCMC
Intercept HCI-HCI 7.668e-01 7.530e-02 0.0001 8.994e-01 5.052e-02 0.0001
Distance -5.844e-05 1.529e-05 0.0004 -6.936e-05 6.902e-06 0.0001
HCI-LCI -2.456e-01 6.594e-02 0.0001 -1.790e-01 4.158e-02 0.0001
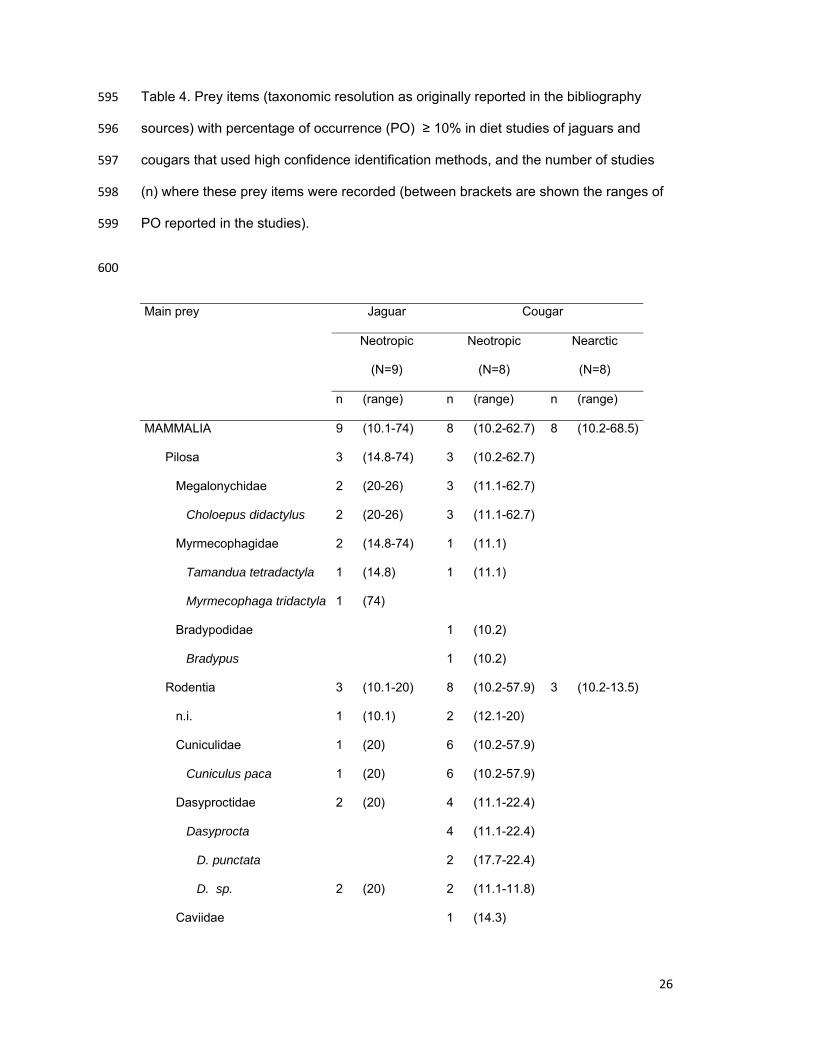
LCI-LCI -1.975e-01 8.394e-02 0.0156 -2.436e-01 5.658e-02 0.0001
Interaction
Dist:Methods HCI-LCI
4.571e-05 1.639e-05 0.0084 1.867e-05 7.418e-06 0.0086
Interaction
Dist:Methods LCI-LCI
4.229e-05 1.614e-05 0.0128 2.169e-05 7.167e-06 0.0016
568
HCI: high confidence identification; LCI: low confidence identification; pMCMC, p value 569
based on Markov Chain Monte Carlo sampling. 570

24
Table 2. Mean percentage (±SE) of exclusive prey when comparing each two diet 571
studies for jaguars and cougars in Neotropic and Nearctic regions regarding the levels 572
of confidence in predator identification (i.e. HCI-HCI and HCI-LCH). For each pair of 573
studies compared we obtained two values (one from each study of the pair). In the 574
case of HCI-LCI comparisons, results are shown in different columns, indicating in bold 575
what study is used as reference for the comparison. When HCI study is used as 576
reference, the percentage of exclusive prey is informing about potential omission of 577
prey, while when LCI study is used as reference, the percentage of exclusive prey is 578
informing about potential inclusion of prey. Asterisks indicate when the Mann-Whitney 579
U tests detected significant differences (i.e. p < 0.05) for the comparison of HCI-LCI 580
and HCI-LCI data with those obtained in HCI-HCI for jaguars and cougars separately. 581
582
Percentage of exclusive prey
Jaguar Cougar
HCI-HCI HCI-LCI HCI-LCI HCI-HCI HCI-LCI HCI-LCI
Neotropic 55.6±2.67
n=72
59.5±1.60
n=198
65.1±1.33*
n=198
50.4±2.87
n=56
59.9±1.98*
n=272
73.8±1.28*
n=272
Nearctic -
-
-
52.7±2.61
n=56
55.4±2.01
n=88
56.1±2.32
n=88
583
584
25
Table 3. Linear Models results for the effect of distance (km) between study areas on 585
the percentages of exclusive prey obtained in HCI-LCI comparisons and those 586
obtained in HCI-HCI comparisons for cougars and jaguars by ecoregion. For HCI-LCI 587
pairs we indicated in bold what study is used as reference for the comparison. When 588
HCI studies are used as reference, the percentage of exclusive prey is informing about 589
potential omission of prey in LCI studies, while for the contrary the percentage of 590
exclusive prey is informing about potential inclusion. 591
592
593
594
Cougar
Neotropic Nearctic
Comparison Estimate SE t p Estimate SE t p
HCI-LCI
HCI-LCI
HCI-HCI
2.966e-03
-7.802e-04
5.628e-03
6.121e-04
9.855e-04
1.364e-03
4.846
-0.792
4.126
<0.001
0.429
<0.001
5.36e-03
7.363e-03
4.286e-03
1.83e-03
2.069e-03
3.505e-03
3.559
2.929
1.223
<0.01
<0.01
0.227
Jaguar
HCI-LCI
HCI-LCI
HCI-HCI
-1.703e-04
8.834e-06
3.206e-03
6.716e-04
8.981e-04
1.372e-03
-0.254
0.011
2.337
0.8
0.991
<0.05
26
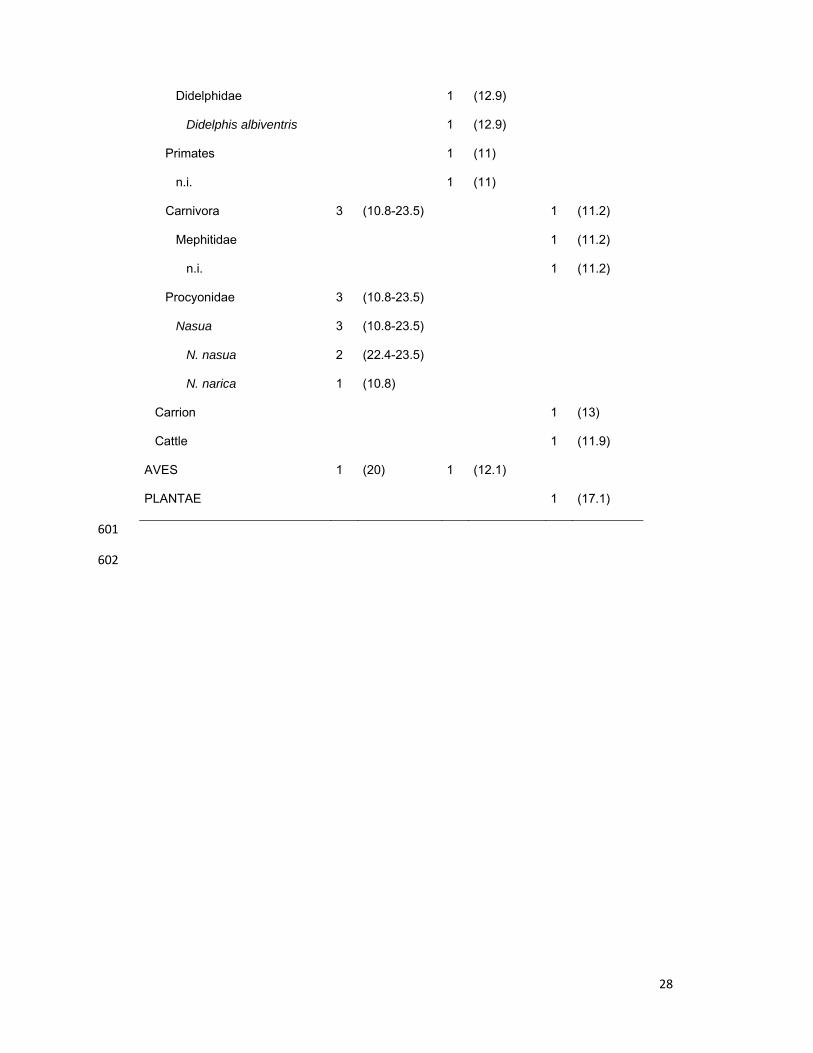
Table 4. Prey items (taxonomic resolution as originally reported in the bibliography 595
sources) with percentage of occurrence (PO) ≥ 10% in diet studies of jaguars and 596
cougars that used high confidence identification methods, and the number of studies 597
(n) where these prey items were recorded (between brackets are shown the ranges of 598
PO reported in the studies). 599
600
Main prey Jaguar Cougar
Neotropic
(N=9)
Neotropic
(N=8)
Nearctic
(N=8)
n (range) n (range) n (range)
MAMMALIA 9 (10.1-74) 8 (10.2-62.7) 8 (10.2-68.5)
Pilosa 3 (14.8-74) 3 (10.2-62.7)
Megalonychidae 2 (20-26) 3 (11.1-62.7)
Choloepus didactylus 2 (20-26) 3 (11.1-62.7)
Myrmecophagidae 2 (14.8-74) 1 (11.1)
Tamandua tetradactyla 1 (14.8) 1 (11.1)
Myrmecophaga tridactyla 1 (74)
Bradypodidae 1 (10.2)
Bradypus 1 (10.2)
Rodentia 3 (10.1-20) 8 (10.2-57.9) 3 (10.2-13.5)
n.i. 1 (10.1) 2 (12.1-20)
Cuniculidae 1 (20) 6 (10.2-57.9)
Cuniculus paca 1 (20) 6 (10.2-57.9)
Dasyproctidae 2 (20) 4 (11.1-22.4)
Dasyprocta 4 (11.1-22.4)
D. punctata 2 (17.7-22.4)
D. sp. 2 (20) 2 (11.1-11.8)
Caviidae 1 (14.3)

27
Galea musteloides 1 (14.3)
Erethizontidae 3 (10.2-13.5)
Erethizon dorsatum 3 (10.2-13.5)
Artiodactyla 4 (20-24.1) 5 (11.1-21.2) 8 (11-68.5)
Cervidae 2 (21.7-24.1) 5 (11.1-21.2) 8 (11-68.5)
Mazama 2 (21.7-24.1) 5 (11.1-21.2)
M. gouazourbira 2 (21.7-24.2) 1 (21.2)
M. sp. 4 (11.1-20.3)
Odocoileus 1 (15.2) 8 (27-68.5)
O. hemionus 6 (28-68.5)
O. virginianus 1 (15.2) 1 (31.5)
O. sp. 1 (39.1)
Cervus elaphus 1 (18.6)
Alces alces 1 (11)
Tayassuidae 2 (20-20.6) 2 (11.1-12.1) 1 (39.1)
n.i. 1 (12.1)
Tayassu pecari 1 (11.1)
Pecari tajacu 2 (20-20.6) 1 (39.1)
Bovidae 1 (18.2)
Ovis aries 1 (18.2)
Cingulata 7 (11.1-46.4) 1 (21.2)
Dasypodidae 7 (11.1-46.4) 1 (21.2)
n.i. 4 (11.1-40) 1 (21.2)
Dasypus novemcinctus 3 (26.5-46.4)
Lagomorpha 2 (22.2-24.6) 1 (15.2) 2 (15.4-27)
n.i. 2 (22.2-24.6) 1 (15.2)
Leporidae 2 (15.4-27)
Lepus americanus 1 (27)
Sylvilagus floridanus 1 (15.4)
Didelphimorphia 1 (12.9)
28
Didelphidae 1 (12.9)
Didelphis albiventris 1 (12.9)
Primates 1 (11)
n.i. 1 (11)
Carnivora 3 (10.8-23.5) 1 (11.2)
Mephitidae 1 (11.2)
n.i. 1 (11.2)
Procyonidae 3 (10.8-23.5)
Nasua 3 (10.8-23.5)
N. nasua 2 (22.4-23.5)
N. narica 1 (10.8)
Carrion 1 (13)
Cattle 1 (11.9)
AVES 1 (20) 1 (12.1)
PLANTAE 1 (17.1)
601
602

29
Figure Legends 603
Figure 1. Geographical distribution of diet studies of jaguars (a) and cougars (b). 604
Darkest areas are the current distribution ranges according to Zeller (2007) for jaguar 605
and IUCN (2012) for cougar. White points represent location of predator high 606
confidence identification studies, black triangles represent location of predator low 607
confidence identification studies, and white squares represent sites with both high and 608
low confidence identification studies. 609
Figure 2. Mean and standard error of diet similarity (simplified Morisita index) 610
between pairs of studies with similarity >0 according to the confidence of the method 611
employed to identify the predator for jaguar and cougar. HCI: high confidence 612
identification; LCI: low confidence identification. Sample sizes (pairs of studies): HCI-613
HCI= 36 and 98; HCI-LCI= 200 and 563; LCI-LCI= 245 and 847, for jaguar and cougar, 614
respectively. 615
Figure 3. Percentage of prey items exclusive to the LCI study (gray points) and 616
the HCI study (black points) for every pair of HCI-LCI studies compared in function of 617
the distance between them for jaguars in the Neotropic, and cougars in the Neotropic 618
and in the Nearctic (left panels). For comparison, the same information (i.e. percentage 619
of prey items exclusive) is represented for all pairs of HCI-HCI studies compared (right 620
panels). Tendency lines and their standard errors are also shown. 621


