

1
SacEFT: Bank swallow modelSacramento River Ecological Flows Tool Refinements
Workshop
Expanding & Communicating
EcologicalConsiderations
Used to Evaluate Water
Management Alternatives
October 7, 2008
Katherine Wieckowski
2
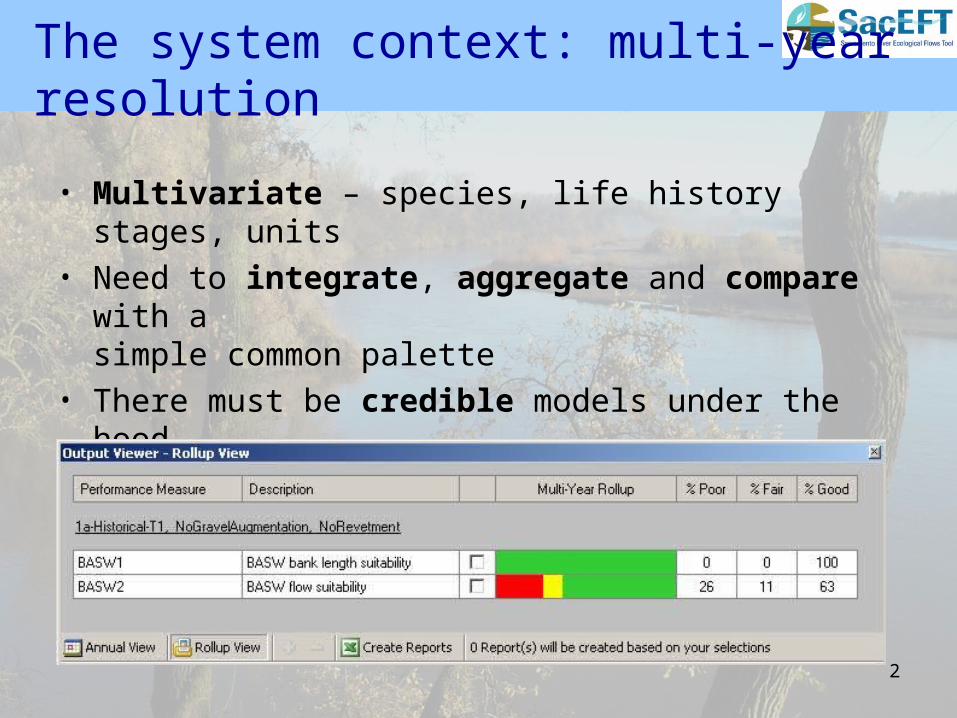
The system context: multi-year resolution
• Multivariate – species, life history stages, units• Need to integrate, aggregate and compare
with asimple common palette
• There must be credible models under the hood• Experts may need to drill down to years, days,
locations
3
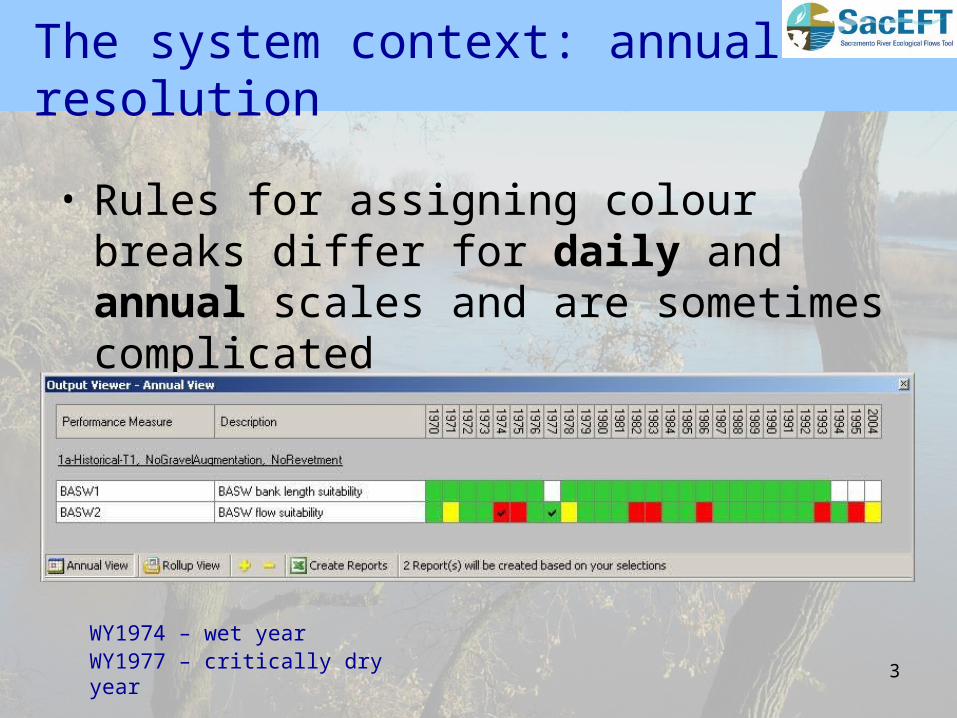
The system context: annual resolution
• Rules for assigning colour breaks differ for daily and annual scales and are sometimes complicated
WY1974 – wet yearWY1977 – critically dry year
4
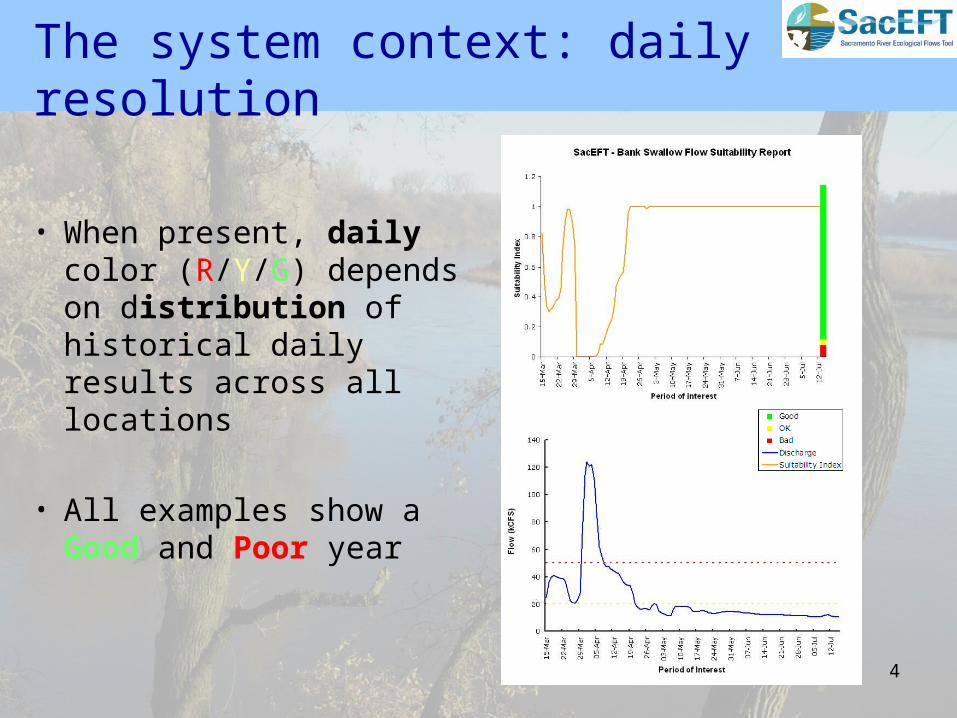
The system context: daily resolution
• When present, daily color (R/Y/G) depends on distribution of historical daily results across all locations
• All examples show a Good and Poor year

5
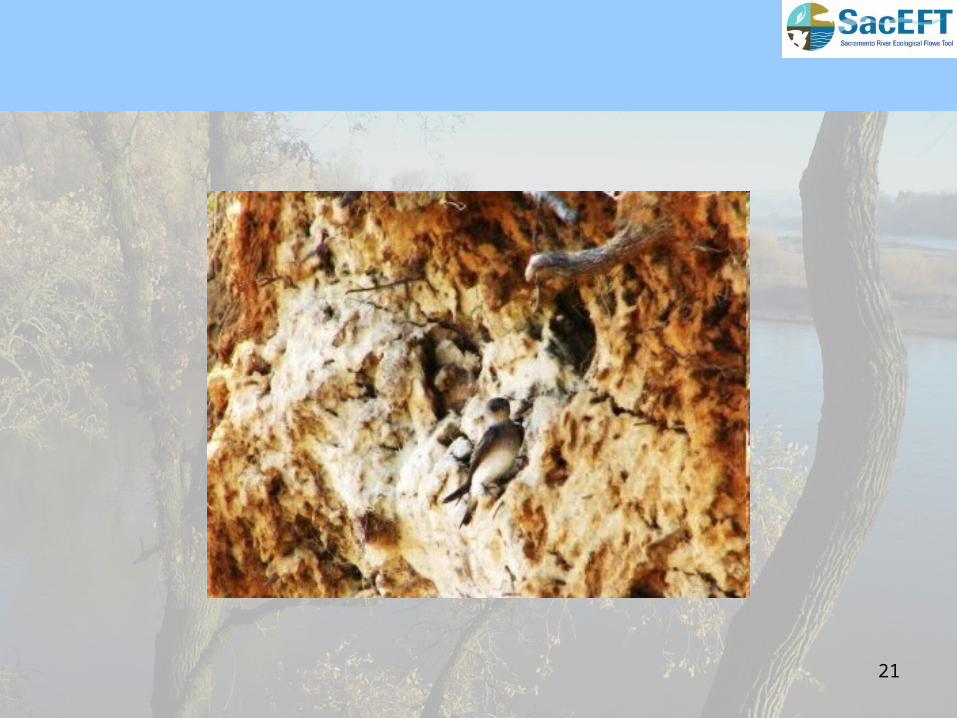
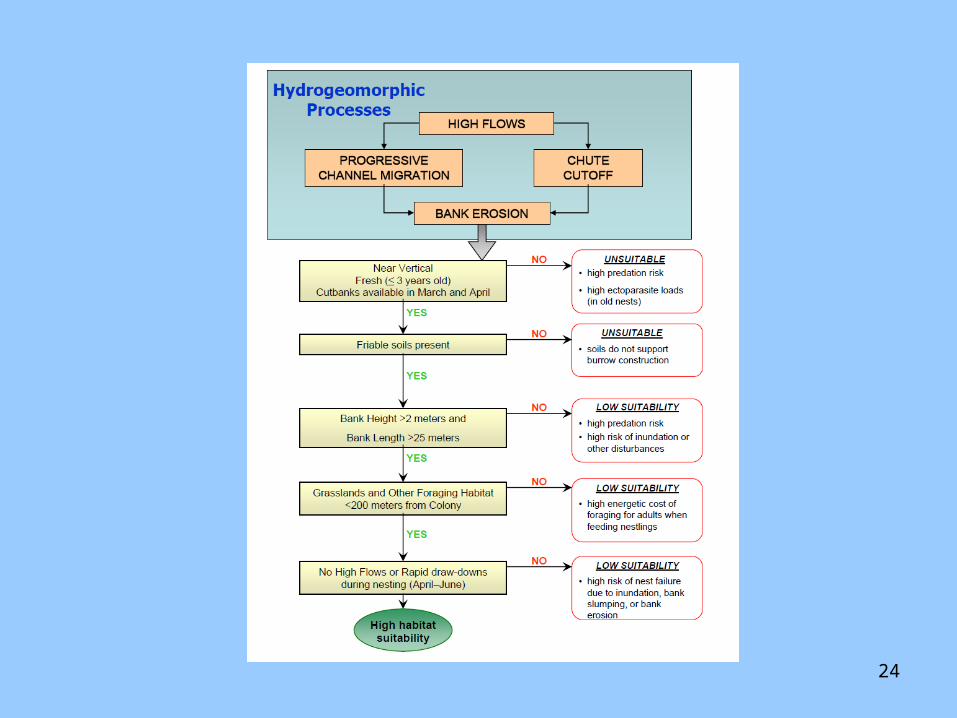
Habitat requirements
Nesting habitat:
• Nests burrows built in steeply sloped banks in friable soils
• Immediately adjacent to still or running water
• Banks renewed every few years by erosive processes

6
Bank swallow (BSW) indicators
• Two indicator models chosen through 2005 workshop
• Models share common structure but different parameters
• Models are habitat-based, not population-based*

7

8
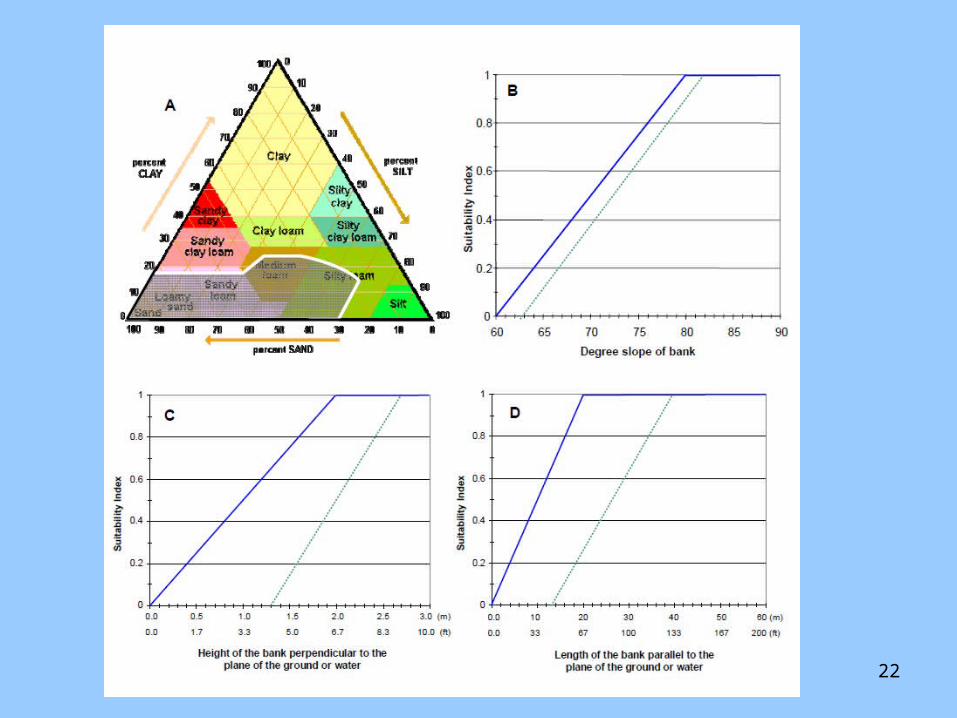
Selected functionalrelationships

9
BSW indicators
BSW1 – Length of newly eroded banks with suitable soil texture (m)
BSW2 – Indicator of bank sloughing (i.e., collapse) during nesting (Red/Yellow/Green hazard zones)
10
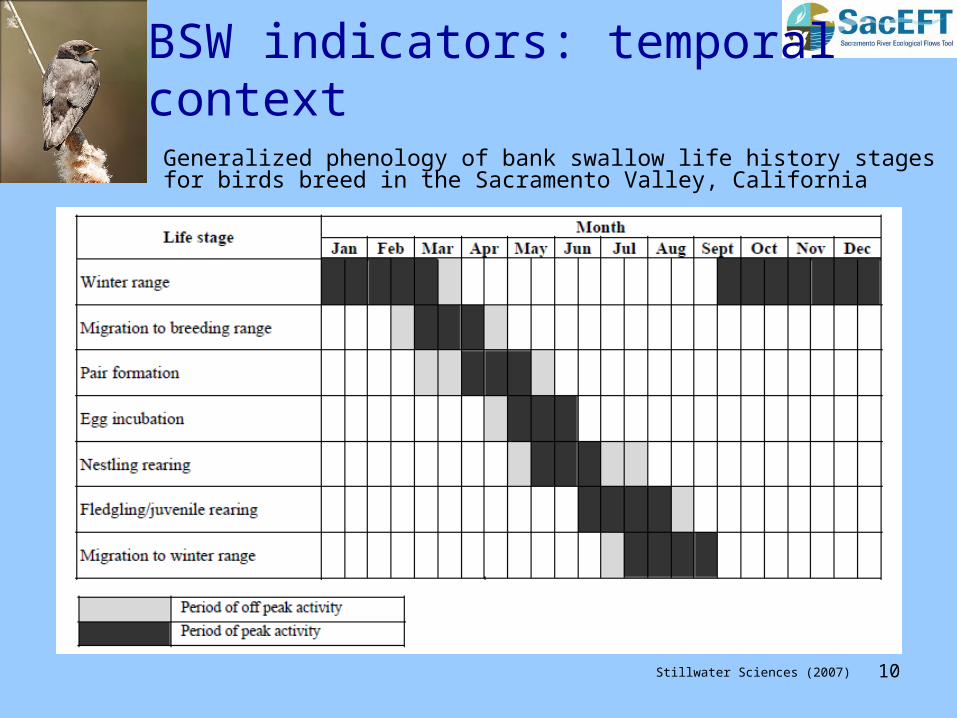
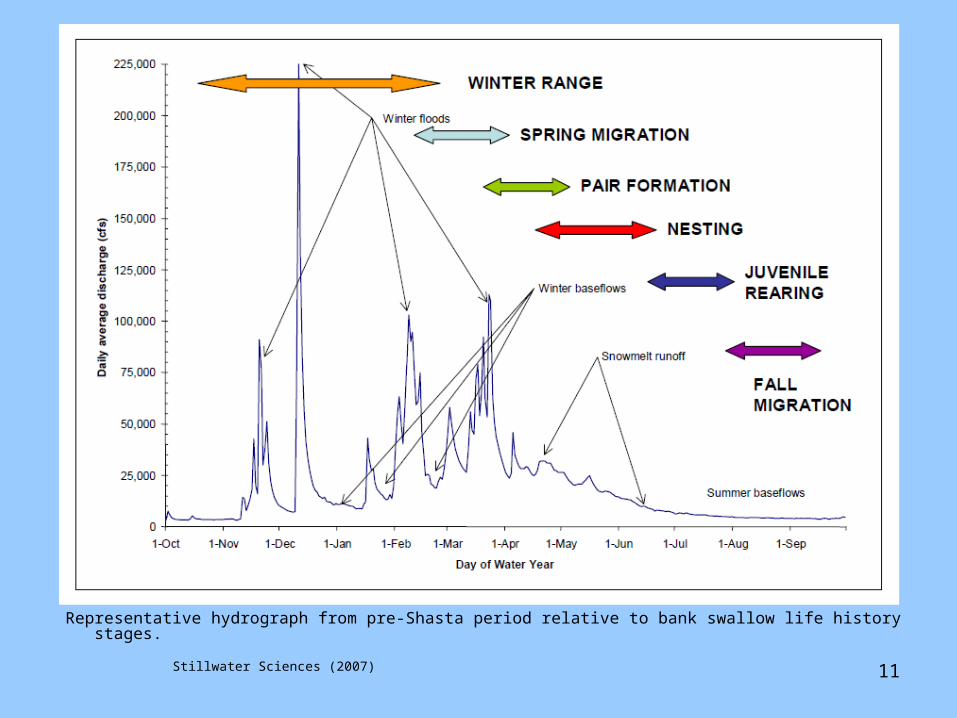
BSW indicators: temporal context
Generalized phenology of bank swallow life history stages for birds breed in the Sacramento Valley, California
Stillwater Sciences (2007)
11
Representative hydrograph from pre-Shasta period relative to bank swallow life history stages. Stillwater Sciences (2007)
12
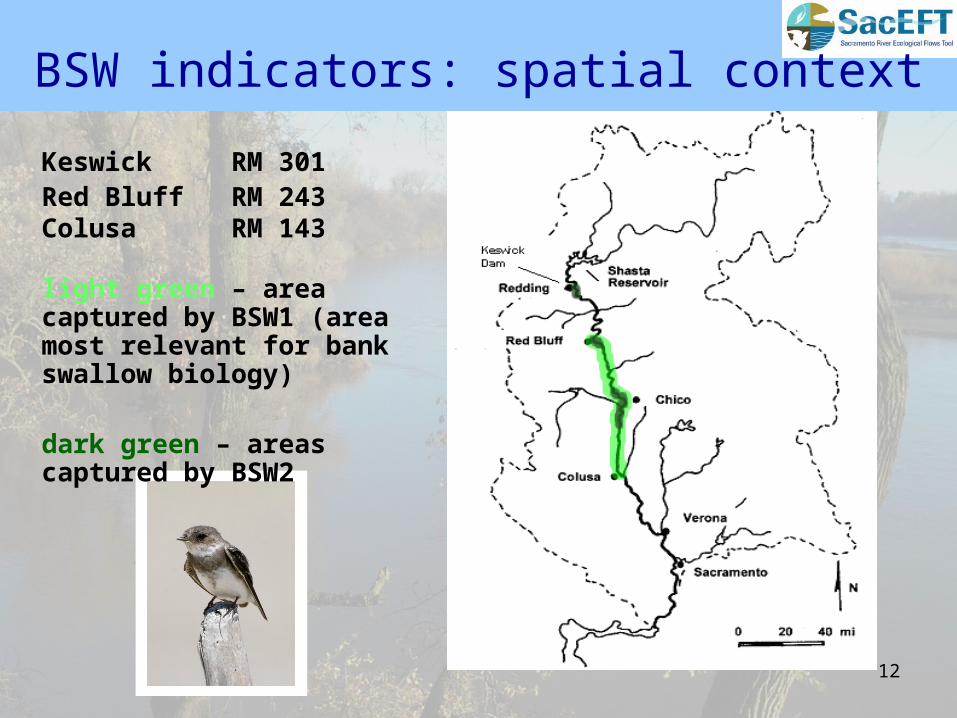
BSW indicators: spatial context
Keswick RM 301Red Bluff RM 243Colusa RM 143
light green – area captured by BSW1 (area most relevant for bank swallow biology)
dark green – areas captured by BSW2

13
BSW indicators: spatial context
RM201
RM185
River segment 2

14
BSW1– Length of newly eroded bank
1. L depends on meander migration rate (W) and area of floodplain reworked (A)
2. Meander migration model solves for W and A
3. L calculated annually for each modeled bend
4. Scoring of annual results is based on terciles of total length taken from historical run with no bank revetment
5. L is insensitive to flow

15
BSW1 – Length of newly eroded bank
b
bb W
AL
B
bbbl wLBSW
1
1
1. Calculate L for each bend (b):
3. Weighted useable Lb for each segment (l):
W
ALb
2. Weight or each bend (b):
0 when (L < 13m)
wb when (13m ≤ L ≤ 20m)
1 when (L ≥ 20m)7
13L
4. Calculate BSW1 for the river :
L
llBSWBSW
1
11

16
BSW1- Length of newly eroded bank

17
BSW1: Why insensitive to flow?
• Low inter-annual variability in W
• Scale mismatch between meander migration model and length scale used for weighting.
• Narrow range of variation in terciles generated from historical data
• L doesn’t account well for depth of bank erosion
Stillwater Sciences (2007)
18
BSW2 – Peak flow during nesting
1. Calculated daily by location (3 locations) using flow (Q)
2. Based on flow thresholds (20 kCFS and 50 kCFS)
3. Timing of flows effects impact
4. Scoring of daily and annual results is heuristic
5. Somewhat insensitive to flow

19
BSW2 – Peak flow during nesting
• If 2 or more locations are good, BSW2R is assigned good
• Lower ratings are assigned as poorer site performance is observed (e.g., if 2 or more locations are bad, BSW2R is assigned bad)
1 when (Q < 20kCFS)
BSW2= when (20kCFS ≤ Q ≤ 50kCFS)
0 when (Q ≥ 50kCFS)
30
201
Q
1. Calculate BSW2 for each location:
2. Calculate annual BSW2R for the river

20
1974 – wet year 1977 – critically dry year
BS
W2
BS
W2
21
22

23
24


