

1
TWO YEARS OF OUTCOMES FROM A COMPREHENSIVE DM PROGRAM IN
COMMERCIAL AND MEDICARE HEALTH PLAN MEMBERS
TWO YEARS OF OUTCOMES FROM A COMPREHENSIVE DM PROGRAM IN
COMMERCIAL AND MEDICARE HEALTH PLAN MEMBERS
Esther J. Nash, MD, Senior Medical Director, Population Health & Wellness, Independence Blue Cross
Carolyn Young, FSA, MAAA, Senior Actuary, Medical Cost Analysis & Forecasting, Independence Blue Cross
Kimberly K. Siejak, MS, Manager, Population Health & Wellness, Independence Blue Cross

2
AgendaAgenda
ConnectionsSM Programs Overview
ConnectionsSM Financial Outcomes: Program Years 1 and 2
ConnectionsSM Clinical and Member Satisfaction Outcomes: Program Years 1 and 2
Summary
Future Challenges
3
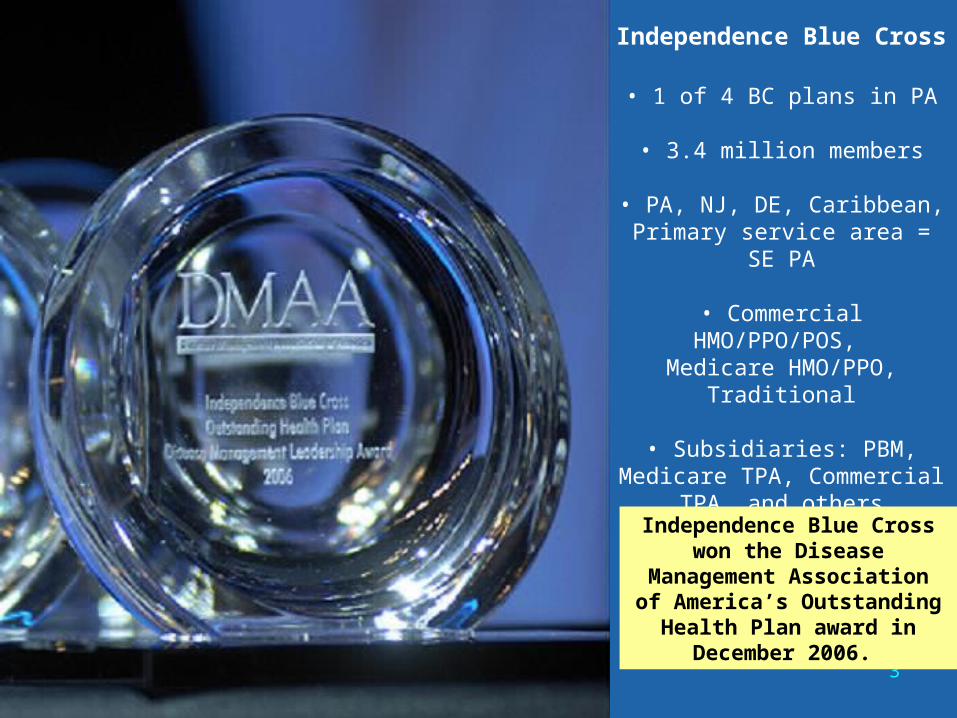
Independence Blue Cross
• 1 of 4 BC plans in PA
• 3.4 million members
• PA, NJ, DE, Caribbean, Primary service area = SE PA
• Commercial HMO/PPO/POS, Medicare HMO/PPO, Traditional
• Subsidiaries: PBM, Medicare TPA, Commercial TPA, and
others
Independence Blue Cross won the Disease Management Association of America’s
Outstanding Health Plan award in December 2006.

4
ConnectionsSM Programs are Broad in Scope and Fully Integrated
ConnectionsSM Programs are Broad in Scope and Fully Integrated
Programs for 22 chronic conditions
Fully integrated disease management and decision support
Fully integrated with all health plan processes Case management, pre-certification, member services,
preventive programs, mental health
Collaborative practice model with treating providers
Analytics that allow efficient use of clinical resources

5
IBC ConnectionsIBC ConnectionsSMSM Program History Program History IBC ConnectionsIBC ConnectionsSMSM Program History Program History
1995 to 2003 – opt in insourced and outsourced programs for CHF, COPD, DM, asthma, CAD
2003 – Connections Health Management Program – partner is Health Dialog:• Asthma, Diabetes, CHF, CAD, COPD – “opt out”
• Decision support for back/joint pain, women’s health, men’s health, cardiac revascularization
2004 – Connections Kidney Program – partner is RMS: ESRD
2005 – Connections AccordantCareTM Program – partner is Accordant Health Services: Complex chronic diseases (e.g., Lupus, Parkinson’s,
Seizure, MS)

6
ConnectionsSM Programs:Types of Outcome Evaluation
ConnectionsSM Programs:Types of Outcome Evaluation
Levels of member engagement and usage Member satisfaction Clinical indicators Provider satisfaction And of course, utilization impact and cost savings Being considered: employer satisfaction, member
retention impact

7
Who Initiates Telephone ContactPTD July 2003 – February 2007Who Initiates Telephone ContactPTD July 2003 – February 2007
Members place inbound calls to Health Coaches for information, education, and help in making informed medical decisions.
Health Coaches place outbound calls to members to offer disease management, decision support, or to follow-up with a member.
OUTBOUND 59%
INBOUND41%

8
Members with Chronic Disease Identified as High RiskMembers with Chronic Disease Identified as High Risk
22,398 (11%) of PA PPO and HMO members with chronic disease are considered “high-risk”
20,755 (24%) of PA Medicare members with chronic disease are considered “high-risk”
0 25 50 75 100 125 150 175 200
PA Medicare
PA PPO &HMO
Members in Thousands
High Intensity (High Risk)Standard Intensity (Low Risk)
Data program to date as of February 2007

9
High Risk* Chronic Member ContactsHigh Risk* Chronic Member Contacts
13,870 (73%) of PA PPO and HMO high-risk members were reached
15,778 (91%) of PA Medicare high-risk members were reached
* High-Risk = members identified as having a high-predicted financial risk.
Data program to date as of February 2007
0 4 8 12 16 20 24
PAMedicare
PA PPO &HMO
Members in Thousands
Reached Not reached

10
Savings Methodology OverviewSavings Methodology OverviewSavings Methodology OverviewSavings Methodology Overview
Pre/post comparison of included members, adjusting for the trend factors of the non-chronic population
Several classes of members are excluded in the reconciliation: e.g., HIV/AIDS, institutionalized, or with hospice, psychiatric, alcoholism, or substance abuse facilities claims
Once chronic, always chronic
6-month eligibility required to be included
Regression to the mean accounted for by a 4 month non-measured period immediately following a member’s chronic date
Consistent with DMAA 2006 outcomes guidelines
Assessed by Reden & Anders as “reasonable and appropriate”

11
Actual vs. Expected CostsActual vs. Expected Costs
Base Year 1 Year 2
PM
PM
Co
st
Actual Year 1
Expected Year 1
Actual Year 2
Expected Year 2
Year 1 Savings
Year 2 Savings

12
Chronic PMPM Savings Impact% Reduction from Expected
Chronic PMPM Savings Impact% Reduction from Expected
10%
17%
9%
15%
8%
15%
0%
2%
4%
6%
8%
10%
12%
14%
16%
18%
20%
HMO PPO Medicare
Year 1 Year 2

13
Savings by Service TypeYear 2
Savings by Service TypeYear 2
CommercialHMO/PPO
Emergency Room 1%
Outpatient15%
Inpatient47%
Professional 37%
Medicare
Inpatient54%
Outpatient9%
Emergency Room
1%
Professional36%

14
Actual vs. Expected Utilization(% below expected)
Actual vs. Expected Utilization(% below expected)
Inpatient Outpatient Professional
Year 1 Year 2
13% 22%
12%
16%
10%
11%Medicare 9% 13% 6% 20%
Year 1 Year 2
20% 25%
13%8%
HMO
PPO 18% 25%
Year 1 Year 2
12% 21%

15
Prevalence by DiseaseYear 2
Prevalence by DiseaseYear 2
.4%
6.5%
.8%
6.5%
1.8%
13.6%
3.2%
9.4%
4.9%
1.6%
11.1%
37.7%
0%
5%
10%
15%
20%
25%
30%
35%
40%
CHF COPD CAD Diabetes Asthma Total
Commercial Medicare
Assumes the following disease hierarchy: CHF, COPD, CAD, Diabetes, Asthma. Members are counted once in highest category only.

16
Savings by type of service – Commercial HMO/PPOYear 2
Savings by type of service – Commercial HMO/PPOYear 2
78%
11%
12%
72%
18%
10%
65%
20% 15%
39% 10%51%
36% 34% 30%
CHF COPD CAD Diabetes Asthma
Inpatient Outpatient Professional
Assumes the following disease hierarchy: CHF, COPD, CAD, Diabetes, Asthma. Members are counted once in highest category only.

17
Savings by type of service – Medicare HMO/PPOYear 2
Savings by type of service – Medicare HMO/PPOYear 2
79%
6%
15%
55%
9%
36%
68%
18% 15%
65%
10%
26%
53% 47%
CHF COPD CAD Diabetes Asthma
Inpatient Outpatient Professional
Assumes the following disease hierarchy: CHF, COPD, CAD, Diabetes, Asthma. Members are counted once in highest category only.

18
Some Progression on Hard to Move MeasuresSome Progression on Hard to Move MeasuresSome Progression on Hard to Move MeasuresSome Progression on Hard to Move Measures
0%
37.4%
25.8%
64.6%
65.1%
62.5%66.1%
66.2%
68.4%66.3%
66.7%
67.6%
42.1%
42.7%
0%
10%
20%
30%
40%
50%
60%
70%
80%
90%
100%
Clinical Quality Indicators Commercial PPO - Year 2
Baseline Intervention Year 1 Intervention Year 2
Controller Medication
ASTHMA
Lipid Test
CAD
Beta Blocker
CHF
Lipid Test
DIABETES
Microalbuminuria
DIABETES
Per
cen
t of
mem
bers
with
con
ditio
n
rece
ivin
g te
st o
r tr
eatm
ent
19
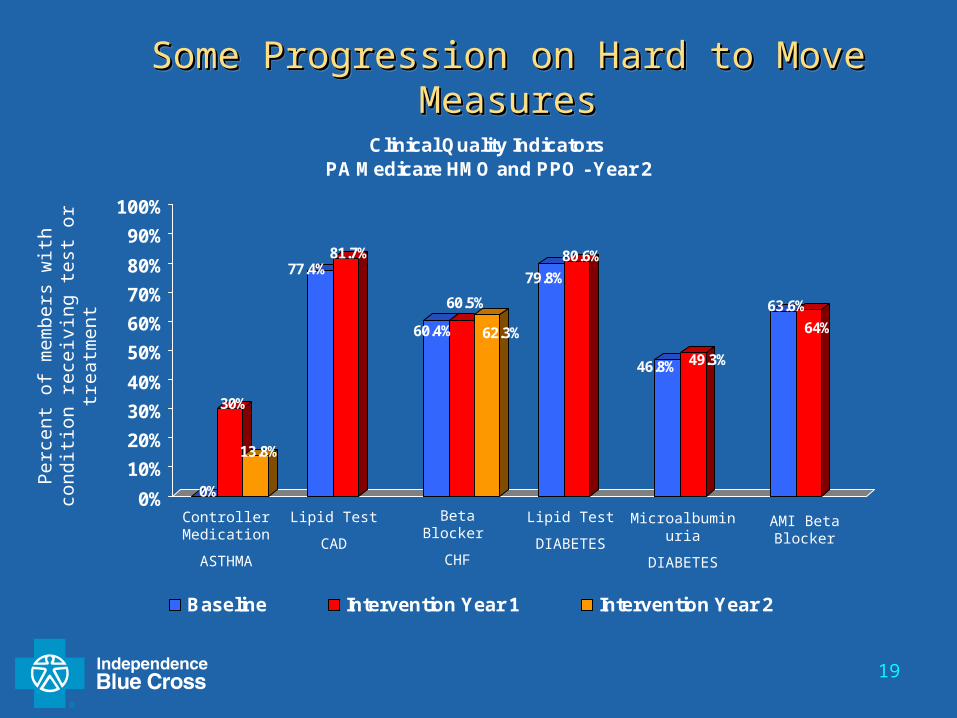
Some Progression on Hard to Move MeasuresSome Progression on Hard to Move MeasuresSome Progression on Hard to Move MeasuresSome Progression on Hard to Move Measures
0%
30%
13.8%
77.4%81.7%
60.4%
60.5%
62.3%
79.8%
80.6%
46.8% 49.3%
63.6%
64%
0%
10%
20%
30%
40%
50%
60%
70%
80%
90%
100%
Clinical Quality Indicators PA Medicare HMO and PPO - Year 2
Baseline Intervention Year 1 Intervention Year 2
Controller Medication
ASTHMA
Lipid Test
CAD
Beta Blocker
CHF
Lipid Test
DIABETES
Microalbuminuria
DIABETES
Per
cen
t of
mem
bers
with
con
ditio
n
rece
ivin
g te
st o
r tr
eatm
ent
AMI Beta Blocker

20
Some Progression on Hard to Move MeasuresSome Progression on Hard to Move MeasuresSome Progression on Hard to Move MeasuresSome Progression on Hard to Move Measures
0%
25%24.7%
64.3%64.6%
62%
69.8%70.6%
70.6% 67.8%68.7%
66.1%
73.5%
76.7%77.2%
0%
10%
20%
30%
40%
50%
60%
70%
80%
Clinical Quality Indicators Commercial HMO - Year 2
Baseline Intervention Year 1 Intervention Year 2
Controller Medication
ASTHMA
Lipid Test
CAD
Beta Blockers Lipid Test
DIABETES
Lipid Treatment
CAD
Per
cen
t of
mem
bers
with
con
ditio
n
rece
ivin
g te
st o
r tr
eatm
ent

21
IBC Medicare, PPO, HMO Member Sat SurveyIBC Medicare, PPO, HMO Member Sat Survey
* Changes from 2004 to 2005 are not statistically significant
How satisfied were you with the assistance the Health Coach provided you? (Percent of respondents indicating “Very Satisfied” or “Satisfied” displayed)
• 87 percent of 2006 chronic and 88 percent of 2006 non-chronic users indicated that they were “very satisfied” or “satisfied” with the assistance provided to them by the Health Coach*.
87% 87%94% 88%
86% 90%
0%
20%
40%
60%
80%
100%
Chronic Non Chronic
2006 2005 2004

22
• Both chronic and non-chronic users indicated that their impression of Independence Blue Cross has been positively impacted because of the Connections Program.
IBC Medicare, PPO, HMO Member Sat SurveyIBC Medicare, PPO, HMO Member Sat Survey
What number would you use to rate how you feel about Independence Blue Cross as a result of offering the Connections
Program to you?
86% 84%90%
86% 83%86%
0%
20%
40%
60%
80%
100%
Chronic Non Chronic
2006 2005 2004

23
SummarySummary
ConnectionsSM produces cost savings through reduced medical cost and utilization trends.
Members with chronic conditions are highly satisfied with the ConnectionsSM programs.
IBC continues to work with our vendors to enhance and expand program offerings.

24
Future ChallengesFuture Challenges Future Challenges: Near Term
Use of absenteeism and worker’s compensation data to further enhance targeting
Integration with employer- and plan-based incentives programs Enhanced program options for deeper reach into chronic and “well”
population Pharmacy initiatives Integration with workplace wellness programs

25
Future ChallengesFuture Challenges
Future Challenges: Mid-term and longer What is point of declining ROI vs. total returns? Is consensus methodology where we need to be? How do we pay doctors to be a medical home so that DM is more
than a “band aid” for “medical homelessness”?

26
Questions/DiscussionQuestions/Discussion
Contact Information
Esther Nash, MD, [email protected]
Carolyn Young, FSA, MAAA, [email protected]
Kimberly K. Siejak, MS, [email protected]


