

Supplementary materials
Siderophore coated magnetic iron nanoparticles:
Rational designing of water soluble nanobiosensor for
visualizing Al3+ in live organism
M. Raju,† Sakshi Srivastava,† Ratish R. Nair,† Ishan H. Raval,‡
Soumya Haldar,*‡,§ and Pabitra B. Chatterjee*†,§
†Analytical Division and Centralized Instrument Facility,
CSIR-CSMCRI, Bhavnagar, Gujarat, India.
‡Marine Biotechnology and Ecology Division,
CSIR-CSMCRI, Bhavnagar, Gujarat, India.
§Academy of Scientific and Innovative Research,
CSIR-CSMCRI, Bhavnagar, Gujarat, India.
Corresponding author: [email protected]
1

1. Experimental details
1.1 Chemicals
2, 3-Dihydroxybenzoic acid, glycine ethyl ester, N,N'-dicyclohexylcarbodiimide (DCC),
iron(III) acetylacetonate Fe(acac)3, benzyl ether, oleylamine, potassium fluoride, different
metal perchlorate salts, and other analytical reagents were purchased from Aldrich and were
used as such. All other chemicals were purchased from local suppliers and were reagent
grade. Artemia cysts were procured from Tetra (Japan).
1.2 Instrumentation and physical measurements
Microanalysis (C, H, and N) were performed on an Elementar Vario MICRO CUBE analyser.
IR spectra in the FTIR-ATR mode (4000-400 cm-1) were recorded on Perkin-Elmer Spectra
GX 2000 spectrometer. TEM images of the nanoparticles were recorded using a transmission
electronic microscope (TEM; JEOL JEM 2100 microscope). For TEM, dispersed aqueous
sample was ultra-sonicated for 15 minutes and then the sample was deposited on to a carbon-
coated grid at room temperature and then allowed for air-dry (ca. 12 h). Laser-spectroscatter
201 (RiNA, GmbH, Germany) was used for the DLS experiments. Powder X-ray diffraction
(PXRD) of all samples were recorded using a diffractometer equipped with a CuKa X-ray
radiation at 40 kV and 30 mA. Diffraction patterns were collected over 2θ range 5-80 0 at a
scan rate 1 0/minute. Thermogravimetric analyses (TGA) were carried out on Netzch STA
409PC TG-DTA instrument from 30 0C through 800 0C with a scanning rate 5 0C/min in
presence of nitrogen flow. The UV-vis spectra were recorded by using Cary 500 scan UV-
vis-NIR spectrophotometer. For recording fluorescence spectra, Edinburgh instruments
Xe900 (μF 920H) spectrofluorimeter was used. Solutions pH were measured by Thermo
Scientific Orion Versastar Advanced Electrochemistry meter at 298 K. Estimation of metal
ion concentrations was carried out using an ICP-OES instrument from Parkin-Elmer, model
2000 dv. 1300 W RF power under argon gas flow (nebulizer, 0.86 L/min; auxiliary, 1.2
2

L/min; plasma, 15 L/min) at 0.65 L/min sample uptake rate were used. Standard reference
solutions were purchased from Merck and were used for the calibration of the ICP-OES
instrument. Optical imaging of live organism was performed using an Olympus DP72 U-
TVO 63Xc microscope. Zeta potential measurements was performed using Zetasizer Nano
ZS light scattering apparatus (Malvern Instruments, UK) with a He/Ne laser (633 nm, 4 Mw).
1.3 General procedure for fluorescence experiments
Stock solution was prepared by dissolving 2 mg solid HL-FeNPs in 100 mL aqueous HEPES
buffer (50 mM, pH 7.4). Different metal perchlorate stock solutions of 50 μM (100 mL) were
prepared in H2O by dissolving solid metal salts in water in volumetric flasks. Final solutions
for fluorescence experiments were made by mixing 1 mL of the above 50 μM metal stock
solution and 1 mL of HL-FeNPs solution. The resolution of the fluorimeter was set at 1 nm.
The excitation was given at 340 nm and the emission spectra were recorded between 345 and
600 nm in all fluorescence experiments.
1.4 General procedure for fluorescence titrations
The above mentioned stock solutions were also used for fluorescence titration studies. The
air-equilibrated stock solutions of aluminium perchlorate salt were prepared by increasing its
concentrations from 0 μM to 250 μM in water. Final solutions for titration experiments were
prepared by mixing 1 mL each of HL-FeNPs and aluminium salt solutions of different
concentration (0 to 250 μM). For each measurement, excitation was given at 340 nm and all
experiments were carried out in triplicates.
1.5 Calculation of binding constant between Al3+ and HL-FeNPs
The binding constant between Al3+ and HL-FeNPs was estimated from the emission titration
data. This was calculated from the following linear expression of Benesi-Hildebrand (Benesi
and Hildebrand, 1949; Wang et al., 2010).
3

I 0
I −I 0=
I 0
[ L ]+
I 0
[ L ] K1
[ M ]
I0 is the fluorescence intensity of HL-FeNPs in the absence of Al3+. I is the fluorescence
intensity of HL-FeNPs at 437 nm in presence of Al3+. K is the binding constant. [L] and [M]
are the concentrations of HL-FeNPs and Al3+, respectively. By plotting 1/(I-I0) versus
1/[Al3+], the binding constant can be calculated out.
1.6 Determination of LOD from fluorescence titration
The lower limit of detection (LOD) of HL-FeNPs for Al3+ was calculated from the equation
LOD = (3σ/S), wherein σ is the standard deviation and S is the slope of the calibration curve.
Upon plotting fluorescence intensities against concentrations of Al3+, the LOD value was
found to be 20 nM.
1.7 Al3+removal experiment using HL-Fe3O4 NPs and external magnet
Different amounts of HL-Fe3O4 NPs (0, 5, 10, 20, 30, 40, 50 and 60 mg) were dissolved in
aqueous solution of Al3+ (8.5 ppm, 50 mL). Different mixtures were stirred at room
temperature for ca. 2 h and the dispersed substances was separated by the use of an external
magnet. Finally, residual concentrations of Al3+ were measured by ICP experiments. Other
metal ions removal experiments were also performed as per the above mentioned procedure.
1.8 Al3+ enrichment experiment using natural water source
The Al3+ enrichment experiment in Artemia was also carried out with coastal water collected
from Alang ship breaking yard (World biggest ship breaking yard) where estimated Al3+
concentration is less than 1 μM (i.e. not detectable). 1L water sample was collected in
polypropylene bottle and were transported to the laboratory in cold condition.
1.9 Toxicity study of HL-FeNPs
To examine the toxic nature of the nanobiosensor HL-FeNPs, Artemia mortality count was
also performed. In 500 mL autoclaved sea water, Artemia cysts were allowed to harvest
4

overnight under strong aeration. After complete harvesting, approximately 50 Artemia were
added in each tube (containing 10 mL aqueous HEPES buffer at pH 7.4). Three sets of tubes
were used in this study. Artemia were allowed to grow in the absence (control) and presence
of HL-FeNPs. Finally, by mortality count, the toxicity of HL-FeNPs was evaluated.
1.10 Synthesis and characterization of siderophore (H3L)
Siderophore 2,3-dihydroxybenzoylglycine (H3L) was synthesized following the procedure
described earlier in the literature (Soulere et al., 2002). Yield: 56 %. Anal. Calcd for
C9H9NO5: C, 51.19; H, 4.30, and N, 6.63. Found: C, 52.04; H, 4.25, and N, 6.51. ESI-MS
(+ive, m/z): 234.19 [H3L + Na+]. 1H NMR (CD3OD, 500 MHz) δ = 7.34 (m, 1H), 6.99 (m,
1H), 6.73 (m, 1H), 3.53 (d, j=7.8 Hz, 2H) ppm.
Fig. S1. Room temperature (25 °C) 600 MHz 1H NMR spectrum of H3L, recorded in CD3OD.
5
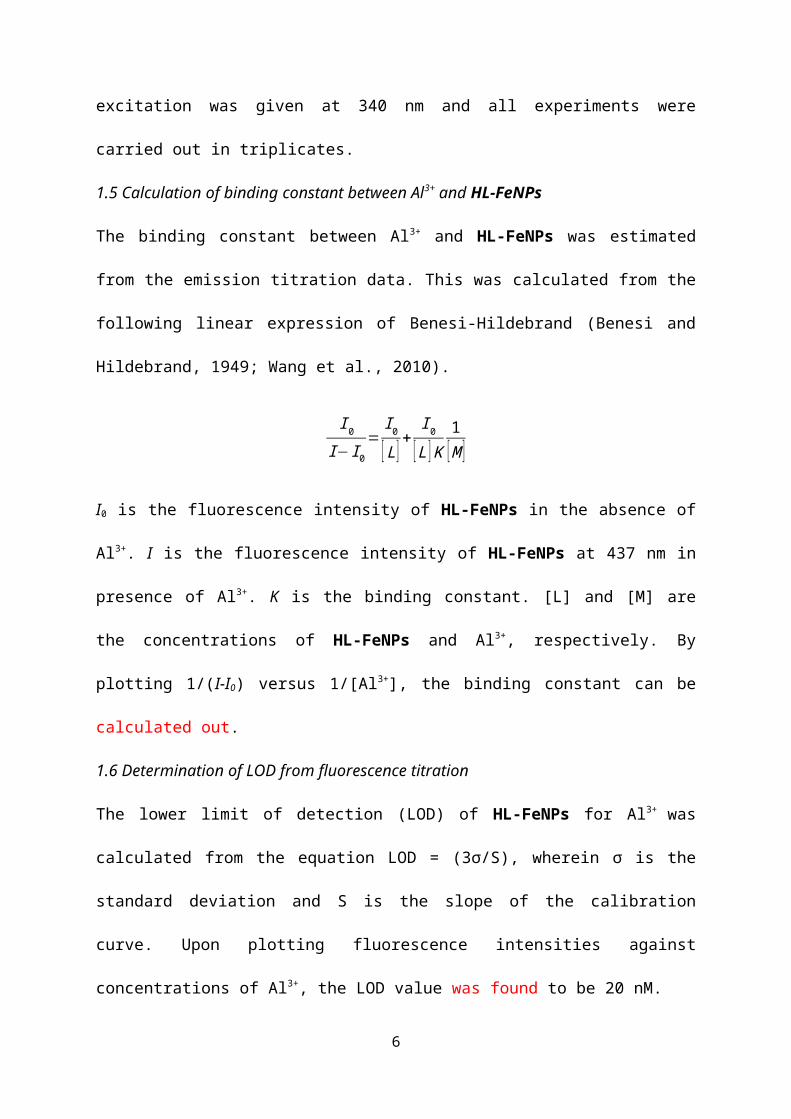
Fig. S2. (a) TEM image of bare FeNPs; (b) histogram of bare FeNPs prepared from TEM results; (c) histogram of HL-FeNPs made from TEM of HL-FeNPs; and (d) Selected Area Electron Diffraction (SEAD) pattern of HL-FeNPs.
6

Fig. S3. FTIR-ATR spectra of H3L (bottom) and HL-FeNPs (top).
Fig. S4. (a) Histogram of bare FeNPs prepared from the DLS data and (b) histogram of HL-FeNPs made from the DLS results.
7

Fig. S5. TG graphs of (a) H3L, (b) HL-FeNPs, and (c) bare FeNPs.
8

Fig. S6. Powder XRD pattern of bare FeNPs.
Fig. S7. Photographs of aqueous solutions of HL-FeNPs in absence and presence of different
metal ions under (observed under UV light at 360 nm).
Fig. S8. Bar diagram of the emission peak maxima of FeNPs and HL-FeNPs with and
without Al3+.
9

Fig. S9. pH titration profile of aqueous solutions of HL-FeNPs performed in presence and in
absence of Al3+.
Fig. S10. Fluorescence titration profiles of HL-FeNPs upon addition of increasing
concentrations of Al3+ to the aqueous HEPES buffer solutions of the probe at pH 7.4 (at 25
°C). Excitation was given at 340 nm.
10

Fig. S11. (a) Benesii-Hildebrand plot from emission titration data of HL-FeNPs in presence
of Al3+. (b) LOD determination plot of HL-FeNPs (λemi=437 nm) as a function of Al3+
concentrations. Error bars indicates the standard deviations. Each data point is the average of
three values.
11

Fig. S12. (a) Reversibility experiment showing alternate fluorescence enhancement and
quenching of HL-FeNPs upon sequential addition of Al3+ and KF to its solution. (b)
Illustration of the reusability of HL-FeNPs for the detection of Al3+ using KF.
12

Fig. S13. Plot of fluorescence emission maxima against time after the addition of Al3+. The
data points represent the average of three values and the error bars indicate the standard
deviations.
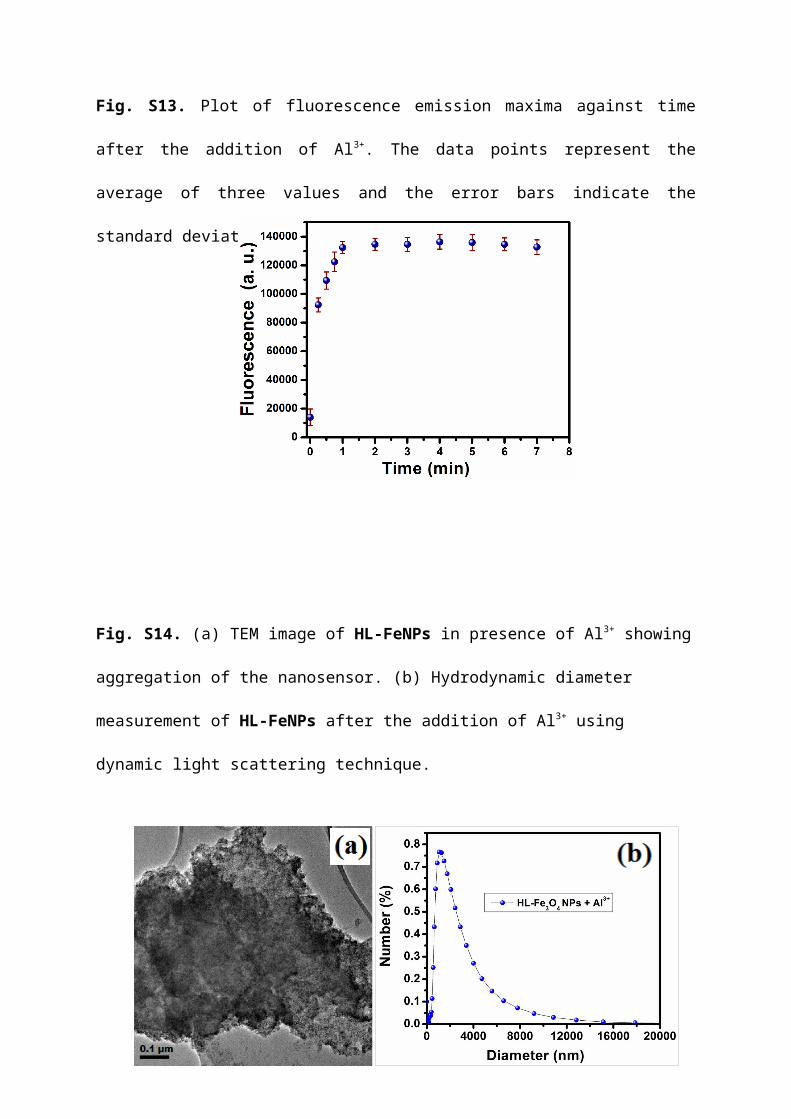
Fig. S14. (a) TEM image of HL-FeNPs in presence of Al3+ showing aggregation of the
nanosensor. (b) Hydrodynamic diameter measurement of HL-FeNPs after the addition of
Al3+ using dynamic light scattering technique.
13

Fig. S15. Powder XRD of HL-FeNPs in presence of Al3+.
Fig. S16. Fluorescence microscopy image of live Artemia which was exposed to 10 μM
Al3+ followed by the addition of HL-FeNPs. Arrow indicates the position of the GI-
tract.
14

Fig. S17. Fluorescence microscopy image of live Artemia which was exposed to the natural
seawater sample as described below in Table S3. Arrow indicates the position of the GI-
tract.
15

Table S1. Summary of optical properties of different water soluble small-molecule based Al3+-selective chemosensors.
1
Receptor Binding constant
(M-1)
LOD Interferencea Solvent
system
Bio-imaging Excitation
(nm)
Ref
Salicylimineprobe L 5.5 x 10⁴ 5.2 nM Cr3+, Cu2+, and Ca2+ Water HeLa cells 366 Wang et al., 2015
Receptor 1 1.13 x 10³ 6.4 μM Cr3+, Cu2+, Fe2+, and Fe3+ Water HeLa cells 380 Choi et al., 2016
Salpn-ONPS NA 1.25 μM Cu2+ and Cr3+ Water Staphylococcus
Aureus bacteria
365 Aguilar et al., 2016
Sensor L 9.5 x 10⁵ 66.5 nM Also selective for Zn2+ Water NA 335 Yan et al., 2015
Lsen NA 1.5 ppb No interference Water NA 374 Vallejos et al., 2015
Chemo sensor 1 4.2 x 10³ 336 nM Cu2+ interferes Water NA 334 Yan et al., 2015
PMD2 6.22 x 10⁶ 1.49 nM NA Water NA 440 Kumar et al., 2013
ANTPY NA 320 nM No interference Water NA 340 Zhou et al., 2013
Quinoline functionalized
Schiff base (L)
NA 2.1 M Cr3+ and Fe3+ Water HeLa cells 296 Samanta et al., 2015
Metal−organic framework 1 NA 2.5 M NA Water NA 283 Singha et al., 2015
Dansyl-SEE 1.84 x 10⁴ 230 nM Cu2+, Hg2+, Cr3+, and Fe3+ Water NA 380 In et al., 2016
Chemosensor 1 4 x 10³ 2.01 M Cu2+, Fe2+, Fe3+, Co2+, Ni2+
and Cr3+
Water HeLa cells 410 Jo et al., 2016
Chemosensor 1 NA 5 x 10-11
M
Zn2+, Fe3+, and Cu2+ Water Zebrafish 317 Wang et al., 2014
Schiff base-type fluorescent
chemosensor H2L
7.8 x 10⁻⁴ 0.17 M No interference Water HeLa cells 340 Guo et al., 2013
ARS NA 40 nM No interference Water NA 420 Wang et al., 2011
SA1 4.05 x 10³ M-1/2 2.73 nM Fe3+ and Cu2+ Water LLC Cells 419 Neeraj et al., 2014
Sensor L 1.19 x 10⁸ 0.1 μM No interference Water NAb 320 Liu et al., 2014

aInterference study in presence of other competing metal ions. bData is not reported. NA stands for information not available.
Table S2. Comparison of optical properties of HL-Fe3O4 NPs with different water soluble Al3+ -specific nanosensors.
Receptor Binding
constant (M-1)
LOD Interferencea Solvent
system
Bio-imaging system Method Ref
HL-FeNPs 0.4 x 10⁴ M-1 20 nM No interference Water Live brine shrimp Artemia FL This study
Citrate capped AuNPs NA 1 M Cr3+ Water NA UV-vis Chen et al., 2012
2

C-AuNPs NA 0.2 M NA Water HeLa cells UV-vis Li et al., 2010
A-AgNPs NA 0.09 M NA Water HeLa cells UV-vis Zhang et al., 2012
A-AuNPs NA 0.46 M NA Water HeLa cells UV-vis Zhang et al., 2012
TTP–AuNP NA 18 nM No interference Water NA UV-vis Chen et al., 2013
MMT-AuNPs NA 0.53 M NA Water NA UV-vis Xue et al., 2014
GSH-AgNPs NA 0.16 M NA Water NA UV-vis Yang et al., 2014
Fe3O4 NPs conjugate 1c 3.2 x 10⁷ M-1 0.3 ppb No interference Water Hela cells FL Zhi et al., 2013
Conjugate polymer NPs NA 35 ppb NA water Vero cells FL Liu et al., 2013
Zw-AuNPs NA 10 M Also selective for
Cr3+ and Fe3+
Water NA UV-vis Zheng et al., 2016
HNAET–AuNPs NA 0.29 M No interference Water NA UV-vis Huang et al., 2016
Au NC NA 0.3 M Also selective for
Fe3+
Water NA FL Mu et al., 2014
PCA-DTC-Au NPs NA 38 nM No interference Water NAb UV-vis Mehta et al., 2015
aInterference study in presence of other competing metal ions. bData is not reported. NA stands for information not available.
Table S3. Quantitative determination (via ICP-OES) of Al3+ in natural seawater after the removal of Al3+ by the magnetic nanosensor HL-FeNPs
in presence of external magnet. The concentrations of other selected metal ions present in the natural marine water sample collected from Alang
ship breaking yards are as follows:
Zn2+ (11 ppm); Fe3+ (8 ppm); Pb2+ (5 ppm); Mn2+ (2 ppm); and Co2+ (4 ppm).
3

Al3+ found (ppm)
Al3+ added (ppm)
After removal of Al3+ by adding 60 mg HL-FeNPs
(ppm)
After removal of Al3+ by adding 100 mg HL-FeNPs
(ppm)ND 4.92 1.8 0.18
ND: Not detectable
Table S4. Toxicity results of HL-FeNPs
% mortality with respect to time
2 hours 4 hours 6 hours
4

Experiment Set 1 Set 2 Set 3 mean Std. Dev.
Set 1 Set 2 Set 3 mean Std. Dev.
Set 1
Set 2
Set 3 mean Std. Dev.
ctrl 0 0 0 0 0 0 0 0 0 0 0 0 0 0 0
HL-FeNPs
HL-FeNPs (10 μg iron per mL)
0 0 0 0 0 0 0 0 0 0 0 0 0 0 0
HL-FeNPs (at 10 μg iron per mL) plus Al3+
6 µM Al3 0 0 0 0 0 0 0 0 0 0 0 033 0 0 0
8 µM Al3 0 0 0 0 0 0 0 0 0 0 0 0 1 0.333 0.577
10 µM Al3 0 0 0 0 0 0 0 1 0.333 0.577 1 2 2 1.666 0.577
5

References
Aguilar, C. A. H.; Raj, P.; Thangarasu, P.; Singh, N. 2016. RSC Adv. 6, 37944-37952.
Chen, S.; Fang, Y. M.; Xiao, Q.; Li, J.; Li, S. B.; Chen, H. J.; Sun, J. J.; Yang, H. H. 2012.
Analyst 137, 2021-2023.
Chen, Y. C.; Lee, I. L.; Sung, Y. M.; Wu, S. P. 2013. Talanta 117, 70-74.
Choi, Y. W.; Lee, J. J.; Nam, E.; Lim, M. H.; Kim, C. A. 2016. Tetrahedron 72, 1998-2005.
Guo, Y. Y.; Yang, L. Z.; Tang, X. L.; Ru, J. X.; Yao, X.; Wu, J.; Dou, W.; Qin, W. W.;
Zhang, G. L.; Liu, W. S. 2013. Dyes and Pig. 99, 693-698.
Huang, P.; Li, J.; Liu, X.; Wu, F. 2016. Microchim. Acta 183, 863-869.
In, B.; Hwang, G. W.; Lee, K. H. 2016. Bioorg. Med. Chem. Lett. 26, 4477-4482.
Jo, T. G.; Lee, J. J.; Nam, E.; Bok, K. H.; Lim, M. H.; Kim, C. 2016. New J. Chem. 40, 8918-
8927.
Kumar, A.; Kumar, V.; Upadhyay, K. K. 2013. Analyst 138, 1891-1897.
Li, X.; Wang, J.; Sun, L.; Wang, Z. 2010. Chem. Commun. 46, 988-990.
Liu, H.; Hao, X.; Duan, C.; Yang, H.; Lv, Y.; Xu, H.; Wang, H.; Huang, F.; Xiaod, D.; Tian,
Z. 2013. Nanoscale 5, 9340-9347.
Liu, Z.; Li, Y.; Ding, Y.; Yang, Z.; Wang, B.; Li, Y.; Li, T.; Luo, W.; Zhu, W.; Xie, J.;
Wang, C. 2014. Sens. Actuators B 197, 200-205.
Mehta, V. N.; Singhal R. K.; Kailasa, S. K. 2015. RSC Adv. 5, 33468-33477.
Mu, X.; Qi, L.; Qiao J.; Ma, H. 2014. Anal. Methods 6, 6445-6451.
Neeraj, Kumar, A.; Kumar, V.; Prajapati, R.; Asthana, S. K.; Upadhyay, K. K.; Zhaob, J.
2014. Dalton Trans. 43, 5831-5839.
Samanta, S.; Goswami, S.; Ramesh, A.; Das, G. A 2015. J. Photochem. Photobiol. A 310, 45-
51.
Singha, D. K.; Mahata, P. 2015. Inorg. Chem. 54, 6373-6379.
1
Soulere, L.; Viode, C.; Perie, J.; Hoffmann, P. 2002. Chem. Pharm. Bull. 50, 578-582.
Vallejos, S.; Munoz, A.; Ibeas, S.; Serna, F.; Garcia, F. C.; Garcia, J. M. 2015. ACS Appl.
Mater. Interfaces 7, 921-928.
Wang, H.; Wang, B.; Shi, Z.; Tang, X.; Dou, W.; Han, Q.; Zhang, Y.; Liu, W. A. 2015.
Biosens. Bioelectron. 65, 91-96.
Wang, J.; Pang, Y. 2014. RSC Adv. 4, 5845-5848.
Wang, Y.; Xiong, L.; Geng, F.; Zhang, F.; Xu, M. 2011. Analyst 136, 4809-4814.
Xue, D.; Wang, H.; Zhang, Y. 2014. Talanta 119, 306-311.
Yan, L. Q.; Cui, M. F.; Zhou, Y.; Ma, Y.; Qi, Z. J. 2015. Anal. Sci. 31, 1055-1059.
Yan, L. Q.; Ma, Y.; Cui, M. F.; Qi, Z. J. 2015. Anal. Methods 7, 6133-6138.
Yang, N.; Gao, Y.; Zhang, Y.; Shen, Z.; Wu, A. 2014. Talanta 122, 272-277.
Zhang, M.; Liu, Y. Q.; Ye, B. C. 2012. Chem. Eur. J. 18, 2507-2513.
Zheng, W.; Li, H.; Chen, W.; Ji, J.; Jiang, X. 2016. Anal. Chem. 88, 4140-4146.
Zhi, L.; Liu, J.; Wang, Y.; Zhang, W.; Wang, B.; Xu, Z.; Yang, Z.; Huo, X.; Lia, G. 2013.
Nanoscale 5, 1552-1556.
Zhou, Y.; Zhang, J.; Zhou, H.; Hu, X.; Zhang, L.; Zhang, M. 2013. Spectrochim. Acta, Mol.
and Biomol. Spectrosc. 106, 68-72.
2


