

1
2. MORPHOLOGY, CLIMATOLOGY, HYDROLOGY
VEGETATION AND ENVIRONMENT
Geomorphology
Despite its little area, Lebanon enjoys various climatic zones, agricultural orientation, forest species and four geomorphologic zones.
Table 2.1 – Geomorphologic zones of Lebanon
Seashore and Coastal plain
Lebanese seashore
Extends over 220 km between Arida (North) and Ras Al-Naqoura (South). Deeply cut cliffs showing a recent and accelerated erosion process. Lie at the bottom of these cliffs, gravel beaches, often bordered by sandy beaches, with variable lengths (20% of the entire coast).
Coastal plain
Varies in width beneath the Mount-Lebanon range.
Very narrow along the majority of its length (7 km in average).
Wider at the Aakkar plain in the North: its width may reach 30 km with an elevation of 500
m.
Narrows between Tripoli and Jabal Terbol.
Excessively narrow (3km in average) interrupted by the crests of Mount Lebanon.
Widens slightly near Beirut and the Choueifat plain, as well as near Saida plain, from where it
extends with no interruption towards the Tyr plain with an average width of 7 km.
Broken by a series of humps (crests) until reaching the southern border.
Western mountain range (Mount Lebanon)
Mount-Lebanon extends from the North of Jabal Aakar southward up to an elevation of 3008 m (Kornet el Saouda)
and 1809 m (Jabal Niha), after which point the hills of Jabal Amel take the lead.
The total length of the mountain range is 160 km.
Its width varies from 25 km at the central part up to 45 km in the North.
The middle altitude area of Mount Lebanon is probably the most diversified part of the entire country: after a stiff
elevation of abutments, several small hills form an intermediate graduation between the sea and the peak.
The western facade of the mountain range is cut by a series of narrow valleys parallel to each other with an
inclination seaward, carrying rivers and water courses.
The eastern slopes overhang the Bekaa valley, and are generally steeper than the western slopes. There is a limited
number of seasonal rivers formed in winter as a result of the snowmelt.
The high altitude areas are totally different than the middle altitudes and are characterized by stiff elevations and
scarps that reach the peak.
Despite the important precipitations (more than two meters, in the form of snow), the landscape is dry and stripped
because of the water being wasted by infiltration through the karstic basins.
Crest-line starts at around 1800 m and is formed of large, circular and grayish peaks, especially in the North.
Interior plain (Bekaa valley)
Depression at an average elevation of 900 m, and measures 120 km (N-S) by 8-12 km (E-W) in average, with an
exceptional width of 25 km at Hermel (in the North).
Slopes are very soft, with the highest point located near Baalbek at 1100 m, where the valley mingles with the
abutments of Anti-Lebanon mountain range.
Northern and
Central Bekaa
Comprises the valley of Nahr el Aassi and expands up till Haouch el Nabi in the south. This
region, rich in agriculture, contains the sources of the Litani river.
Southern Bekaa Expands from Zahleh-Rayak region down to Marjaayoun in the South. This is also a rich
agricultural area producing a large variety of fruits and vegetables.
Eastern mountain range (Anti-Lebanon)
Lower than Mount Lebanon, the high altitude area is a high plateau (dry) with a width of 30 km and an average elevation of 2,300 m (the maximum being 2,616 m at Tallet Moussa). The plateau inclines southward reaching an elevated plain (1,400 m) that creates a natural break-up between Eastern part and Jabal el Cheikh (Mount Hermon). The Anti-Lebanon mountain range has no deep valleys as it is the case in Mount Lebanon.
Jabal el Cheikh extends over 100 km starting from Yanta in its North down to Shebaa in the South. Its crests and slopes are a catchment feeding rivers flowing towards Bekaa valley (West), Houla Lake in Palestine (South) and Aaouej plain in Syria (East). Thus, Jabal el Cheikh intercepts and redistributes water resources in this arid region.
Geomorphology, geology and soil, climate and rainfall, hydrology, water sector calculations, vegetation zones,
fire forests, and reforestation are the main topics of this chapter.

2
Source: CDR (2004)
Beirut
Trablous
Jounieh
Nabatiyeh
Zahleh

3
Geology and soil
Lebanon geological formations, settled until the Miocene-Pliocene periods, are formed mainly of
sedimentary carbon rocks, limestone and dolomite. In a lesser extent, they include clastic rocks (detritic
rocks), sandstone, mudstone, marl and clay. Locally, some volcanic rocks such as pyroclastic basalt may be
found. Jurassic and cretaceous limestone represents the main feature (armature) of Lebanon topography.
Apart from recent sediments within the plain of Aakkar or the Bekaa valley, these are the core karstic
formations that determine the landscape and water resources in Lebanon.
Table 2.2 - Stratigraphic column of Lebanon Period Epoch Thickness Lithology
Quaternary Pleistocene / Recent Variable Eolian sands and alluvium
Tertiary
Pliocene Up to 500m Limestone, marl , volcanic material, sand and conglomerate
Miocene Up to 300m Marly limestone, sand and conglomerate
Eocene Several hundred meters Marly limestone
Paleocene Combined with Senonian
Cretaceous
Senonian (Chekka marl) 100 to 500m Marl
Turonian (Maameltain Lst.) 200 to 300m Marly limestone, limestone
Cenomanian (Sannine Lst.) Up to 700m Dolomitic limestone, and marly limestone
Upper Aptian/Albian (Hammana formation) 100 to 400m Marl and limestone
Lower Aptian (Mdeirij Lst.) About 45m Limestone
Lower Aptian (Abeih sandstone) 80 to 170m Sandstone and marlstone
Neocomian (Chouf sandstone) 10 to 300m Sandstone
Jurassic
Portlandian (Salima Lst.) Up to 180m Oolitic limestone and clay
Kimmeridgian (Bikfaya Lst.) Up to 80m Dolomitic limestone
Oxfordian (Bhannes volcanics) Up to 150m Marly limestone, volcanic complex
Callovian (Kesrwan Lst.) Over 1000m Dolomitic limestone
Photo 2.1 - Limestone in the region of Kesrouane
Source: Picture taken by Vicken Ashkarian (2003)
Resulting from the transformation
of rocks under the combined
influence of weather, vegetation
cover, and slope of the terrain,
Lebanese soils are typically
Mediterranean.
The majority of soils are
calcareous, apart from sandy
gravelly soils formed on the
cretaceous strata. The most
expanded soils are Terra Rossa
and Rendzina.
Photo 2.2 – Terra rossa (red soil)
Source: picture retrieved of
www.wikipedia.org
Photo 2.3 - Rendzina
Source:
http://www.inra.fr/internet/Hebergement/afe
s/Ressources/photos/sol115.php
Lebanon soils are young, fragile
and subject to erosion, especially
in the mountains and hills that
represent 73% of the country.
Topography, rain intensity and
surface runoff are major factors
increasing erosion caused by the
precipitations, especially where
the protective green cover has
disappeared. The erosion intensity
of Lebanon soils is proved by the
stratification of alluvial loam
terraces of the coastal rivers.

4
Climatology
Geographical situation (northern temperate zone, as well as Mediterranean zone) and its morphology
determine the weather in Lebanon. In fact, there are two mountain chains expanding perpendicularly to the
atmospheric circulation and constituting the core of the country. They are at the origin of a climatic
variability at small distances. Hence, a 50 km cross section shows climate variations: a subtropical coastal
climate succeeded by a typically Mediterranean climate at low elevations and a cold weather at higher
elevations covered with snow during the winter, reaching a semi-desert plain, too dry to allow agriculture.
These variations favor a great diversity in ecosystems and landscapes in a limited surface area.
Rafic Hariri International Airport (RHIA), Beirut Golf, Zahelh (Haoush al Oumara) and Tripoli measure
stations provide the General Directorate of Civil Aviation, Climatology Service with weather data for 2008.
Table 2.3 – Temperature, rainfall and windspeed in 2008
Total/average 2008 Coastal Zones Bekaa valley
RHIA Beirut Golf Tripoli Zahleh
Mean temperature (°C) 22.4 22.7 20.4 18.6
Mm of rain 589.0 815.4 728.1 366.1
Mean relative humidity (%) 58.6 58.3 58.6 53.3
Wind mean power (m/second) 3.3 2.7 2.8 2.9
Maximal wind speed (degrees) 236.7 242.5 265.0 237.5
Rainy days 60 64 60 56
Table made by CAS based on General Directorate of Civil Aviation, Climatology Service data (2008)
Temperature The average annual temperature on the coast varies between 19.5
o C and 21.5ºC and decreases by around 3ºC
for each 500 m vertical, reaching 9ºC at 1000 m and 1ºC at 2000 m. January is the coldest month, with an
average daily temperature of -4ºC in the mountains and 7ºC in coastal zones. The warmest months of the
year are July and August, where the daily average reaches up to 28ºC in the mountains and 33ºC in coastal
cities. The day and night temperature variations are soft on the coast (6-8ºC), but they increase in the Bekaa
valley where they can reach 24 ºC in the summer.
Table 2.4 – Temperature peaks and troughs in 2008
Temperature (°C) Coastal Zones Bekaa valley
RHIA Beirut Golf Tripoli Zahleh
Mean temperature 22.4 22.7 20.4 18.6
General average: 19.5–21.5
Minimum temperature 6.0 (February) 3.6 (January) 0.1 (January) -6.5 (January)
General average: January 7
Maximum temperature 37.9 (April) 39.3 (April) 36.1 (April) 42.0 (August)
General average: July-August 33
Source: Table made by CAS based on General Directorate of Civil Aviation, Climatology Service data (2008)
Graph 2.1 – Monthly mean temperature in 2008
Graph made by CAS based on General Directorate of Civil Aviation, Climatology Service data (2008)
0.0
10.0
20.0
30.0
RHIA Beirut Golf Zahleh Tripoli

5
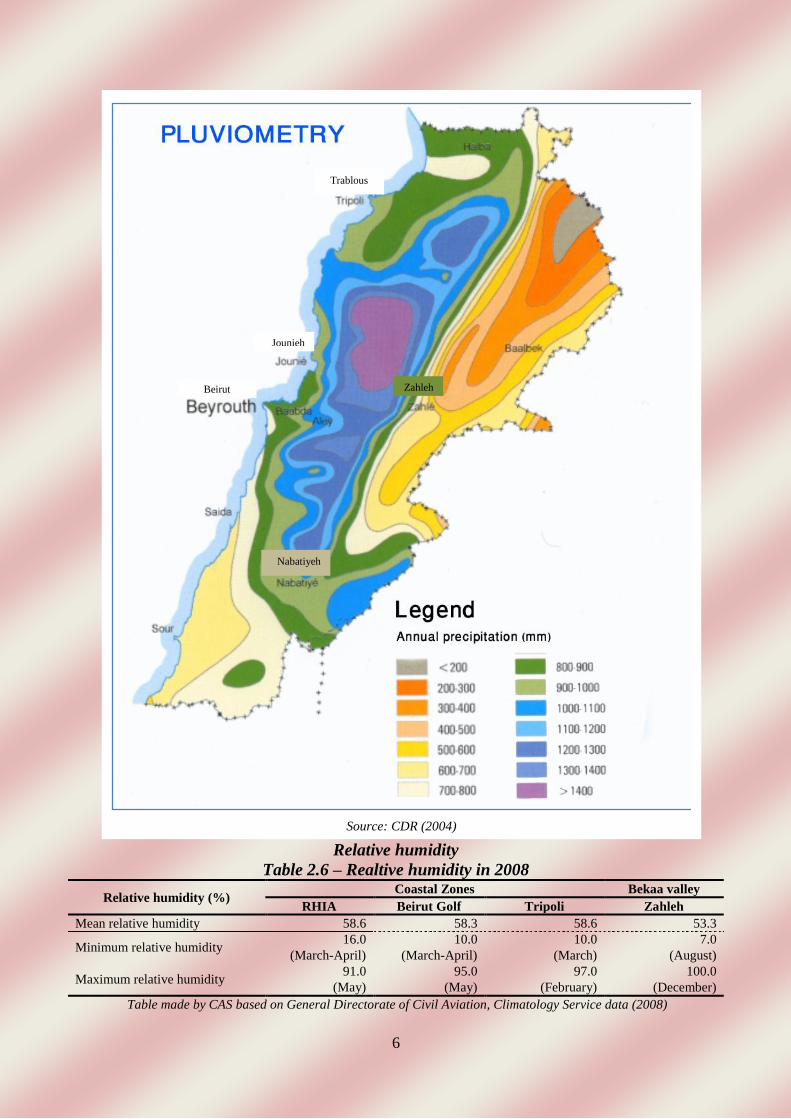
Rainfall The average annual rainfall on the coastal zones varies between 700 and 1000 mm and increases
towards the N-S direction.
The Mount Lebanon forms a barrier against the rain movement and the precipitations can reach more
than 1400 mm per annum (the majority of which is snow). Rainfall decreases rapidly in the eastern slope
of Mount Lebanon and registers only 600 mm.
Rainfall in the Bekaa valley varies between 800 mm (southern Bekaa) and 200 mm (extreme north -east
of the valley). As for the Anti-Lebanon, rainfall is around 600 mm and increases up to more than 1000
mm in Jabal el Cheikh.
The global amount of precipitations is estimated at 8 600 millions of m3 (MCM) per annum, to which it
should be added the amount of snow, which is around 2 200 MCM.
The long term meteorological observations carried out for Beirut and Central Bekaa highlight the
following characteristics:
- Lebanon has a high average in rainfall per annum (Beirut, 893 mm).
- Great seasonal variations with 80-90% of the annual rainfall occurring between November and
March, and less than 5% between May and September.
- Strong rain showers that can cause floods and erosion.
- Precipitations occur during 80 to 90 days per year, basically between the months of October and
April.
Table 2.5 – Rainflall peaks and troughs in 2008
Rainfall (mm) Coastal Zones Bekaa valley
RHIA Beirut Golf Tripoli Zahleh
Total precipitation 598.0 815.4 728.1 366.1
General average: 700 – 1 000 mm 200–800 mm
Minimum precipitation 0 0 mm 0 mm 0 mm
(June-August) (June-August) (June-July) (June-July)
Maximum precipitation 178 mm 247.2 mm 197.8 mm 102.4 mm
(January) (January) (January) (February)
Table made by CAS based on General Directorate of Civil Aviation, Climatology Service data (2008)
The previous tables show that temperature and rainfall general averages are not respected especially on
coastal zones; which is a sign of climate change in Lebanon.
Graph 2.2 – Monthly mm of rain in 2008
Graph made by CAS based on General Directorate of Civil Aviation, Climatology Service data (2008)
0.0
50.0
100.0
150.0
200.0
250.0
RHIA Beirut Golf Zahleh Tripoli
6
Relative humidity
Table 2.6 – Realtive humidity in 2008
Relative humidity (%) Coastal Zones Bekaa valley
RHIA Beirut Golf Tripoli Zahleh
Mean relative humidity 58.6 58.3 58.6 53.3
Minimum relative humidity 16.0 10.0 10.0 7.0
(March-April) (March-April) (March) (August)
Maximum relative humidity 91.0 95.0 97.0 100.0
(May) (May) (February) (December)
Table made by CAS based on General Directorate of Civil Aviation, Climatology Service data (2008)
Source: CDR (2004)
Beirut
Trablous
Jounieh
Nabatiyeh
Zahleh

7
Wind power
Table 2.7 – Wind mean power in 2008
Wind power (m/second) Coastal Zones Bekaa valley
RHIA Beirut Golf Tripoli Zahleh
Mean wind power 3.3 2.7 2.8 2.9
Maximum wind power 28.0 24.9 24.0 21.0
(January) (January) (January) (December)
Table made by CAS based on General Directorate of Civil Aviation, Climatology Service data (2008)
Wind direction
Table 2.8 – Maximum wind direction in 2008
Wind direction (°) Coastal Zones Bekaa valley
RHIA Beirut Golf Tripoli Zahleh
Average maximum wind direction 236.7 242.5 265.0 237.5
Maximum wind direction 330.0 340.0 340.0 320.0
(November) (November) (November-December) (April)
Source: Table made by CAS based on General Directorate of Civil Aviation, Climatology Service data (2008)
Rainy days in 2008
Table 2.9 – Rainy days in 2008
Rainy days Coastal Zones Bekaa valley
RHIA Beirut Golf Tripoli Zahleh
Number 60 64 56 64
Minimum number 0 0 0 0
(June-August) (June-August) (June-August) (June-July)
Maximum number 13 12 12 13
(January) (January) (December) (December)
Table made by CAS based on General Directorate of Civil Aviation, Climatology Service data (2008)
Graph 2.3 – Monthly mean wind power in 2008
Graph made by CAS based on General Directorate of Civil Aviation, Climatology Service data (2008)
0.0
1.0
2.0
3.0
4.0
5.0
RHIA Beirut Golf Zahleh Tripoli
8
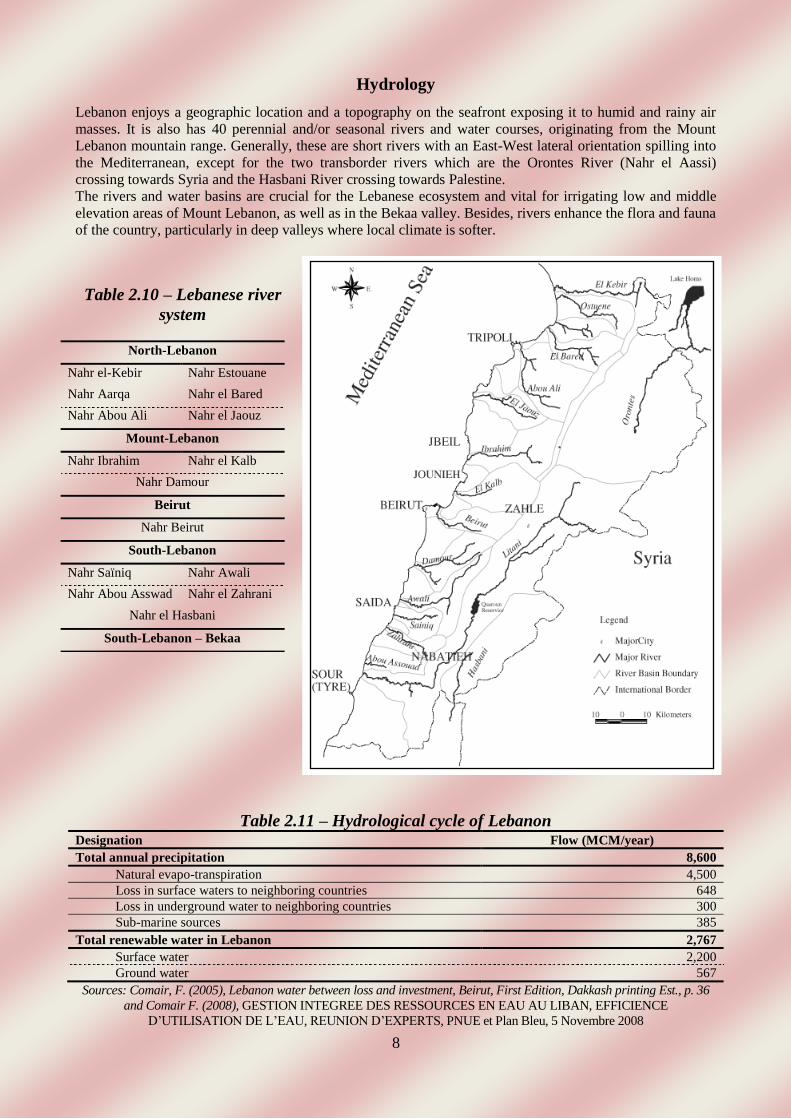
Hydrology
Lebanon enjoys a geographic location and a topography on the seafront exposing it to humid and rainy air
masses. It is also has 40 perennial and/or seasonal rivers and water courses, originating from the Mount
Lebanon mountain range. Generally, these are short rivers with an East-West lateral orientation spilling into
the Mediterranean, except for the two transborder rivers which are the Orontes River (Nahr el Aassi)
crossing towards Syria and the Hasbani River crossing towards Palestine.
The rivers and water basins are crucial for the Lebanese ecosystem and vital for irrigating low and middle
elevation areas of Mount Lebanon, as well as in the Bekaa valley. Besides, rivers enhance the flora and fauna
of the country, particularly in deep valleys where local climate is softer.
Table 2.10 – Lebanese river
system
Table 2.11 – Hydrological cycle of Lebanon Designation Flow (MCM/year)
Total annual precipitation 8,600
Natural evapo-transpiration 4,500
Loss in surface waters to neighboring countries 648
Loss in underground water to neighboring countries 300
Sub-marine sources 385
Total renewable water in Lebanon 2,767
Surface water 2,200
Ground water 567
Sources: Comair, F. (2005), Lebanon water between loss and investment, Beirut, First Edition, Dakkash printing Est., p. 36
and Comair F. (2008), GESTION INTEGREE DES RESSOURCES EN EAU AU LIBAN, EFFICIENCE
D’UTILISATION DE L’EAU, REUNION D’EXPERTS, PNUE et Plan Bleu, 5 Novembre 2008
North-Lebanon
Nahr el-Kebir Nahr Estouane
Nahr Aarqa Nahr el Bared
Nahr Abou Ali Nahr el Jaouz
Mount-Lebanon
Nahr Ibrahim Nahr el Kalb
Nahr Damour
Beirut
Nahr Beirut
South-Lebanon
Nahr Saïniq Nahr Awali
Nahr Abou Asswad Nahr el Zahrani
Nahr el Hasbani
South-Lebanon – Bekaa
Nahr Litani
Bekaa
Nahr el Assi
9
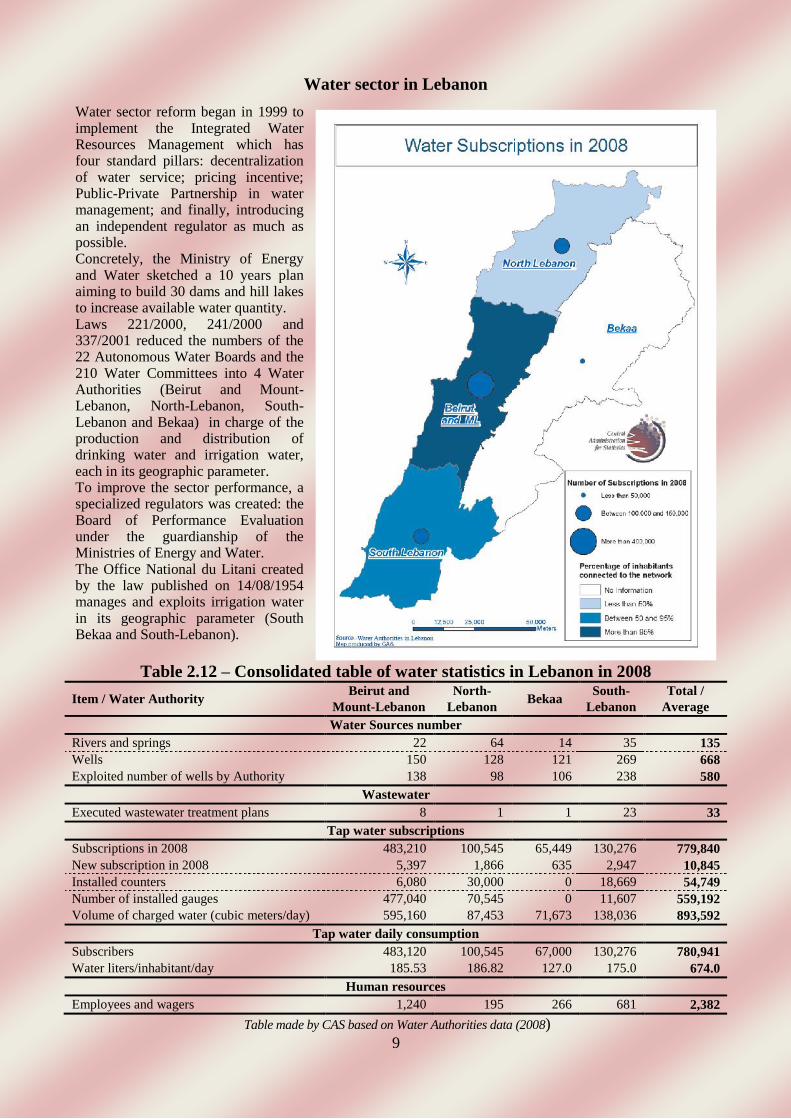
Water sector in Lebanon
Water sector reform began in 1999 to implement the Integrated Water Resources Management which has four standard pillars: decentralization of water service; pricing incentive; Public-Private Partnership in water management; and finally, introducing an independent regulator as much as possible. Concretely, the Ministry of Energy and Water sketched a 10 years plan aiming to build 30 dams and hill lakes to increase available water quantity. Laws 221/2000, 241/2000 and 337/2001 reduced the numbers of the 22 Autonomous Water Boards and the 210 Water Committees into 4 Water Authorities (Beirut and Mount-Lebanon, North-Lebanon, South-Lebanon and Bekaa) in charge of the production and distribution of drinking water and irrigation water, each in its geographic parameter. To improve the sector performance, a specialized regulators was created: the Board of Performance Evaluation under the guardianship of the Ministries of Energy and Water. The Office National du Litani created by the law published on 14/08/1954 manages and exploits irrigation water in its geographic parameter (South Bekaa and South-Lebanon).
Table 2.12 – Consolidated table of water statistics in Lebanon in 2008
Item / Water Authority Beirut and
Mount-Lebanon
North-
Lebanon Bekaa
South-
Lebanon
Total /
Average
Water Sources number
Rivers and springs 22 64 14 35 135
Wells 150 128 121 269 668
Exploited number of wells by Authority 138 98 106 238 580
Wastewater
Executed wastewater treatment plans 8 1 1 23 33
Tap water subscriptions
Subscriptions in 2008 483,210 100,545 65,449 130,276 779,840
New subscription in 2008 5,397 1,866 635 2,947 10,845
Installed counters 6,080 30,000 0 18,669 54,749
Number of installed gauges 477,040 70,545 0 11,607 559,192
Volume of charged water (cubic meters/day) 595,160 87,453 71,673 138,036 893,592
Tap water daily consumption
Subscribers 483,120 100,545 67,000 130,276 780,941
Water liters/inhabitant/day 185.53 186.82 127.0 175.0 674.0
Human resources
Employees and wagers 1,240 195 266 681 2,382
Table made by CAS based on Water Authorities data (2008)

10
Beirut and Mount-Lebanon Authority is the biggest. It recruits 52.1% of total Water Authorities employees
and wagers, has 61.9% of subscribers, 62.0% of 2008 subscriptions, 49.8% of 2008 new subscriptions, 85.3%
of installed gauges and 66.6% of the total volume of charged water in cubic meters/day.
As for rivers and springs, North Lebanon Water Authority is the richest one with 47.1% of the total; While,
wells are more common in South Lebanon Water Authority (40.3%). In fact, the Mohafazat of South-
Lebanon and Nabatiyeh is very rich in groundwater. This Water Authority exploits the maximum number of
water sources (41.0%) and has the maximum number of executed wastewater treatment plants (69.7%).
Finally, North-Lebanon has the biggest number of installed counters (54.8%) and its subscribers have the
highest tap water consumption (186.82 liters/inhabitant/day).
Millennium Development Goal 7: Ensure
environmental sustainability
Target 7.C: Halve, by 2015, the proportion of people
without sustainable access to safe drinking water and
basic sanitation
7.8 Proportion of population using an improved
drinking water source
7.9 Proportion of population using an improved
sanitation facility
Just for information
Internal Renewable water resources
= Precipitation – evapo-transpiration
= 4,100 MCM/year
Dependency ratio = 0% because Lebanon does not
have inflows of water from neighboring countries
National water wealth
= Precipitation – Evapo-transpiration – river inflows
Inhabitants
= 1,091 CM/inhabitant/year
Knowing that water stress threshold is equal to 1,700
CM/inhabitant/year

11
Vegetation zones of Lebanon
Vegetation zones display vegetation cover and protected vegetal areas.
Vegetation cover Climate influences the vegetation cover in Lebanon. There are four major phytological (botanical) stages or
levels, between the coastline, the mountain then the hinterland:
- Thermo-Mediterranean level at an altitude of 0-1,000 m: pines (Beirut as well as the western slope of
Mount-Lebanon), carob trees, storax, oak trees, willows (the slopes of Niha and Baruk mountains, as
well as coastal zones, and the piedmonts of Mount Hermon in the hinterland).
- Supra-Mediterranean level at an altitude of 1,000-1,500 m: cypress, oak trees (Ehden, Sir ed-Dinniyeh,
highlands of Qadisha, piedmonts of mount Mekmel and Aakkar).
- Mediterranean mountainous level at an altitude of 1,500-2,000 m: cedars, fir trees (Bsharreh, Ehden,
Qadisha, Hadath ej-Jebbeh, Tannourine, Baruk).
- Oro-Mediterranean level at an altitude of 2,000 m and beyond: no fruit trees, only thorn plants such as
juniper (Talaat Moussa on the high altitudes of Anti-Lebanon, etc.).
Graph 2.4 – Distribution of forest species in %
Graph made by CAS based on Ministry of
Environment (2001), State of the Environment
Report
0
10
20
30
40
50
60
Fir Cypress Cedar Juniper Pine Oak
1 1
3
13
24
58
12
According to the Atlas of Forests in Lebanon, published in 2005 by the Ministry of Agriculture in
cooperation with FAO (Inventory & Evaluation of Trees in Lebanon) and in collaboration with the
Directorate of Geographic Affairs of the Lebanese Army, Lebanon forest cover area is 134,371.64 ha
(including coniferous and deciduous forests) while other forested areas (including woodlands with or without
trees) are 120,573.96 ha. Thus, total forest cover is 13.12% of the country total area.
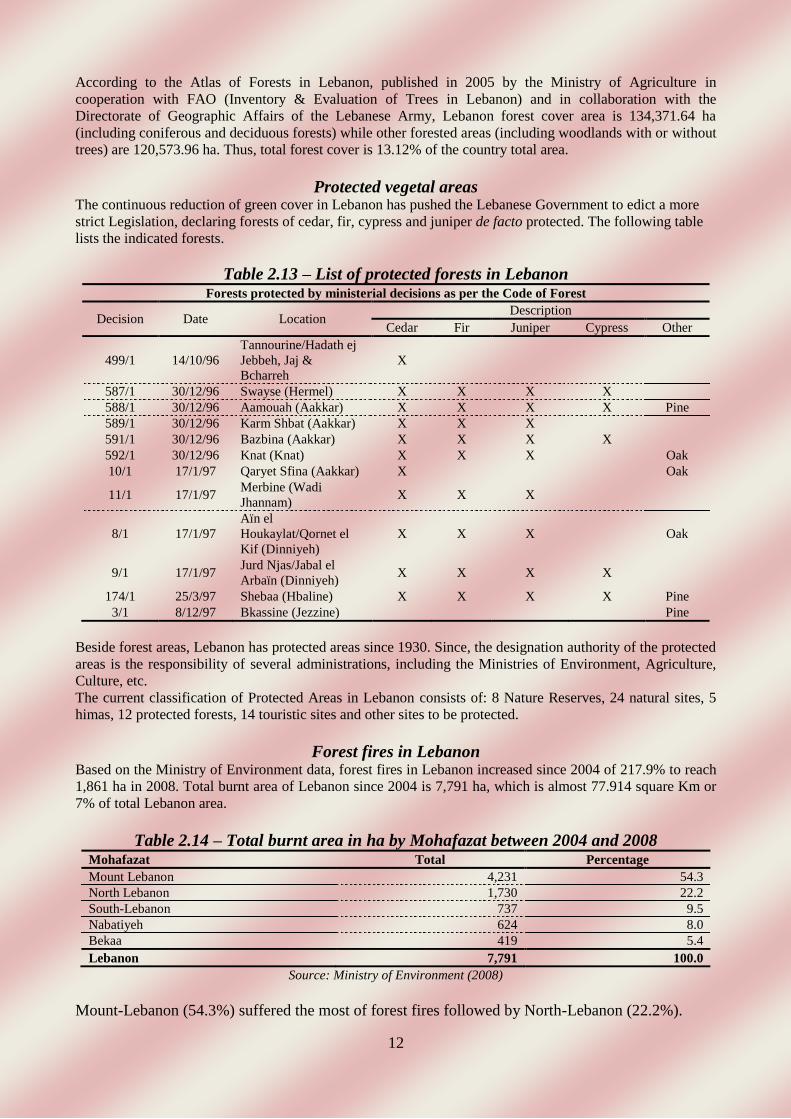
Protected vegetal areas The continuous reduction of green cover in Lebanon has pushed the Lebanese Government to edict a more
strict Legislation, declaring forests of cedar, fir, cypress and juniper de facto protected. The following table
lists the indicated forests.
Table 2.13 – List of protected forests in Lebanon Forests protected by ministerial decisions as per the Code of Forest
Decision Date Location Description
Cedar Fir Juniper Cypress Other
499/1 14/10/96
Tannourine/Hadath ej
Jebbeh, Jaj &
Bcharreh
X
587/1 30/12/96 Swayse (Hermel) X X X X
588/1 30/12/96 Aamouah (Aakkar) X X X X Pine
589/1 30/12/96 Karm Shbat (Aakkar) X X X
591/1 30/12/96 Bazbina (Aakkar) X X X X
592/1 30/12/96 Knat (Knat) X X X Oak
10/1 17/1/97 Qaryet Sfina (Aakkar) X Oak
11/1 17/1/97 Merbine (Wadi
Jhannam) X X X
8/1 17/1/97
Aïn el
Houkaylat/Qornet el
Kif (Dinniyeh)
X X X Oak
9/1 17/1/97 Jurd Njas/Jabal el
Arbaïn (Dinniyeh) X X X X
174/1 25/3/97 Shebaa (Hbaline) X X X X Pine
3/1 8/12/97 Bkassine (Jezzine) Pine
Beside forest areas, Lebanon has protected areas since 1930. Since, the designation authority of the protected
areas is the responsibility of several administrations, including the Ministries of Environment, Agriculture,
Culture, etc.
The current classification of Protected Areas in Lebanon consists of: 8 Nature Reserves, 24 natural sites, 5
himas, 12 protected forests, 14 touristic sites and other sites to be protected.
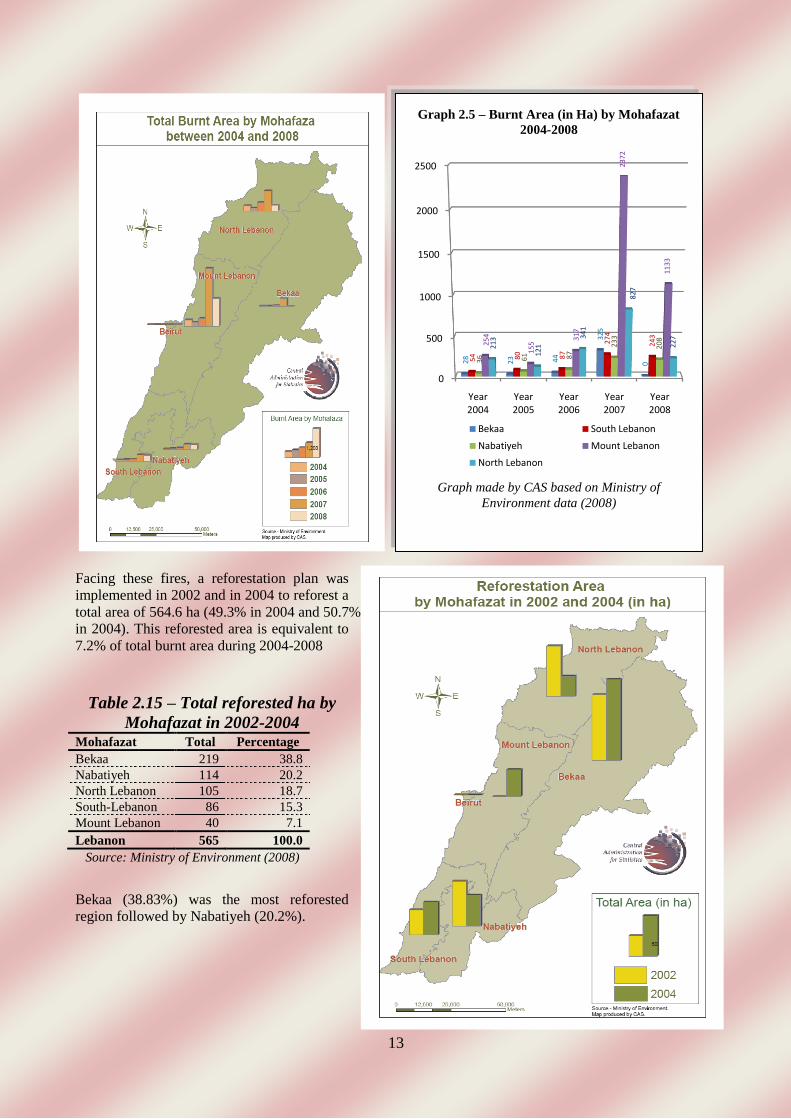
Forest fires in Lebanon Based on the Ministry of Environment data, forest fires in Lebanon increased since 2004 of 217.9% to reach
1,861 ha in 2008. Total burnt area of Lebanon since 2004 is 7,791 ha, which is almost 77.914 square Km or
7% of total Lebanon area.
Table 2.14 – Total burnt area in ha by Mohafazat between 2004 and 2008 Mohafazat Total Percentage
Mount Lebanon 4,231 54.3
North Lebanon 1,730 22.2
South-Lebanon 737 9.5
Nabatiyeh 624 8.0
Bekaa 419 5.4
Lebanon 7,791 100.0
Source: Ministry of Environment (2008)
Mount-Lebanon (54.3%) suffered the most of forest fires followed by North-Lebanon (22.2%).
13
Facing these fires, a reforestation plan was
implemented in 2002 and in 2004 to reforest a
total area of 564.6 ha (49.3% in 2004 and 50.7%
in 2004). This reforested area is equivalent to
7.2% of total burnt area during 2004-2008
Table 2.15 – Total reforested ha by
Mohafazat in 2002-2004 Mohafazat Total Percentage
Bekaa 219 38.8
Nabatiyeh 114 20.2
North Lebanon 105 18.7
South-Lebanon 86 15.3
Mount Lebanon 40 7.1
Lebanon 565 100.0
Source: Ministry of Environment (2008)
Bekaa (38.83%) was the most reforested
region followed by Nabatiyeh (20.2%).
Graph 2.5 – Burnt Area (in Ha) by Mohafazat
2004-2008
Graph made by CAS based on Ministry of
Environment data (2008)
0
500
1000
1500
2000
2500
Year 2004
Year 2005
Year 2006
Year 2007
Year 2008
28 23 44
325
0
54 80 87
274
243
36 61 87
233
208
254
155
317
23
72
1133
213
121
341
827
227
Bekaa South Lebanon
Nabatiyeh Mount Lebanon
North Lebanon


