
1
Life Situations of Young Fathers in Greater Jakarta
Iwu Dwisetyani Utomo, Anna Reimondos, Ariane J. Utomo
Peter McDonald, Terence H. Hull,
Abstract
Very little is known about the fatherhood experiences of young men in Indonesia. This paper
uses the 2010 Greater Jakarta Transition to Adulthood Survey to describe the lives of young
fathers in Jakarta, Bekasi and Tangerang. It demonstrates how education determines
parenthood status among men and women, and compares and contrasts the labour market
experience of young fathers and mothers. This provides the background for a review of
young parents’ health and wellbeing, their attitudes towards gender roles and children. Young
adults in the Indonesian capital are delaying marriage and childbirth, but those who do
become parents at an early age are likely to follow a male breadwinner model, with fathers
holding less egalitarian attitudes towards gender roles than either their partners or males who
are not fathers.
Key words: fatherhood; young adults; work, gender roles, Indonesia.
2
Background
While interest in researching fatherhood began in the 1970s and 80s (Elster, 1986; Marsiglio,
Amato, Day & Lamb, 2000) it still lags far behind that on motherhood (Eggebeen and
Koester, 2001; Goldsheider and Hogan, 1999; Smyth and Weston, 2003). This may seem
reasonable considering the contrast between the biological implications of childbirth and
infant care for women, but in light of the important roles men are expected to play in modern
childcare, domestic management and pursuit of livelihood, research on fatherhood over time
become of greater interest to social researchers (Marsiglio, Amato, & Lamb, 2000). Earlier
studies on fatherhood have highlighted that fatherhood is a social construction, in that the
roles and expectations of father can change overtime and are culturally specific (LaRossa,
1997; Pleck and Pleck, 1997). Nevertheless in the twentieth century, studies on fatherhood
mostly focused on white middle-class (LaRossa, Gordon, Wilson, Bairan & Jaret, 1991) and
there were limited understanding of the complexity of fatherhood by ethnicity, race, cultural
and economic background (Burton & Snyder, 1998; Marsiglio, Amato & Lamb, 2000: 1175).
Internationally the male breadwinner model, with its strong definition of a
father/husband/household-head role for the male, has declined over the course of the
Twentieth Century. As Perry-Jenkins and Turner (2004:155) noted for the United States: "In
1920, 75% of working households were composed of single-earner, married couples, and
dual-earner, married households made up only approximately 9% of working families…The
latest data from the Bureau of Labour Statistics (2001) indicated that 63.2% of all married
couples with children under 18 are dual-earner, and 57.9% of all married couples with
children under 6 are dual-earners". In urban Indonesia at the turn of the twenty-first century
over half of all couples followed a single male breadwinner pattern (I. Utomo, 2005).
However education has a major impact on employment of women. If both husband and wife
were tertiary educated, 53 percent were both employed outside the home, while if neither had
tertiary degrees less than a third were dual earners (A. Utomo 2008: 63,65).
Despite the increase in dual earner households around the world, many studies both in the US
and other developed countries reveal that men maintain low levels of involvement in
domestic duties and child care (Apparala, Reifman & Munsch, 2003; Guant, 2006; Baxter et
al., 2008; Craig and Bittman, 2008; Portman and Van Der Lippe, 2009). According to these
sources the increasing involvement of women and mothers in the public sphere is not
3
balanced by males and fathers contributing more of their time to domestic work and
childcare.
The lack of attention to fatherhood roles is notable in developing countries, where such
research is very limited. For example, a very comprehensive book on “Growing up global:
the changing transitions to adulthood in developing countries” (Lloyd, 2005) dedicated one
section on the transition to parenthood, but the analysis was very general and focused largely
on motherhood. Part of the problem is the lack of data on fatherhood (Lloyd, 2005:506-76).
Fatherhood can be defined as a fertility status and as the behaviour and identity of men who
have children (Pleck, 2007:196). Fatherhood research is expected to include fathers’
engagement, accessibility and responsibility; paternal warmth, support and control; and the
economic support provided by men (Pleck & Stueve, 2001).
In Indonesia, the traditional roles of fathers and mothers are strongly divided between public
and domestic roles. Women and especially mothers are trained to be responsible for domestic
duties, household management and the caring and nurturing of children (I. Utomo, 2005),
while men and fathers to be good providers for the family. These traditional roles are
promoted through the national schooling curriculum and exemplified in textbooks used in
primary and secondary schools (I. Utomo et al., 2009). Though the breadwinner model
persists throughout Indonesian social groups, women’s increasing education levels mean that
mothers increasingly participate in the labour market and contribute to the household
economy. McDonald (2000a and 2000b) stated that gender equality is spreading through the
public sphere but this is not always matched with greater gender equality in the domestic
sphere.
In Islam, the religion of almost 90 per cent of Indonesian citizens, the father is accorded the
status of imam, the leader or head of the household (Surah Annisa, verse no. 34). He is
obliged to provide economically and is responsible for the overall wellbeing of his family, a
role endowed with a great deal of autonomy. By contrast women are taught to obey their
fathers and later their husbands, implying that they are always dependent on a man. In the
interpretation of many Islamic scholars, men have full authority in ruling women’s lives.
Messages to this effect are strongly promoted through early-morning homilies broadcast by
both radio and television across the country. Traditionally a Moslem father is portrayed as
someone with power over all family members and he should have their unquestioning

4
respect. He should be ‘served’ by the wife in particular, but also by all dependent family
members.
However, the fatherhood role in Indonesia is in the process of transformation. There is a
growing message in the secular press and among reformist Islamic scholars that fathers
should be actively serving others (Yulindrasari & McGregor 2011). The father is enjoined to
help with infant and child care-giving and development; assisting his wife during pregnancy;
during the process of delivery; and after the birth. He is expected to spend ‘quality time’ with
his children, contributing to their education and their broader socialization. This may entail
contributions of time to the preparation of meals and maintenance of the household. Popular
publications are increasingly discussing the need for fathers to be domesticated (Poerwandari,
2010). This may pose some challenges for Islamic interpretations of fatherhood roles, and it
definitely presents alternative images for the roles fathers play in the Indonesian family. But
can fathers be successful in fulfilling their work aspirations while at the same time increasing
their involvement in nurturing of children? This is classically the dilemma that has been seen
to prevent women’s advancement in the labour market, so would it put men under similar
stresses?
This paper aims to explore young fathers living in Jakarta, Bekasi and Tangerang, the
northern strip of the Jakarta megalopolis. Several dimensions of young fathers’ lives are
examined including psychological and physical health, family involvement, work
involvement and values on gender roles and children.
Data
In this paper we focus on young fathers, who are defined as men aged 20-34 years who had
fathered at least one child. Data are drawn from the 2010 Jakarta Young Adults Survey,
which asked questions relating to social characteristics, attitudes and values and was
administered face-to-face by trained interviewers.
The survey used a two-stage cluster sample. In the first stage, 60 urban village units
(Kelurahan) were selected using probability proportionate to size (PPS) criteria. In the
second stage five neighbourhoods (Rukun Tetangga/RT) were chosen from each Kelurahan
by systematic random sampling (SRS). The resulting 300 RT were mapped and a census was
conducted in them to gather information on age, sex, marital status and relationship to head
of household for all households. The census allowed the compilation of full lists of young
5
adults aged 20-34 living in each RT. Eleven eligible respondents were then selected from
each list using simple random sampling, yielding 3,300 names with the aim of achieving a
sample of 3,000 after accounting for refusals and non-contacts. In total 3,006 interviews were
successfully completed.
Method
The data were analysed using descriptive bivariate analysis as well as multivariate regression
analysis. The main objective was to examine how fathers differed in their characteristics and
attitudes from three other groups of respondents: childless men, mothers and childless
women. By comparing fathers with these groups it would be possible to see whether a
particular response to a variable was related to parenthood per se (in which case mothers and
fathers would have similar response patterns and childless men and women would have a
different pattern), to gender differences (in which case men in general would have different
views to women, regardless of parent status), or if one particular group, such as fathers,
appeared to differ from all other groups. For the descriptive bivariate analyses, sex and parent
status were cross-tabulated against each variable of interest.
Logistic regression was used in some analyses, even where the independent variable was
ordinal. For example, for attitudes towards gender and children respondents were presented
with a list of statements and asked to state their level of agreement on a 5-point likert scale,
where one equalled ‘strongly agree’ and five equalled ‘strongly disagree’. Although the
responses were ordinal, the assumption of proportional odds did not hold when tested, so
logistic regression was used, the binary outcome of interest being whether the respondent
agreed or strongly agreed with the statement versus other responses (‘mixed feelings’,
‘disagree’, ‘strongly disagree’).
In the regressions, a variable describing the combination of sex and parent status was entered
as an independent variable. Fathers were the reference category, and non-fathers, mothers
and non-mothers were compared to them. We also controlled for a number of other variables,
including age, education, employment status, religion and religiosity. The respondent’s age
was defined in three categories (20-24, 25-29, 30-34), with 25-29 as the reference category.
Highest level of education was categorized into five groups: primary school or less, junior
high school, senior high school, certificate level and Bachelors and above. Junior high school
was treated as the reference category. Muslims were compared with non-Muslims
6
(reference), and for religiosity those who were not religious or did not report how religious
they were, and those who claimed to be either religious or very religious, were compared to
those who were somewhat religious as the reference category.
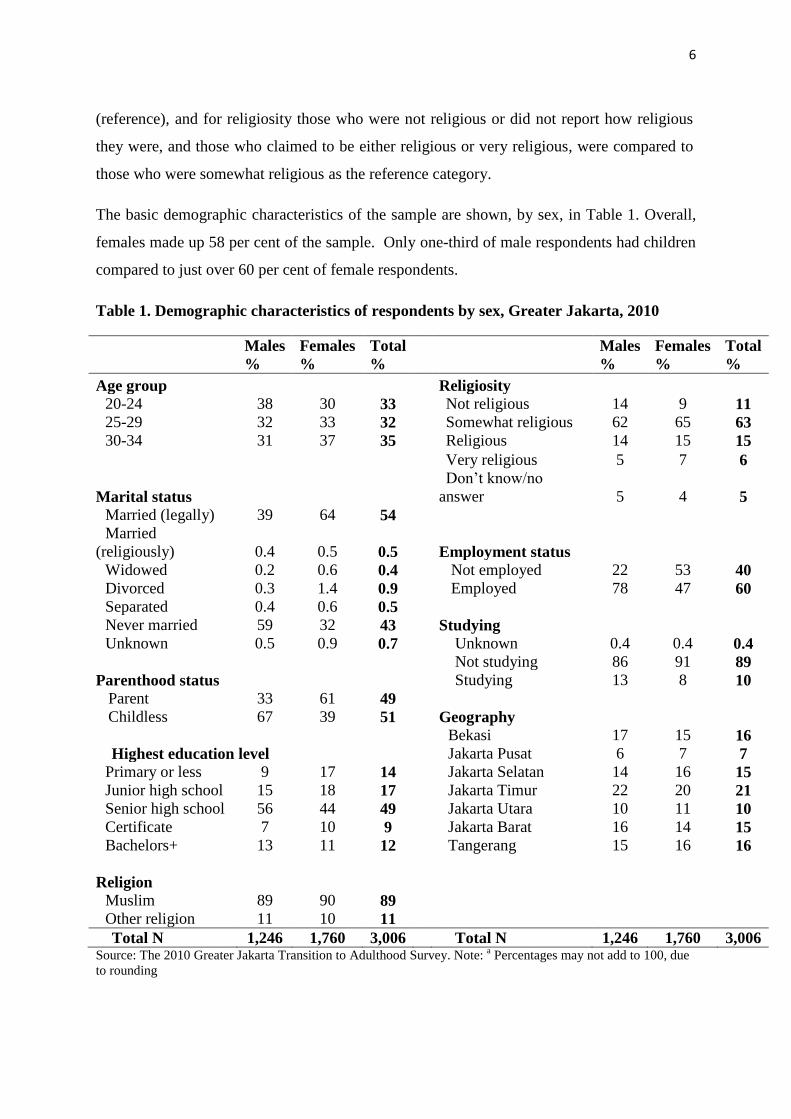
The basic demographic characteristics of the sample are shown, by sex, in Table 1. Overall,
females made up 58 per cent of the sample. Only one-third of male respondents had children
compared to just over 60 per cent of female respondents.
Table 1. Demographic characteristics of respondents by sex, Greater Jakarta, 2010
Males Females Total Males Females Total
% % % % % %
Age group Religiosity
20-24 38 30 33 Not religious 14 9 11
25-29 32 33 32 Somewhat religious 62 65 63
30-34 31 37 35 Religious 14 15 15
Very religious 5 7 6
Marital status
Don’t know/no
answer 5 4 5
Married (legally) 39 64 54
Married
(religiously) 0.4 0.5 0.5 Employment status
Widowed 0.2 0.6 0.4 Not employed 22 53 40
Divorced 0.3 1.4 0.9 Employed 78 47 60
Separated 0.4 0.6 0.5
Never married 59 32 43 Studying
Unknown 0.5 0.9 0.7 Unknown 0.4 0.4 0.4
Not studying 86 91 89
Parenthood status Studying 13 8 10
Parent 33 61 49
Childless 67 39 51 Geography
Bekasi 17 15 16
Highest education level Jakarta Pusat 6 7 7
Primary or less 9 17 14 Jakarta Selatan 14 16 15
Junior high school 15 18 17 Jakarta Timur 22 20 21
Senior high school 56 44 49 Jakarta Utara 10 11 10
Certificate 7 10 9 Jakarta Barat 16 14 15
Bachelors+ 13 11 12 Tangerang 15 16 16
Religion
Muslim 89 90 89
Other religion 11 10 11
Total N 1,246 1,760 3,006 Total N 1,246 1,760 3,006 Source: The 2010 Greater Jakarta Transition to Adulthood Survey. Note:
a Percentages may not add to 100, due
to rounding
7
Respondents’ education levels were possibly the defining characteristic of the sample. Seven
out of ten had graduated from senior high school, and over one-fifth had gone on to a tertiary
qualification. However, there was a large gender gap in educational attainment with a much
higher percentage of women completing only primary school compared to men. There were
also gender differences in other demographic characteristics. Men were much more likely to
be employed or studying than females, and reported slightly lower levels of religiosity.
Results
Experience of Fatherhood
8
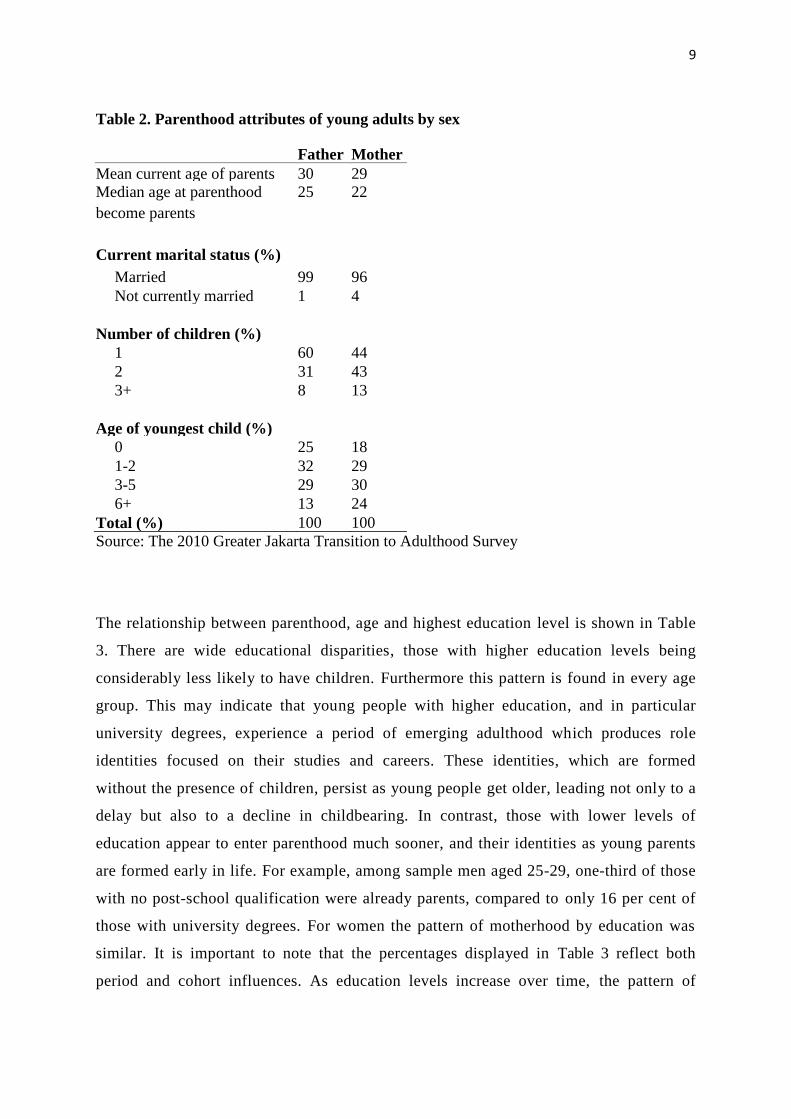
Table 2 provides descriptive statistics for the young parents in the sample, comparing
fathers and mothers. The mean current age of the young fathers was 30, and the median
age at which they had had their first child was 25, whereas for mothers it was three years
younger. Parenthood for both sexes was almost universally associated with marriage. All
of the fathers and 99 per cent of the mothers were ever-married, but a small percentage
of marriages had ended either through death or separation/divorce. Thus, 99 per cent of
the fathers and 96 per cent of the mothers were currently legally or religiously married.
Only three never married women reported having children. The fact that females had
had their first children younger than males explains the differences in family
composition evident when comparing sample mothers and fathers. Since the respondents
were aged between 20-34 and since men tend to have children at a later age than women,
on average fathers in our sample had fewer children than mothers, and their youngest
children were younger.
9
Table 2. Parenthood attributes of young adults by sex
Father
s
Mother
s Mean current age of parents 30 29
Median age at parenthood
become parents
25 22
Current marital status (%)
parents
Married 99 96
Not currently married 1 4
Number of children (%)
1 60 44
2 31 43
3+ 8 13
Age of youngest child (%)
0 25 18
1-2 32 29
3-5 29 30
6+ 13 24
Total (%)
100 100
Source: The 2010 Greater Jakarta Transition to Adulthood Survey
The relationship between parenthood, age and highest education level is shown in Table
3. There are wide educational disparities, those with higher education levels being
considerably less likely to have children. Furthermore this pattern is found in every age
group. This may indicate that young people with higher education, and in particular
university degrees, experience a period of emerging adulthood which produces role
identities focused on their studies and careers. These identities, which are formed
without the presence of children, persist as young people get older, leading not only to a
delay but also to a decline in childbearing. In contrast, those with lower levels of
education appear to enter parenthood much sooner, and their identities as young parents
are formed early in life. For example, among sample men aged 25-29, one-third of those
with no post-school qualification were already parents, compared to only 16 per cent of
those with university degrees. For women the pattern of motherhood by education was
similar. It is important to note that the percentages displayed in Table 3 reflect both
period and cohort influences. As education levels increase over time, the pattern of
10
parenthood at ages 30-34 may in the future turn out to be different for those currently
aged 20-24.
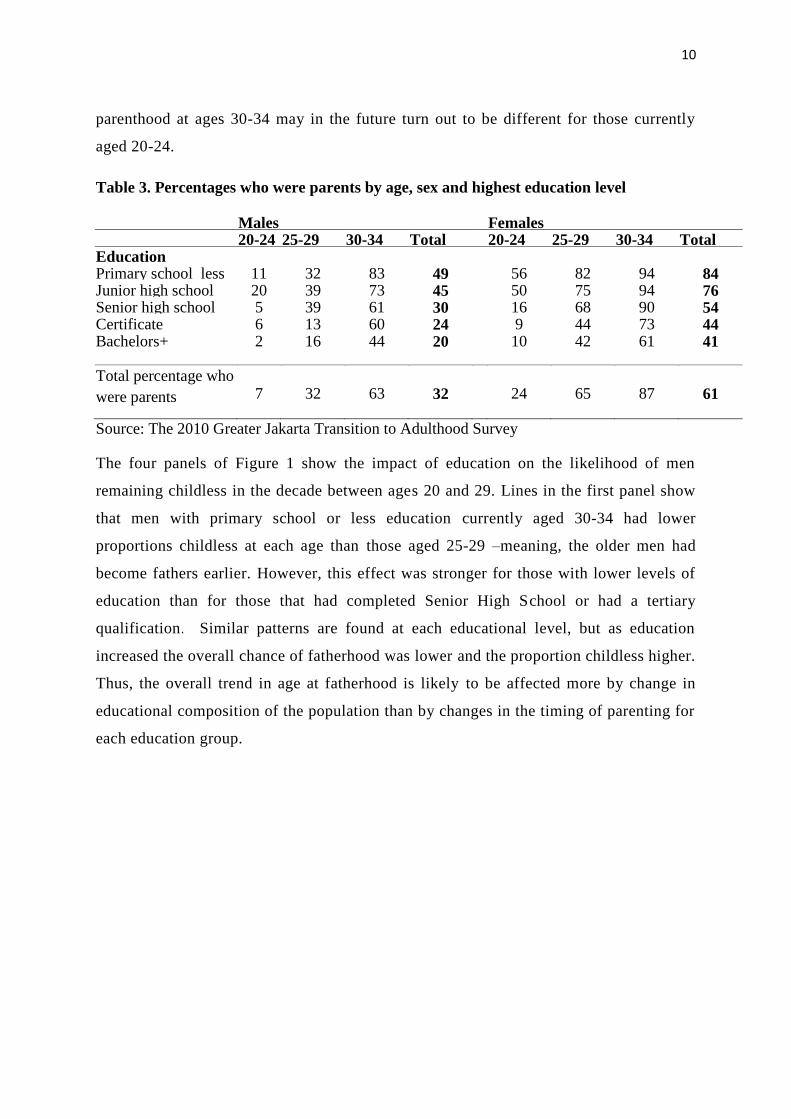
Table 3. Percentages who were parents by age, sex and highest education level
Males Females 20-24 25-29 30-34 Total 20-24 25-29 30-34 Total Education Primary school less 11 32 83 49 56 82 94 84 Junior high school 20 39 73 45 50 75 94 76 Senior high school 5 39 61 30 16 68 90 54 Certificate 6 13 60 24 9 44 73 44 Bachelors+ 2 16 44 20 10 42 61 41 Total percentage who
were parents 7 32 63 32 24 65 87 61
Source: The 2010 Greater Jakarta Transition to Adulthood Survey
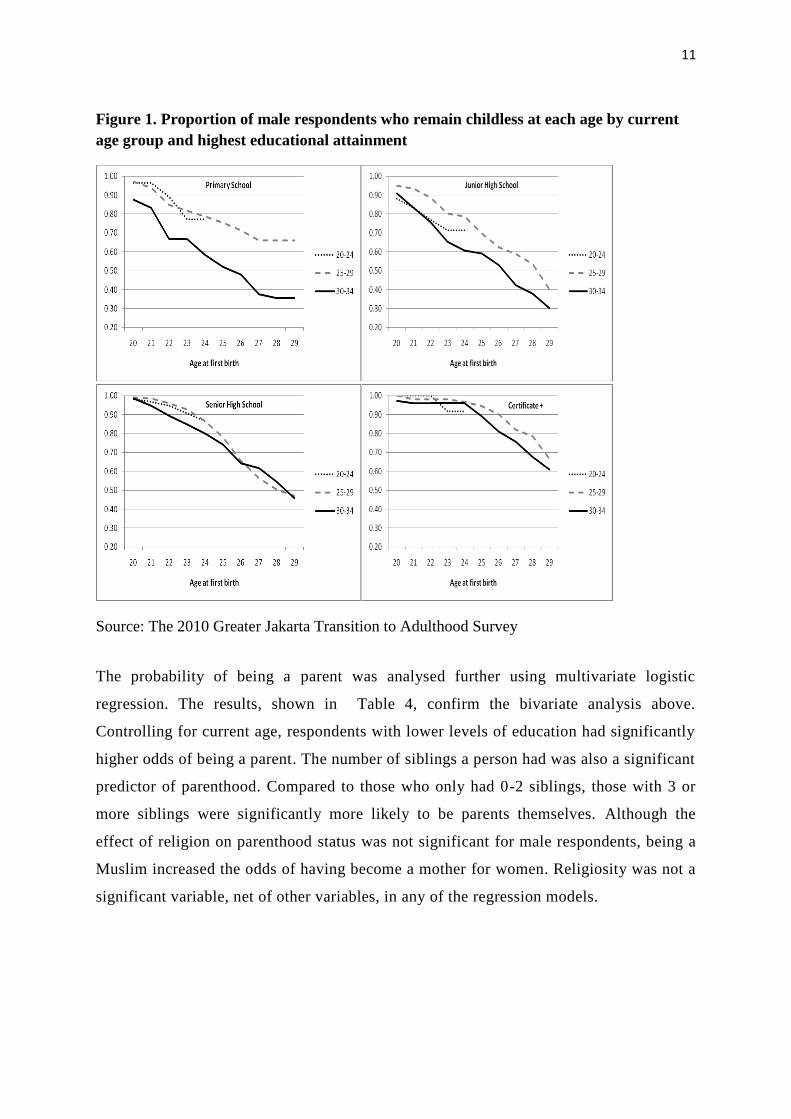
The four panels of Figure 1 show the impact of education on the likelihood of men
remaining childless in the decade between ages 20 and 29. Lines in the first panel show
that men with primary school or less education currently aged 30-34 had lower
proportions childless at each age than those aged 25-29 –meaning, the older men had
become fathers earlier. However, this effect was stronger for those with lower levels of
education than for those that had completed Senior High School or had a tertiary
qualification. Similar patterns are found at each educational level, but as education
increased the overall chance of fatherhood was lower and the proportion childless higher.
Thus, the overall trend in age at fatherhood is likely to be affected more by change in
educational composition of the population than by changes in the timing of parenting for
each education group.
11
Figure 1. Proportion of male respondents who remain childless at each age by current
age group and highest educational attainment
Source: The 2010 Greater Jakarta Transition to Adulthood Survey
The probability of being a parent was analysed further using multivariate logistic
regression. The results, shown in Table 4, confirm the bivariate analysis above.
Controlling for current age, respondents with lower levels of education had significantly
higher odds of being a parent. The number of siblings a person had was also a significant
predictor of parenthood. Compared to those who only had 0-2 siblings, those with 3 or
more siblings were significantly more likely to be parents themselves. Although the
effect of religion on parenthood status was not significant for male respondents, being a
Muslim increased the odds of having become a mother for women. Religiosity was not a
significant variable, net of other variables, in any of the regression models.

12
Table 4. Logistic regression: Odds ratios of being a parent by sex
Odds ratio All Males Females
Sex
Male (ref) --
Female 3.98***
Age group
20-24 0.16*** 0.17*** 0.15*** 25-29 (ref) -- -- --
30-34 3.54*** 3.53*** 3.64***
Highest education level
Primary or less 2.22*** 1.64** 2.72***
JHS 2.03*** 1.74*** 2.30*** SHS (ref) -- -- --
Certificate 0.48*** 0.64 0.42***
Bachelors+ 0.39*** 0.45*** 0.36***
Total number of siblings
0-2 (ref) -- -- --
3-4 1.24* 1.18 1.30*
5+ 1.43*** 1.50** 1.31*
Religion
Non-muslim (ref) -- -- --
Muslim 1.84*** 1.07 2.68***
Religiosity
Not religious/not answered 1.02 0.82 1.25
Somewhat religious (ref) -- -- --
Religious/very religious 1.09 0.94 1.21
Total number of observations 2,946 1,158 1,662 Source: The 2010 Greater Jakarta Transition to Adulthood Survey
13
Labour force participation
Employment
Overall, around 60 per cent of the sample was currently working, but the employment
situation varied significantly by sex and parenthood. Less than half the women were
employed compared to nearly 80 per cent of the men. If we compare people with children,
men who had children were more likely to work whereas women who had children were far
less likely to be working than their childless counterparts (Table 5). This is consistent with
the notion that fathers should be the economic providers for families and mothers should be
responsible for domestic duties rather than having careers in the public sphere.
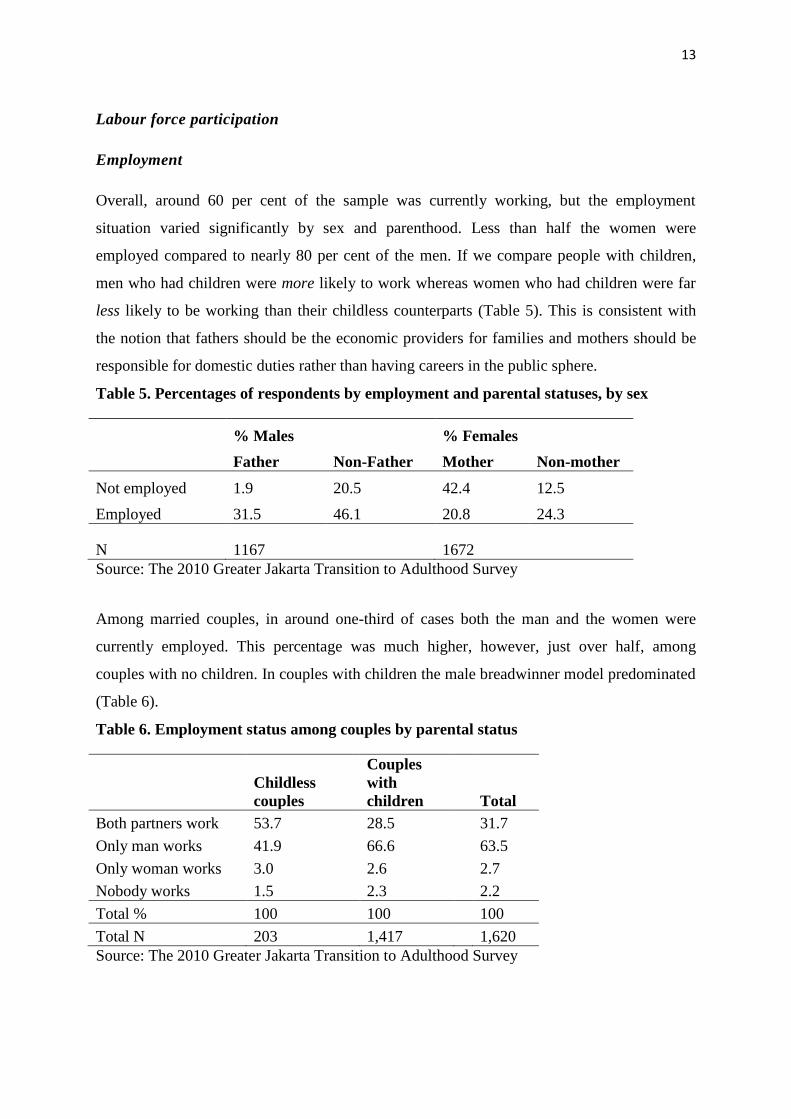
Table 5. Percentages of respondents by employment and parental statuses, by sex
% Males % Females
Father Non-Father Mother Non-mother
Not employed 1.9 20.5 42.4 12.5
Employed 31.5 46.1 20.8 24.3
N 1167 1672
Source: The 2010 Greater Jakarta Transition to Adulthood Survey
Among married couples, in around one-third of cases both the man and the women were
currently employed. This percentage was much higher, however, just over half, among
couples with no children. In couples with children the male breadwinner model predominated
(Table 6).
Table 6. Employment status among couples by parental status
Childless
couples
Couples
with
children Total
Both partners work 53.7 28.5 31.7
Only man works 41.9 66.6 63.5
Only woman works 3.0 2.6 2.7
Nobody works 1.5 2.3 2.2
Total % 100 100 100
Total N 203 1,417 1,620
Source: The 2010 Greater Jakarta Transition to Adulthood Survey
14
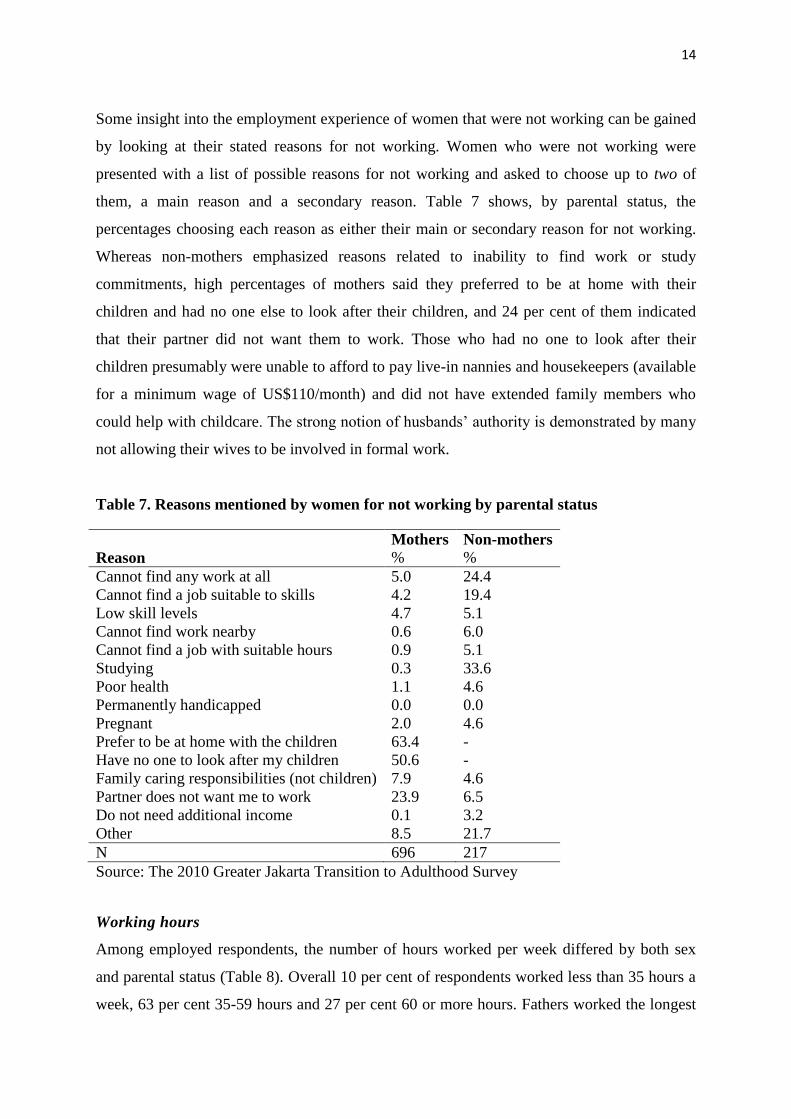
Some insight into the employment experience of women that were not working can be gained
by looking at their stated reasons for not working. Women who were not working were
presented with a list of possible reasons for not working and asked to choose up to two of
them, a main reason and a secondary reason. Table 7 shows, by parental status, the
percentages choosing each reason as either their main or secondary reason for not working.
Whereas non-mothers emphasized reasons related to inability to find work or study
commitments, high percentages of mothers said they preferred to be at home with their
children and had no one else to look after their children, and 24 per cent of them indicated
that their partner did not want them to work. Those who had no one to look after their
children presumably were unable to afford to pay live-in nannies and housekeepers (available
for a minimum wage of US$110/month) and did not have extended family members who
could help with childcare. The strong notion of husbands’ authority is demonstrated by many
not allowing their wives to be involved in formal work.
Table 7. Reasons mentioned by women for not working by parental status
Mothers Non-mothers
Reason % %
Cannot find any work at all 5.0 24.4
Cannot find a job suitable to skills 4.2 19.4
Low skill levels 4.7 5.1
Cannot find work nearby 0.6 6.0
Cannot find a job with suitable hours 0.9 5.1
Studying 0.3 33.6
Poor health 1.1 4.6
Permanently handicapped 0.0 0.0
Pregnant 2.0 4.6
Prefer to be at home with the children 63.4 -
Have no one to look after my children 50.6 -
Family caring responsibilities (not children) 7.9 4.6
Partner does not want me to work 23.9 6.5
Do not need additional income 0.1 3.2
Other 8.5 21.7
N 696 217
Source: The 2010 Greater Jakarta Transition to Adulthood Survey
Working hours
Among employed respondents, the number of hours worked per week differed by both sex
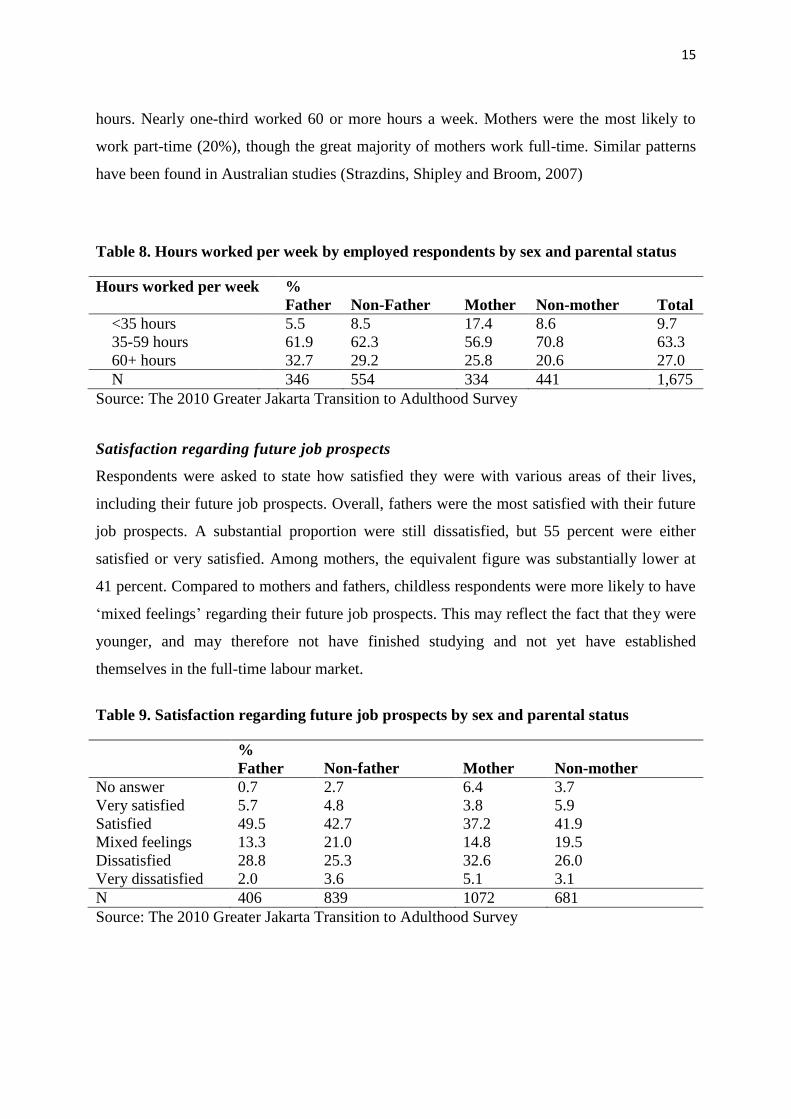
and parental status (Table 8). Overall 10 per cent of respondents worked less than 35 hours a
week, 63 per cent 35-59 hours and 27 per cent 60 or more hours. Fathers worked the longest
15
hours. Nearly one-third worked 60 or more hours a week. Mothers were the most likely to
work part-time (20%), though the great majority of mothers work full-time. Similar patterns
have been found in Australian studies (Strazdins, Shipley and Broom, 2007)
Table 8. Hours worked per week by employed respondents by sex and parental status
Hours worked per week %
Father Non-Father Mother Non-mother Total
<35 hours 5.5 8.5 17.4 8.6 9.7
35-59 hours 61.9 62.3 56.9 70.8 63.3
60+ hours 32.7 29.2 25.8 20.6 27.0
N 346 554 334 441 1,675
Source: The 2010 Greater Jakarta Transition to Adulthood Survey
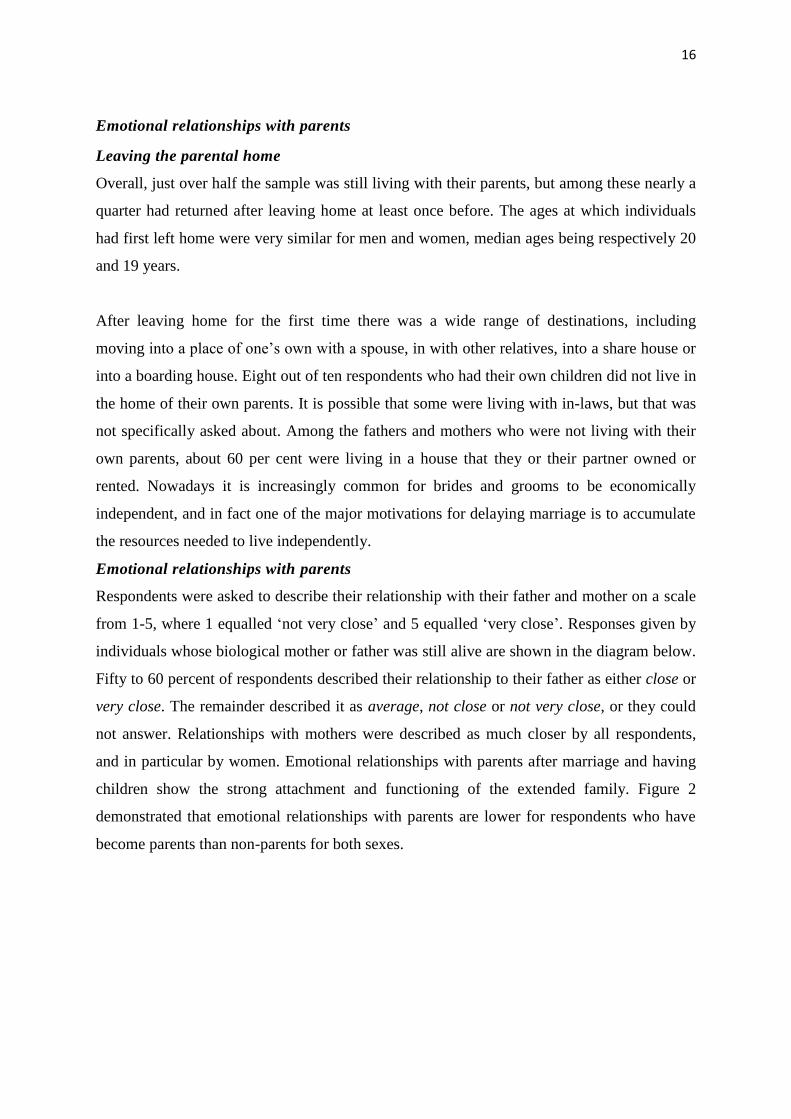
Satisfaction regarding future job prospects
Respondents were asked to state how satisfied they were with various areas of their lives,
including their future job prospects. Overall, fathers were the most satisfied with their future
job prospects. A substantial proportion were still dissatisfied, but 55 percent were either
satisfied or very satisfied. Among mothers, the equivalent figure was substantially lower at
41 percent. Compared to mothers and fathers, childless respondents were more likely to have
‘mixed feelings’ regarding their future job prospects. This may reflect the fact that they were
younger, and may therefore not have finished studying and not yet have established
themselves in the full-time labour market.
Table 9. Satisfaction regarding future job prospects by sex and parental status
%
Father Non-father Mother Non-mother
No answer 0.7 2.7 6.4 3.7
Very satisfied 5.7 4.8 3.8 5.9
Satisfied 49.5 42.7 37.2 41.9
Mixed feelings 13.3 21.0 14.8 19.5
Dissatisfied 28.8 25.3 32.6 26.0
Very dissatisfied 2.0 3.6 5.1 3.1
N 406 839 1072 681
Source: The 2010 Greater Jakarta Transition to Adulthood Survey
16
Emotional relationships with parents
Leaving the parental home
Overall, just over half the sample was still living with their parents, but among these nearly a
quarter had returned after leaving home at least once before. The ages at which individuals
had first left home were very similar for men and women, median ages being respectively 20
and 19 years.
After leaving home for the first time there was a wide range of destinations, including
moving into a place of one’s own with a spouse, in with other relatives, into a share house or
into a boarding house. Eight out of ten respondents who had their own children did not live in
the home of their own parents. It is possible that some were living with in-laws, but that was
not specifically asked about. Among the fathers and mothers who were not living with their
own parents, about 60 per cent were living in a house that they or their partner owned or
rented. Nowadays it is increasingly common for brides and grooms to be economically
independent, and in fact one of the major motivations for delaying marriage is to accumulate
the resources needed to live independently.
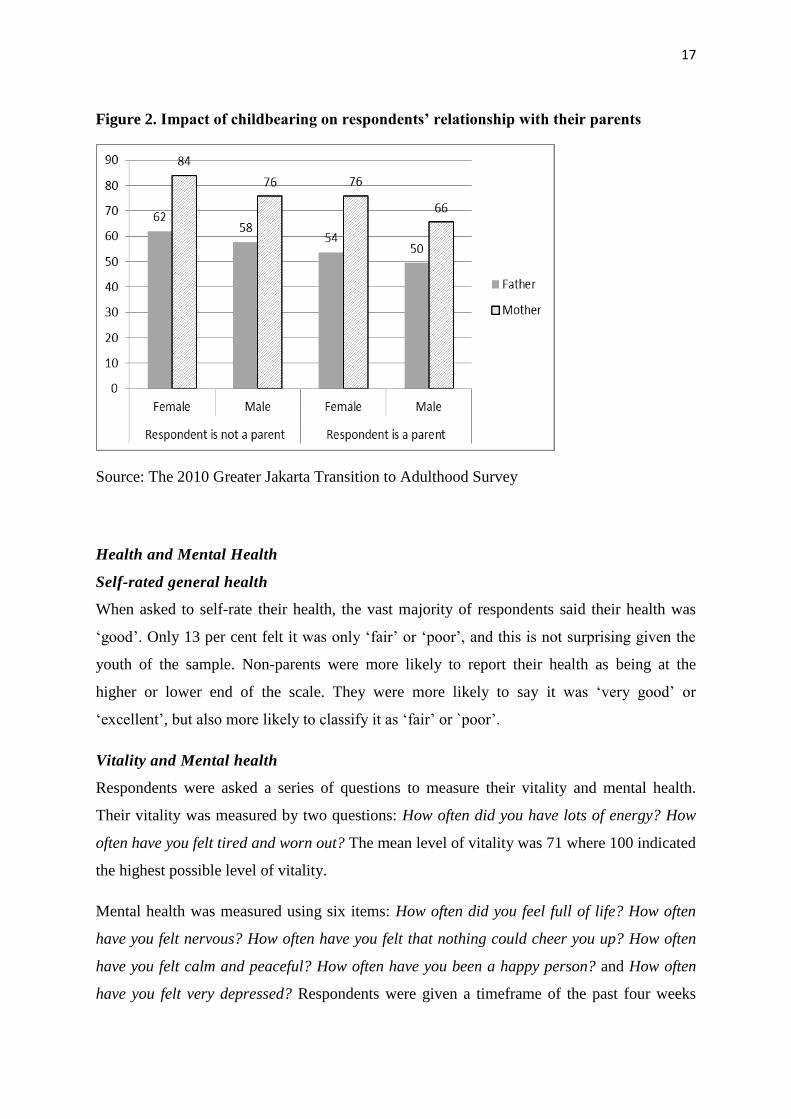
Emotional relationships with parents
Respondents were asked to describe their relationship with their father and mother on a scale
from 1-5, where 1 equalled ‘not very close’ and 5 equalled ‘very close’. Responses given by
individuals whose biological mother or father was still alive are shown in the diagram below.
Fifty to 60 percent of respondents described their relationship to their father as either close or
very close. The remainder described it as average, not close or not very close, or they could
not answer. Relationships with mothers were described as much closer by all respondents,
and in particular by women. Emotional relationships with parents after marriage and having
children show the strong attachment and functioning of the extended family. Figure 2
demonstrated that emotional relationships with parents are lower for respondents who have
become parents than non-parents for both sexes.
17
Figure 2. Impact of childbearing on respondents’ relationship with their parents
Source: The 2010 Greater Jakarta Transition to Adulthood Survey
Health and Mental Health
Self-rated general health
When asked to self-rate their health, the vast majority of respondents said their health was
‘good’. Only 13 per cent felt it was only ‘fair’ or ‘poor’, and this is not surprising given the
youth of the sample. Non-parents were more likely to report their health as being at the
higher or lower end of the scale. They were more likely to say it was ‘very good’ or
‘excellent’, but also more likely to classify it as ‘fair’ or `poor’.
Vitality and Mental health
Respondents were asked a series of questions to measure their vitality and mental health.
Their vitality was measured by two questions: How often did you have lots of energy? How
often have you felt tired and worn out? The mean level of vitality was 71 where 100 indicated
the highest possible level of vitality.
Mental health was measured using six items: How often did you feel full of life? How often
have you felt nervous? How often have you felt that nothing could cheer you up? How often
have you felt calm and peaceful? How often have you been a happy person? and How often
have you felt very depressed? Respondents were given a timeframe of the past four weeks
18
and response options ranged from 1 = All of the time, to 5 = None of the time. The
Cronbach’s alpha for the six items was 0.68 and the mean score on mental health was 80.
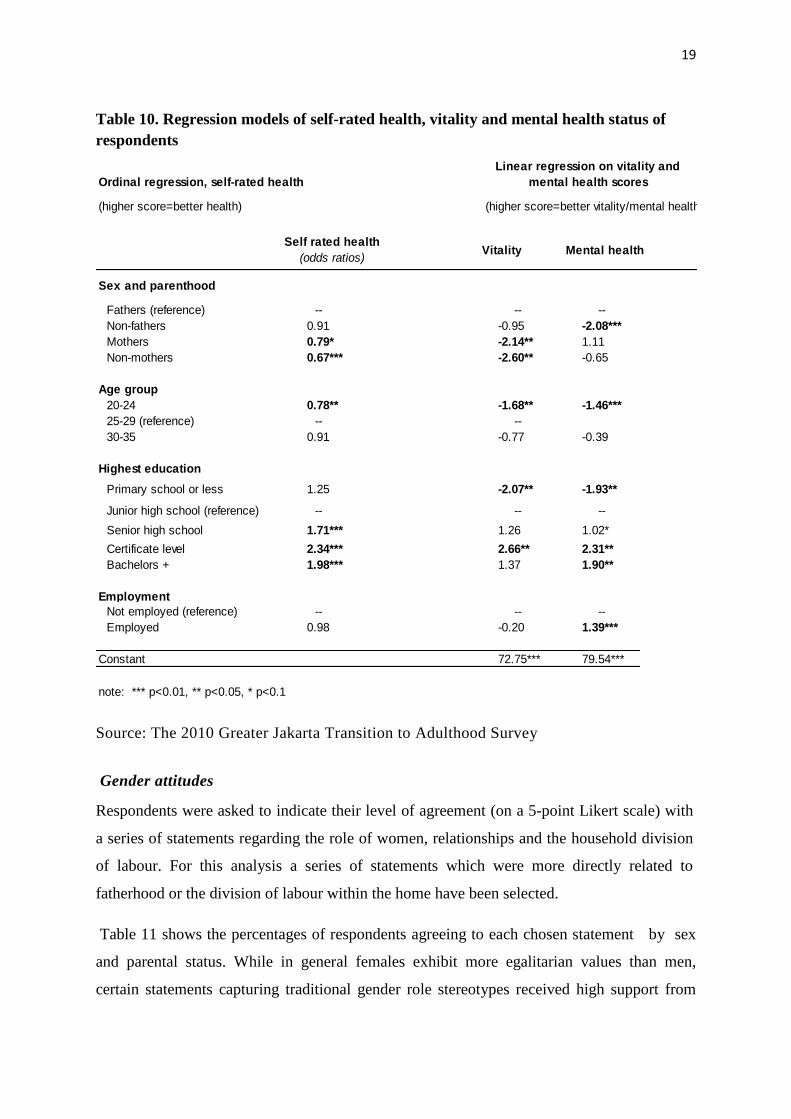
Table 10 shows three regression models, the first for self-rated health (ordinal regression) and
the second and third for the vitality scores and mental health scores (linear regression). For
self-rated health, non-mothers were less likely than fathers to rate their health highly, as were
those with primary school education. For vitality, compared to fathers, women had lower
scores and this was especially true of mothers. Compared to those aged 25-29, individuals in
their early 20s were significantly less likely to have higher vitality scores. For mental health
there was a greater range of variables which had some predictive power. Non-fathers had
poorer mental health than fathers, but mothers and non-mothers did not differ significantly
from fathers. Those aged 20-24 had poorer mental health than those aged 25-29. Australian
studies have demonstrated that fathers with full-time jobs and mothers with part-time jobs are
the most healthy and happy (Baxter et al., 2007).
19
Table 10. Regression models of self-rated health, vitality and mental health status of
respondents
Ordinal regression, self-rated health
(higher score=better health) (higher score=better vitality/mental health)
Self rated health
(odds ratios)Vitality Mental health
Sex and parenthood
Fathers (reference) -- -- --
Non-fathers 0.91 -0.95 -2.08***
Mothers 0.79* -2.14** 1.11
Non-mothers 0.67*** -2.60** -0.65
Age group
20-24 0.78** -1.68** -1.46***
25-29 (reference) -- --
30-35 0.91 -0.77 -0.39
Highest education
Primary school or less 1.25 -2.07** -1.93**
Junior high school (reference) -- -- --
Senior high school 1.71*** 1.26 1.02*
Certificate level 2.34*** 2.66** 2.31**
Bachelors + 1.98*** 1.37 1.90**
Employment
Not employed (reference) -- -- --
Employed 0.98 -0.20 1.39***
Constant 72.75*** 79.54***
note: *** p<0.01, ** p<0.05, * p<0.1
Linear regression on vitality and
mental health scores
Source: The 2010 Greater Jakarta Transition to Adulthood Survey
Gender attitudes
Respondents were asked to indicate their level of agreement (on a 5-point Likert scale) with
a series of statements regarding the role of women, relationships and the household division
of labour. For this analysis a series of statements which were more directly related to
fatherhood or the division of labour within the home have been selected.
Table 11 shows the percentages of respondents agreeing to each chosen statement by sex
and parental status. While in general females exhibit more egalitarian values than men,
certain statements capturing traditional gender role stereotypes received high support from
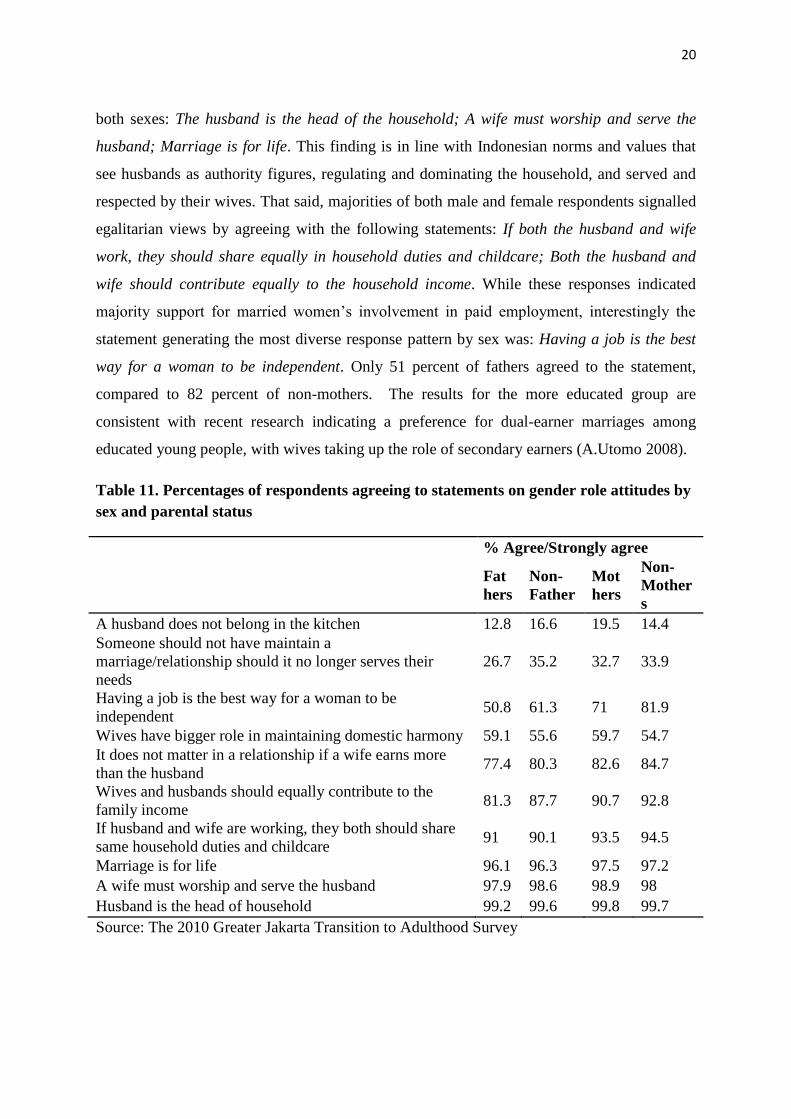
20
both sexes: The husband is the head of the household; A wife must worship and serve the
husband; Marriage is for life. This finding is in line with Indonesian norms and values that
see husbands as authority figures, regulating and dominating the household, and served and
respected by their wives. That said, majorities of both male and female respondents signalled
egalitarian views by agreeing with the following statements: If both the husband and wife
work, they should share equally in household duties and childcare; Both the husband and
wife should contribute equally to the household income. While these responses indicated
majority support for married women’s involvement in paid employment, interestingly the
statement generating the most diverse response pattern by sex was: Having a job is the best
way for a woman to be independent. Only 51 percent of fathers agreed to the statement,
compared to 82 percent of non-mothers. The results for the more educated group are
consistent with recent research indicating a preference for dual-earner marriages among
educated young people, with wives taking up the role of secondary earners (A.Utomo 2008).
Table 11. Percentages of respondents agreeing to statements on gender role attitudes by
sex and parental status
% Agree/Strongly agree
Fat
hers
Non-
Father
Mot
hers
Non-
Mother
s
A husband does not belong in the kitchen 12.8 16.6 19.5 14.4
Someone should not have maintain a
marriage/relationship should it no longer serves their
needs
26.7 35.2 32.7 33.9
Having a job is the best way for a woman to be
independent 50.8 61.3 71 81.9
Wives have bigger role in maintaining domestic harmony 59.1 55.6 59.7 54.7
It does not matter in a relationship if a wife earns more
than the husband 77.4 80.3 82.6 84.7
Wives and husbands should equally contribute to the
family income 81.3 87.7 90.7 92.8
If husband and wife are working, they both should share
same household duties and childcare 91 90.1 93.5 94.5
Marriage is for life 96.1 96.3 97.5 97.2
A wife must worship and serve the husband 97.9 98.6 98.9 98
Husband is the head of household 99.2 99.6 99.8 99.7
Source: The 2010 Greater Jakarta Transition to Adulthood Survey
21
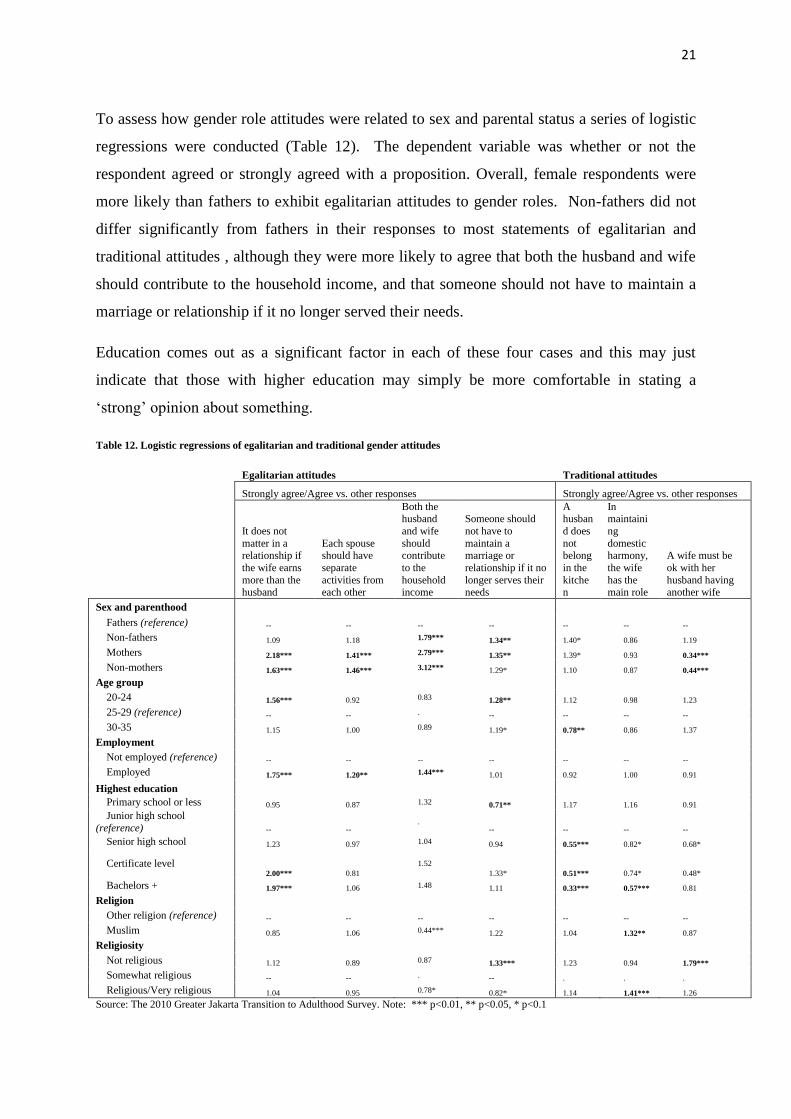
To assess how gender role attitudes were related to sex and parental status a series of logistic
regressions were conducted (Table 12). The dependent variable was whether or not the
respondent agreed or strongly agreed with a proposition. Overall, female respondents were
more likely than fathers to exhibit egalitarian attitudes to gender roles. Non-fathers did not
differ significantly from fathers in their responses to most statements of egalitarian and
traditional attitudes , although they were more likely to agree that both the husband and wife
should contribute to the household income, and that someone should not have to maintain a
marriage or relationship if it no longer served their needs.
Education comes out as a significant factor in each of these four cases and this may just
indicate that those with higher education may simply be more comfortable in stating a
‘strong’ opinion about something.
Table 12. Logistic regressions of egalitarian and traditional gender attitudes
Egalitarian attitudes Traditional attitudes
Strongly agree/Agree vs. other responses Strongly agree/Agree vs. other responses
It does not
matter in a relationship if
the wife earns
more than the
husband
Each spouse should have
separate
activities from
each other
Both the husband
and wife
should contribute
to the
household
income
Someone should
not have to
maintain a marriage or
relationship if it no
longer serves their
needs
A husban
d does
not belong
in the
kitche
n
In maintaini
ng
domestic harmony,
the wife
has the
main role
A wife must be
ok with her
husband having
another wife
Sex and parenthood
Fathers (reference) -- -- -- -- -- -- --
Non-fathers 1.09 1.18 1.79*** 1.34** 1.40* 0.86 1.19
Mothers 2.18*** 1.41*** 2.79*** 1.35** 1.39* 0.93 0.34***
Non-mothers 1.63*** 1.46*** 3.12*** 1.29* 1.10 0.87 0.44***
Age group
20-24 1.56*** 0.92 0.83 1.28** 1.12 0.98 1.23
25-29 (reference) -- -- . -- -- -- --
30-35 1.15 1.00 0.89 1.19* 0.78** 0.86 1.37
Employment
Not employed (reference) -- -- -- -- -- -- --
Employed 1.75*** 1.20** 1.44*** 1.01 0.92 1.00 0.91
Highest education
Primary school or less 0.95 0.87 1.32 0.71** 1.17 1.16 0.91
Junior high school
(reference) -- -- .
-- -- -- --
Senior high school 1.23 0.97 1.04 0.94 0.55*** 0.82* 0.68*
Certificate level 2.00*** 0.81
1.52
1.33* 0.51*** 0.74* 0.48*
Bachelors + 1.97*** 1.06 1.48 1.11 0.33*** 0.57*** 0.81
Religion
Other religion (reference) -- -- -- -- -- -- --
Muslim 0.85 1.06 0.44*** 1.22 1.04 1.32** 0.87
Religiosity
Not religious 1.12 0.89 0.87 1.33*** 1.23 0.94 1.79***
Somewhat religious -- -- . -- . . .
Religious/Very religious 1.04 0.95 0.78* 0.82* 1.14 1.41*** 1.26
Source: The 2010 Greater Jakarta Transition to Adulthood Survey. Note: *** p<0.01, ** p<0.05, * p<0.1

22
Attitudes towards children
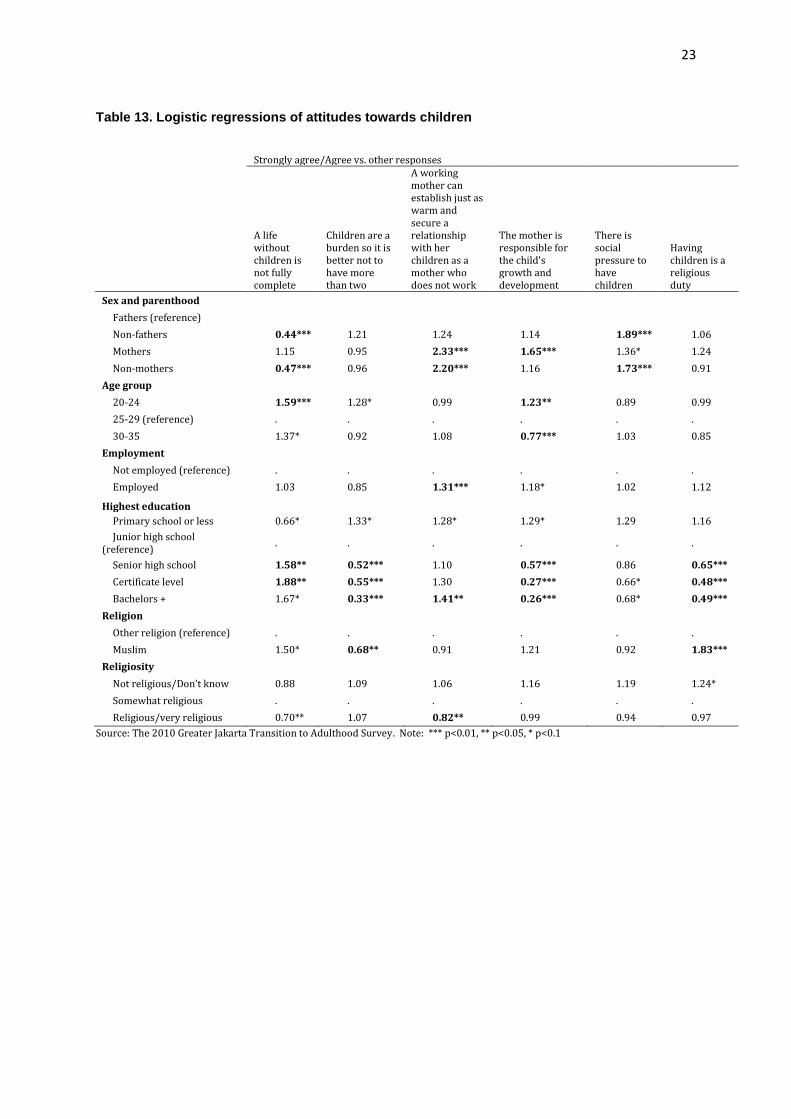
As with the gender attitudes, respondents were asked to state their levels of agreement to a
series of statements regarding children. A series of logistic regressions were conducted to
investigate the effects on attitudes of various demographic characteristics. Compared to
fathers, childless respondents were less likely to agree that A life without children is not fully
complete. Childless respondents and mothers were, however, significantly more likely to
agree that There is social pressure to have children. Women in general (mothers and non-
mothers) were more likely than men to agree that A working mother can establish just as
warm and secure a relationship with her children as a mother who does not work. Compared
to fathers, mothers were more likely to agree that The mother is responsible for the child’s
growth and development.
Respondents with more education appeared to place a higher ‘value’ on children than those
who had only completed up to junior high school. They were more likely to agree that A life
without children is not fully complete and less likely to agree that Children are a burden so it
is better not to have more than two. Those with more education were also less likely to agree
that The mother is responsible for the child’s growth and development and that Having
children is a religious duty.
Religion also played a role in shaping attitudes. Respondents who were Muslim were more
likely to agree that having children was a religious duty, and less likely to agree that having
children was a burden, so that it was better to not have more than two. The attitude that a
mother is responsible for a child’s growth and development declines consistently with age,
perhaps as the importance of a father’s contribution becomes more appreciated.
23
Table 13. Logistic regressions of attitudes towards children
Strongly agree/Agree vs. other responses
A life without children is not fully complete
Children are a burden so it is better not to have more than two
A working mother can establish just as warm and secure a relationship with her children as a mother who does not work
The mother is responsible for the child's growth and development
There is social pressure to have children
Having children is a religious duty
Sex and parenthood
Fathers (reference)
Non-fathers 0.44*** 1.21 1.24 1.14 1.89*** 1.06
Mothers 1.15 0.95 2.33*** 1.65*** 1.36* 1.24
Non-mothers 0.47*** 0.96 2.20*** 1.16 1.73*** 0.91
Age group
20-24 1.59*** 1.28* 0.99 1.23** 0.89 0.99
25-29 (reference) . . . . . .
30-35 1.37* 0.92 1.08 0.77*** 1.03 0.85
Employment
Not employed (reference) . . . . . .
Employed 1.03 0.85 1.31*** 1.18* 1.02 1.12
Highest education
Primary school or less 0.66* 1.33* 1.28* 1.29* 1.29 1.16
Junior high school (reference)
. . . . . .
Senior high school 1.58** 0.52*** 1.10 0.57*** 0.86 0.65***
Certificate level 1.88** 0.55*** 1.30 0.27*** 0.66* 0.48***
Bachelors + 1.67* 0.33*** 1.41** 0.26*** 0.68* 0.49***
Religion
Other religion (reference) . . . . . .
Muslim 1.50* 0.68** 0.91 1.21 0.92 1.83***
Religiosity
Not religious/Don’t know 0.88 1.09 1.06 1.16 1.19 1.24*
Somewhat religious . . . . . .
Religious/very religious 0.70** 1.07 0.82** 0.99 0.94 0.97
Source: The 2010 Greater Jakarta Transition to Adulthood Survey. Note: *** p<0.01, ** p<0.05, * p<0.1
24
Discussion
Young fathers exhibit a high rate of employment compared to young men who are not
fathers. In contrast there is a relatively low level of paid employment among mothers
compared with both married and unmarried women who are not mothers. There is little
opportunity for part-time work for either fathers or mothers in Jakarta, and many fathers work
very long hours (60+ per week). It is important to note that since we are using cross-sectional
data we are not making any claims about causality at this stage regarding the effect of
childbearing on men’s working patterns. While men with children work longer hours than
men without children, it is possible that this is due to a selection effect. That is employed men
who work long hours, and earn a higher level of income, may be more attractive partners and
therefore more likely to marry and have children than their peers who are less successful in
the labour market.
As these are relatively young parents, their children are also still quite young (the youngest
usually still under school age). Reasons for mothers not working largely reflect traditional
values and choices. The notion that it is the mother’s primary duty to look after children
shapes the options that most women perceive concerning employment versus domestic
activities. In a surprisingly high percentage of cases, young fathers do not want their wives to
work. This is a core indication of the generally strong traditional attitudes among fathers
compared to other young men.
Fathers have a high degree of satisfaction about their job prospects, and this might be a
reason why their wives are not working. Education of the mother changes this situation. The
higher her education the more likely she is to be working. The precise reasons for this pattern
are not clear. Educated mothers may receive intrinsic rewards from their work, but at the
same time they may have more bargaining power with their husbands to allow them to pursue
their own careers and spend time out of the household. They can also more easily afford
alternative childcare.
Regarding financial and emotional relationships with parents, fathers reported themselves to
be less close to their parents than non-fathers, mothers and non-mothers, and 50 percent of
fathers were not close or very close to their own fathers compared to about one-third not
being close to their mothers. Thus, there seems to be a degree of separation of male
generations, especially when the next generation has its own children.

25
Men are more likely than women to report themselves to be healthy and also report higher
vitality scores. There is no significant difference between fathers and non-fathers in these
matters, but young fathers have better mental health scores than young non-fathers. All three
health and wellbeing measures are influenced by education, with the more educated reporting
higher degrees of health/wellbeing.
The broad picture is of fathers working long hours to earn income to support their wives and
children. This defines the socially preferred male breadwinner role.
Fathers have good physical and mental health and mostly consider their job prospects to be
good, in line with the breadwinner model. The introduction of higher education for women
complicates this picture. Where the mother has a high level of education, she is much more
likely to work and also works relatively long hours, implying a reliance on alternative forms
of childcare.
The observed life situations tend to reflect traditional attitudes and behaviour among young
fathers. In contrast mothers in our young adult sample display differing values which are
often not consistent with their life situations. Young fathers are much less egalitarian in their
gender attitudes than young women in general, and are more conservative about traditional
values related to children.

26
References
Apparala, M.L., Reifman, A., Munsch, J. (2003), ‘Cross-National Comparison of Attitudes Toward
Fathers’ and Mothers’ Participation in Household Tasks and Childcare’, Sex Roles, 48(5/6): 189-203.
Arnett, J.J. (2000). Emerging Adulthood: A theory of development from the late teens through the
twenties. American Psychologist, 55(5): 469-480.
Baxter, J., Hewitt, B., & Haynes, M., (2008). ‘Life Course Transitions and Housework: Marriage,
Parenthood and Time on Housework’, Journal of Marriage and Family. 70(2):259-272.
Baxter, J., Gray, M., Alexander, M., Strazdins, L., & Bittman, M. (2007). Mothers and fathers with
young children: paid employment, caring and wellbeing (Social Policy Research Paper No 30).
Canberra: Australian Government Department of Families, Community Services and Indigenous
Affairs.
Burton, L.M., & Snyder, T.R. (1998). The invisible men revisited: Historical perspectives on men’s
roles in African American Families. In A. Booth & N. Crouter (Eds.), Men in families: When do they get
involved? What difference does it make? (pp.31-39). Mahwah, NJ: Erlbaum.
Craig, L., & Bittman, M. (2008), ‘The Incremental Time Costs of Children: An Analysis of children’s
impact on adult time use in Australia’, Feminist Economics, 14(2):59-88.
Eggebeen, D.J. & Knoester, C. (2001). Does fatherhood matter for men, Journal of Marriage and
Family, 63 (2): 381-393.
Elster, A. (Ed.). 1986. Adolescent fatherhood. Hillsdale, NJ: Erlbraum Associates.
Goldsheider, F., & Hogan, D.P. (19999, August). A century (plus of parenthood: Changes in living with
children: 1880-1990. Paper presented at the annual meeting of the American Sociological
Association, Chicago, IL.
Guant, R., (2006), ‘Biological Essentialism, Gender Ideologies, and Role Attitudes: What Determines
Parents Involvement in Child Care’, Sex Roles, 55:523-533.
LaRossa, R. (1997). The modernization of fatherhood: A social and political history. Chicago:
University of Chicago Press.
LaRossa, R., Gordon, B.A., Wilson, R.J., Bairan, A., & Jaret, C. (1991). The fluctuating image of the
20th century American father. Journal of Marriage and the Family, 53, 987-997.
La Taillade, Jaslean J.; Sandra Hofferth; Vanessa R. Wight. 2010. Consequences of Fatherhood for
Young Men's Relationships with Partners and Parents. Research in Human Development, 1542-
7617, 7(2), 103 – 122.
Marsiglio, W., Amato, P., Day, R.D., & Lamb, M.E. (2000). Scholarship on fatherhood in the 1990s
and beyond. Journal of Marriage and Family, 62(4), 1173-1191.
McDonald, P. 2000a. Gender Equity in Theories of Fertility Transition. Population and Development
Review, 26 (3): 427-439.
McDonald, P. 2000b. ‘Gender equity, social institutions and the future of fertility’, Journal of
Population Research, 17(1): 1-16.
27
Perry-Jenkins, M., and Turner, E., 2004. Jobs, Marriage, and Parenting: working it out in dual-earner
families, in Coleman, M., & Ganong, L. H., Handbook of Contemporary Families: Considering the
Past, Contemplating the Future, California: Sage.
Pleck, JH. 2007. Why could father involvement benefit children? Theoretical Perspectives. Applied
Developmental Science. 11(4), 196-202.
Pleck, JH., and Stueve, J.L. 2001. Time and paternal involvement. In K. Daly (Ed.), Minding the Time
in Family Experience: Emerging Perspectives and Issues, Oxford, UK: Elsevier Science. Pp.205-226.
Poerwandari, K. 2010. “Gerakan laki-laki baru” (New age males), KOMPAS article
under Sunday Psychology rubric, 21 March, Jakarta.
Poortman, A. R., & Van Der Lippe, T., (2009), ‘Attitudes Toward Housework and Child Care and the
Gendered Division of Labour’, Journal or Marriage and Family, 71: 526-541.
Smyth, B. and Weston, R. 2003. Researching fathers: Back to basic. Paper presented to National
Strategic Conference on Fatherhood. Parliament House Canberra, 18-19 August.
Strazdins, L., Shipley, M. & Broom, D. H. (2007). What does family-friendly really mean? Wellbeing,
time, and the quality of parents’ jobs. Special issue, Australian Bulletin of Labour, 33 (2): 202-225
Utomo, A. 2008. Women as secondary earners: Labour market and marriage expectations of
educated youth in urban Indonesia, PhD Thesis, Australian Demographic and Social Research
Insititute, Canberra: The Australian National University
Utomo I. D. (2005). Women’s Lives: Fifty Years of Change and Continuity. In ‘People, Population and
Policy in Indonesia’, Terence H. Hull (Ed), Jakarta and Singapore: Equinox Publishing (Asia) and
Institute of Southeast Asian Studies. p. 71-125. Equinox Publishing
Utomo, I., McDonald, P., Hull, T., Rosyidah, I., Hartimah, T., Idrus, N.I., Sadli, S. & Makruf, J.
2009. Gender depiction in Indonesian school text books: progress or deterioration. Paper presented
at the XXVI IUSSP Conference, Marrakesh, 27 September- 2 October.
Yulindrasari, H. and K. McGregor. 2011. Contemporary discourses of motherhood and fatherhood in
Ayahbunda, a middle-class Indonesian parenting magazine. Marriage & Family Review. 47(8):605–
624


