

2010 Butte County Agricultural Crop Report
In 1939 the first Butte County Agricultural Crop Report
was compiled.
W. L. Stile was the Agricultural Commissioner.
The estimated gross value of production in Butte County
was $9,451,293.

All about Butte County “Land of Natural Wealth and Beauty”
The Butte County seat is Oroville, California
As of 2009, the population of Butte County was approximately 220,577
Butte County is approximately 1,677 square miles
1,639 square miles are land, 38 square miles is water
The highest point is Humboldt Peak at 7,870 feet
The lowest point is 90 feet above sea level
Butte County has rich valley soils, rolling hills, volcanic peaks and mesas
Butte County has 60,000 acres of parkland and wildlife preserves
Butte County is a vital wintering site for waterfowl that migrate through
the Pacific Flyway; including geese, ducks and swans
Bidwell Park includes 3,600 acres of parkland
Feather Falls is the 6th largest waterfall in the U.S.
Average rainfall in Butte County is 26.04”
The 30-year average shows January’s high temperature to be 54 degrees and the low temperature to be 36 degrees
The 30-year average shows June’s high temperature to be 97 degrees and the low temperature to be 60 degrees
L A N D OF N A T U R A L W E A L T H A N D BEAUTY
OFFICES OF AGRICULTURAL COMMISSIONER WEIGHTS AND MEASURES
316 NELSON AVENUE OROVILLE, CALIFORNIA 95965-3318 AGRICULTURAL DEPT.: OFFICE: (530) 538-7381 FAX: (530) 538-7594
RICHARD B. PRICE MARY E. DANIELS Agricultural Commissioner Assistant Agricultural Commissioner Director of Weights and Measures Weights and Measures
June 29, 2011 Karen Ross, Secretary of California Department of Food and Agriculture
The Honorable Butte County Board of Supervisors
Steve Lambert, Chairperson Bill Connelly Larry Wahl Maureen Kirk Kim Yamaguchi Paul Hahn, Chief Administrative Officer, In accordance with provisions of section 2279 of the California Food and Agriculture Code, I am submitting the sixty-sixth annual crop report of agricultural production and agricultural value in Butte County for the 2010 calendar year. This report is a summary estimate of the acreage, production and gross value of Butte County agricultural products. The values presented in this report are gross values only, and do not reflect net farm income or costs of production and marketing. The estimated gross value of agricultural production in Butte County for 2010 totaled $622,414,000. This is a 42 million dollar increase over the 2009 gross value total of $579,928,000. The total increase in gross value of agriculture during 2010 is 29.0 percent above our county 10-year average of $443,046,000. I wish to extend my appreciation to the many producers, processors and agencies, both private and governmental, and to all the staff for their efforts in the compilation of this report. Respectfully submitted, Richard B. Price Richard B. Price, Agricultural Commissioner

Agricultural and Weights & Measures Staff and Associates
Agricultural Commissioner/Director of Weights & Measures Richard B. Price
Assistant Agricultural Commissioner/ Weights & Measures Mary E. Daniels
Deputy Director’s of Agriculture/ Weights & Measures Robert C. Hill, Tom Pisani, Navid A. Khan
Supervising Agricultural Biologists Mike Stewart, Helmut Bloo
Administrative Assistant, Senior Charmaigne Damron
Office Specialists Friede Violante, Janice Wallick
Senior Agricultural Biologist/Weights & Measures Inspectors Ron Hunt, Eric Pittman, Dave Sanford
Agricultural Biologist/Weights & Measures Inspectors Anastacia Allen, Michael Brown, Randy Hartman, Ramon Jauregui, Katharine Quist, Dan Shrout, Paul Weliver
Agricultural Technicians Apolinar Barrales, Julia Boyer, Kristina Fuller, Lee Hunt, Gary Imhoff, Molly Quisenberry
GIS Technician Sally Loker
USDA Wildlife Specialist Matt Albertson
Oroville Lake, Taken from Lumpkin Road

The 2010 Butte County Agricultural Crop Report is Dedicated to
Michael Brown
“Mike” Brown retired from the Butte County Agricultural Commissioner’s Office in 2010, after 5 years with Butte County.
Mike’s main focus was the Insect Detection Program, but he also performed work in other programs such as Pesticide Use Enforcement, Quarantine, Irrigated Lands Program and Weed Management.
Mike was the “heart” of the Oroville Office and we have missed not only his work ethic, but his love of a good potluck!
Enjoy your retirement Mike!!!

2010 MILLION DOLLAR CROPS
CROP VALUE 1 RICE $182,248,000 2 WALNUTS $173,392,000 3 ALMONDS $113,781,000 4 DRIED PLUM $42,566,000 5 NURSERY STOCK $23,837,000 6 CATTLE/CALVES $11,714,000 7 RICE SEED $10,865,000 8 FRUIT NUTS Misc. $10,494,000 9 PEACHES-CLINGSTONE $9,690,000 10 KIWIS $8,177,000 11 OLIVES ALL $7,270,000 12 APPIARY/POLLINATION $7,078,000 13 FIELD CROPS Misc. $6,634,000 14 TIMBER $4,747,000 15 ALMOND HULLS $3,404,000 16 DRYLAND PASTURE & RANGE $3,553,000 17 SEED, Misc $2,701,000 18 PASTURE , Irrigated $2,030,000 19 BEANS $1,970,000 20 PISTACHIOS $1,892,000 21 WHEAT $1,591,000
Rice was Butte County’s only Million Dollar Crop with a total value of $1,187,040.
Also in 1939…The insecticidal properties of DDT were first discovered.
In the Year
1939
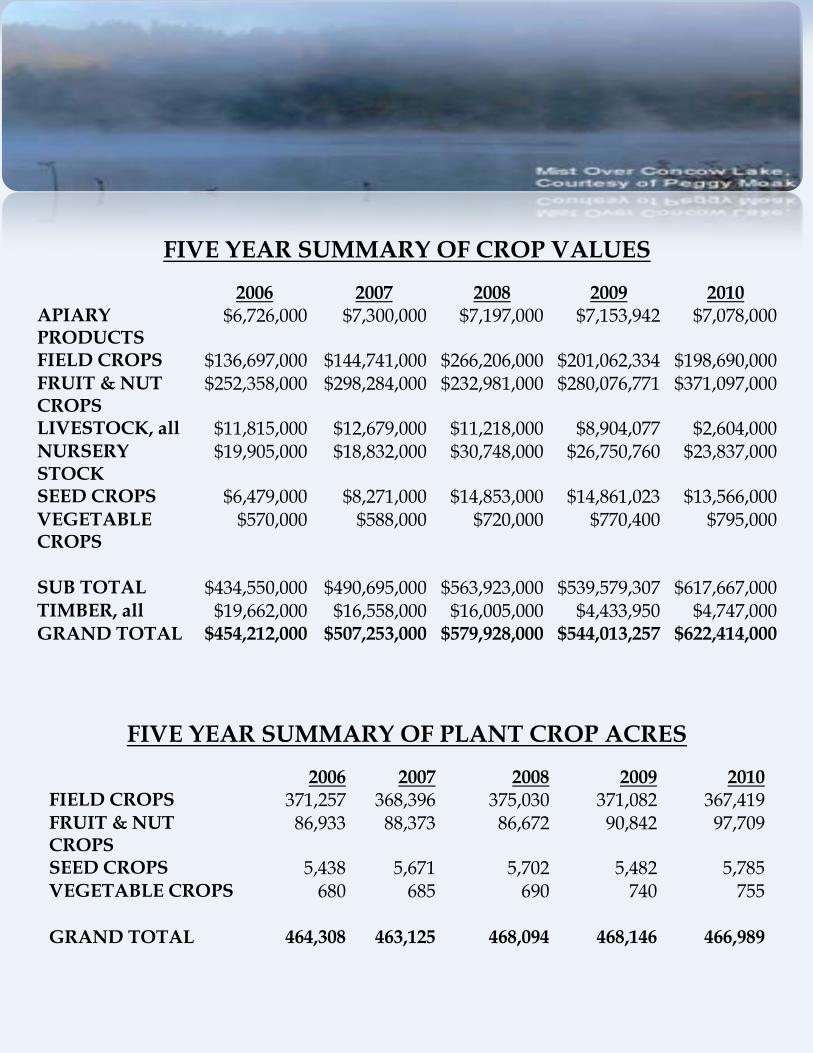
FIVE YEAR SUMMARY OF CROP VALUES
2006 2007 2008 2009 2010 APIARY PRODUCTS
$6,726,000 $7,300,000 $7,197,000 $7,153,942 $7,078,000
FIELD CROPS $136,697,000 $144,741,000 $266,206,000 $201,062,334 $198,690,000 FRUIT & NUT CROPS
$252,358,000 $298,284,000 $232,981,000 $280,076,771 $371,097,000
LIVESTOCK, all $11,815,000 $12,679,000 $11,218,000 $8,904,077 $2,604,000 NURSERY STOCK
$19,905,000 $18,832,000 $30,748,000 $26,750,760 $23,837,000
SEED CROPS $6,479,000 $8,271,000 $14,853,000 $14,861,023 $13,566,000 VEGETABLE CROPS
$570,000 $588,000 $720,000 $770,400 $795,000
SUB TOTAL $434,550,000 $490,695,000 $563,923,000 $539,579,307 $617,667,000 TIMBER, all $19,662,000 $16,558,000 $16,005,000 $4,433,950 $4,747,000 GRAND TOTAL $454,212,000 $507,253,000 $579,928,000 $544,013,257 $622,414,000
FIVE YEAR SUMMARY OF PLANT CROP ACRES
2006 2007 2008 2009 2010 FIELD CROPS 371,257 368,396 375,030 371,082 367,419 FRUIT & NUT CROPS
86,933 88,373 86,672 90,842 97,709
SEED CROPS 5,438 5,671 5,702 5,482 5,785 VEGETABLE CROPS 680 685 690 740 755
GRAND TOTAL 464,308 463,125 468,094 468,146 466,989

2010 FIELD CROP ACREAGE, PRODUCTION & VALUE
PRODUCTION VALUE HARVESTED PER TOTAL CROP YEAR ACREAGE ACRE TOTAL UNIT CROP VALUE Beans, Dry Edible 2010 950 1.44 1,368 Ton $1,440 $1,970,000 2009 1,672 1.75 2,926 Ton $1,000 $2,926,000 Hay, Alfalfa 2010 1080 6.35 6,858 Ton $118 $809,000 2009 1,508 6.40 9,651 Ton $103 $994,053 Pasture, Irrigated 2010 16,500 Acre $123 $2,030,000 2009 16,000 Acre $160 $2,560,000 Pasture, Other 2010 245,000 Acre $14.50 $3,553,000 2009 240,000 Acre $14.50 $3,480,000 Rice* 2010 93,800 4.65 436,000 Ton $418 $182,248,000 2009 103,416 4.7 486,055 Ton $379 $184,214,845 1939 24,730 30 741,900 Sacks $1.6 $1,187,040 Safflower 2010 375 1.18 443 Ton $315 $134,000 2009 120 1.15 138 Ton $319 $44,022 Wheat 2010 3964 2.23 8,834 Ton $180 $1,591,000 2009 3,704 2.16 8,000 Ton $183 $1,464,000 Misc** 2010 5,750 $6,634,000 2009 4,662 $5,379,414 Total 2010 367,419 $198,690,000 2009 371,082 $201,062,334 *Includes government payment. **Alfalfa silage, barley, beans (other), corn, corn silage, cotton, lavender, oats, pumpkin, Sorghum, sunflower, wild rice, sweet rice, organic field crops, crop byproducts, etc.
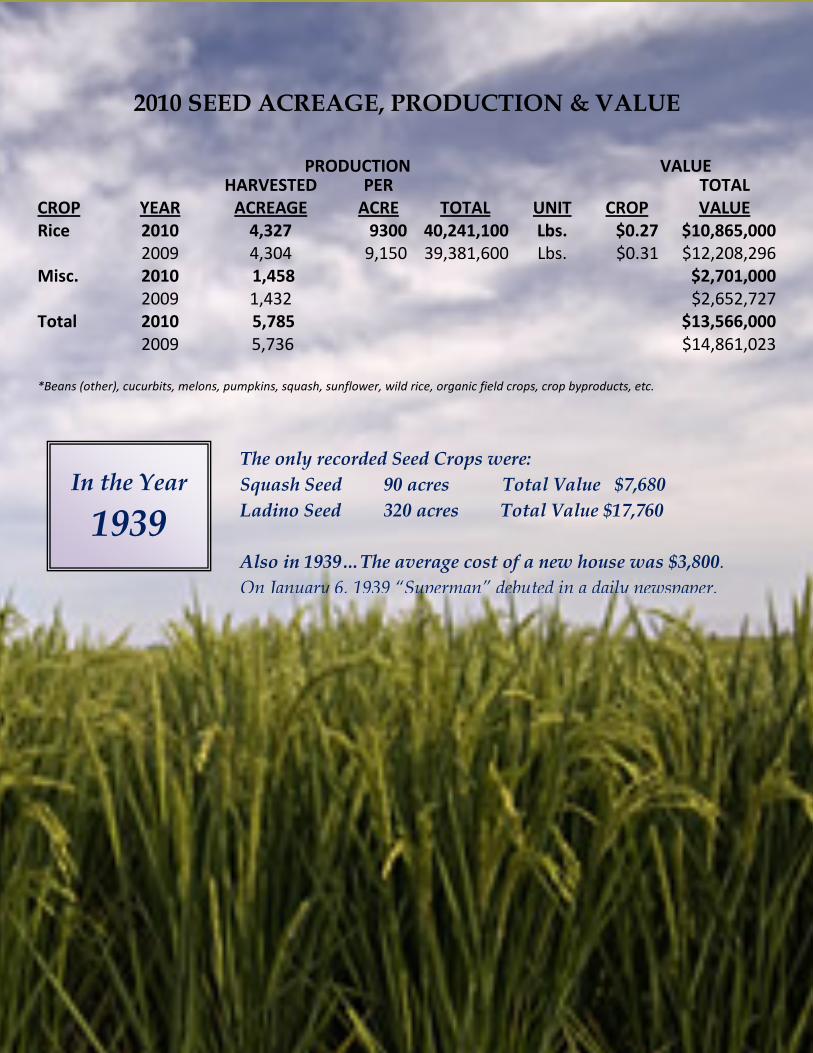
2010 SEED ACREAGE, PRODUCTION & VALUE
PRODUCTION VALUE HARVESTED PER TOTAL CROP YEAR ACREAGE ACRE TOTAL UNIT CROP VALUE Rice 2010 4,327 9300 40,241,100 Lbs. $0.27 $10,865,000 2009 4,304 9,150 39,381,600 Lbs. $0.31 $12,208,296 Misc. 2010 1,458 $2,701,000 2009 1,432 $2,652,727 Total 2010 5,785 $13,566,000 2009 5,736 $14,861,023 *Beans (other), cucurbits, melons, pumpkins, squash, sunflower, wild rice, organic field crops, crop byproducts, etc.
In the Year
1939
The only recorded Seed Crops were: Squash Seed 90 acres Total Value $7,680 Ladino Seed 320 acres Total Value $17,760 Also in 1939…The average cost of a new house was $3,800. On January 6, 1939 “Superman” debuted in a daily newspaper.

2010 FRUIT & NUT CROPS ACREAGE STATISTICS
Bearing
Non-Bearing
Total Orchard Crops Acreage* Acreage* Acreage* Almonds 39,262 989 40,251 The 1939 bearing Acreage for Almonds was 8,190 Acres Apples 58 0 58 Apricots 31 0 31 Avocados 2 0 2 Cherries 329 59 388 Chestnuts 38 0 38 Grapes (all) 208 2 210 Kiwis 710 0 710 Mandarins 60 1 61 Nectarines 10 0 10 Olives (Oil) 2,055 200 2,255 Olive (Table) 868 0 868 Oranges 94 1 95 Peaches, Clingstone 2,288 48 2,336 Peaches, Freestone 70 0 70 Pears (all) 5 0 5 Pecans 212 123 335 Persimmons 101 0 101 Pistachios 487 213 750 Plums 151 14 165 Dried Plums 10,790 548 11,338 Walnuts, English 33,330 4,340 37,670 Walnuts, Black 42 0 42 Total 91,171 6,538 97,709 *Data from California Crop and livestock Reporting Service and other sources

2010 FRUIT & NUT CROPS ACREAGE, PRODUCTION AND VALUE
PRODUCTION VALUE HARVESTED PER CROP YEAR ACREAGE ACRE TOTAL UNIT CROP TOTAL VALUE ALMONDS 2010 39,262 0.84 32,980 Ton $2,450 $113,781,000 2009 38,548 0.76 29,296 Ton $3,100 $90,817,600 1939 8,190 0.50 4,095 Ton $235 $962,325 HULLS 2010 39,576 Ton $86 $3,404,000 2009 43,944 Ton $80 $3,515,520 CITRUS 2010 94 4.58 430 Ton $1130 $486,000 2009 94 4.79 450 Ton $960 $432,000 KIWIS 2010 710 7.48 5,310 Ton $1540 $8,177,000 2009 513 7.44 3,817 Ton $1,434 $5,473,578 OLIVES (Oil) 2010 2055 4.3 8,836 Ton $555 $4,904,000 2009 2055 3.30 6,782 Ton $481 $3,262,142 OLIVES (Table) 2010 868 3.45 2,994 Ton $790 $2,366,000 2009 868 0.75 651 Ton $875 $569,625 PEACHES 2010 2,288 15.4 35,235 Ton $275 $9,690,000 2009 2,224 15.9 35,361 Ton $299 $10,590,620 PISTACHIOS 2010 487 .98 477 Ton $3,966 1,892,000 2009 475 .86 409 Ton $3,350 $1,370,150 PLUMS (Dried) 2010 10,790 .98 31,291 Ton $1360 $42,556,000 2009 10,718 2.81 30,118 Ton $1,226 $36,924,668 WALNUTS 2010 33,330 2.67 88,465 Ton $1,980 $173,392,000 2009 32,022 2.25 72,050 Ton $1,620 $116,721,000 **MISC. 2010 1,317 Ton $10,440,000 2009 3,325 Ton $10,399,868 TOTAL 2010 91,171 Ton $371,097,000 2009 90,842 Ton $280,076,771 ** Apples, apricots, avocados, blueberries, misc. berries, black walnuts, cherries, chestnuts, grapes, mandarins, peaches, (Freestone), crop by-products, pears, pecans, persimmons, plums, fresh prunes, organic tree crops, etc. Acres may vary from state report. Figures are based on harvested acres only.

2010 APIARY PRODUCTS, PRODUCTION & VALUE
CROP Production Value Crop Year Total Unit Per Unit Total
Pollination* 2010 43,915 Colony $145.00 $6,368,000 2009 43,084 Colony $150.50 $6,484,142 Other Apiary Products** 2010 $710,000 2009 $669,800 TOTAL 2010 $7,078,000 2009 $7,153,342 *Pollination includes all required to pollinate crops grown in Butte County.
** Includes beeswax, honey, nuclei, packaged bees and queens.
In the Year
1939 The total value for Apiary products in 1939 was 70,050
A gallon of gas was $0.10

2010 ORGANIC CROP STATISTICS
Registered Organic Producers*
86 Farms
19,257 Acres
$7,827,000 Total Value *Includes alfalfa, almonds, apples, berries, cherries, cut flowers, grapes, herbs, kiwi fruit, livestock, dairy, mandarins, nursery stock, olives, peaches, persimmons, prunes, rice, safflower, tomatoes, vegetables, vetch, walnuts and wild rice.
2010 VEGETABLE VALUE
Certified Producers*
$795,000 2010 Total Value
$770,400 2009 Total Value
$292,196 Total value for Truck Crops in 1939
*Includes asparagus, broccoli, corn, cucumbers, melons, onions, oriental vegetables, pumpkins, squash, tomatoes, etc…
2010 NURSERY ACREAGE & VALUE
238 - 2010 Total Acres
250 - 2009 Total Acres 25 Total Acres in 1939
$23,837,000 2010 Total Value
$26,750,760 2009 Total Value $25,000 Total Value in 1939
*Includes broad leaved evergreens, coniferous evergreens, deciduous fruit, nut and shade trees, shrubs, kiwi vines, herbaceous perennials indoor decorative

2010 LIVESTOCK & POULTRY
PRODUCTION VALUE NO. OF TOTAL VALUE TOTAL
ITEM YEAR HEAD LIVE WT. UNIT PER UNIT VALUE Cattle & Calves 2010 19,500 97,900 Cwt. $110.00 $10,770,000 2009 18,000 90,400 Cwt. $84.60 $7,647,841 Sheep, All 2010 1,400 1,925 Cwt. $65.00 $125,100 2009 1,400 1,925 Cwt. $60.00 $115,500 Hogs, All 2010 590 1,530 Cwt. $120.00 $183,600 2009 570 1,494 Cwt. $42.30 $63,192 Misc* 2010 $510,000 2009 $425,647 TOTAL 2010 $11,714,000 2009 $8,252,179 *Fish, Poultry, Pheasant, Quail, Rabbits, Worms, Organic, etc.
2010 LIVESTOCK PRODUCTS
VALUE PER ITEM YEAR PRODUCTION UNIT UNIT TOTAL
Milk, Market* 2010 52,284 Cwt. $16.10 $842,000 2009 50,445 Cwt. $12.09 $609,880 Milk,, 2010 3,324 Cwt. $14.84 $48,000 Manufacturing* 2009 3,579 Cwt. $11.74 $42,018 2010 55,608 Cwt. $890,000 TOTAL 2009 54,024 Cwt. $651,000 *California Agricultural Statistics Service

2010 HARVEST TIMBER PRODUCTION & VALUE
PRODUCTION
ITEM YEAR BOARD FEET* VALUE
Harvested Timber** 2010 31,739,000 $4,741,000 2009 70,688,000 $4,428,550 Other Timber Products 2010 $6,000 2009 $5,400 TOTAL 2010 $4,747,000 2009 $4,433,950 *Board feet is the quantity of timber cut and scaled.
**Timber production and value data are provided by State Board of Equalization, Timber Tax Division.
Total combined Livestock Production Value $1,276,790 Also in 1939… Scenes depicting the cotton fields of Tara and Scarlett O’Hara’s first horse ride in the movie Gone with The Wind were filmed in Bidwell Park, on Pentz Road and in a Paradise Apple Orchard.
In the Year
1939

2010 Butte County International Trading Partners
Butte County experienced a steady growth in Agricultural Exports in 2010. The agricultural export business continues to be a bright spot for Butte County’s economy.
Commodities Exported
Almonds Figs Rice, all Timber Almond Shells Kiwi Seeds, other Tomatoes Air Plants Plums, all Sunflower Seeds Walnuts
Destination Countries
Afghanistan Greece Mongolia Singapore Algeria Guatemala Morocco South Africa Austria Hong Kong Nepal Spain Belgium Hungary Netherlands Sri Lanka Brazil India New Zealand Sweden Cambodia Israel Oman Switzerland Chile Italy Pakistan Taiwan China Japan Philippines Ukraine Czech Republic Kenya Peoples Republic of
China United Arab Emirates
Denmark Kyrgyzstan Poland United Kingdom Ecuador Latvia Republic of Korea Uzbekistan France Malaysia Russian Federation Vietnam Germany Mexico Saudi Republic
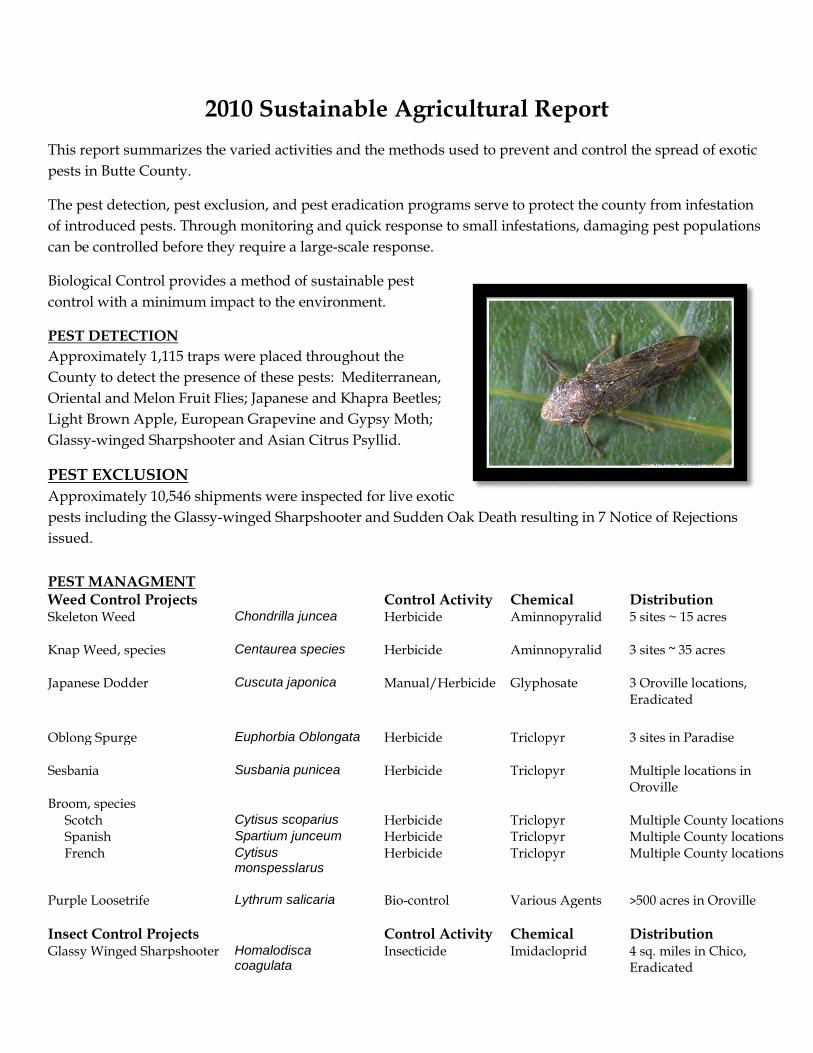
2010 Sustainable Agricultural Report This report summarizes the varied activities and the methods used to prevent and control the spread of exotic pests in Butte County.
The pest detection, pest exclusion, and pest eradication programs serve to protect the county from infestation of introduced pests. Through monitoring and quick response to small infestations, damaging pest populations can be controlled before they require a large-scale response.
Biological Control provides a method of sustainable pest control with a minimum impact to the environment.
PEST DETECTION Approximately 1,115 traps were placed throughout the County to detect the presence of these pests: Mediterranean, Oriental and Melon Fruit Flies; Japanese and Khapra Beetles; Light Brown Apple, European Grapevine and Gypsy Moth; Glassy-winged Sharpshooter and Asian Citrus Psyllid.
PEST EXCLUSION Approximately 10,546 shipments were inspected for live exotic pests including the Glassy-winged Sharpshooter and Sudden Oak Death resulting in 7 Notice of Rejections issued. PEST MANAGMENT Weed Control Projects Control Activity Chemical Distribution Skeleton Weed Chondrilla juncea Herbicide Aminnopyralid 5 sites ~ 15 acres Knap Weed, species Centaurea species Herbicide Aminnopyralid 3 sites ~ 35 acres Japanese Dodder Cuscuta japonica Manual/Herbicide Glyphosate 3 Oroville locations,
Eradicated Oblong Spurge Euphorbia Oblongata Herbicide Triclopyr 3 sites in Paradise Sesbania Susbania punicea Herbicide Triclopyr Multiple locations in
Oroville Broom, species Scotch Cytisus scoparius Herbicide Triclopyr Multiple County locations Spanish Spartium junceum Herbicide Triclopyr Multiple County locations French Cytisus
monspesslarus Herbicide Triclopyr Multiple County locations
Purple Loosetrife Lythrum salicaria Bio-control Various Agents ˃500 acres in Oroville Insect Control Projects Control Activity Chemical Distribution Glassy Winged Sharpshooter Homalodisca
coagulata Insecticide Imidacloprid 4 sq. miles in Chico,
Eradicated
Glassy-winged Sharpshooter

Butte County Weights and Measures The Butte County Agriculture Department, Division of Weights and Measures plays a vital role in the economic activity of the county. The program serves the community by safeguarding weighing and measuring accuracy and assuring confidence and integrity of purchased items. The benefit our office provides ensures fair competition for industry and accurate value comparison for consumers.
As a neutral third party between buyers and sellers we:
• Test weighing and measuring devices for correctness • Examine and evaluate the work of service repairman • Verify the quantity of bulk and packaged commodities • Check consumer packages for proper labeling • Inspect price scanner systems for accuracy • Review weighmaster certificates, licensing requirements, proper bin and truck tares • Regulate the advertising, labeling and quality standards for petroleum products
Mission
Our mission is to work with consumers and industry to insure that product transactions are fair, equitable and honest. As a regulatory agency established to uphold state weights and measures laws and regulations, our approach is to develop a positive working relationship with those we regulate and serve. This means achieving compliance in the most time efficient and cost effective means possible for all stakeholders. Understanding the important role business and industry play in Butte County, our desire is to foster an atmosphere that keeps them competitive and profitable, while simultaneously, making sure they comply with state mandated weights and measures statutes. This practice requires a more “customer oriented” attitude, but it’s the key to achieving equity in the marketplace in Butte County.
Providing a Service to Consumers and Industry
In 2010 we received and responded to over forty-five consumer weights and measures related complaints. In previous years, we would get more responses from consumers wanting to file complaints than we did from businesses requesting testing services. However, in 2010, the opposite occurred and we received almost twice as many requests from businesses asking for inspection services.

Weights & Measures Inspections Performed in 2010
SCALES METERS QUANTITIY CONTROL
230 - Point of Sale 1,969 – Gas Pumps 2,000 – Package Audits
218 - Computing Scales 130 – Electric Utility Submeters 150 – Price Verifications
101 – Truck Scales 98 – Gas Utility Submeters 45 – Packages Off Sale
52 – Ag. Platform Scales 91 – Water Utility Submeters 12 – Package Insp. Reports
50 – Farmer’s Market Scales 31- Stationary Propane Meters 10 – Bulk Commodity Insp.
47 – Recycling Platform 24 – Wholesale Gas & Diesel 9 – Labeling Inspections
33 – Counter Scales 23 – Water Vending Machines PETROLEUM
31 – Shipping Scales 23 – Carpet, Fabric, Rope, Wire 78 – Inspections
19 - Building/Landscape/Medical 15 – Petroleum Trucks 15 – Gas & Diesel Samples
9 - Animal/Livestock Scales 14 – Liquid Propane Trucks WEIGHMASTER
8 – Jewelry & Prescription Scales 2 – Compressed Natural Gas 40 – Truck Tares
3 – Batch Hopper Scales 2 – Ice Vending Machines 20 – Certificate Audits
2 – Dormant & Monorail Scales 2 – Timing Devices, Car Wash 3 – Follow-ups

De
part
men
t of A
gric
ultu
re
316
Nel
son
Aven
ue
Oro
ville
, Cal
iforn
ia 9
5965


