
Wisconsin Department of Natural Resources2011 Household Recycling Survey
Summary
Wisconsin Department ofNatural Resources
2011 Household RecyclingSurvey Summary

WI Department of Natural Resources Bureau of Waste and Materials Management
1 2011 Household Recycling Survey SummaryPublication WA-1611
Executive Summary
Results from a Wisconsin Department of Natural Resources (DNR) survey in 2011 of 667 households across the state affirm continued strong support for recycling in Wisconsin. Since 1990, the DNR has sponsored 10 telephone or mail surveys to track the progress of residential recycling and composting in Wisconsin. Responses from the most recent survey once again confirm that Wisconsin residents strongly support Wisconsin’s recycling laws and that they recycle at home and away from home when these recycling options are provided. Support for recycling is consistent across dwelling type, geographic location, age and income group.
Support and commitment to recycling has remained robust over the years: more than 95 percent of households surveyed express commitment to recycling at home, and 85 percent support state laws governing recycling. Residents say they recycle because it preserves landfill space, reuses materials, reduces pollution and generally helps the environment. More than 90 percent say they are aware that recycling helps the economy by creating jobs and providing new or expanded business opportunities.
The number of different materials recycled by households has not changed significantly since 2006. Paper products continue to figure prominently within the mix, and mixed residential paper is now commonly included in most collection systems. Three quarters of the respondents report having access to curbside collection and, of these, half are served by single stream collection programs in which all recyclables go into a single bin for collection. About a quarter of the households report recycling other materials such as used oil, yard waste, plastic bags, unneeded pharmaceuticals, and household hazardous wastes. And almost 50 percent look for products that are recyclable, have less packaging or have recycled content when making purchase decisions.
Community recycling programs are the main source of information for residents, followed by haulers and news articles. However, fewer respondents rate the information from their community program as highly as they did in previous surveys.
In 2006, about 50 percent of the respondents reported only slight or no concern about the effects of open burning. By 2011, the level of concern increased significantly, with only 27 percent expressing little or no concern for open burning.
The DNR uses results from the recycling surveys to monitor trends in support, awareness and participation in recycling and to provide guidance on where to direct resources to improve and enhance recycling among Wisconsin households. Continued strong support for the state recycling laws and programs underscore the importance of maintaining state investment in local government recycling programs and the laws around which these programs are built.
Introduction to the 2011 Household Recycling Survey
The Department of Natural Resources (DNR) has conducted statewide household surveys periodically since 1990 to track the progress of residential recycling in Wisconsin. The 2011
survey surveyed 627 households across the state. This report summarizes findings related to general recycling awareness and behavior and, when possible, compares 2011 findings to previous surveys. The survey included a number of questions relating to the new state electronics disposal ban and the state E-Cycle program. Findings related to the electronics program are summarized in a separate report (Wisconsin residents and electronics recycling WA-1604). Survey questions and additional documentation of survey results are available on the DNR website: dnr.wi.gov Keyword: recycling studies.
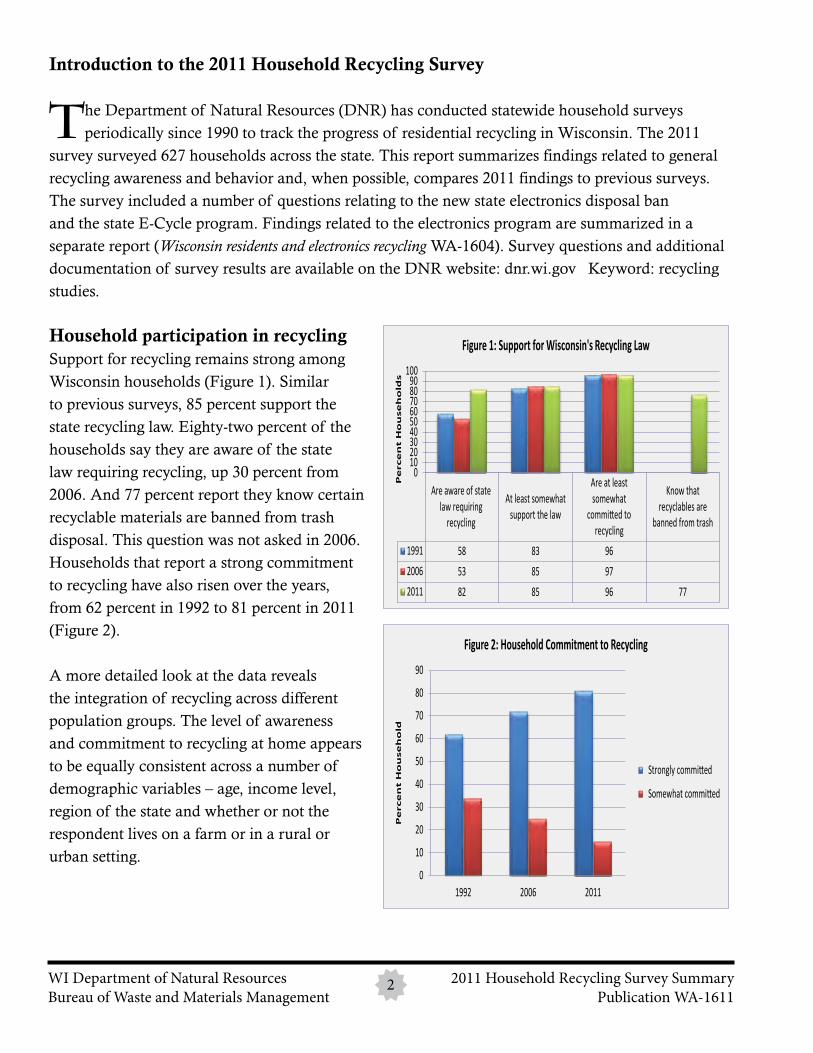
Household participation in recycling Support for recycling remains strong among Wisconsin households (Figure 1). Similar to previous surveys, 85 percent support the state recycling law. Eighty-two percent of the households say they are aware of the state law requiring recycling, up 30 percent from 2006. And 77 percent report they know certain recyclable materials are banned from trash disposal. This question was not asked in 2006. Households that report a strong commitment to recycling have also risen over the years, from 62 percent in 1992 to 81 percent in 2011 (Figure 2).
A more detailed look at the data reveals the integration of recycling across different population groups. The level of awareness and commitment to recycling at home appears to be equally consistent across a number of demographic variables – age, income level, region of the state and whether or not the respondent lives on a farm or in a rural or urban setting.
Are aware of statelaw requiring
recycling
At least somewhatsupport the law
Are at leastsomewhat
committed torecycling
Know thatrecyclables are
banned from trash
1991 58 83 962006 53 85 972011 82 85 96 77
0102030405060708090
100
Pe
rce
nt
Ho
use
ho
lds
Figure 1: Support for Wisconsin's Recycling Law
0
10
20
30
40
50
60
70
80
90
1992 2006 2011
Pe
rce
nt
Ho
use
ho
ld
Figure 2: Household Commitment to Recycling
Strongly committed
Somewhat committed
WI Department of Natural Resources Bureau of Waste and Materials Management
2 2011 Household Recycling Survey SummaryPublication WA-1611
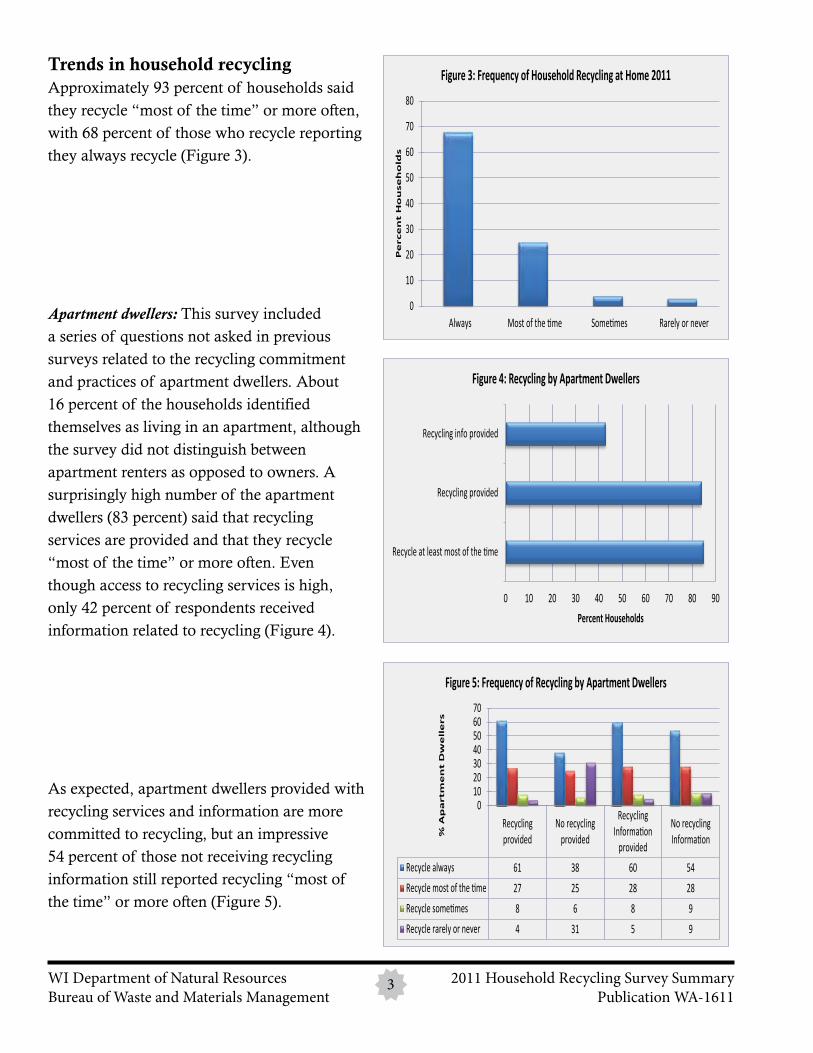
Trends in household recycling Approximately 93 percent of households said they recycle “most of the time” or more often, with 68 percent of those who recycle reporting they always recycle (Figure 3).
Apartment dwellers: This survey included a series of questions not asked in previous surveys related to the recycling commitment and practices of apartment dwellers. About 16 percent of the households identified themselves as living in an apartment, although the survey did not distinguish between apartment renters as opposed to owners. A surprisingly high number of the apartment dwellers (83 percent) said that recycling services are provided and that they recycle “most of the time” or more often. Even though access to recycling services is high, only 42 percent of respondents received information related to recycling (Figure 4).
As expected, apartment dwellers provided with recycling services and information are more committed to recycling, but an impressive 54 percent of those not receiving recycling information still reported recycling “most of the time” or more often (Figure 5).
0 10 20 30 40 50 60 70 80 90
Recycle at least most of the time
Recycling provided
Recycling info provided
Percent Households
Figure 4: Recycling by Apartment Dwellers
WI Department of Natural Resources Bureau of Waste and Materials Management
3 2011 Household Recycling Survey SummaryPublication WA-1611
0
10
20
30
40
50
60
70
80
Always Most of the time Sometimes Rarely or never
Pe
rce
nt
Ho
use
ho
lds
Figure 3: Frequency of Household Recycling at Home 2011
Recyclingprovided
No recyclingprovided
RecyclingInformation
provided
No recyclingInformation
Recycle always 61 38 60 54Recycle most of the time 27 25 28 28Recycle sometimes 8 6 8 9Recycle rarely or never 4 31 5 9
010203040506070
% A
pa
rtm
en
t D
we
lle
rs
Figure 5: Frequency of Recycling by Apartment Dwellers
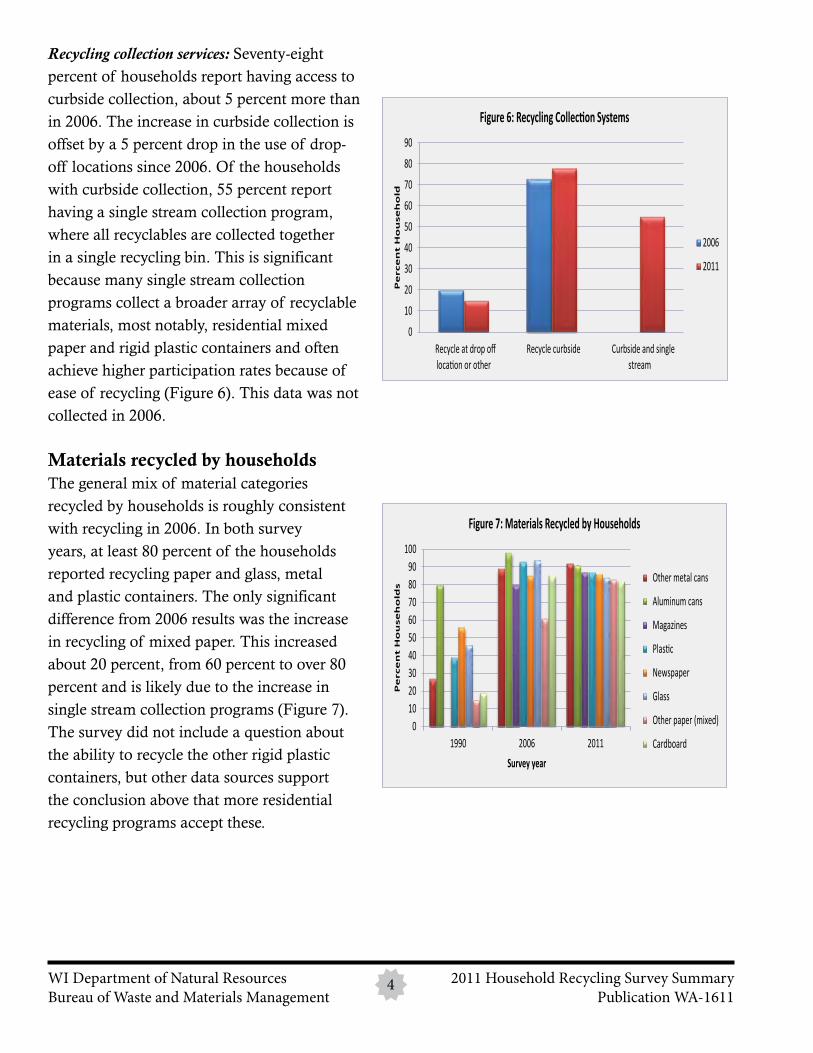
Recycling collection services: Seventy-eight percent of households report having access to curbside collection, about 5 percent more than in 2006. The increase in curbside collection is offset by a 5 percent drop in the use of drop-off locations since 2006. Of the households with curbside collection, 55 percent report having a single stream collection program, where all recyclables are collected together in a single recycling bin. This is significant because many single stream collection programs collect a broader array of recyclable materials, most notably, residential mixed paper and rigid plastic containers and often achieve higher participation rates because of ease of recycling (Figure 6). This data was not collected in 2006.
Materials recycled by households The general mix of material categories recycled by households is roughly consistent with recycling in 2006. In both survey years, at least 80 percent of the households reported recycling paper and glass, metal and plastic containers. The only significant difference from 2006 results was the increase in recycling of mixed paper. This increased about 20 percent, from 60 percent to over 80 percent and is likely due to the increase in single stream collection programs (Figure 7). The survey did not include a question about the ability to recycle the other rigid plastic containers, but other data sources support the conclusion above that more residential recycling programs accept these.
WI Department of Natural Resources Bureau of Waste and Materials Management
4 2011 Household Recycling Survey SummaryPublication WA-1611
0
10
20
30
40
50
60
70
80
90
Recycle at drop offlocation or other
Recycle curbside Curbside and singlestream
Pe
rce
nt
Ho
use
ho
ld
Figure 6: Recycling Collection Systems
2006
2011
0102030405060708090
100
1990 2006 2011
Pe
rce
nt
Ho
use
ho
lds
Survey year
Figure 7: Materials Recycled by Households
Other metal cans
Aluminum cans
Magazines
Plastic
Newspaper
Glass
Other paper (mixed)
Cardboard
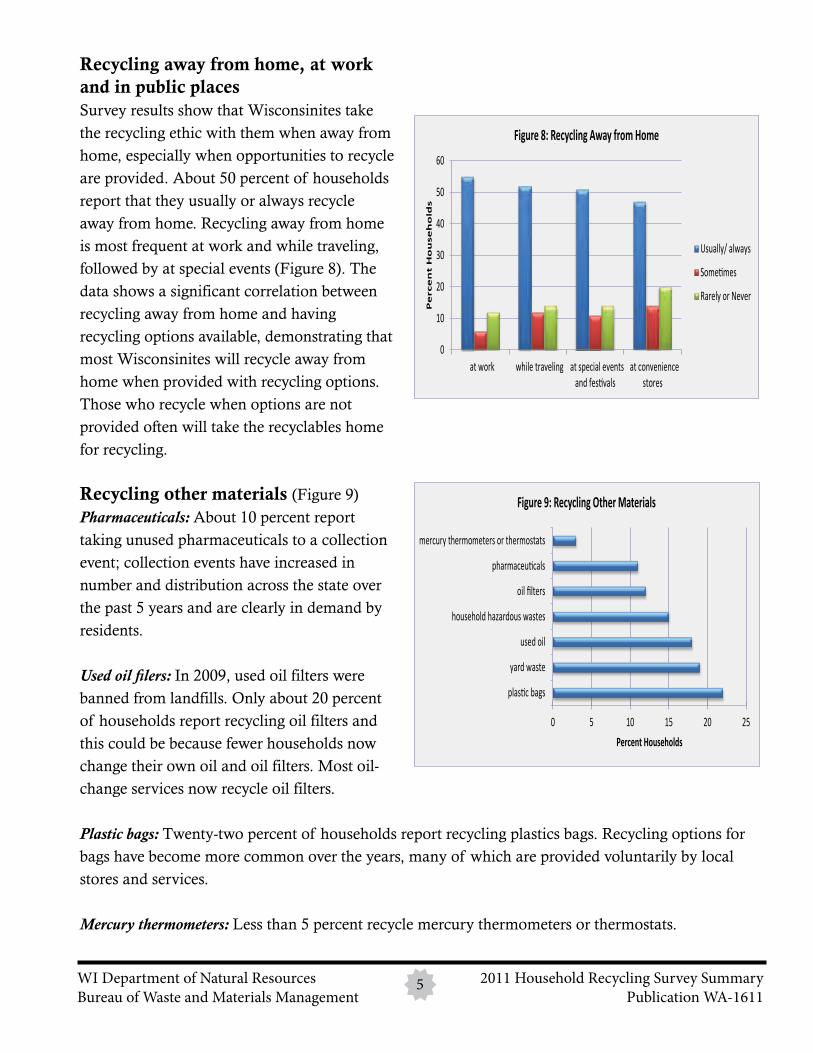
Recycling away from home, at work and in public places Survey results show that Wisconsinites take the recycling ethic with them when away from home, especially when opportunities to recycle are provided. About 50 percent of households report that they usually or always recycle away from home. Recycling away from home is most frequent at work and while traveling, followed by at special events (Figure 8). The data shows a significant correlation between recycling away from home and having recycling options available, demonstrating that most Wisconsinites will recycle away from home when provided with recycling options. Those who recycle when options are not provided often will take the recyclables home for recycling.
Recycling other materials (Figure 9)Pharmaceuticals: About 10 percent report taking unused pharmaceuticals to a collection event; collection events have increased in number and distribution across the state over the past 5 years and are clearly in demand by residents.
Used oil filers: In 2009, used oil filters were banned from landfills. Only about 20 percent of households report recycling oil filters and this could be because fewer households now change their own oil and oil filters. Most oil-change services now recycle oil filters.
Plastic bags: Twenty-two percent of households report recycling plastics bags. Recycling options for bags have become more common over the years, many of which are provided voluntarily by local stores and services.
Mercury thermometers: Less than 5 percent recycle mercury thermometers or thermostats.
WI Department of Natural Resources Bureau of Waste and Materials Management
5 2011 Household Recycling Survey SummaryPublication WA-1611
0
10
20
30
40
50
60
at work while traveling at special eventsand festivals
at conveniencestores
Pe
rce
nt
Ho
use
ho
lds
Figure 8: Recycling Away from Home
Usually/ always
Sometimes
Rarely or Never
0 5 10 15 20 25
plastic bags
yard waste
used oil
household hazardous wastes
oil filters
pharmaceuticals
mercury thermometers or thermostats
Percent Households
Figure 9: Recycling Other Materials
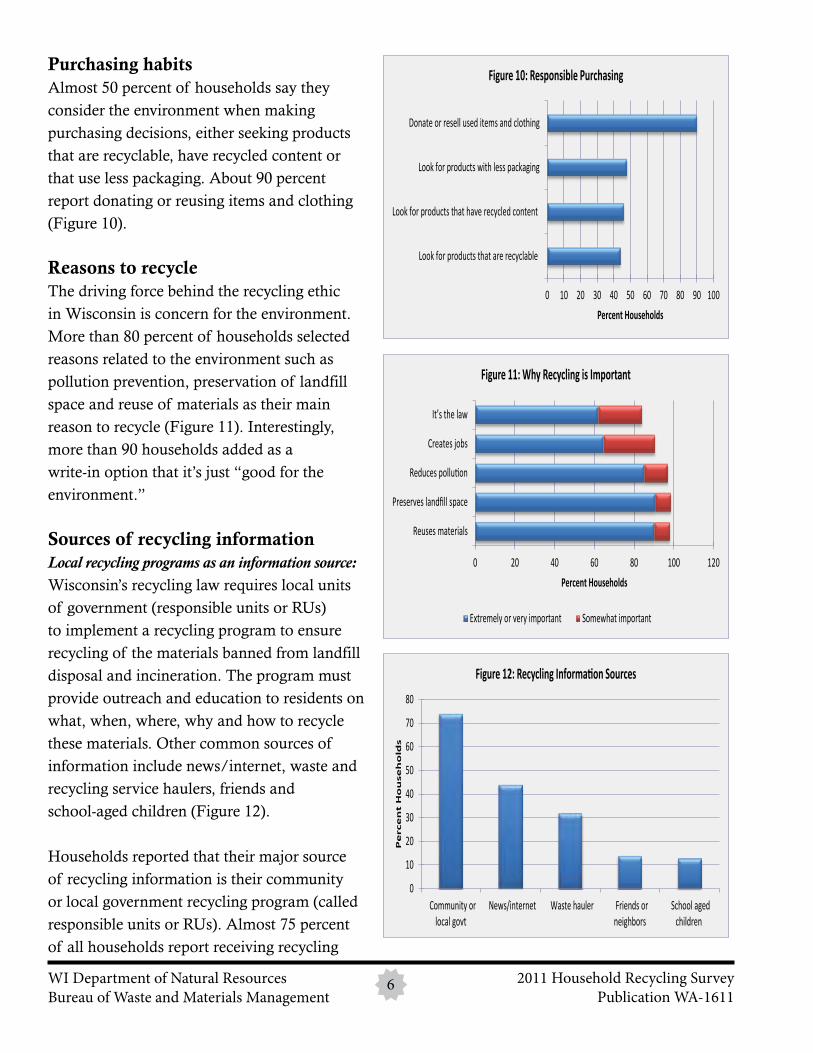
Purchasing habitsAlmost 50 percent of households say they consider the environment when making purchasing decisions, either seeking products that are recyclable, have recycled content or that use less packaging. About 90 percent report donating or reusing items and clothing (Figure 10).
Reasons to recycle The driving force behind the recycling ethic in Wisconsin is concern for the environment. More than 80 percent of households selected reasons related to the environment such as pollution prevention, preservation of landfill space and reuse of materials as their main reason to recycle (Figure 11). Interestingly, more than 90 households added as a write-in option that it’s just “good for the environment.”
Sources of recycling information Local recycling programs as an information source: Wisconsin’s recycling law requires local units of government (responsible units or RUs) to implement a recycling program to ensure recycling of the materials banned from landfill disposal and incineration. The program must provide outreach and education to residents on what, when, where, why and how to recycle these materials. Other common sources of information include news/internet, waste andrecycling service haulers, friends and school-aged children (Figure 12). Households reported that their major source of recycling information is their community or local government recycling program (called responsible units or RUs). Almost 75 percent of all households report receiving recycling
WI Department of Natural Resources Bureau of Waste and Materials Management
6 2011 Household Recycling SurveyPublication WA-1611
0 20 40 60 80 100 120
Reuses materials
Preserves landfill space
Reduces pollution
Creates jobs
It’s the law
Percent Households
Figure 11: Why Recycling is Important
Extremely or very important Somewhat important
0
10
20
30
40
50
60
70
80
Community orlocal govt
News/internet Waste hauler Friends orneighbors
School agedchildren
Pe
rce
nt
Ho
use
ho
lds
Figure 12: Recycling Information Sources
0 10 20 30 40 50 60 70 80 90 100
Look for products that are recyclable
Look for products that have recycled content
Look for products with less packaging
Donate or resell used items and clothing
Percent Households
Figure 10: Responsible Purchasing
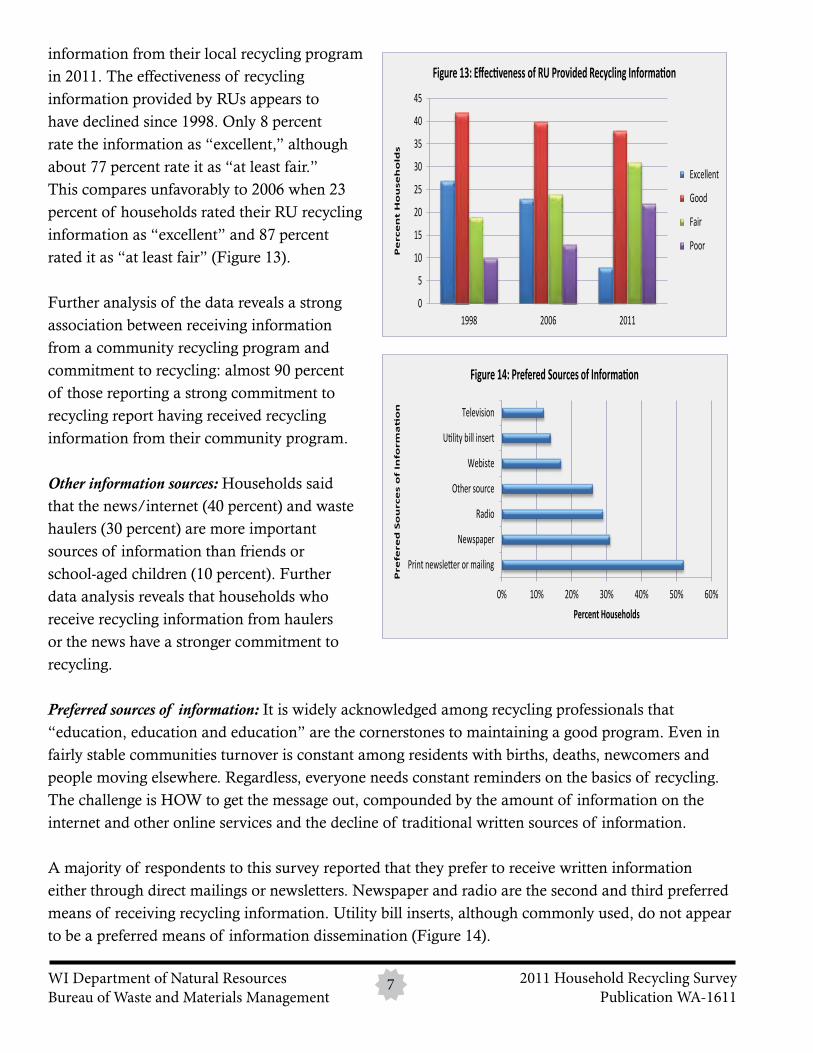
information from their local recycling program in 2011. The effectiveness of recycling information provided by RUs appears to have declined since 1998. Only 8 percent rate the information as “excellent,” although about 77 percent rate it as “at least fair.” This compares unfavorably to 2006 when 23 percent of households rated their RU recycling information as “excellent” and 87 percent rated it as “at least fair” (Figure 13).
Further analysis of the data reveals a strong association between receiving information from a community recycling program and commitment to recycling: almost 90 percent of those reporting a strong commitment to recycling report having received recycling information from their community program. Other information sources: Households said that the news/internet (40 percent) and waste haulers (30 percent) are more important sources of information than friends or school-aged children (10 percent). Further data analysis reveals that households who receive recycling information from haulers or the news have a stronger commitment to recycling.
Preferred sources of information: It is widely acknowledged among recycling professionals that “education, education and education” are the cornerstones to maintaining a good program. Even in fairly stable communities turnover is constant among residents with births, deaths, newcomers and people moving elsewhere. Regardless, everyone needs constant reminders on the basics of recycling. The challenge is HOW to get the message out, compounded by the amount of information on the internet and other online services and the decline of traditional written sources of information.
A majority of respondents to this survey reported that they prefer to receive written information either through direct mailings or newsletters. Newspaper and radio are the second and third preferred means of receiving recycling information. Utility bill inserts, although commonly used, do not appear to be a preferred means of information dissemination (Figure 14).
WI Department of Natural Resources Bureau of Waste and Materials Management
7 2011 Household Recycling SurveyPublication WA-1611
0
5
10
15
20
25
30
35
40
45
1998 2006 2011
Pe
rce
nt
Ho
use
ho
lds
Figure 13: Effectiveness of RU Provided Recycling Information
Excellent
Good
Fair
Poor
0% 10% 20% 30% 40% 50% 60%
Print newsletter or mailing
Newspaper
Radio
Other source
Webiste
Utility bill insert
Television
Percent Households
Pre
fere
d S
ou
rce
s o
f In
form
ati
on
Figure 14: Prefered Sources of Information
Many programs publish a local newsletter providing information about the recycling program and may include additional information about regional recycling services along with the whys and hows of recycling. The DNR manages a bi-weekly subscription email service called “Recycling Updates,” a popular source of news about current recycling related events, webinars and grant programs. The DNR also publishes a newsletter several times a year.
Open burning of brush, trash and recyclables Open burning is defined as burning any material outdoors without adequate air pollution controls in place. Burning solid waste materials, such as treated wood, banned recyclable materials (unless contaminated), other plastics, household garbage and most other trash is prohibited statewide; local ordinances may be more stringent than statewide requirements. Burning of leaves, brush and clean wood is legal, under some circumstances and with a burn permit.
Because open burning in most instances is not legal, we suspect respondents were cautious in their responses to questions related to open burning. In particular, we believe the responses under-represent the actual level of open burning that occurs in the state. A quarter of survey households reported burning leaves, grass or brush – roughly the same percentage as in 2006. Only 7 percent reported burning trash in 2011, compared to 55 percent in 2006. Eight percent reported burning recyclables in 2011 (question not asked in 2006).
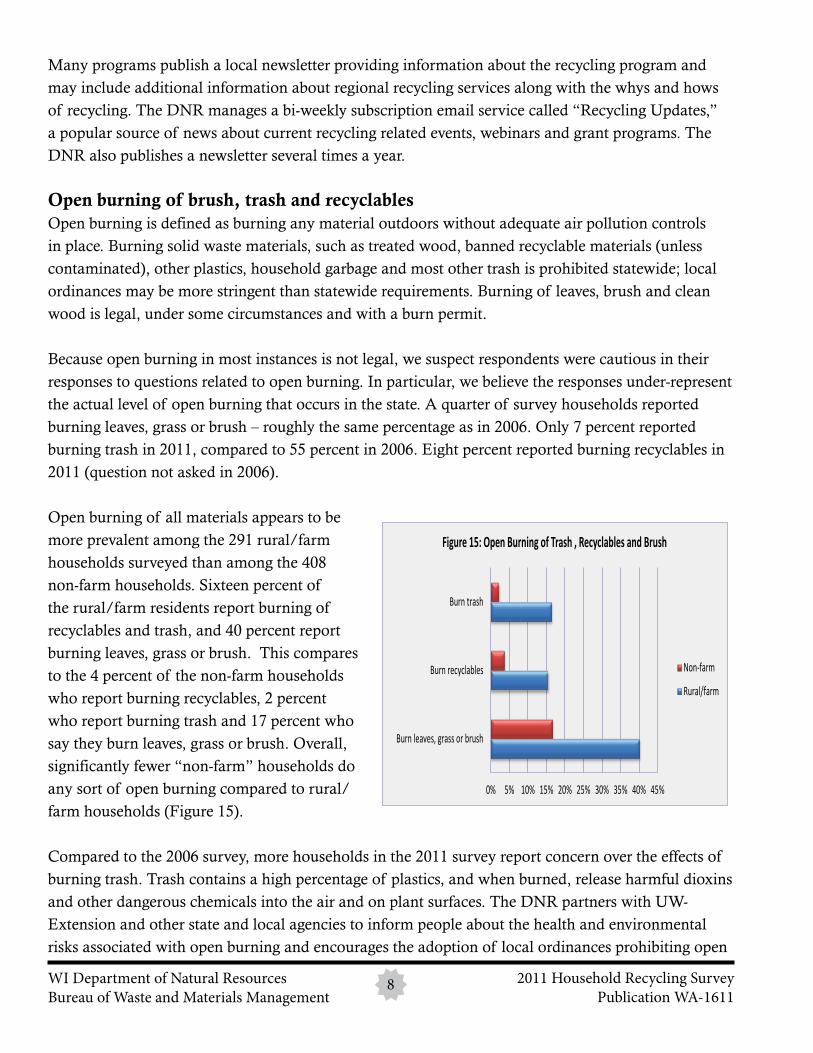
Open burning of all materials appears to be more prevalent among the 291 rural/farm households surveyed than among the 408 non-farm households. Sixteen percent of the rural/farm residents report burning of recyclables and trash, and 40 percent report burning leaves, grass or brush. This compares to the 4 percent of the non-farm households who report burning recyclables, 2 percent who report burning trash and 17 percent who say they burn leaves, grass or brush. Overall, significantly fewer “non-farm” households do any sort of open burning compared to rural/farm households (Figure 15).
Compared to the 2006 survey, more households in the 2011 survey report concern over the effects of burning trash. Trash contains a high percentage of plastics, and when burned, release harmful dioxins and other dangerous chemicals into the air and on plant surfaces. The DNR partners with UW-Extension and other state and local agencies to inform people about the health and environmental risks associated with open burning and encourages the adoption of local ordinances prohibiting open
WI Department of Natural Resources Bureau of Waste and Materials Management
8 2011 Household Recycling SurveyPublication WA-1611
0% 5% 10% 15% 20% 25% 30% 35% 40% 45%
Burn leaves, grass or brush
Burn recyclables
Burn trash
Figure 15: Open Burning of Trash , Recyclables and Brush
Non-farm
Rural/farm
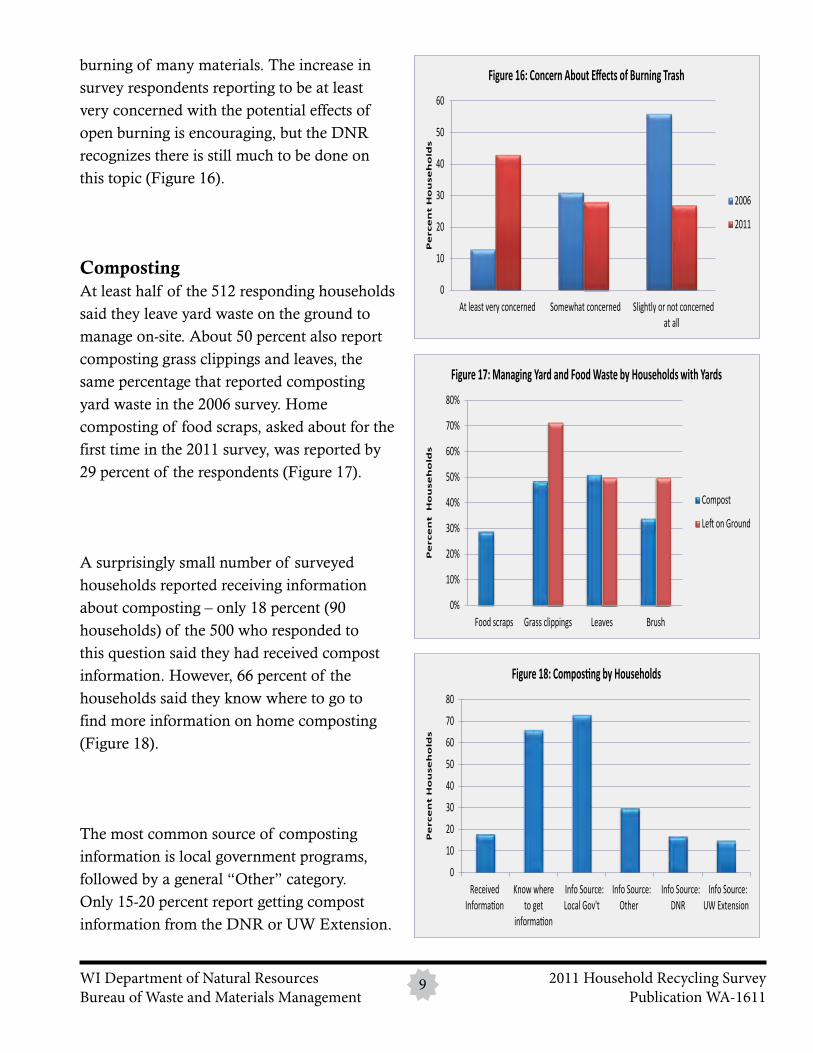
burning of many materials. The increase in survey respondents reporting to be at least very concerned with the potential effects of open burning is encouraging, but the DNR recognizes there is still much to be done on this topic (Figure 16).
CompostingAt least half of the 512 responding households said they leave yard waste on the ground to manage on-site. About 50 percent also report composting grass clippings and leaves, the same percentage that reported composting yard waste in the 2006 survey. Home composting of food scraps, asked about for the first time in the 2011 survey, was reported by 29 percent of the respondents (Figure 17).
A surprisingly small number of surveyed households reported receiving information about composting – only 18 percent (90 households) of the 500 who responded to this question said they had received compost information. However, 66 percent of the households said they know where to go to find more information on home composting (Figure 18).
The most common source of composting information is local government programs, followed by a general “Other” category. Only 15-20 percent report getting compost information from the DNR or UW Extension.
WI Department of Natural Resources Bureau of Waste and Materials Management
9 2011 Household Recycling SurveyPublication WA-1611
0
10
20
30
40
50
60
At least very concerned Somewhat concerned Slightly or not concernedat all
Pe
rce
nt
Ho
use
ho
lds
Figure 16: Concern About Effects of Burning Trash
2006
2011
0%
10%
20%
30%
40%
50%
60%
70%
80%
Food scraps Grass clippings Leaves Brush
Pe
rce
nt
Ho
use
ho
lds
Figure 17: Managing Yard and Food Waste by Households with Yards
Compost
Left on Ground
0
10
20
30
40
50
60
70
80
ReceivedInformation
Know whereto get
information
Info Source:Local Gov't
Info Source:Other
Info Source:DNR
Info Source:UW Extension
Pe
rce
nt
Ho
use
ho
lds
Figure 18: Composting by Households
WI Department of Natural Resources Bureau of Waste and Materials Management 10 2011 Household Recycling Survey
Publication WA-1611
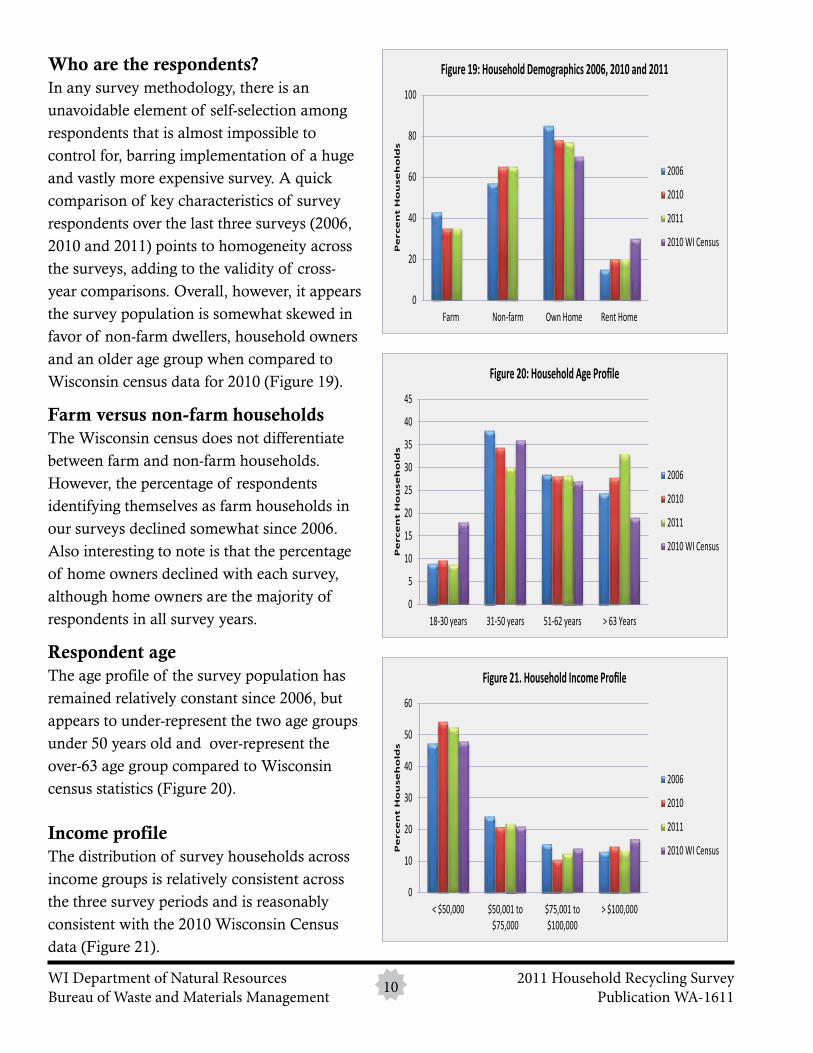
Who are the respondents? In any survey methodology, there is an unavoidable element of self-selection among respondents that is almost impossible to control for, barring implementation of a huge and vastly more expensive survey. A quick comparison of key characteristics of survey respondents over the last three surveys (2006, 2010 and 2011) points to homogeneity across the surveys, adding to the validity of cross- year comparisons. Overall, however, it appears the survey population is somewhat skewed in favor of non-farm dwellers, household owners and an older age group when compared to Wisconsin census data for 2010 (Figure 19).
Farm versus non-farm householdsThe Wisconsin census does not differentiate between farm and non-farm households. However, the percentage of respondents identifying themselves as farm households in our surveys declined somewhat since 2006. Also interesting to note is that the percentage of home owners declined with each survey, although home owners are the majority of respondents in all survey years.
Respondent ageThe age profile of the survey population has remained relatively constant since 2006, but appears to under-represent the two age groups under 50 years old and over-represent the over-63 age group compared to Wisconsin census statistics (Figure 20).
Income profile The distribution of survey households across income groups is relatively consistent across the three survey periods and is reasonably consistent with the 2010 Wisconsin Census data (Figure 21).
0
20
40
60
80
100
Farm Non-farm Own Home Rent Home
Pe
rce
nt
Ho
use
ho
lds
Figure 19: Household Demographics 2006, 2010 and 2011
2006
2010
2011
2010 WI Census
0
5
10
15
20
25
30
35
40
45
18-30 years 31-50 years 51-62 years > 63 Years
Pe
rce
nt
Ho
use
ho
lds
Figure 20: Household Age Profile
2006
2010
2011
2010 WI Census
0
10
20
30
40
50
60
< $50,000 $50,001 to$75,000
$75,001 to$100,000
> $100,000
Pe
rce
nt
Ho
use
ho
lds
Figure 21. Household Income Profile
2006
2010
2011
2010 WI Census
ConclusionThe survey results indicate more than 85 percent of Wisconsinites support the state recycling law, and 93 percent of households say they recycle at home. Equally important is that Wisconsinites recycle because they believe it is good for the environment and because it creates jobs, not just because it is the law. While “away from home” recycling opportunities are not nearly as available as they could be, it is encouraging that a majority of Wisconsinites (albeit a slight majority) say they recycle when options are available, or take recyclables home with them. In addition, residents seek out opportunities to recycle other household wastes such as plastic bags, pharmaceuticals, used oil and oil filters, and they consider the environment when purchasing by seeking out recyclable products or those made with recycled content. Concern about the negative effects of burning trash is on the rise compared to previous years, with fewer households reporting burning of trash. These encouraging signs indicate that support for recycling remains strong in the state.
The survey results also provide important insights into how to improve the delivery of recycling messages by identifying gaps and weaknesses among the more common outreach methods. The study shows a strong correlation between the quality of information that households receive about recycling and their commitment to recycling. However, the effectiveness of information provided by local government recycling programs has declined since 2006. This emphasizes the need for effective and targeted outreach programs. What can or should DNR do to improve the quality of information provided to residents? A majority of people appear to still prefer to receive information in print rather than electronically or through the web or television, but we also need to continue exploring the use of social and alternate media sources to expand our reach beyond the usual targets. What combination of efforts is best for getting out the basic information?
Monitoring program performance over time is a valuable and informative tool. The DNR is committed to sharing this information with others and using it to make continued improvements to Wisconsin’s recycling program. We welcome your input and thoughts on the best way to keep us moving forward.
WI Department of Natural Resources Bureau of Waste and Materials Management 11 2011 Household Recycling Survey
Publication WA-1611


Printed on Recycled Paper
Wisconsin Department of Natural ResourcesWaste and Materials Management Program
The Wisconsin Department of Natural Resources providesequal opportunity in its employment, programs, services andfunctions under an A�rmative Action Plan. If you have anyquestions, please write to Equal Opportunity O�ce,Department of Interior, Washington, D.C. 20240.
This publication is available in alternative format (large print, Braille, audio tape. etc.) upon request. Please call (608) 266-2111 for more information.
PUB WA-1611
P.O. Box 7921, Madison, WI 53707 — [email protected]
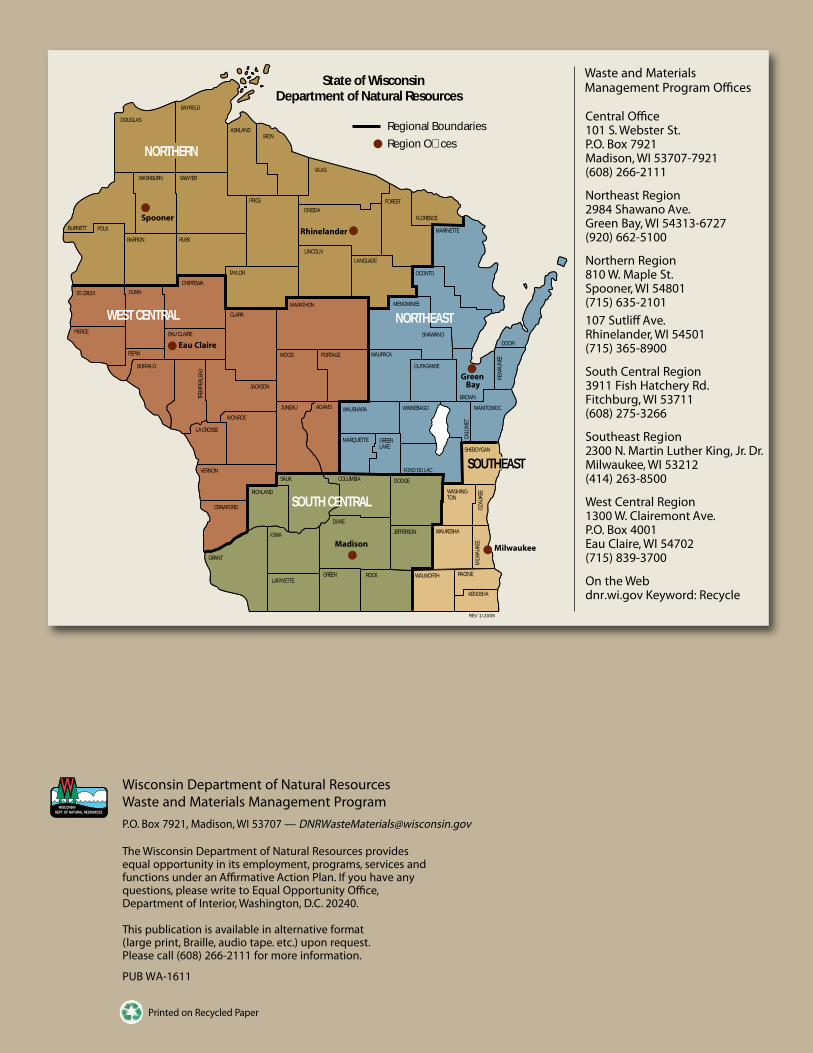
Waste and MaterialsManagement Program O�ces
Central O�ce101 S. Webster St. P.O. Box 7921Madison, WI 53707-7921(608) 266-2111
Northeast Region2984 Shawano Ave. Green Bay, WI 54313-6727(920) 662-5100
Northern Region810 W. Maple St.Spooner, WI 54801(715) 635-2101107 Sutli� Ave.Rhinelander, WI 54501(715) 365-8900
South Central Region3911 Fish Hatchery Rd.Fitchburg, WI 53711(608) 275-3266
Southeast Region2300 N. Martin Luther King, Jr. Dr.Milwaukee, WI 53212(414) 263-8500
West Central Region1300 W. Clairemont Ave. P.O. Box 4001Eau Claire, WI 54702(715) 839-3700
On the Webdnr.wi.gov Keyword: Recycle
DOUGLAS
BAYFIELD
ASHLANDIRON
BURNETT
VILASWASHBURN SAWYER
PRICE
ONEIDAFOREST
FLORENCE
BARRON
POLK
RUSK
TAYLOR
CHIPPEWADUNNST. CROIX
PIERCE
PEPIN
EAU CLAIRE
CLARK
LINCOLN
MARATHON
LANGLADE
MARINETTE
OCONTO
MENOMINEE
SHAWANODOOR
KEW
AUNE
E
BROWN
OUTAGAMIE
WAUPACAWOOD PORTAGE
MANITOWOCWINNEBAGO
CALU
MET
WAUSHARA
JACKSON
JUNEAU ADAMS
MARQUETTE GREENLAKE
FOND DU LAC
SHEBOYGAN
MONROE
SAUK COLUMBIA DODGE
WASHING-TON
OZAU
KEE
MILW
AUKE
E
WAUKESHAJEFFERSON
DANE
KENOSHA
RACINEWALWORTHROCKGREENLAFAYETTE
IOWA
GRANT
RICHLAND
CRAWFORD
VERNON
LA CROSSE
BUFFALO
TREM
PEAL
EAU
NORTHEASTWEST CENTRAL
SOUTH CENTRAL
Regional BoundariesRegion O�ces
REV 1/2006
State of WisconsinDepartment of Natural Resources
SOUTHEAST
NORTHERN


