

2013-2015
Three Year Plan
September 27th, 2013

Agenda
Group Overview
2013-2015 Three Year Plan
Appendix
2

Group Overview

Datalogic at a glance
Global leader in Automatic Data Capture and
Industrial Automation markets
World-class producer of barcode readers, mobile
computers, sensors, vision systems and laser
marking systems with innovative solutions in retail,
manufacturing, transportation & logistics and
healthcare industries
2012 Revenues at 462.3 M Euro of which 64.4% in
the ADC Market and 28.2% in the Industrial
Automation Market
A large portfolio of over 1,000 patents
Founded in 1972 by Romano Volta in Bologna, Italy
and listed on the STAR Segment of the Italian Stock
Exchange since 2001
About 2,400 employees, of which 350 in R&D
Direct presence in 30 countries worldwide selling to
120 countries
+1,000 partners worldwide
4

Acquisition of
Multiwave
Photonics
(Portugal)
Acquisition of
IDWare Mobile
Computing &
Comm. (Italy)
Acquisition of
Escort Memory
Systems Inc.
(CA, USA)
Acquisition of
Datasensor SpA
(Italy)
Listing on the Milan
Stock Exchange
Acquisition of
Minec AB
(Sweden)
Acquisition of
Laservall SpA (Italy)
Acquisition of Informatics
Inc. (TX, USA)
Acquisition of PSC Inc.
(OR, USA)
2001 2002 2005 2004 2008 2010
Acquisition of
Evolution Robotics
Retail (CA, USA)
2011
Acquisition of
Accu-Sort Systems
Inc. (PA, USA)
Acquisition of
PPT Vision Inc.
(MN, USA)
Established in
Bologna
1972 1988 1997 2012
A history of growth through acquisitions
5
2013

6 © Copyright Datalogic 2007-2013
A wide geographical footprint
6
EUROPE 37.3%
ITALY 8.4%
NORTH AMERICA 34.5%
ROW 8.4%
APAC 11.4%
Note: Breakdown by area based on 2012 revenues
Direct presence in 30 countries worldwide
8 Manufacturing Sites 12 R&D Centers

9
20
12
6
98
32
17
23 23
25
14
6
2 1
45
11
3
6
10
87
4
10
1
32
4
0
4
0
3
0
4
16
22
1413
16
23
35
27
3334
32
22
2001 2002 2003 2004 2005 2006 2007 2008 2009 2010 2011 2012
PRODUCT UPDATE NEW LINE OF PRODUCTS
BREAKTHROUGH INNOVATION TOTAL DEVELOPMENTS
Relentless innovation
7 7 7
264 283328 342
682761 789
867 885 898
1003 1023
2001 2002 2003 2004 2005 2006 2007 2008 2009 2010 2011 2012
PATENT PORTFOLIO PRODUCT INNOVATION
22 new products in 2012
A large and growing portfolio of over 1,000 patents
Over 100 patents filed in 2012
12 Research & Development Centers
Over 350 R&D Engineers
25% of sales from new products

2013-2015 Three Year Plan

3.71 3.74 4.57
3.23
2011 2012 2015E
IA Available Market IA Addressable Market
7.80
59%
41%
9% 9% 10%
22% 24% 27%
69% 67% 63%
2011 2012 2015E
POS RETAIL SCANNERS HAND HELD SCANNERS MOBILE COMPUTERS
4.0
Worldwide market trend: two speeds for ADC and IA
9
Automatic Data Capture
ADC addressable market was down 3.5% in
2012 due to the economic crisis, forecast
reviewed downward for the entire period
CAGR 2012-2015 +0.9%
Major improvements expected only in Asia
Pacific with a CAGR 2012-2015 around 5%
Industrial Automation
Very fragmented IA industry with potential
addressable markets worth $3B in the
Inductive Proximity and ASMV Systems
IA market flat in 2012, expected to recover
from 2014
Growing technology convergence (laser
and vision based technology)
CAGR
2012-15
6.9%
$B
Source VDC 2013 (base year 2012)
$B
Source VDC 2013 (base year 2012) Preliminary Figures - Market Researches and
Management's Best Estimate
4.0 3.9
CAGR
2012-15
+0.9%
-0.9%
+4.3%
+4.3%

10
ADC positioning: competing with giants
10
Source VDC 2013 (base year 2012)
2012 ADC Available Market including POS Retail Scanners, Handheld Scanners and Mobile Computers (Hand Held ,
PDA and Fork-Lift Vehicles Mounted Computer) segments
Honeywell improved its positioning thanks to the acquisition of Intermec
2012 Revenues in $M
20
12
Ma
rke
t S
hare
ADC Market Share
around 10%
POS Retail Scanners
#1 WW – 32.8% mkt share
Handheld Scanners
#1 in EMEA – 33.8% mkt share
#3 WW – 16.8% mkt share
Mobile Computers
#3 in EMEA – 8% mkt share
#3 WW – 4 % mkt share

11 © Copyright Datalogic 2007-2013
$50 M $200 M $300 M $500 M
12%
>15%
6%
2%
4%
8%
2012 IA Available Market including Industrial Barcode Scanners, Imagers, Photoelectric Sensors, Safety Light
Curtains, Smart Cameras/Vision Sensors, Laser Marking segments (Postal Material Handling, Dimensioner and
Integrated Solutions not included)
Source (*) VDC 2013 (base year 2012) Preliminary Figures - Market Researches and Management's Best Estimate
2012 Revenues in $M
IA positioning: 6% market share
11
Industrial Stationary
Scanners
#1 WW – 27.5% mkt share
#1 in Americas – 31.3% mkt
share
#2 in EMEA – 29.1% mkt
share
20
12
Mar
ket
Shar
e
$100 M

12
Three Year Plan: the new paradigma
Customer
Focus
Market
Expansion
People
Engagement

Customer focus: invest in technology and
develop excellent products
13 13 13
New Business Development
Division to meet and anticipate
current and future customer
needs
Focus on Vision and Imaging
technologies
Focus on breakthrough
innovations
Improve market shares
Research & Development
investments from current 7% to
over 8% on sales in the new
plan
NEW
BUSINESS DEVELOPMENT
DIVISION
Core Competences
New Emerging Technologies
Integration Office

Retail: 41% of revenues*
14
* Figures as of 31 August 2013
Industrial Automation
Automatic Data Capture

Retail
15
Leverage the great
market share
in POS checkout
Increase customer
penetration New products
Tailored services
Store mngt
Maintain / upgrade
customer base
Most innovative solutions
Multi-tier model
POS
Maximize customer
coverage New Products
Bundle solutions
Warehouse

Retail -Trends & Key to success
Trends
Multi-modal retail format are gaining traction
Transition to data rich barcode is carefully evaluated by retailers
Strengths
Industry leaders in Bi-Optic & Single-Plane products
Strong worldwide food retail relationships
Consolidated resellers network
Strong brand recognition
Key to success
Increase depth in specialized mobile computers for retail
Increase the value of products and services for tier 1
Pursue growth opportunities following demographic expansion
16
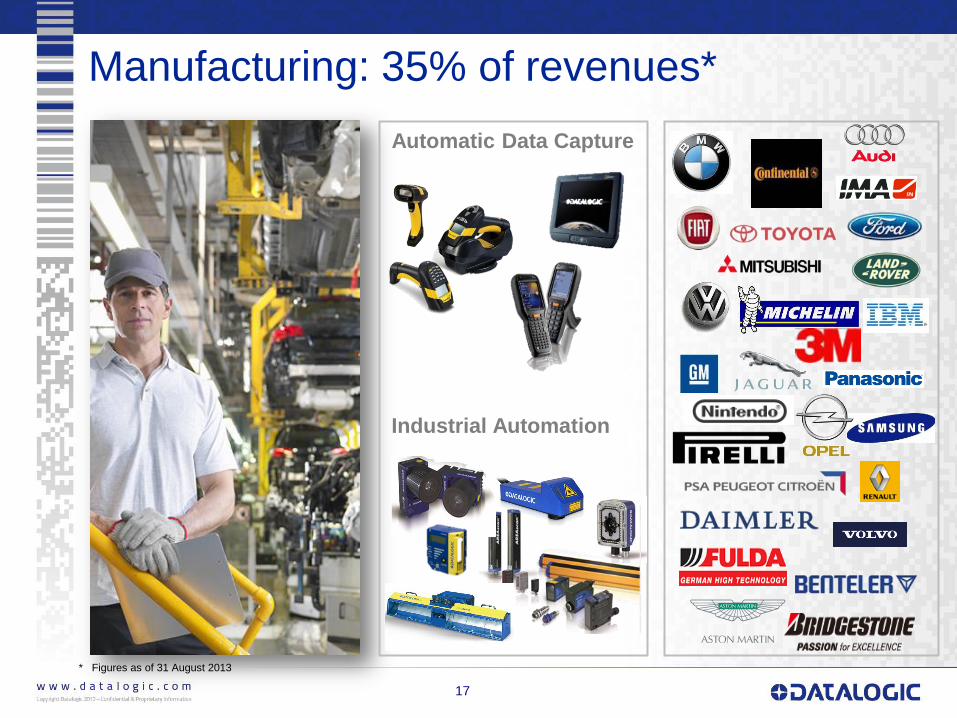
Manufacturing: 35% of revenues*
17
* Figures as of 31 August 2013
Industrial Automation
Automatic Data Capture

Manufacturing
18
Leverage the product breadth
and distribution channel
Maximize customer
coverage Geographical expansion
Leverage barcode, marking
and inspection
Automation
Increase customer
penetration
Replicate EMEA
channel model
Shop floor
Maintain / upgrade
customer base Packaged solutions
Tailored services
Warehouse

Manufacturing-Trends & Key to success
Trends
Both traditional and emerging markets are endorsing
unprecedented level of automation
Focus on:
Food and Pharma Automatic Machines
Electronics including Third Party Manufacturer
Automotive (Cars, Tires and other parts)
Key to success
Expand the geographical presence and replicate the EMEA
channel model
Leverage machine vision investment to increase the value of
sensors
Provide packaged solutions bundling laser marking and
machine vision
19

Transportation & Logistic: 17% of revenues*
20
* Figures as of 31 August 2013
Industrial Automation
Automatic Data Capture

Transportation & Logistics
21
Leverage leadership in
sorting applications
Increase customer
penetration
New products
Data fusion
Data Collection
Maintain / upgrade
customer base Product refinement
Aggressive sales
Sorting
Selective expansion New products
Tailored services
Delivery
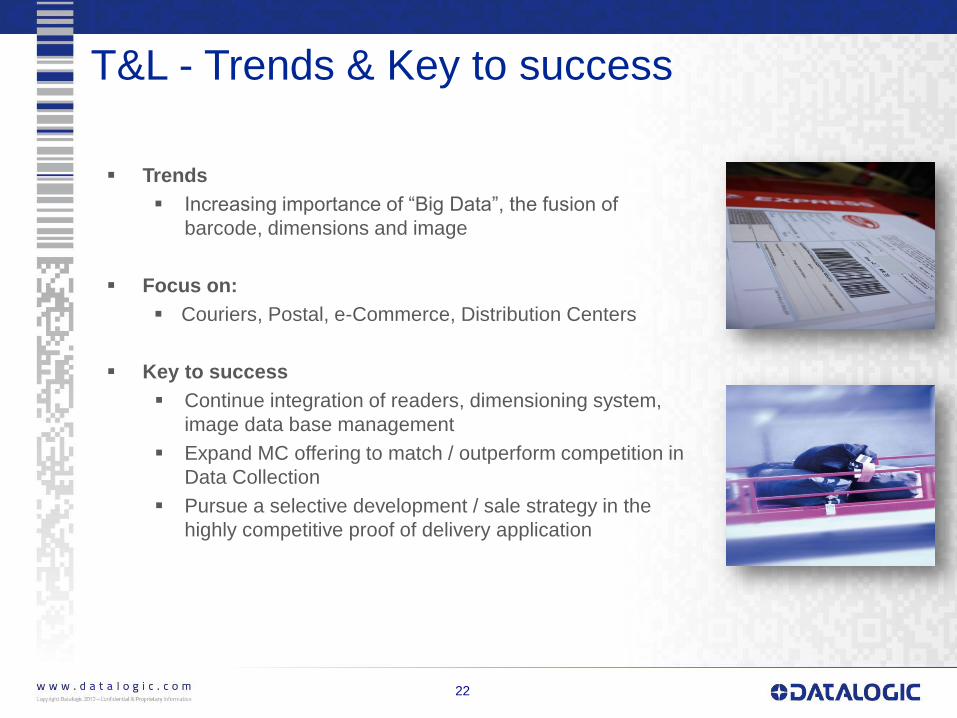
T&L - Trends & Key to success
Trends
Increasing importance of “Big Data”, the fusion of
barcode, dimensions and image
Focus on:
Couriers, Postal, e-Commerce, Distribution Centers
Key to success
Continue integration of readers, dimensioning system,
image data base management
Expand MC offering to match / outperform competition in
Data Collection
Pursue a selective development / sale strategy in the
highly competitive proof of delivery application
22

Healthcare: 5% of revenues*
23
* Figures as of 31 August 2013 – Other industries (Government and Hospitality) account for 3% of revenues
Industrial Automation
Automatic Data Capture

Healthcare
24
Anticipate new regulatory
E-pedigree
European Medicines Verification System
Increase customer
penetration Tailored services
Channel program
Inventory mngt
Maximize customer
coverage Most innovative solutions
New Products
Bed side care
Maximize customer
coverage Expand geography
Mark and Verify solutions
Manufacturing

Healthcare - Trends & Key to success
Trends
Major regulatory changes are underway
US with e-pedigree
Europe with EMVS
Key to success
Continue expansion of specialized products
Expand mark and verify solutions
Increase penetration of MC in hospital stock
management
25

Market expansion – Exploit fast growing markets
26
Increase penetration in large regions and fast
growing geographies: CAGR 2012-2015
+12%
Large potential in all key industries for
automation investments (focus on Sensors &
Vision in BRICS)
Boost growth in under served countries like
China, Korea, Turkey, Africa, India and Brazil
Strengthen sales force and establish new
local offices
Ad hoc products that fit with local needs and
habits
Scouting new opportunities for external growth
(not included in the plan)
Invest in people management and motivation
27
A new strengthened Human Resources
leadership to enable Datalogic business
strategy & agenda by ensuring:
the design and delivery of a high
performance organization
the selection and retention of top
talent
the development and rewarding of
people by fostering a culture of
engagement and results oriented
Datalogic Human Resources key strategic pillar:
Differentiated performance through our people!

Three Year Plan: leveraging on our strengths ...
28 28 28
Financial
Consistent history of profitable growth
Consistent resource management to sustain a leadership position
Strong cash generation to reduce Net Debt (Net Debt/Equity ratio at 0.6x at 1H 2013)
and to sustain growth
Continuous improvement of Net Working Capital
Potential from further internal reorganization
Processes
Address the customers’ needs with a flexible, but structured process
Perfect the new product development process continuously
Improve operational efficiency with structured plans
Adopt state of the art supply chain in both division to gain efficiency and leverage
the industrial global footprint

…in a more difficult market scenario
29 29 29
Refresh the Datalogic Three Year rolling plan to extend targets to 2015
Three Year Plan based on organic growth without acquisitions
New market situation
ADC 2012-2015: flat trend expected vs previous forecasted CAGR of 5.7%
Industrial Automation 2012-2015: expected CAGR of 6.9% vs a previous
forecast of 5.4%

Three Year Plan 2013-2015
30
REVENUES GROWTH EBITDA GROWTH
Revenues 2012-2015 CAGR over 5% above market average driven by:
ADC CAGR over +4% vs +1% of market
IA CAGR over +10% vs + 6.9% of market
Recovery expected from 2014
Improvement of EBITDA, CAGR 2012-2015 of around 8% expected in a range of
78-80 M Euro (EBITDA margin to ~ 15% in 2015)
19.7
49.8
59.2 63.2
78-80
6%
13% 14% 14% ~15%
2009 2010 2011 2012 2015E
EBITDA EBITDA Margin
312
392.7 425.5
463.1
535-545
2009 2010 2011 2012 2015E
CAGR >5%
CAGR ~8%

Three Year Plan 2013-2015
31
Strong cash generation: Net Debt/Equity ratio < 20% and Net Debt/EBITDA
around 0.5X
Investment in CAPEX stable at around 2% of revenues per year
2015 ROE target around 17%-18%
14.0%
17.7%
6.0%
2010 2011 2012* 2015E
17%-18%
ROE GROWTH
*2012 figures include impairment on Accu-Sort
** Figures gross of dividends
Net Financial Position **
80-85
(76)
(59)
(121)
(36-41)
2010 2011 2012 Cash Flow 2015E

Appendix

Stock and Governance
33
Market Segment: STAR MTA
Reuters Code: DAL.MI
Bloomberg Code: DAL IM
Outstanding Shares: 58,446,491
Share Par-Value: 0.52 Euro each
SHAREHOLDERS’ STRUCTURE
Ticker: DAL
Price (September 24th, 2013): 6.83 Euro
Market Cap (September 24th, 2013): 399.2 M Euro
Specialist: Intermonte SIM
Auditing Company: Reconta Ernst & Young
DATALOGIC PRICE PERFORMANCE
68,40%
20.42%
6,40%
2.03% 2.75%
Hydra S.p.A.
Free Float
Tamburi Investment P.
D'Amico
Treasury Shares
0
10.000
20.000
30.000
40.000
50.000
60.000
70.000
80.000
90.000
100.000
110.000
120.000
130.000
140.000
150.000
3
3,5
4
4,5
5
5,5
6
6,5
7
7,5
8
8,5
9

Management
Giovanni Sgalambro
CIO and Change
Mgmt
Romano Volta
Chairman and
Group CEO
AUTOMATIC DATA CAPTURE
(ADC)
Datalogic ADC
Bill Parnell
CEO
Hand Held Scanners
Fixed Retail Scanners
Mobile Computers
Identification
Postal/Systems
Sensors & Safety
Laser Marking
Informatics
Marco Rondelli
Business Leader
WASP
System Warehouse
Marco Rondelli
CFO
Datalogic IA
Gian Paolo Fedrigo
CEO
Machine Vision
INFORMATICS INDUSTRIAL AUTOMATION (IA)
IP Tech Valentina Volta CEO
New Needs and
Application Scouting
Datalogic LABS
Mergers & Acquisitions
BUSINESS DEVELOPMENT
Romano Volta
Interim CHRO
Federica Lolli
General Counsel
34

Consistent growth in 2001-2012
35
SALES CAGR 2001-2012 +14% EBITDA CAGR 2001-2012 +13%
NET INCOME CAGR 2001-2012 +26% Strong consistent growth across key
indicators reflecting investments in innovation,
M&A and improvements in efficiency and
productivity
112 118 132 146
206
382 404
380
312
393 426
462
2001 2002 2003 2004 2005 2006 2007 2008 2009 2010 2011 2012
16 17 21
25 32
38
50 48
20
50
59 63
2001 2002 2003 2004 2005 2006 2007 2008 2009 2010 2011 2012
1
5 7
11 13
4
18 18
-12
18
26
10 *
2001 2002 2003 2004 2005 2006 2007 2008 2009 2010 2011 2012
* 2012 net profit impacted by the write off of Accu-Sort goodwill

1H 2013 Profit and Loss
36
000€ 1H2013 1H2012
Var %
Revenues 218,769 100.0% 236,860 100.0% -7.6%
COGS (115,337) -52.7% (123,719) -52.2% -6.8%
Gross Operating Margin 103,432 47.3% 113,141 47.8% -8.6%
Other revenues 617 0.3% 6,109 2.6% -89.9%
R&D (17,397) -8.0% (15,893) -6.7% 9.5%
Distribution Costs (41,763) -19.1% (43,509) -18.4% -4.0%
Administrative expenses (22,801) -10.4% (22,882) -9.7% -0.4%
Other operating expenses (847) -0.4% (1,337) -0.6% -36.6%
Total operating expenses and others (82,808) -37.9% (83,621) -35.3% -1.0%
EBITANR 21,241 9.7% 35,629 15.0% -40.4%
Non recurring costs/rev 1,059 0.5% (1,570) -0.7% n.a.
Amort. Intang. Assets from acquis. (2,913) -1.3% (2,731) -1.2% 6.7%
Operating Profit (EBIT) 19,387 8.9% 31,328 13.2% -38.1%
Financial (costs)/rev. (4,157) -1.9% (3,992) -1.7% 4.1%
Results from equity investments 102 0.0% 116 0.0% -12.1%
Foreign exchange (costs)/rev. (1,108) -0.5% 4,544 1.9% n.a.
EBT 14,224 6.5% 31,996 13.5% -55.5%
Taxes (3,987) -1.8% (5,432) -2.3% -26.6%
Net Income 10,237 4.7% 26,564 11.2% -61.5%
Depreciation (3,886) -1.8% (3,807) -1.6% 2.1%
Amortization (1,105) -0.5% (1,213) -0.5% -8.9%
EBITDA 26,232 12.0% 40,649 17.2% -35.5%
Exchange rate 1.3134 1.2965

Consolidated Balance Sheet
37
€000 At 31/12/2012 At 30/06/2013
Intangible fixed assets 60,262 58,826
Goodwill 151,134 152,821
Tangible fixed assets 51,621 50,429
Non Consolidated investments 3,936 3,887
Other fixed assets 46,602 42,517
Total Fixed Assets 313,555 308,480
Net trade account receivables 82,552 72,059
ST account payables (71,102) (73,526)
Inventory 49,153 54,041
Trade Working Capital 60,603 52,574
Other current receivables 25,577 27,766
Other ST payables and provision for risk & future charges (71,566) (62,415)
Net Working Capital 14,614 17,925
Other LT payables (22,513) (23,537)
Employees’ severance Indemnity (7,367) (7,348)
LT provision for risk & future charges (3,768) (5,178)
Net Invested Capital 294,521 290,342
Equity 173,403 176,903
Net Financial Position (121,118) (113,439)
Exchange rate 1.3194 1.3080

Revenues trend
38
REVENUES BY AREA
€000 1H2012 1H2013 Var %
Italy 20,845 20,752 -0.4%
Europe 92,887 79,129 -14.8%
North America 83,218 75,334 -9.5%
Asia Pacific 25,999 27,389 5.3%
ROW 13,911 16,165 16.2%
Total revenues 236,860 218,769 -7.6%
REVENUES BY DIVISION
€000 1H2012 1H2013 Var %
Datalogic ADC 148,628 134,151 -9.7%
Datalogic Automation 70,079 69,041 -1.5%
Informatics 18,477 15,655 -15.3%
Datalogic S.p.A. 10,359 11,162 7.8%
Adjustments (10,683) (11,240) 5.2%
Total revenues 236,860 218,769 -7.6%
61,3%
31,6%
7.2%
ADC
IA
Informatics
9,5%
36,2%
34,4%
12,5%
7,4%
Italy
Europe
North America
Asia Pacific
ROW

Contacts
39
IR CONTACTS
CFO and IR Manager
Marco Rondelli
E-mail [email protected]
IR Assistant
Daniela Giglioli
Tel. +39 051 3147109
Fax +39 051 3147205
E-mail [email protected]
Via Candini, 2
40012 Lippo di Calderara di Reno
Bologna – Italy
IR Consultant
Vincenza Colucci
CDR Communication Srl
Tel. +39 335 6909547
October 2nd, 2013
STAR Conference London
November 7th, 2013
Approval of the Consolidated Financial
Report as of September 30, 2013
www.datalogic.com
NEXT EVENTS
DATALOGIC ON LINE

Disclaimer
This document has been prepared by Datalogic S.p.A. (the "Company") for use during meetings with investors and financial
analysts and is solely for information purposes. The information set out herein has not been verified by an independent audit
company.
Neither the Company nor any of its subsidiaries, affiliates, branches, representative offices (the “Group”), as well as any of
their directors, officers, employees, advisers or agents (the “Group Representatives”) accepts any responsibility for/or makes
any representation or warranty, express or implied, as to the accuracy, timeliness or completeness of the information set out
herein or any other related information regarding the Group, whether written, oral or in visual or electronic form, transmitted or
made available.
This document may contain forward-looking statements about the Company and/or the Group based on current expectations
and opinions developed by the Company, as well as based on current plans, estimates, projections and projects of the Group.
These forward-looking statements are subject to significant risks and uncertainties (many of which are outside the control of
the Company and/or the Group) which could cause a material difference between forward-looking information and actual
future results.
The information set out in this document is provided as of the date indicated herein. Except as required by applicable laws
and regulations, the Company assumes no obligation to provide updates of any of the aforesaid forward-looking statements.
Under no circumstances shall the Group and/or any of the Group Representatives be held liable (for negligence or otherwise)
for any loss or damage howsoever arising from any use of this document or its contents or otherwise in connection with the
document or the aforesaid forward-looking statements.
This document does not constitute an offer to sell or a solicitation to buy or subscribe to Company shares and neither this
entire document or a portion of it may constitute a recommendation to effect any transaction or to conclude any legal act of
any kind whatsoever.
This document may not be reproduced or distributed, in whole or in part, by any person other than the Company.
By viewing and/or accepting a copy of this document, you agree to be bound by the foregoing limitations.
40


