

2014 Educational Return on Investment Report 2012-2013 Program Evaluation
April 2014

2
This page intentionally left blank

3
ABOUT THE DEPARTMENT OF RESEARCH,
EVALUATION, AND ASSESSMENT The Department of Research, Evaluation, and Assessment (REA) is a multi-faceted team that serves the
district within the Office of Accountability. The REA department is comprised of the Supervisor of
Research and Evaluation, the Supervisor of Assessment, a senior data analyst, a data analyst, and two
accountability specialists. The department is responsible for state accountability measures,
administration of all district-wide assessments, program evaluation, researching curricular data,
communicating data to appropriate stakeholders across the district, and providing its analytical
expertise to assist school leaders in making student-centered, data-driven decisions. In addition to
these responsibilities, the REA team also serves as the gateway for external organizations requesting
access to data from the Knox County Schools to include in third-party research.
ABOUT THE OFFICE OF ACCOUNTABILITY The Office of Accountability operates under the leadership of the Chief Accountability Officer. The
office is responsible for district accountability and organizational performance, with the ultimate goal of
increasing student academic achievement. Staff members lead efforts to interpret data, identify root
causes, and provide actionable feedback to inform strategic planning and resource allocation. The
Office of Accountability directs and coordinates the following areas: Elementary and Secondary
Education Act compliance; assessment; research; program evaluation; performance evaluation data
collection and support; performance-based compensation data collection and support; federal
programs; strategic planning and improvement; and competitive grant funding and management.

4
CONTRIBUTORS Knox County Schools
Dr. Jim McIntyre Superintendent Curriculum & Instruction
Dr. Elizabeth Alves
Assistant Superintendent, Chief
Academic Officer
Dr. Clifford Davis
Executive Director, Secondary Education
Nancy Maland
Executive Director, Elementary
Education
Melissa Massie
Executive Director, Student Support
Services
Dr. Jon Rysewyk
Executive Director, Office of Innovation
and School Improvement
Millicent Smith
Executive Director, Curriculum,
Instruction, & Professional Development
Dr. Jean Heise
Supervisor, Humanities
Donna Howard
Supervisor, Elementary
Theresa Nixon
Director, Instructional Technology
Dr. Daphne Odom
Supervisor, Gifted and
Talented/Magnet/AVID
Janet Sexton
Supervisor, Elementary Reading and
Language Arts
Julie Thompson
Supervisor, Elementary
Heather Willis
Supervisor, Student Support Services
Office of Accountability
Nakia Towns
Chief Accountability Officer
Ginnae Harley
Director, Federal Programs
Keith Wilson
Director, TAP Program
John Beckett
Supervisor, Research and Evaluation
Laurie Driver
Supervisor, Assessment
Clint Sattler
Senior Data Analyst
Reem Abdelrazek
Data Analyst
Beth Boston
Specialist
Marie Lunde
Specialist
Finance Office
Ron McPherson
Executive Director, Finance
Lizabeth McLeod
Director, Budget
Public Affairs Office
Melissa Ogden
Director, Public Affairs
External Organizations
The Parthenon Group
Education Resource Strategies (ERS)

5
TABLE OF CONTENTS ABOUT THE DEPARTMENT OF RESEARCH, EVALUATION, AND ASSESSMENT ......................................................... 3
ABOUT THE OFFICE OF ACCOUNTABILITY .............................................................................................................. 3
CONTRIBUTORS .................................................................................................................................................... 4
TABLE OF CONTENTS ............................................................................................................................................. 5
FREQUENTLY USED ACRONYMS ............................................................................................................................ 7
EXECUTIVE SUMMARY .......................................................................................................................................... 9
INTRODUCTION ................................................................................................................................................... 13
MANAGEMENT REPORTS .................................................................................................................................... 15
1. COMMUNITY SCHOOLS ....................................................................................................................................... 17
2. TEACHER SUPPORT............................................................................................................................................. 21
2.2 ILC Overview ......................................................................................................................................... 24
2.3 PLC Overview ........................................................................................................................................ 27
2.4 Lead Teacher Overview ........................................................................................................................ 30
3. TUTORING ........................................................................................................................................................ 32
3.2 All Star Overview .................................................................................................................................. 33
3.3 EXPLORE Overview ............................................................................................................................... 36
3.4 ACT Overview ....................................................................................................................................... 37
4. INTERVENTION .................................................................................................................................................. 40
4.2 Early Literacy Overview ........................................................................................................................ 41
4.3 First Grade Intervention Overview ....................................................................................................... 43
4.4 Additional Elementary Reading Support Intervention Overview ......................................................... 46
4.5 Summer Bridge Overview ..................................................................................................................... 49
4.6 High School Learning Centers Overview ............................................................................................... 51
5. ENRICHMENT PROGRAMS .................................................................................................................................... 53
6. MAGNET PROGRAMS ......................................................................................................................................... 57
TECHNICAL REPORTS ........................................................................................................................................... 61
7. COMMUNITY SCHOOLS ....................................................................................................................................... 63
8. ILC: INDIVIDUAL LEARNING CYCLE ........................................................................................................................ 73
9. PLC: PROFESSIONAL LEARNING COMMUNITIES ....................................................................................................... 79
10. LEAD TEACHERS ............................................................................................................................................ 82
11. ALL STAR ..................................................................................................................................................... 85
12. EXPLORE TUTORING .................................................................................................................................... 94
13. ACT TUTORING ............................................................................................................................................ 99
14. EARLY LITERACY MATERIALS AND SUPPORT ...................................................................................................... 103
15. FIRST GRADE INTERVENTION ......................................................................................................................... 110
16. ADDITIONAL ELEMENTARY READING SUPPORT INTERVENTION .............................................................................. 117
17. SUMMER BRIDGE ........................................................................................................................................ 122
APPENDIX ......................................................................................................................................................... 127
1. APPENDIX: 2012 ROI EXECUTIVE SUMMARY ....................................................................................................... 129
2. APPENDIX: $7MM INVESTMENT SUMMARY ........................................................................................................ 133

6
3. APPENDIX: SMARTER SCHOOL SPENDING ............................................................................................................. 134
4. APPENDIX: ERS/PARTHENON ANALYSIS –OVERALL RESOURCE ALLOCATION ............................................................... 135
5. APPENDIX: PARTHENON ANALYSIS – INSTRUCTIONAL COACHING .............................................................................. 137
5.1 ILC Support ......................................................................................................................................... 138
5.2 PLC Support ........................................................................................................................................ 143
6. APPENDIX: PLC SMART GOAL EXAMPLES ........................................................................................................... 149
7. APPENDIX: PARTHENON ANALYSIS – LEAD TEACHERS AND TEAM EVALUATION ........................................................... 150
8. APPENDIX: PARTHENON ANALYSIS – TAP MODEL.................................................................................................. 156
9. APPENDIX: PARTHENON ANALYSIS – ELEMENTARY INTERVENTION AND VOYAGER ........................................................ 160
10. APPENDIX: PARTHENON ANALYSIS – INSTRUCTIONAL ASSISTANTS ............................................................................ 165
11. APPENDIX: ENRICHMENT ALLOCATION PROPOSALS ............................................................................................... 169
11.1 Adrian Burnett Elementary .......................................................................................................... 170
11.2 Brickey McCloud Elementary ....................................................................................................... 173
11.3 Cedar Bluff Elementary ............................................................................................................... 174
11.4 South Doyle Middle ..................................................................................................................... 175
12. APPENDIX: EARLY LITERACY MATCHED PAIR ANALYSIS ........................................................................................... 176

7
FREQUENTLY USED ACRONYMS
AMO Annual Measurable Objectives. AMOs are performance targets related to student
growth and achievement, which are an element of the Tennessee Department of
Education accountability framework.
CBM Curriculum-Based Measurement. KCS uses AIMSweb as its universal screener to
monitor student progress in literacy and numeracy based upon CBM.
DEA Discovery Education Assessments. KCS uses these formative assessments as
diagnostic tools to help inform instruction. These assessments are available in
grades 2 – 8 in reading, math, and science (online).
EOC End-of-Course exam. EOC exams are state-mandated assessments for English I, II,
and III; Algebra I and II; Biology I; Chemistry I; and U.S. History.
KCS Knox County Schools. The KCS is the third largest school district in Tennessee. KCS
serves 58,000 students.
IA Instructional Assistant. KCS employs IAs across the district to support the work of
teachers and administrators in schools. Many IAs support intervention programs for
struggling students.
ILC Individual Learning Cycle. ILCs are personalized professional development and
support for teachers in collaboration with instructional coaches.
NCE Normal Curve Equivalent. NCEs are the unit of measurement used to refer to
student comparative performance on state assessments in grades 4 – 8. While
percentiles are bunched at the mean under a normal curve, NCEs maintain equal
length intervals.
PLC Professional Learning Communities. PLCs are collaborative planning sessions based
on the model created by Richard and Rebecca DuFour.
REA Department of Research, Evaluation, and Assessment (Knox County Schools).
RLA Reading and Language Arts. RLA is a specific subject assessed by the Tennessee
department of education.
SAT 10 Stanford Achievement Test Series 10 (also known as K – 2 Assessment). The SAT 10
is a norm-referenced assessment utilized in KCS for students in Kindergarten
through grade 2.

8
SMART Specific, Measurable, Attainable, Relevant, and Time-bound goals. SMART goals are
used to monitor performance, specifically with regard to student academic
outcomes.
STEM Science, Technology, Engineering, and Math. STEM programs provide students with
opportunities for cross-curricular instruction, with a focus on practical application.
STEAM STEM plus the Arts. STEAM programs add an arts component to the STEM discipline
to further develop student creativity in design and practical application.
TAP TAP – The System for Teacher and Student Advancement. A school reform model
developed by the National Institute for Excellence in Teaching (NIET), TAP provides
teachers with career advancement opportunities, job-embedded professional
development, and performance-based compensation.
TCAP Tennessee Comprehensive Assessment Program. The TCAP exams are those
administered by the Tennessee Department of Education in grades 3 – 12 to assess
student mastery of the state standards.
TEAM Tennessee Educator Acceleration Model. TEAM is the annual evaluation process for
all school-based certified staff, as required by Tennessee state statute.
TVAAS Tennessee Value-Added Assessment System. TVAAS is a statistical model that seeks
to measure the impact of teachers, schools, and districts on student academic
growth. The Tennessee Department of Education contracts with the SAS Institute
to complete the TVAAS calculations.
WRC Words Read Correctly. AIMSweb uses words read correctly as one part of its
reading curriculum-based measurement assessment. This measure does not
include all words attempted.
WPM Words Per Minute. AIMSweb uses words per minute as one part of its reading
curriculum-based measurement assessment. This measure does include all words
attempted.

9
EXECUTIVE SUMMARY During a time when resources are increasingly scarce, while the
expectations for academic performance continue to rise, it is
imperative for the Knox County Schools (KCS) to understand the
true value of every dollar. As a resource-constrained public
school district, we must ensure that our investments in
strategic initiatives are actually yielding the expected results
and paying dividends to our students, their families, and the
larger community. Thus, in 2012, we embarked on the first
effort to define and measure the educational return on
investment in several key areas.
The Return on Investment (ROI) Report was released in
conjunction with the Board of Education’s budget request for
the fiscal year ending 2013 (FY13). At that time, the KCS
proposed a five-year financial plan that would have ultimately
resulted in a $35 million increase in operational funding above
natural revenue growth. Though the Knox County Commission
did not approve the full proposal, the funding body did agree to
an increase of $7 million annually to support specific
investment areas. These investment areas are the focus of this
report, 2014 Educational Return on Investment – 2012-13
Program Evaluation.
The information and recommendations contained herein rely
primarily on the program evaluation and analysis conducted by
the Department of Research, Evaluation and Assessment in
collaboration with project leaders in the Curriculum and
Instruction area. However, this report also includes analyses
resulting from the Smarter School Spending Initiative sponsored
by the Bill and Melinda Gates Foundation. As one of four
demonstration districts nationwide, this Initiative enabled the
KCS to partner with The Parthenon Group, a leading
management consulting firm, towards the end of completing a
deep analysis of district expenditures to help develop a six-year
strategic finance plan. This work was also supported by
Education Resource Strategies. As such, we were also able to
leverage both qualitative survey data and quantitative student
outcome data from the Smarter School Spending efforts as a
complement to our program evaluation work. Moreover, the
technical assistance of The Parthenon Group contributed to
some of the recommendations highlighted in this report.
10
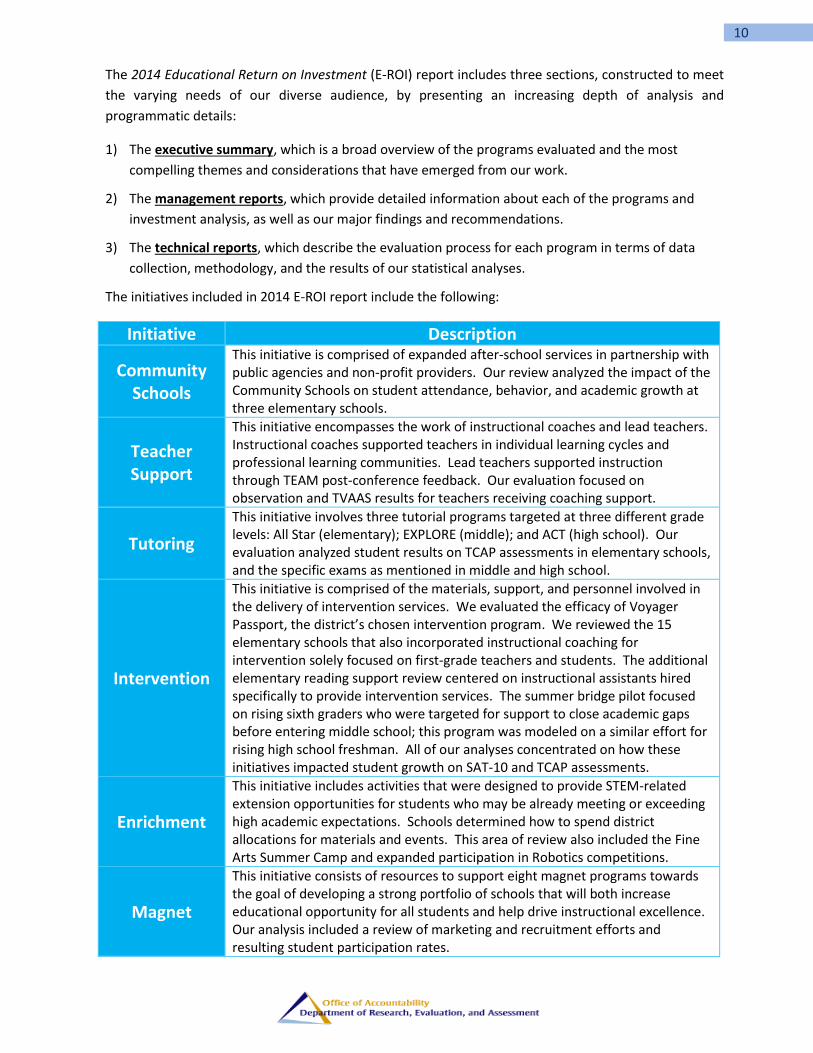
The 2014 Educational Return on Investment (E-ROI) report includes three sections, constructed to meet
the varying needs of our diverse audience, by presenting an increasing depth of analysis and
programmatic details:
1) The executive summary, which is a broad overview of the programs evaluated and the most
compelling themes and considerations that have emerged from our work.
2) The management reports, which provide detailed information about each of the programs and
investment analysis, as well as our major findings and recommendations.
3) The technical reports, which describe the evaluation process for each program in terms of data
collection, methodology, and the results of our statistical analyses.
The initiatives included in 2014 E-ROI report include the following:
Initiative Description
Community Schools
This initiative is comprised of expanded after-school services in partnership with public agencies and non-profit providers. Our review analyzed the impact of the Community Schools on student attendance, behavior, and academic growth at three elementary schools.
Teacher Support
This initiative encompasses the work of instructional coaches and lead teachers. Instructional coaches supported teachers in individual learning cycles and professional learning communities. Lead teachers supported instruction through TEAM post-conference feedback. Our evaluation focused on observation and TVAAS results for teachers receiving coaching support.
Tutoring
This initiative involves three tutorial programs targeted at three different grade levels: All Star (elementary); EXPLORE (middle); and ACT (high school). Our evaluation analyzed student results on TCAP assessments in elementary schools, and the specific exams as mentioned in middle and high school.
Intervention
This initiative is comprised of the materials, support, and personnel involved in the delivery of intervention services. We evaluated the efficacy of Voyager Passport, the district’s chosen intervention program. We reviewed the 15 elementary schools that also incorporated instructional coaching for intervention solely focused on first-grade teachers and students. The additional elementary reading support review centered on instructional assistants hired specifically to provide intervention services. The summer bridge pilot focused on rising sixth graders who were targeted for support to close academic gaps before entering middle school; this program was modeled on a similar effort for rising high school freshman. All of our analyses concentrated on how these initiatives impacted student growth on SAT-10 and TCAP assessments.
Enrichment
This initiative includes activities that were designed to provide STEM-related extension opportunities for students who may be already meeting or exceeding high academic expectations. Schools determined how to spend district allocations for materials and events. This area of review also included the Fine Arts Summer Camp and expanded participation in Robotics competitions.
Magnet
This initiative consists of resources to support eight magnet programs towards the goal of developing a strong portfolio of schools that will both increase educational opportunity for all students and help drive instructional excellence. Our analysis included a review of marketing and recruitment efforts and resulting student participation rates.

11
Several operational themes emerged from our program evaluation and investment analysis that we
believe are the critical attributes for future planning and implementation:
Learning from the “Bright Spots.” Almost without exception, there were school locations or target
populations that greatly outperformed both peers in the program and in comparison control
groups. The district must formalize its effort to build a knowledge base of learning from these
schools. Developing standards of practice derived from successes in our district can greatly
accelerate our ability to scale-up those successes.
o Community Schools – Norwood Elementary students participating in the program experienced
higher academic gains than their peers.
o ILC Support – Based on the change in TVAAS Index over a two-year period, there was evidence
that novice teachers and veteran teachers benefited the most from individual coaching
support, as compared to mid-career educators.
o ACT Tutoring – Halls High School students who received ACT tutoring had an average composite
score 1.5 points higher than their peer group. Furthermore, over 64% of tutored students
earned a composite score of 21 versus 54% of their peer group.
o First Grade Intervention – Dogwood Elementary students who received intervention support
through this initiative exhibited mean growth nearly 10 scale score points more than their
comparison group.
Collaboration and Partnership. The strategic efforts that showed the most promise were those
which enabled deep partnership and collaboration. When community partnerships were engaged
and/or schools had access to dedicated resources with high levels of expertise, students benefited.
o Community Schools and First Grade Intervention – The collaboration between the district, the
Great Schools Partnership, the United Way, and other community organizations enabled quality
service delivery for students and families in both of these initiatives.
o PLC Support – Instructional coaches in TEAM schools helped grade and subject teams achieve
increased results for students. The collaboration of teacher teams with dedicated support from
effective instructional coaches helped drive these results.
Timeliness and Intensity of Supports. The initiatives that had a greater impact on student
academic progress provided on-going support which continued throughout the school year and the
assessment period. Currently, there is a tendency to remove supports after some formative
measures show evidence of student progress. The intensity of support in terms of staffing ratios to
support teachers or students is another barrier to maintaining sufficient effort. Yet, it is clear that
to sustain results and build a strong foundation from which students and teachers continue to
grow, these supports must be sustained for longer periods and at higher levels of intensity.
o EXPLORE Tutoring – Tutoring for the exam was provided to 7th graders during the spring
semester. After summer break, students returned to school to take the exam the following
October. The lag between the support and the exam may have negatively impacted results.
o ILC and PLC Support (Coaching) – The evidence from surveys indicated that at those schools
where the coach-to-teacher ratio was 1:20 or less, teachers reported stronger perceptions of
instructional support. The same was true of teacher perceptions of instructional support at TAP
schools, which have master and mentor teachers in addition to instructional coaches.
o Summer Bridge – This six-week intervention program provided targeted support for students
the summer before their transition to middle or high school. Students were taught exclusively
12
by highly effective teachers with level 5 TVAAS scores. There is early evidence that the program
participants were able to close skill gaps, at rates higher than their peers not enrolled in the
bridge program.
Quality of Data Collection. In our efforts to create a student-centered, data-driven culture, we
must integrate systems to collect high quality data that reflects the work we are performing. We
should not develop onerous reporting mechanisms that distract from our core work. Instead, we
must leverage technology and design processes that allow student results to be recorded
seamlessly in the course of delivering instruction or support.
o Community Schools – The program evaluation for this initiative was limited due to the absence
of data related to parent engagement or participation. Moreover, reliable data on discipline
referrals was also lacking, as is the case in many elementary schools.
o Early Literacy (Voyager Intervention) – Reporting for Voyager requires manual data entry. The
quality of the program evaluation was affected by a lack of information such as the specific
individual delivering the intervention services and the frequency of updates.
Fidelity of Implementation. This issue was highlighted in the 2012 ROI report, and it continues to
be a challenge in this program evaluation cycle. In a large district with 4,500 certified employees
and over 900 instructional assistants, it is difficult to adequately monitor and support strategic
instructional initiatives. The district has resolved to increase resources to schools; however, that
choice has often come at the expense of being able to supply personnel who are able to help
develop capacity and build collective efficacy in school-based staff.
o Additional Elementary Reading Support (Instructional Assistants) – The district was able to hire
instructional assistants (IAs) to deliver reading intervention services. However, teachers and
principals agreed, based on survey responses, that IAs were less effective than teachers in
delivering reading intervention services and student outcome data seemed to validate this
conclusion. There are few resources available to invest in training and oversight to help
instructional assistants improve their capacity to support student learning needs.
o Lead Teachers – Though principals acknowledged the benefit of lead teachers in completing the
evaluation process, in survey responses, classroom teachers did not express full confidence in
the quality of feedback and reliability of the observations that their peers conducted. There is
inadequate support for lead teachers to help them refine and improve their post-conference
coaching skills.
Continuous Improvement and Implementation Progress Monitoring. In order to achieve the high
levels of fidelity noted above, structures and processes must be established to evaluate progress in
real-time. The district should develop “input metrics” that are crafted to help staff determine if an
initiative is proceeding as intended. The monitoring of such information can help implementation
teams make mid-course corrections, as necessary, to ensure optimal outcomes.
o PLC Support – The quality of SMART goals and efficacy of PLC teams varied widely across the
district. Instructional coaches who may have needed more on-site coaching themselves
generally had limited access to content supervisors for such support.
o Early Literacy (Voyager Intervention) – Though we all recognize the importance of intervention
for struggling students, there are few metrics to confirm service delivery as designed or to
determine what adjustments are necessary in real-time. In many cases, this may be a
significant barrier to greater student success in literacy.

13
INTRODUCTION The Department of Research, Evaluation, and Assessment, in the Knox County Schools’ Office of
Accountability, published the inaugural Return on Investment (ROI) Report in 2012. (See Appendix 1:
2012 ROI Report Executive Summary.) The ROI report sought to link the goals of the school district’s
strategic improvement plan to resource allocation. In particular, the
2012 ROI analyzed the following:
1. Current funding sources and allocation practices
2. Expenditures versus student performance outcomes
3. Present return on investment for major district initiatives.
The 2012 ROI report also provided a comparison study of other school
districts with similar demographics but better outcomes. There were
several findings, which centered on the following:
o how funds are spent,
o the funding structure with regard to the Basic Education
Program, the state funding formula, and
o operational themes related to instructional time, student
expectations, teacher support, and data-driven culture.
The 2012 ROI report thoroughly reviewed the KCS funding structure
and the implementation of the strategic plan. As such, this report will
focus more narrowly on program evaluation, with investment analysis
data that details the associated expenditures. The program evaluation
includes those which were specifically funded by an additional $7
million investment in the FY13. (See Appendix 2: $7MM Investment Summary.)
In May 2013, the KCS was selected as one of four demonstration sites for the Smarter School Spending
Initiative sponsored by the Bill & Melinda Gates Foundation. (See Appendix 3: Smarter School Spending
Overview.) As a result of this selection, we were afforded the unique opportunity to receive technical
assistance from The Parthenon Group and Education Resource Strategies (ERS) to review our strategic
resource allocation practices. This work aligned well with our current program evaluation and ROI
efforts, as well as the development of our next five-year strategic plan. The analysis of Parthenon and
ERS largely confirmed that the district’s overall resource allocation was quite modest versus national
benchmark data. Moreover, the largest proportion of those resources is focused on school-based staff,
leaving a central office function that may be under-resourced in reviewing data from comparison
districts. (See Appendix 4: ERS/Parthenon Analysis – Overall Resource Allocation.)
As articulated in Excellence for All Children, the KCS 2009 strategic plan, we strive to advance a student-
centered, data-driven culture:
Data will not be used to punish, but rather Knox County Schools’ personnel will be expected to use data to inform decision-making, to analyze effectiveness, to reflect on educational progress, and to plan for the future. Possessing data is not the end goal, but an important
14
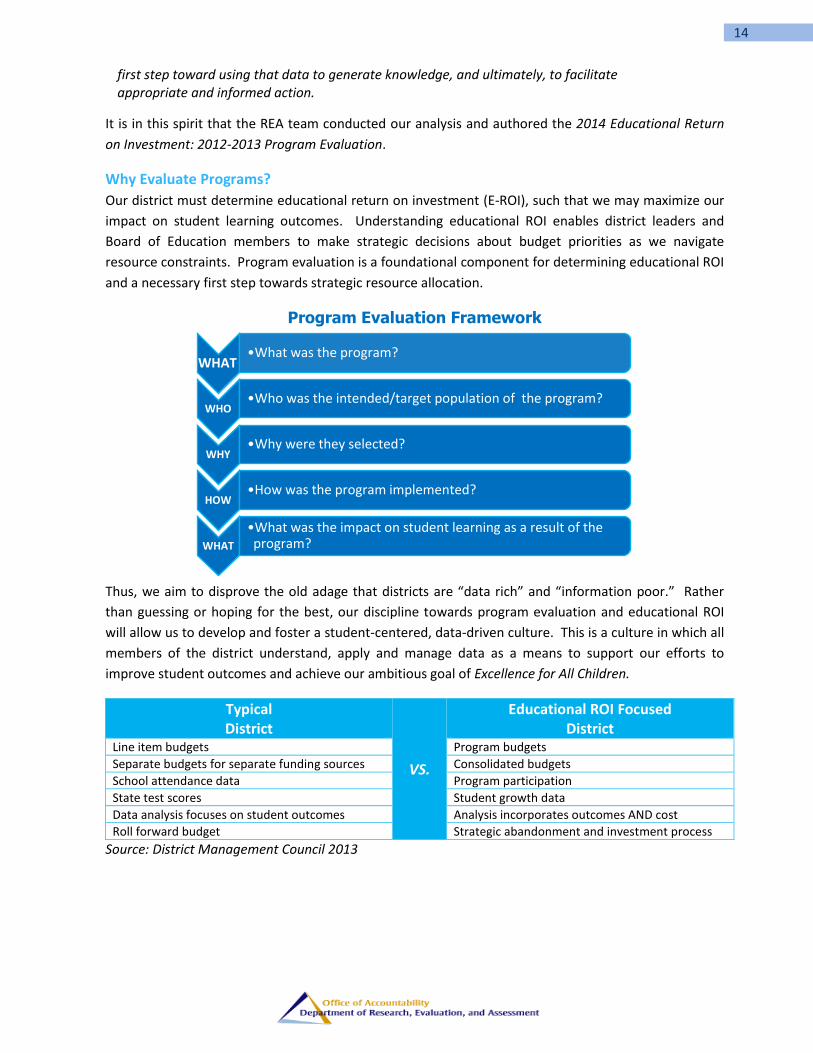
WHAT •What was the program?
WHO •Who was the intended/target population of the program?
WHY •Why were they selected?
HOW •How was the program implemented?
WHAT
•What was the impact on student learning as a result of the program?
first step toward using that data to generate knowledge, and ultimately, to facilitate appropriate and informed action.
It is in this spirit that the REA team conducted our analysis and authored the 2014 Educational Return
on Investment: 2012-2013 Program Evaluation.
Why Evaluate Programs?
Our district must determine educational return on investment (E-ROI), such that we may maximize our
impact on student learning outcomes. Understanding educational ROI enables district leaders and
Board of Education members to make strategic decisions about budget priorities as we navigate
resource constraints. Program evaluation is a foundational component for determining educational ROI
and a necessary first step towards strategic resource allocation.
Program Evaluation Framework
Thus, we aim to disprove the old adage that districts are “data rich” and “information poor.” Rather
than guessing or hoping for the best, our discipline towards program evaluation and educational ROI
will allow us to develop and foster a student-centered, data-driven culture. This is a culture in which all
members of the district understand, apply and manage data as a means to support our efforts to
improve student outcomes and achieve our ambitious goal of Excellence for All Children.
Typical District
VS.
Educational ROI Focused District
Line item budgets Program budgets
Separate budgets for separate funding sources Consolidated budgets
School attendance data Program participation
State test scores Student growth data
Data analysis focuses on student outcomes Analysis incorporates outcomes AND cost
Roll forward budget Strategic abandonment and investment process
Source: District Management Council 2013

15
MANAGEMENT REPORTS The following section contains the Management Reports of each of the programs the REA evaluated.
These Management Reports offer information about the programs, a brief investment analysis, and the
findings and recommendations related to each program evaluation. These management reports are
not technical and do not provide the details of our statistical analysis. Additional data about
methodology or specific results can be found in the Technical Reports.
16
This page intentionally left blank.

17
1. Community Schools
Overview
The Knox County Schools launched the community school concept at Pond Gap Elementary school in
2011. That project was overseen through a partnership between the school and the College of
Education at the University of Tennessee, which also provided funding. In 2012, the concept was
expanded to three additional schools: Green Magnet Elementary, Lonsdale Elementary, and Norwood
Elementary. The program evaluation was limited to these three expansion schools.
Community Schools is a strategy that aligns schools and community resources to provide services that
meet the social, physical, cognitive, and economic needs of both students and their families. In
particular, it provides enhanced learning opportunities for students and their families via tutoring and
mentoring; family engagement activities; health, mental and social services; and early childhood
development. This strategy also helps increase cooperation between schools and partners, as well as
between teachers and parents. It is one component of Goal 3, “Engaged Parents and Community,” in
the KCS five-year strategic plan, Excellence for All Children, adopted in 2009.
The short-term benefits of a successful Community School include prepared and school-ready children
with consistent attendance, engaged families, increased family access to health and social services, and
an overall enhanced school environment.

18
The objectives of the program include:
Delivering additional resources to students and their families to promote social-emotional health
Providing extended learning opportunities for students and families
Fostering positive attitudes about school as a strategy for raising achievement
Building capacity for continued partnerships with the community in improving the overall academic success of students (i.e. students graduate ready for college, careers, and productive citizenship)
Developing relationships between schools, families and partners of the community in supporting education
Community Schools provide services for students that extend beyond the traditional school scope. The
program aims to strengthen family and school relations with these targeted, comprehensive services.
The community partners provide support to parents and students at the school site to enhance the
overall community well-being. The activities available to students and their families are open to the
entire school. They include academic and social programs, as well as access to off-site services within
the community. The school-based activities include, but are not limited to, the following:
Student Services Family Services and Classes
Academic tutoring
Mentoring
Enrichment classes
Dinner served nightly
Finance courses
Résumé-writing and interview skills courses
Computer skills courses
GED and ELL (English Language Learners) courses
These agencies highlighted below were the primary partners to support the three new community
school programs.
School Community Partner Agency
Green Magnet YMCA
Lonsdale Elementary Project GRAD
Norwood Elementary Great Schools Partnership
In addition, medical, dental, and mental health providers offered their services. Fine arts organizations,
church and religious organizations, and the University of Tennessee have also provided support to the
Community Schools program.
Investment Analysis
We originally budgeted $500,000 from general purpose funds to spend on Community Schools in fiscal
year (FY) 2013. These funds were to provide after-school services, as well as support a resource
coordinator to oversee the project. The actual expenditures were about 27% of the overall budget.
The project leaders determined that it was not necessary to hire a coordinator immediately, as there
was some capacity within the schools and in the Student Support Services department to oversee the
programs at four schools in FY2013. Moreover, because of supplemental funding from existing
resources, the expansion effort only relied upon a portion of the general purpose funding allocated.

19
The student count includes only those students deemed “high-risk” for the purposes of the program
evaluation. There were, however, students informally participating in various Community Schools
activities at these three locations beyond those highlighted in the evaluation.
Initiative FY13 Budget
FY13 Actual Expenditures
# of High Risk Students
Cost Per Student Other
Early Literacy
Expansion to 3 schools $435,000 $ - $133,486 243 $549
Resource Coordinator $65,000 $ - $ - 0 $ -
COMMUNITY SCHOOLS $500,000 $ - $133,486 243 $549
Findings
When the program was developed, the following progress indicators were identified as ways to assess
effectiveness: (a) student attendance; (b) discipline referrals; (c) academic achievement and growth;
and (d) parental engagement.
While we were able to collect data on the first three indicators, parental participation records were not
gathered or reported uniformly amongst the three schools. With regard to discipline referrals, each
participating school recorded incidents differently. Lonsdale Elementary preferred in-house records for
certain types of disciplinary actions, while Green Magnet and Norwood Elementary uploaded all of their
discipline data to the electronic student information system (to which the REA has access). So, there is
a clear data limitation with regard to comparing the data across schools. Thus, our evaluation focused
primarily on attendance and student performance.
While the entire school was engaged in some Community Schools activities, we have followed 246
students at the three schools who actively participated in the after-school programs throughout the
year and were evaluated in the interim reports. We will be considering these same students for this
report. We designated these 246 as “high-risk” students and their peers as “non-high-risk” students.
We evaluated the effect of the Community Schools program by comparing the performance of these
two categories of students. We had baseline attendance data for almost 80% of the high-risk students.
We had two years of academic data for approximately 144 students, such that we could use the
academic growth information to evaluate the program impact on those students.
Our general findings are as follows:
1) There was no significant difference in absences or discipline referrals between the high-risk and
non-high-risk students.
2) Regarding attendance rates, Green Magnet had the most improvement in its high-risk students
among the three schools.
a. It should be noted that the differences in attendance between the high-risk and the
non-high-risk groups may be due in part to a selection bias.

20
3) The high-risk students performed better in the reading/language arts and math sections of the
TCAP overall, with variations within the three schools.
4) Regarding academic growth, Norwood Elementary had the most improvement in its high-risk
students of the three schools.
5) If we applied grades to changes in NCEs, they would be as follows:
Community School Student?
No (Non-High-Risk)
Yes (High-Risk)
RLA Math
RLA Math
Green Elementary B D F A
Lonsdale Elementary D A A B
Norwood Elementary B A A A
Total C A B A
Recommendations
Moving forward, it will be important to continue monitoring this program, as many of the benefits to
the school community, students, and their families will accumulate over the longer term.
In addition to those outcome-related recommendations, the REA also supports evaluative changes to
the Community Schools program as well.
1) Develop a standard method to collect data on parent and family engagement in the Community
School activities to help assess whether outreach and participation in the program is effective.
2) Request or require schools to upload their disciplinary referrals to the student information
system in a standard fashion to yield data that is easily accessible and comparable.
3) Conduct qualitative follow-up at the schools, such as a formal program review, to ascertain
implementation specifics and nuances. This is particularly important to complete at schools
that performed better than their peer group, in order that we might be able to replicate what is
working well at those schools.
4) Develop additional program indicators with school stakeholders and the community partners to
enhance the overall evaluation of the Community Schools program.

21
2. Teacher Support
Introduction
In an effort to develop and retain “Effective Educators,” as articulated in Goal 2 of the KCS strategic
plan, both instructional coaches and lead teachers are roles designed to offer teachers professional
support. The management reports that follow are organized based on three elements of support: (1)
individual learning cycle (ILC) support and (2) professional learning communities (PLC) support, both
delivered by instructional coaches, and (3) lead teacher support. In the 2012-13 school year, there
were 136 Instructional Coaches and 226 Lead Teachers working in schools across the district.
The Knox County Schools’ instructional coaching model was modified and re-launched in the 2012-13
school year based on peer-reviewed research which shows that job-embedded professional
development has a significant impact on teaching and learning. In previous years, coaches were often
tasked with items that were not necessarily “coaching” in nature, like coordinating textbook orders,
budgeting, or performing administrative duties. The coaching model was revamped in an effort to
focus coaches on instructionally related activities, such as conducting small group student interventions
or helping teachers with the instructional shifts required to teach the Common Core State Standards.
The vast majority of coaches specialize in either literacy or numeracy, with two system-wide coaches to
support science and social studies. Coaches facilitate PLCs and ILCs, provide support to school
administrators and teachers, and attend monthly Coaches Network professional development
workshops. The coaches are supervised through the Professional Development office, and principals of
the schools to which they are assigned contribute to their evaluation as well.

22
The following graphic provides a visual summary of the KCS coaching model:
Source: KCS Coaching Model as depicted by The Parthenon Group 2013
The Lead Teacher role was introduced in 2011 to help provide a new formal teacher leadership
opportunity while supporting the TEAM evaluation process. Lead teachers provide instructional
support to their peer teachers primarily through the feedback they give during observation post-
conferences.
Investment Analysis
A few adjustments were made to the teacher support budget to ensure the most efficient use of
funding:
Based on the requests from schools for 105 additional lead teachers in FY2013 above and
beyond the 126 positions funded in FY2012, the Lead Teacher line item was decreased from
$630,000 to $426,000.
In addition, the Lead Teacher Pilot targeted for elementary schools was not logistically feasible
using part-time teachers, based on feedback from elementary principals. Thus, the $496,000
budget was redistributed to fund coaching positions.
In total, $700,000 was reallocated to the instructional coaching line item. This increase funded
10 additional positions:

23
o Six instructional coaches including one elementary generalist, one middle school gifted
and talented (GT) coach, two secondary literacy coaches, and two secondary numeracy
coaches.
o The remaining four positions were filled as one master teacher and three district lead
teachers, who supported lead teachers system-wide.
Thus, 105 additional lead teacher positions and 35 additional coaching positions were funded in these
line items. Of the 35 positions, 20 coaches were focused on elementary (early literacy).
Overall, the spending for teacher support was approximately 93% of the budgeted amount. The actual
expenditures for lead teachers was less than budgeted, as 126 lead teacher supplements were paid
from the Innovation Acceleration Fund, a state grant, in FY2013. The lead teacher expenditures include
only the $2,500 supplement and resulting payroll taxes paid from the general operating fund.
All instructional coaching positions were hired as budgeted and paid for from the general operating
fund. It should be noted that this represents only a portion of the 134 instructional coaches in the
district. The overall funding allocated towards instructional coaching in FY2013 was approximately $6.0
million, with the balance of coaches funded via federal programs including, Title I, Title II, and Title III.
There were also coaches funded via the district’s Race to the Top state allocation. Only about 40% of
instructional coaching expenditures are from general purpose funds.
The cost for teacher support is represented as a “per teacher” expenditure since the staffing ratios are
typically driven by the number of teachers or certified staff at the location versus student counts. In the
case of coaches, they were typically allocated per school and program, which is why the range of coach
to teacher ratio spanned from 1:9 to 1:200. The number of teachers supported by lead teachers
represents all teachers in TEAM schools only. Instructional coaching supports teachers in all 89 schools
in the district.
Note: Our program evaluation did not include $500,000 allocated to Professional Development and
$350,000 allocated to High School Position restoration, both of which were included in the original $7
million budget.
Initiative FY13 Budget FY13 Actual
Expenditures # of
Teachers Cost per Teacher
Other Early Literacy
Lead Teachers $426,000 $ - $224,174 3,468 $65
Instructional Coaches $1,035,000 $1,540,000 $2,566,922 4,370 $649
TEACHER SUPPORT $1,461,000 $1,540,000 $2,791,096 4,370 $714

24
2.2 ILC Overview Instructional coaches are deployed throughout the district to provide school-based professional
development for KCS teachers. One of the key components of this service to teachers is individual
learning cycles – ILCs. An ILC is an intensive, one-on-one coaching experience that is designed to
provide targeted, differentiated support to individual teachers. ILCs are meant to address the
“refinement areas” for teachers as identified under the TEAM rubric. ILCs also provide classroom
support and debriefs.
The goal of ILCs is to improve the quality of teaching to increase student learning and thus, student
performance. ILCs are implemented with individual teachers and are aligned to a specific focus area.
Peer-reviewed research shows that individuals learn more when they are enabled to study a specific
topic over time—which is why there is a single focus for ILCs. The participating teacher’s focus area
may be identified by the teacher, the principal, the instructional coach, and/or collectively through
multiple data sources, such as student achievement or TEAM data. The goal is to support teachers
through a partnership between the coach and the teacher. ILCs facilitate teacher growth and
development in conjunction with both the TEAM and TAP evaluation systems.
The ILC process begins with the teacher and coach collaborating to develop an ILC plan. The coach
provides support and feedback to the teacher during the plan implementation over a six-to-nine week
cycle. The ILCs are coordinated with the teacher’s formal observation process, such that teachers
typically receive this support prior to beginning the evaluation process. In turn, the teacher should be
able to demonstrate growth on the TEAM observation rubric.
Findings
In order to evaluate the effect of ILCs on teacher performance, we reviewed TEAM and TAP observation
scores and TVAAS results. In particular, we wanted to determine if observation scores improved if a
teacher participated in multiple ILCs. Additionally, we wanted to determine if there was a difference in
student outcomes due to ILC participation. We created a control group of teachers with similar years of
service, prior observation results, and TVAAS indices to compare to the treatment group (those
teachers who were in ILCs). There were 226 teachers each in both the control and treatment groups.
1) The control group, which did not participate in ILCs, improved their observation scores at a
faster rate than those in the treatment group that did participate in ILCs. Teachers enrolled in
three ILCs, on average, scored below their school’s average observation score.

25
2) However, teachers who participated in ILCs, increased their mean change in TVAAS index from
2011-2012 to 2012-2013 as compared to the control group. (See Appendix 5: Parthenon
Analysis – Instructional Coaching.)
3) Based on Parthenon analysis, teachers with less than 3 years of experience and teachers with
greater than 15 years of experience seemed to benefit the most from participation in ILCs. It
should be noted that we could not control for years of service and prior TVAAS index
concurrently, due to extremely small sample sizes. The results below do not include controlling
for prior TVAAS performance, only years of service.
Source: The Parthenon Group 2013
0
10
20
30
40
50
60
70
80
-1.0 -0.7 -0.3 0.0 0.3 0.7 1.0 1.3 1.7
Nu
mb
er
of
Teac
he
rs
Change in Observation Score
Treatment and Crontrol Groups - Change in Observation Scores 2011-2013
Treatment
Control

26
Note: Analysis includes TVAAS index for Math and ELA only; Years of experience are based on original hire date in
the district. (Source: The Parthenon Group analysis)
In addition to the REA analysis, both qualitative survey and quantitative outcome analysis (as noted
above) were conducted by Parthenon. (See Appendix 5: Parthenon Analysis – Instructional Coaching.)
4) Survey data indicated that implementation of ILCs was largely compliant with district
guidelines, in terms of duration and contact between the teacher and the coach. Sixty percent
of teachers reported meeting with their coach weekly.
5) Survey data indicated that ILC coaching was rated lower on quality measures. Less than 30% of
teachers reported that ILC coaches completed a formative assessment or created a plan for
continued learning.
6) Survey data shows that over 40% of teachers who participated in ILCs or coach-led PLCs
indicated that the coaching support they received had a meaningful impact on their
professional practice.
Though the analysis of the teacher effect outcome data was not always statistically significant, there is
some evidence that teachers in the treatment group fared better than the control group. This suggests
that teachers are learning and benefitting from ILCs.
Recommendations
While it appears that some gains were made as a result of ILC participation, all the results are not
conclusive as they were not statistically significant. Learning from these findings, there are several
considerations for the coaching model as it relates to ILCs:
1) It may be that the type of support provided to teachers should be diversified—since
participation in multiple individual learning cycles seemed to correlate to a continuing decline
in observation scores. However, it may be that those teachers in multiple cycles are also those
who struggle the most.
2) The district may wish to consider targeting ILC support towards less experienced and very
seasoned teachers, as they seemed to benefit the most. Some other type of support may need
to be designed to support teachers who are mid-career, such as peer-mentoring or direct
support of administrators.
3) Continued analysis of outcome data will be necessary to assess the true impact of ILCs and
garner more conclusive results.
4) Creating and using qualitative metrics of success and program indicators, particularly teacher
perception measures, may help provide a broader evaluation of the ILC as a treatment
program.
5) An analysis of how a teacher is referred to an ILC (self-selected versus principal-recommended)
may yield additional information about the effectiveness of ILCs.
6) Survey data from coaches indicates that they need more support and training around working
with low-performing teachers and leading ILCs. This may include Cognitive Coaching™
strategies and other methods of supporting reflective practice.

27
2.3 PLC Overview One of the major components of the instructional coaching model is to
help facilitate and lead professional learning communities (PLCs). PLCs
are an opportunity for teachers to collaborate, engage in job-embedded
learning based on state standards, and monitor student progress. PLCs
are part of the continuous instructional improvement cycle represented
by the adjacent graphic.
In order to maximize relevance and utility, the participants of a PLC are
often grouped based on the grade or subject area they teach. PLCs
support teachers with Common Core, literacy instruction, curriculum
content, and TEAM.
PLC cycles provide a six-to-nine week focus in a specific content area to maximize shared knowledge,
resources, and skills. They are led by coaches as well as school-level staff. Coaches are charged to help
develop teacher capacity to lead PLCs. As such teachers may further develop leadership skills and
master the content through their preparation for the sessions.
Generally, the process within a PLC cycle is to create a nine-week instructional plan, implement the
plan, analyze the results (student assessment results, for example), and to adjust instruction based on
those results. One feature of the coaching model—and an element of our PLC program evaluation—is
SMART goals. SMART goals are specific, measurable, attainable, relevant, and time-bound student
learning goals that are used to promote increased academic performance. Setting SMART goals helps
teachers and coaches create and implement focused PLC cycles. (See Appendix 6: PLC SMART Goal
Examples.)
Findings
We used the self-reported SMART goal outcomes to link the impact of coach-led PLC cycles on student
performance. Additionally, we reviewed the TVAAS performance of the grade and/or subject
combination of the PLC team. The PLC SMART goals were reported by individual schools, grade levels,
and content area (math, science, etc.). Thus, we were able to identify the corresponding 2012-2013
TVAAS growth index by grade level and subject area as a performance measure. Though both TEAM
and TAP schools conducted PLC cycles, TAP schools also completed “cluster” sessions above and
beyond the PLC work. As we will discuss, this additional cluster work in TAP schools may have impacted
the results of the comparisons between coach-led PLC teams and those that had no coaching support.
(See Appendix 5: Parthenon Analysis – Instructional Coaching.)
There were over 900 SMART goals developed and reported over the 2012-13 school year but not all of
them had complete data, particularly as to whether the goal was attained or still in progress. Thus, the
REA evaluation included approximately 600 SMART goals with complete data compiled from 72 schools,
containing roughly 70% of the data from TEAM schools.
There was great variability in the SMART goals, both in terms of the goal content and the assessment
method of attaining each goal. The rigor of the SMART goals also varied widely across the district, as

28
some seemed to set very high expectations for student performance while others were less challenging.
Some goals were written very narrowly while others were broad.
There were several notable findings of our program evaluation:
1) While the average TVAAS growth index for the schools that met their SMART goals was higher
than schools that did not meet their goals, the difference was not statistically significant. See
the chart below.
a. When comparing SMART goal attainment, TEAM schools that achieved a higher
percentage of their SMART goals also had a higher TVAAS growth index.
2) The measureable impact of coach-led PLC cycles on teacher effectiveness was inconclusive,
particularly when controlling for starting performance levels of the PLC teams and focusing on math and English.
a. In TEAM schools, PLCs led by a coach exhibited greater TVAAS index gains than PLCs not
led by a coach, but the difference is not statistically significant.
b. Controlling for starting performance level, coaching support appears to have the
greatest impact on Level 1 PLC groups, though the result is not statistically significant.
3) Survey data indicated that implementation was largely compliant with district guidelines,
though overall the implementation was mixed.
a. Seventy-five percent of teachers surveyed reported meeting with their PLC coach at
least every other week.
b. The typical length of a PLC cycle is six weeks, though it could go up to nine weeks
depending on the content area, coach, or school.
4) Survey data also showed that there was some concern about the quality of PLCs. Teachers
reported a lack of alignment between the support coaches provided and the TEAM/TAP
observation process.
5) Survey data indicated that principals’ perceptions of PLC cycles were positive, particularly in
comparison to ILCs.
0
0.1
0.2
0.3
0.4
0.5
0.6
0.7
Yes No
Me
an T
VA
AS
Gro
wth
Ind
ex
SMART Goal Achieved?
Mean TVAAS Growth Index by SMART Goal Attainment
29
Recommendations
Based on our findings, there are several recommendations and considerations related to PLCs and
SMART goals:
1) The wide variation in SMART goal quality, content, and rigor indicates a need for additional
support for coaches around SMART goal development and purpose.
2) The record-keeping process for SMART goals did result in a sizable amount of missing data. For
improved program evaluation, the district needs to improve this data collection process.
Canvas, the new learning management system, may be a more effective tracking method.
3) The data collection process after PLCs have been conducted should also include a list of the
teachers who participated in the PLC cycle and how long it lasted.
Survey data gathered by the Parthenon Group resulted in additional recommendations to improve the implementation of the coaching model:
4) The overall quality and impact of PLCs based upon teacher perception indicates inconsistent
implementation across the district. Continued monitoring and support toward helping teachers
and coaches understand PLC process is a must.
5) The district should increase the overall level of support and feedback provided to coaches from
the central office supervisors as noted above.
6) To improve the impact on teacher practice, the district should create stronger linkages between
coaching support and the TEAM observation process. This closer connection between
observation and coaching support seems to lead to more favorable results and teacher
perception in TAP schools. (See Appendix 8: Parthenon Analysis – Instructional TAP Model.)
7) As noted above, coach-led PLCs in TAP schools did not outperform PLC teams that were not
supported by a coach. This may be an indication that the “cluster” meetings in TAP schools are
an effective support mechanism even in the absence of coaches. The district should consider
the role of coaches in TAP towards their highest and best use.
8) Currently, coach-to-teacher ratios range from 1:9 to 1:200. Teacher survey data indicates
stronger perceptions of coaching impacts when coaching ratios were 1:20 or smaller. The
district needs to ensure that coaches have sufficient time to dedicate to the highest impact
activities by increasing the density of coaches, thereby improving the coach to teacher ratio.
30
2.4 Lead Teacher Overview Lead teachers maintain classroom teaching duties while they work with administrators to conduct
formal TEAM observations. As such, they must participate in all required evaluation training and must
pass the assessment to become certified TEAM observers. Principals may also engage Lead teachers to
facilitate and lead PLC sessions to support the use of research-based teaching and learning strategies.
Lead teachers may carry a full or reduced course load to make time for additional observation duties.
Most lead teachers complete 10 – 15 observations annually, using their planning periods and/or
substitute teachers to backfill their classes to complete the process.
Lead teachers deliver instructional support and coaching to peers through classroom observations
within the TEAM framework. Thus, they must demonstrate teaching effectiveness and leadership
abilities. Some principals also include lead teachers in other instructional leadership tasks, such as
planning and leading staff development, especially pertaining to the TEAM rubric.
In summary, lead teachers help improve classroom teaching by observing, coaching, and evaluating
teacher performance using the TEAM instructional rubric. To that end, lead teachers conduct pre and
post- observation conferences with teachers to provide specific and actionable feedback. In so doing,
they assist teachers in using student work to identify student learning trends, monitor and modify
instruction, and increase student achievement.
Findings
There were 226 lead teachers in the district during the 2012-13 school year. Over half of the lead
teachers were in elementary schools, while the remaining half was split between middle (20%) and high
schools (30%). In 2012-2013, the lead teachers completed 35% of all observations conducted in the
district (excluding TAP schools). In some schools, between 50-75% of observations were conducted by
lead teachers, with Mooreland Heights Elementary school having the greatest proportion at 75%.
(Please note that at Mooreland Heights the Arts360 coordinator was also a lead teacher, and, as such,
completed more observations than typical at other schools.) The schools in the district, generally, are
in compliance with state and district guidelines for conducting the observation process.
The following findings come from the REA analysis as well as results of the Parthenon evaluation of lead
teachers. (See Appendix 7: Parthenon Analysis – Lead Teachers and TEAM Evaluation.)
1) There was a notable discrepancy between principal and teacher perceptions of the observation
rubric and process, which may account for some of the implementation challenges indicated.
a. Teacher survey data indicated that the quality of feedback provided through the TEAM
post-conferences was mixed.
i. Survey data from teachers showed that lead teachers were perceived to be
somewhat less effective in conducting the observation process.
b. Eighty-one percent of principals indicated that the observation rubric and process is a
valuable tool for impacting teacher effectiveness, though only 20% of teachers felt that
the observation process had a meaningful impact on their professional growth.
2) Implementation of the observation process varied across the district in terms of inter-rater
reliability and quality of feedback.
31
3) There is a small, statistically significant relationship between schools that implemented TEAM
with greater fidelity (as measured by the distribution of individual indicator scoring and outlier
data) and the TVAAS index gains demonstrated by teachers at those schools.
Recommendations
Lead teachers clearly helped the district meet the demands of the annual teacher evaluation process.
The perception data from principals suggested this was a good thing; while teachers did not feel as
strongly about the quality of the feedback provided by lead teachers.
There are a few key things we can glean from this analysis:
1) Increasing inter-rater reliability must continue to be a goal within the observation process. The
district should explore if this may be achieved through replicating structures found in TAP
schools, such as weekly calibration sessions including all observers, and regular review of
observation trends. (See Appendix 8: Parthenon Analysis – TAP Model.)
2) Ensuring lead teachers are properly trained and certified in the TEAM system is necessary and
should be done before the formal evaluation process begins. The district might also consider
introducing a “mid-year” TEAM certification refresher.
3) The district should continue to emphasize the post-conference feedback process and provide
additional training and support to improve the quality of the feedback that lead teachers offer
to their peers.
4) Administrators should clearly communicate the importance of the observation process towards
improving teacher practice and work to bridge the gap between the intended outcomes of lead
teacher support and the perceptions of classroom teachers at their schools.
5) To improve teacher perceptions, schools should provide on-going building-level support to
teachers help them understand the TEAM rubric, including detailed review sessions and
implementation workshops at the start of and throughout every school year.

32
3. Tutoring
Introduction
Providing more instructional time stems from Goal 1, “Focus on the Student,” in the KCS five-year
strategic plan. In an effort to improve student achievement, additional academic support was offered
to students below a certain performance
threshold. Additionally, the previous
Return on Investment report found that
time matters: the amount of time students
are meaningfully engaged in learning is
directly proportional to academic
outcomes. Therefore, extended learning
opportunities were made available to
struggling students.
The elementary tutoring program was
called All Star Tutoring; tutoring at the
middle school level was focused on the
EXPLORE exam; and ACT Tutoring was
offered at the high school level. The following reports detail the structure and results of each of these
tutoring programs.
Investment Analysis
The tutoring programs were budgeted to include both stipends for the teachers as well as
transportation for students who stayed after school to receive these services. In total, the actual
expenditures were approximately 75% of the budgeted amount. The variance is primarily related to
lower transportation costs than anticipated, as some students were able to secure rides home by
means other than district-provided buses.
The number of students served reflects those we included in the program evaluation. This represents
actual student participation as reported by the project leaders.
Initiative
FY13 Budget FY13 Actual
Expenditures
# of
Students
Cost Per
Student Other Early
Literacy
All-Star Tutoring (Elementary Schools) $ 311,113 $ - $ 239,191 860 $ 278
EXPLORE Tutoring (Middle Schools) $ 120,187 $ - $ 88,540 283 $ 313
ACT Tutoring (High Schools) $ 68,700 $ - $ 40,700 307 $ 133
MORE INSTRUCTIONAL TIME $ 500,000 $ - $ 368,431 1,450 $ 254
33
3.2 All Star Overview All Star Tutoring is an after-school program for students in grades 3 through 5 conducted by certified
teachers. Knox County Schools implemented the All-Star after-school tutoring program in 2012-2013 in
an effort to improve student performance as measured by elementary TCAP results. Twenty-two
schools participated in the program, listed in the table below. The tutoring program began in October
2012 for all of the participating schools except Green Magnet, Norwood, Pond Gap, and Sarah Moore
Green—those schools began their program in November. The tutoring program ended in March 2013.
All Star Tutoring: Participating Schools (Elementary) Adrian Burnett Halls
Amherst Lonsdale
Ball Camp Maynard
Bearden New Hopewell
Beaumont Norwood
Belle Morris Pond Gap
Brickey-McCloud Powell
Christenberry Ritta
Copper Ridge Sarah Moore Greene
East Knox Sterchi
Green Magnet West Hills
This program offered 25-minute tutoring sessions twice a week for 21 weeks. Students were provided
an additional 1.5 hours of instruction in both reading and math.
Findings
The All Star tutoring program was designed to increase and promote student growth and achievement.
School teams were able to use their own discretion in selecting students to enroll in the tutoring
program. As such, we were not able to identify a set of common criteria driving student enrollment in
the tutoring program.
In order to see how well students responded to the tutoring, math and reading results were analyzed
separately. The analysis was also extended to the school level in an attempt to pinpoint localized
successes. Enrollment varied by month, with the average monthly enrollment at 860 students. The
highest month of enrollment was over 900 students, while the lowest month had 753 students. Of
those almost 900 students, we had two years of TCAP data for 633 students in grades 4 and 5 to analyze
for the program evaluation.
We created a control group from a pool of randomly selected students at the participating schools who
had the same levels of success on their 2011-2012 TCAP assessments (as measured by NCEs) as the
tutored students. NCE scores essentially place students along an equal-interval scale. The outcome
indicator for the analysis was the 2012-2013 TCAP exam score, which is scaled from the percent of
correct responses on the TCAP assessment.
34
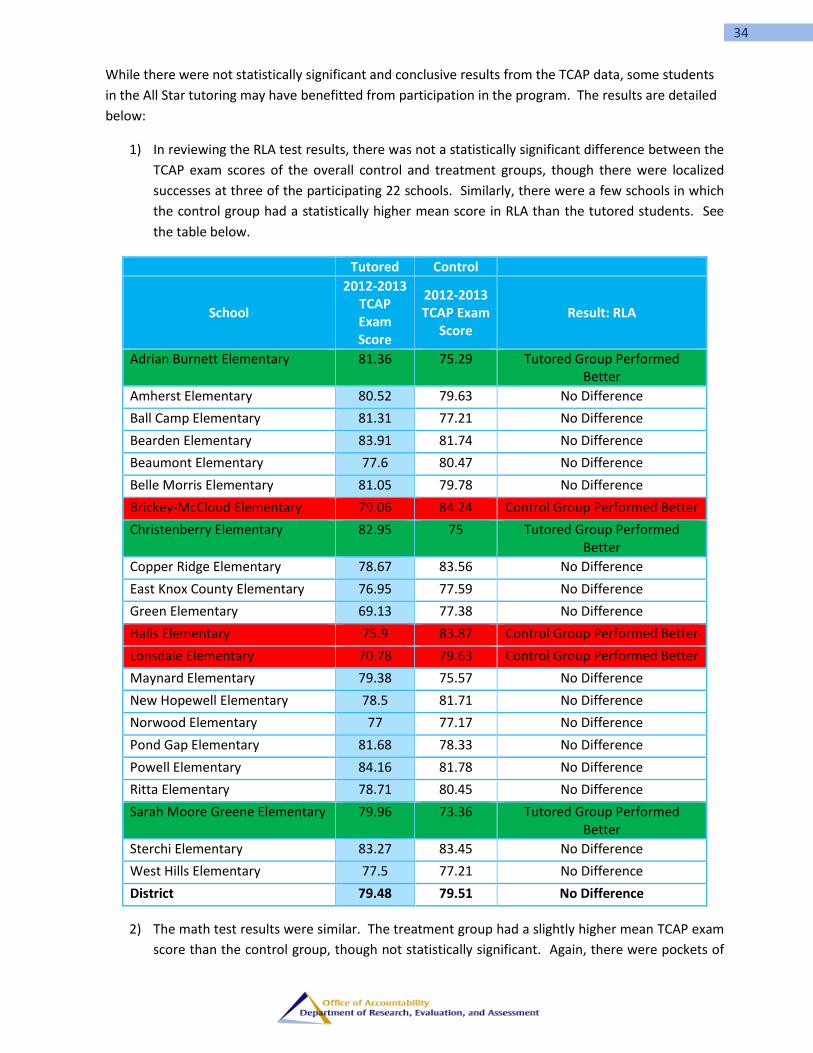
While there were not statistically significant and conclusive results from the TCAP data, some students
in the All Star tutoring may have benefitted from participation in the program. The results are detailed
below:
1) In reviewing the RLA test results, there was not a statistically significant difference between the
TCAP exam scores of the overall control and treatment groups, though there were localized
successes at three of the participating 22 schools. Similarly, there were a few schools in which
the control group had a statistically higher mean score in RLA than the tutored students. See
the table below.
Tutored Control
School
2012-2013 TCAP Exam Score
2012-2013 TCAP Exam
Score Result: RLA
Adrian Burnett Elementary 81.36 75.29 Tutored Group Performed Better
Amherst Elementary 80.52 79.63 No Difference
Ball Camp Elementary 81.31 77.21 No Difference
Bearden Elementary 83.91 81.74 No Difference
Beaumont Elementary 77.6 80.47 No Difference
Belle Morris Elementary 81.05 79.78 No Difference
Brickey-McCloud Elementary 79.06 84.24 Control Group Performed Better
Christenberry Elementary 82.95 75 Tutored Group Performed Better
Copper Ridge Elementary 78.67 83.56 No Difference
East Knox County Elementary 76.95 77.59 No Difference
Green Elementary 69.13 77.38 No Difference
Halls Elementary 75.9 83.87 Control Group Performed Better
Lonsdale Elementary 70.78 79.63 Control Group Performed Better
Maynard Elementary 79.38 75.57 No Difference
New Hopewell Elementary 78.5 81.71 No Difference
Norwood Elementary 77 77.17 No Difference
Pond Gap Elementary 81.68 78.33 No Difference
Powell Elementary 84.16 81.78 No Difference
Ritta Elementary 78.71 80.45 No Difference
Sarah Moore Greene Elementary 79.96 73.36 Tutored Group Performed Better
Sterchi Elementary 83.27 83.45 No Difference
West Hills Elementary 77.5 77.21 No Difference
District 79.48 79.51 No Difference
2) The math test results were similar. The treatment group had a slightly higher mean TCAP exam
score than the control group, though not statistically significant. Again, there were pockets of

35
success at certain schools, as well as a few schools where the control group outperformed the
treatment group.
a. Lower performing students who participated in the treatment generally performed
better than students who were not enrolled (in terms of TCAP exam score). However,
at the higher end of the student-performance spectrum, students who did not
participate in the tutoring program out-performed their tutored peers.
3) All Star tutoring support did not lead to statistically significant increases in mean student TCAP
exam scores as measured by the fourth and fifth grade TCAP, although there were pockets of
success at individual schools within the program.
a. The individual schools in which the tutored group performed better than the control
group based on RLA TCAP exam scores were Adrian Burnett, Christenberry, and Sarah
Moore Greene Elementary schools.
b. The individual schools in which the tutored group performed better than the control
group based on Math TCAP exam scores were Adrian Burnett, Powell Elementary, and
Sarah Moore Greene Elementary Schools.
Ultimately, the All Star program, as implemented, had pockets of success in individual schools despite
the absence of statistically significant increases in mean student TCAP exam scores.
Recommendations
Though the academic outcomes resulting from All Star tutoring program were not universally
compelling, there were some success stories. The district’s ability to learn more about the
characteristics of the successful schools will be important to adjust the program moving forward. Thus,
our recommendations towards this end are as follows:
1) Qualitative follow-up on implementation and strategies is necessary to gain insight on how and
why the program worked better in the schools that excelled or worse in those schools where
non-tutored students out-performed those in tutoring. The project leader contributed
additional reflections about the program and its implementation.
a. Most sites used the proposed three-rotation structure throughout the program (25
minutes each for reading, math, and technology). The challenge with the rotation
structure was that some students needed more time with reading instead of math or
vice versa and it was difficult to provide that extra help.
b. Schools may need to find ways to leverage technology to supplement rotation
schedules for students who only need support in one particular subject.
c. Tutors may benefit from additional training to increase service alignment with Common
Core and PARCC expectations in both reading and math.
2) Schools may need to consider targeting a specific group of students for tutoring. The positive
learning impact was not maintained for students performing at an incoming NCE level higher
than approximately 55. Thus, these higher performing students may not benefit from the
tutoring programs.
3) Our analysis did not control for differences in the quality of instruction in the tutoring sessions
themselves. Schools should seek to reserve the tutoring roles for the most highly effective
teachers.

36
4) Community agencies provide tutoring for a subset of students at some schools included in this
analysis. Future program evaluations should include an examination of the potential effects of
these community-based tutoring programs in comparison to the district efforts.
5) Developing metrics of success with school administrators and content supervisors may help
shape the direction of the program in terms of implementation and evaluation. Given the
limited outcome data available to the REA, having additional sources of data would be useful
for future program evaluations.
3.3 EXPLORE Overview Preparing students for college and careers starts well before high school. One of the ways the Knox
County Schools gauges student college and career-readiness is the EXPLORE exam, which is
administered to eighth grade students. EXPLORE is a national assessment based on content areas of
high school and post-secondary education, including English, math, reading, and science. These subject
areas represent the courses in which students most commonly enroll in their first year of college. The
assessment, developed by ACT, is intended to gauge college and career readiness of students by
determining the probability of student success in college-credit courses. According to research from
ACT, students who meet or exceed benchmarks on the EXPLORE assessment have at least a 50% chance
of earning a passing grade in the same subject course after high school graduation. Thus, the EXPLORE
assessment is a tool for schools to evaluate students’ early progress toward college.
In the 2012-2013 school year, an EXPLORE tutoring program was implemented in an effort to increase
the number of students who met the district benchmark on the assessment (a composite score of 17 or
higher). There were seven middle schools who piloted the EXPLORE tutoring program: Bearden, Halls,
Northwest, Powell, South-Doyle, Vine, and Whittle Springs. Almost 300 students participated in the
program.
Findings
The REA findings are based on analysis of the tutoring program using the EXPLORE composite scores of
students who participated in the program. There were 283 students enrolled in the EXPLORE tutoring
program. The number of students included in our program evaluation was 196, due to testing data
availability.
The notable findings resulting from this analysis are as follows:
1) Overall, there was no statistically significant increase in the mean EXPLORE composite scores of
students in the tutoring program (the treatment group) when compared to students who were
not in the tutoring program (the control group).
2) However, Halls and Powell Middle Schools exhibited a mean EXPLORE composite that was
higher (statistically significant) for their tutored students when compared to their control
group. This may be because the students enrolled at those two schools had higher predicted
EXPLORE scores than the balance of tutored students at the district level.
3) The control group, as a whole, had a higher percentage of students reaching the EXPLORE
benchmark score of 17.
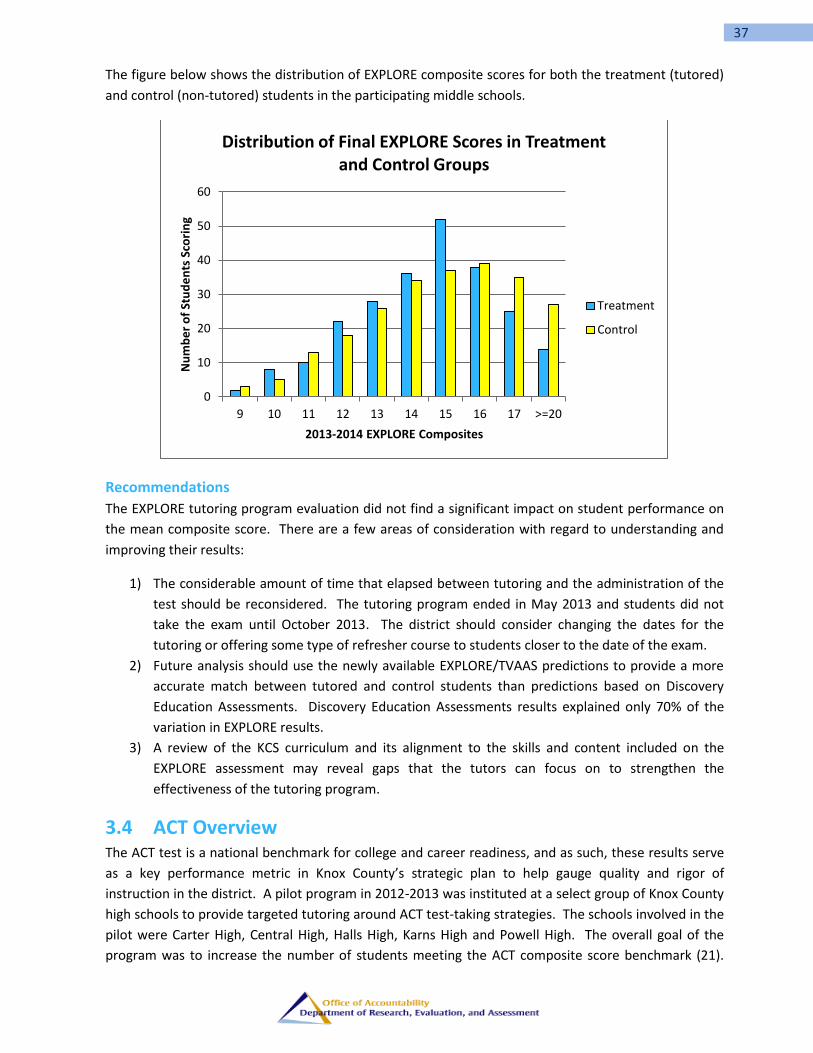
37
The figure below shows the distribution of EXPLORE composite scores for both the treatment (tutored)
and control (non-tutored) students in the participating middle schools.
Recommendations
The EXPLORE tutoring program evaluation did not find a significant impact on student performance on
the mean composite score. There are a few areas of consideration with regard to understanding and
improving their results:
1) The considerable amount of time that elapsed between tutoring and the administration of the
test should be reconsidered. The tutoring program ended in May 2013 and students did not
take the exam until October 2013. The district should consider changing the dates for the
tutoring or offering some type of refresher course to students closer to the date of the exam.
2) Future analysis should use the newly available EXPLORE/TVAAS predictions to provide a more
accurate match between tutored and control students than predictions based on Discovery
Education Assessments. Discovery Education Assessments results explained only 70% of the
variation in EXPLORE results.
3) A review of the KCS curriculum and its alignment to the skills and content included on the
EXPLORE assessment may reveal gaps that the tutors can focus on to strengthen the
effectiveness of the tutoring program.
3.4 ACT Overview The ACT test is a national benchmark for college and career readiness, and as such, these results serve
as a key performance metric in Knox County’s strategic plan to help gauge quality and rigor of
instruction in the district. A pilot program in 2012-2013 was instituted at a select group of Knox County
high schools to provide targeted tutoring around ACT test-taking strategies. The schools involved in the
pilot were Carter High, Central High, Halls High, Karns High and Powell High. The overall goal of the
program was to increase the number of students meeting the ACT composite score benchmark (21).
0
10
20
30
40
50
60
9 10 11 12 13 14 15 16 17 >=20
Nu
mb
er
of
Stu
de
nts
Sco
rin
g
2013-2014 EXPLORE Composites
Distribution of Final EXPLORE Scores in Treatment and Control Groups
Treatment
Control

38
Proper preparation for the ACT empowers students by opening doors to college as higher ACT scores
lead to higher admissions rates and additional scholarship opportunities.
Findings
Our program evaluation focused on the predicted ACT percentile, as the TVAAS model generates a
predicted percentile for students. Using that data, tutored students were matched to their predicted
state percentile on the ACT for this program evaluation. A control group (students who did not
participate in the ACT tutoring) was created from a pool of students at the same schools with same
distribution of predicted ACT percentiles. The evaluation included a final analysis of the student’s best
ACT score on record. There were just over 300 students enrolled in the program. We were able to
include 258 in our program evaluation since we had prediction data for those students.
Students enrolled in the tutoring program exhibited higher mean ACT composite scores when
compared to their peers who did not participate. The results were especially positive in light of their
implications on KCS students’ college readiness.
1) Across the district, students in the tutoring program performed better on their ACT than
students in the control group who did not receive tutoring.
a. There was a statistically significant difference between the mean ACT score of the
tutored group and the control group.
b. The mean ACT score was higher at most locations that piloted the tutoring program
than other high schools in the district.
2) At the school level, students who were tutored had a higher mean ACT score than their non-
tutored peers at three of the five participating schools (Central, Halls, and Karns High Schools).
In the remaining two schools, there was no statistically significant difference between the two
groups.
0
5
10
15
20
25
30
35
40
10 12 14 16 18 20 22 24 26 28 30 32 34 36
Nu
mb
er
of
Stu
de
nts
Sco
rin
g
ACT Score
Distribution of Best ACT Scores
Control
Treatment
ACT Score Greater Than or Equal to 21
ACT Score Less Than 21

39
3) The control group had more students scoring at the lower end of the ACT scale (17 and below)
and the treatment group had more students scoring at the higher end (29 and higher).
a. The control group had more students with an actual ACT score of exactly 21, but overall
the treatment group had more students scoring 21 or above than the control group.
4) The tutoring program was most successful at Halls High School.
a. Students who participated in ACT tutoring at Halls earned a mean composite score 1.5
points higher than their peers in the control group, which was statistically significant at
the 95% confidence interval. Moreover, almost 10% more students in the tutored
group at Halls High scored a 21 or above, which was statistically significant at the 89%
confidence interval.
Recommendations
The ACT tutoring program succeeded in its goal of improving the mean ACT composite score of students
enrolled in the program. There are a few recommendations to consider in light of its success:
1) Although there were overall gains, a root-cause analysis of implementation discrepancies may
be warranted to understand why there were differences in the magnitude of those gains
between schools.
2) Halls High School performed exceptionally well out of all the participating schools. It is worth
analyzing this school as a “bright spot” to gather best practices and implementation strategies
for the other schools with the program.
3) Deeper analysis may be conducted regarding the growth of tutored students on specific subject
area tests to identify potential gaps in the core instructional program with regard to content
covered on the ACT exam.
4) Due to the program’s mostly successful results, expanding the ACT tutoring program to
additional high schools may be a next step to consider. Moreover, the success of the ACT
tutoring may lead the district to consider investing more resources toward this type of support,
as it is such an important gateway for students in terms of college and career access.
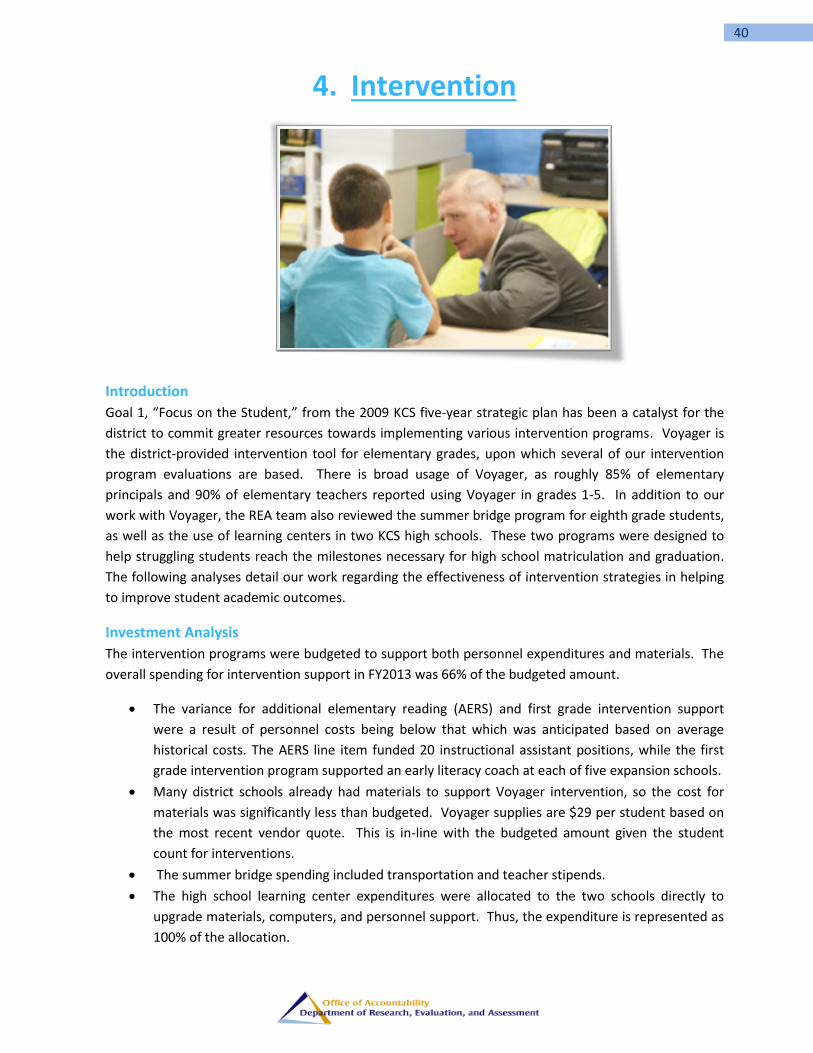
40
4. Intervention
Introduction
Goal 1, “Focus on the Student,” from the 2009 KCS five-year strategic plan has been a catalyst for the
district to commit greater resources towards implementing various intervention programs. Voyager is
the district-provided intervention tool for elementary grades, upon which several of our intervention
program evaluations are based. There is broad usage of Voyager, as roughly 85% of elementary
principals and 90% of elementary teachers reported using Voyager in grades 1-5. In addition to our
work with Voyager, the REA team also reviewed the summer bridge program for eighth grade students,
as well as the use of learning centers in two KCS high schools. These two programs were designed to
help struggling students reach the milestones necessary for high school matriculation and graduation.
The following analyses detail our work regarding the effectiveness of intervention strategies in helping
to improve student academic outcomes.
Investment Analysis
The intervention programs were budgeted to support both personnel expenditures and materials. The
overall spending for intervention support in FY2013 was 66% of the budgeted amount.
The variance for additional elementary reading (AERS) and first grade intervention support
were a result of personnel costs being below that which was anticipated based on average
historical costs. The AERS line item funded 20 instructional assistant positions, while the first
grade intervention program supported an early literacy coach at each of five expansion schools.
Many district schools already had materials to support Voyager intervention, so the cost for
materials was significantly less than budgeted. Voyager supplies are $29 per student based on
the most recent vendor quote. This is in-line with the budgeted amount given the student
count for interventions.
The summer bridge spending included transportation and teacher stipends.
The high school learning center expenditures were allocated to the two schools directly to
upgrade materials, computers, and personnel support. Thus, the expenditure is represented as
100% of the allocation.

41
Student counts encompass those who benefitted from the additional supports and were part of the
program evaluation.
The AERS student counts includes only those students provided intervention services by the
instructional assistants who were hired through this funding.
The student count for early literacy materials includes all students receiving intervention
services, though their materials may have been purchased prior to FY2013.
The summer bridge pilot includes actual student participants.
The high school learning centers student count includes only those students scheduled for
courses in the learning center. However, other students had access to these resources before
or after school.
The first grade intervention student count includes the all first grade students in the five
expansion schools.
Initiative FY13 Budget
FY13 Actual
Expenditures
# of
Students
Cost
Per
Student Other Early Literacy
Additional Elementary Reading Support $ - $ 440,000 $ 371,000 611 $ 607
Early Literacy Materials (Voyager) $ - $ 200,000 $ 44,904 7,813 $ 6
Summer Bridge Pilot for 6th Grade $ 100,000 $ - $ 48,440 90 $ 538
High School Learning Centers $ 49,000 $ - $ 49,000 223 $ 220
1st Grade Intervention $ - $ 390,000 $ 269,314 1,388 $ 194
INTERVENTION $ 149,000 $ 1,030,000 $ 782,658 10,125 $ 77
4.2 Early Literacy Overview Voyager Passport is the reading intervention program provided through district resources. Nearly all of
our 49 elementary schools participated in this intervention. Students receiving the intervention
support participated in an additional 30 minutes of reading instruction. Students were chosen primarily
based upon AIMSweb CBM data. Students in grades one to five who scored between the 11th and the
25th percentiles were the target population for this support. Classroom teachers and instructional
assistants were typically the staff members facilitating the intervention work for students. We
compared students who were enrolled in the Voyager program to their peers (district wide and at their
individual schools) who were not in the program to complete our evaluation.
Findings
We leveraged perception data collected via survey by Parthenon to supplement our evaluation of
Voyager. (See Appendix 9: Parthenon Analysis – Elementary Intervention and Voyager.) Perceptions of
Voyager are mixed. While principals perceive the program to be very effective, our results, as well as
teacher perceptions, suggest otherwise. In addition to quantitative student results, there were also
several findings about how and by whom the program was implemented. Our analysis included 8,305
first and second graders, 3,979 third graders, and 7,607 fourth and fifth graders.
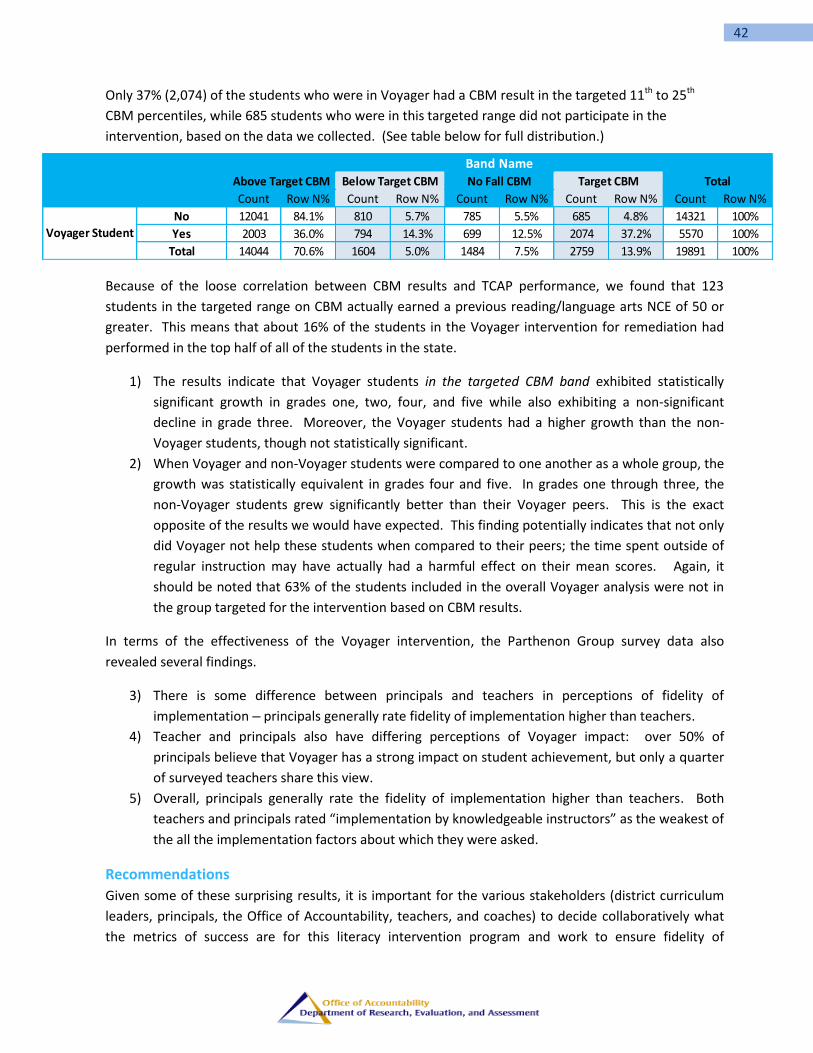
42
Only 37% (2,074) of the students who were in Voyager had a CBM result in the targeted 11th to 25th
CBM percentiles, while 685 students who were in this targeted range did not participate in the
intervention, based on the data we collected. (See table below for full distribution.)
Because of the loose correlation between CBM results and TCAP performance, we found that 123
students in the targeted range on CBM actually earned a previous reading/language arts NCE of 50 or
greater. This means that about 16% of the students in the Voyager intervention for remediation had
performed in the top half of all of the students in the state.
1) The results indicate that Voyager students in the targeted CBM band exhibited statistically
significant growth in grades one, two, four, and five while also exhibiting a non-significant
decline in grade three. Moreover, the Voyager students had a higher growth than the non-
Voyager students, though not statistically significant.
2) When Voyager and non-Voyager students were compared to one another as a whole group, the
growth was statistically equivalent in grades four and five. In grades one through three, the
non-Voyager students grew significantly better than their Voyager peers. This is the exact
opposite of the results we would have expected. This finding potentially indicates that not only
did Voyager not help these students when compared to their peers; the time spent outside of
regular instruction may have actually had a harmful effect on their mean scores. Again, it
should be noted that 63% of the students included in the overall Voyager analysis were not in
the group targeted for the intervention based on CBM results.
In terms of the effectiveness of the Voyager intervention, the Parthenon Group survey data also
revealed several findings.
3) There is some difference between principals and teachers in perceptions of fidelity of
implementation – principals generally rate fidelity of implementation higher than teachers.
4) Teacher and principals also have differing perceptions of Voyager impact: over 50% of
principals believe that Voyager has a strong impact on student achievement, but only a quarter
of surveyed teachers share this view.
5) Overall, principals generally rate the fidelity of implementation higher than teachers. Both
teachers and principals rated “implementation by knowledgeable instructors” as the weakest of
the all the implementation factors about which they were asked.
Recommendations
Given some of these surprising results, it is important for the various stakeholders (district curriculum
leaders, principals, the Office of Accountability, teachers, and coaches) to decide collaboratively what
the metrics of success are for this literacy intervention program and work to ensure fidelity of
Count Row N% Count Row N% Count Row N% Count Row N% Count Row N%
No 12041 84.1% 810 5.7% 785 5.5% 685 4.8% 14321 100%
Yes 2003 36.0% 794 14.3% 699 12.5% 2074 37.2% 5570 100%
Total 14044 70.6% 1604 5.0% 1484 7.5% 2759 13.9% 19891 100%
Above Target CBM Below Target CBM Target CBMNo Fall CBM Total
Voyager Student
Band Name
43
implementation. As such, the recommendations regarding determining the efficacy of the Voyager
program are as follows:
1) We recommend prioritizing which students should receive intervention supports by judiciously
examining multiple indicators that would warrant such support. Our evaluation determined
that there were many students placed in Voyager with performance characteristics well beyond
the program’s intended design. At the same time, there were over 600 students who should
have been receiving Voyager intervention support who were not, according to the targeted
CBM range.
a. We recommend also using data from the TCAP and K-2 assessment to help determine
student placement in interventions. The CBM data can be a supplement and/or
substitute if the TCAP and K-2 assessment scores are not available.
2) Voyager implementation data must be carefully collected and recorded. The program
evaluation may be limited by the consistency and accuracy of the data entered into the
Passport management system. School leaders should work to ensure that student information
is tracked carefully. Moreover, the district should explore opportunities to record intervention
data in student information systems and/or our district learning management system.
3) Feedback from teachers and school leaders in survey data indicated that scheduling for
interventions is quite a challenge to the fidelity of implementation. The district should develop
and offer supports to principals around optimal scheduling scenarios.
4) Stakeholders need to come to an agreement on a set of valid metrics to determine the viability
of the Voyager intervention program. Many instructional leaders in the district believe Voyager
to be an effective program, notwithstanding the results of this program evaluation. It may be
there are other performance indicators not captured by TCAP and TVAAS to validate that
perception. However, we must systematically measure those indicators to determine if such is
the case.
5) The district should consider investigating other invention programs, as well as developing
structures to monitor the fidelity of implementation of our intervention services. These results
seem to indicate that we are not helping students to improve their reading ability at a level that
would be reflected in their summative assessment results and lead to improved RLA scores.
The state-mandated transition to the Response to Instruction and Intervention (RTI2) guidelines
in 2014-15 presents an opportunity to revamp our elementary intervention delivery model.
4.3 First Grade Intervention Overview In an effort to improve literacy in early grades, additional funds were made available to schools in the
form of elementary literacy consultants and coaches. Specifically, fifteen schools were assigned a full-
time literacy coach, who focused solely on students and teachers in first grade. These schools were
selected based upon previous results on the Kindergarten Literacy Assessment and the first grade
AIMSweb (CBM) Assessment. The program goal was to improve student performance as evidenced by
results on SAT10 (K – 2) assessments in reading and math.
Literacy coaches and first grade teachers attended monthly professional development sessions.
Moreover, coaches provided daily support to teachers and students. An Early Literacy Consultant
provided oversight for the 15 schools and coaches. Thus, the first grade literacy grant utilized a three-

44
pronged framework consisting of coaches, teachers, and the elementary literacy consultant. Each
prong had related but disparate roles. In addition to typical coaching duties described in the Teacher
Support section of this report, early literacy instructional coaches monitored the implementation and
fidelity of interventions. First grade teachers collaborated with coaches to engage parents as partners
in literacy. Finally, the early literacy consultant supported the coaches by reviewing professional
development plans and helping to develop effective instructional strategies.
The early literacy grant was based upon a logic model designed as follows:
Through this model of learning, literacy coaches and consultants collaborated with 81 first grade
teachers to reach 1,500 students at the following elementary schools: Adrian Burnett, Beaumont, Cedar
Bluff, Christenberry, Dogwood, East Knox, Green, Inskip, Lonsdale, Mount Olive, Norwood, Sarah Moore
Greene, Spring Hill, Sunnyview, and West Haven.
Findings
The metrics used to evaluate the program include academic growth of the students at the participating
schools, a comparison to schools with similar predicted results, and matched-pair analysis of students
with similar characteristics within and outside of the program. Our notable findings are as follows:
1) First grade students at the intervention schools exhibited significant growth on the reading
portion of the SAT 10 exam; though this fact is tempered by the evidence that the student
results at the participating schools were not statistically different from student results at the
comparison schools.
2) Students at eleven of the fifteen schools outperformed their TVAAS predictions. Moreover,
students at two of the remaining four schools were within one scale score point of their
predicted scores.
3) Eight of the schools had statistically significant positive growth. Two schools had statistically
significant negative growth.
4) Our analyses show that the comparison schools experienced a higher mean growth in student
results than did the early literacy grant schools, though this was not a statistically significant

45
difference.
5) The matched-pair analysis between early literacy grant and non-early literacy grant students
revealed that there was no statistically significant difference between the two groups.
6) Ten of the 15 schools experienced mean growth rates for their students that were better than
the means at the comparison schools, though most were not statistically significant.
a. However, most impressively, Dogwood Elementary first-grade students had a mean
increase of 9.8 scale score points more than their comparison students.
The table below is color-coded to show the growth difference between intervention school students
compared to non-intervention school students. The dark red and green (Cedar Bluff, Beaumont, and
Dogwood, respectively) indicate a statistically significant difference.
School Count
Mean School
Student Growth
Comparison Student Growth
Difference
Adrian Burnett Elementary 77 9.1 5.4 3.7
Beaumont Elementary 73 7.9 .9 6.9
Cedar Bluff Elementary 152 -6.3 11.3 -17.6
Christenberry Elementary 57 -1.4 2.7 -4.2
Dogwood Elementary 82 8.3 -1.5 9.8
East Knox County Elementary 69 1.5 4.3 -2.8
Green Elementary 29 -7.6 2.7 -10.3
Inskip Elementary 64 10.2 7.2 3.0
Lonsdale Elementary 50 5.8 4.0 1.9
Mount Olive Elementary 44 6.4 1.9 4.5
Norwood Elementary 65 10.5 7.0 3.4
Sarah Moore Greene Elementary 50 1.8 4.6 -2.8
Spring Hill Elementary 54 10.1 3.3 6.8
Sunnyview Primary 83 6.6 3.7 2.9
West Haven Elementary 47 11.7 9.7 2.0
Total 996 4.5 5.0 -0.5
Recommendations
Finding ways to improve student literacy is critical to improving student outcomes. The following are
some recommendations related to the first grade intervention program.
1) It should be noted that the K-2 assessment data is only one type of quantitative measure. The
program evaluation used this measure because we were able to leverage student predicted
scores from the TVAAS model. As noted earlier, additional metrics of success may be beneficial
in providing a more nuanced evaluation of the intervention program. Future investigations can
attempt to relate the K-2 assessment results with the other assessment results.
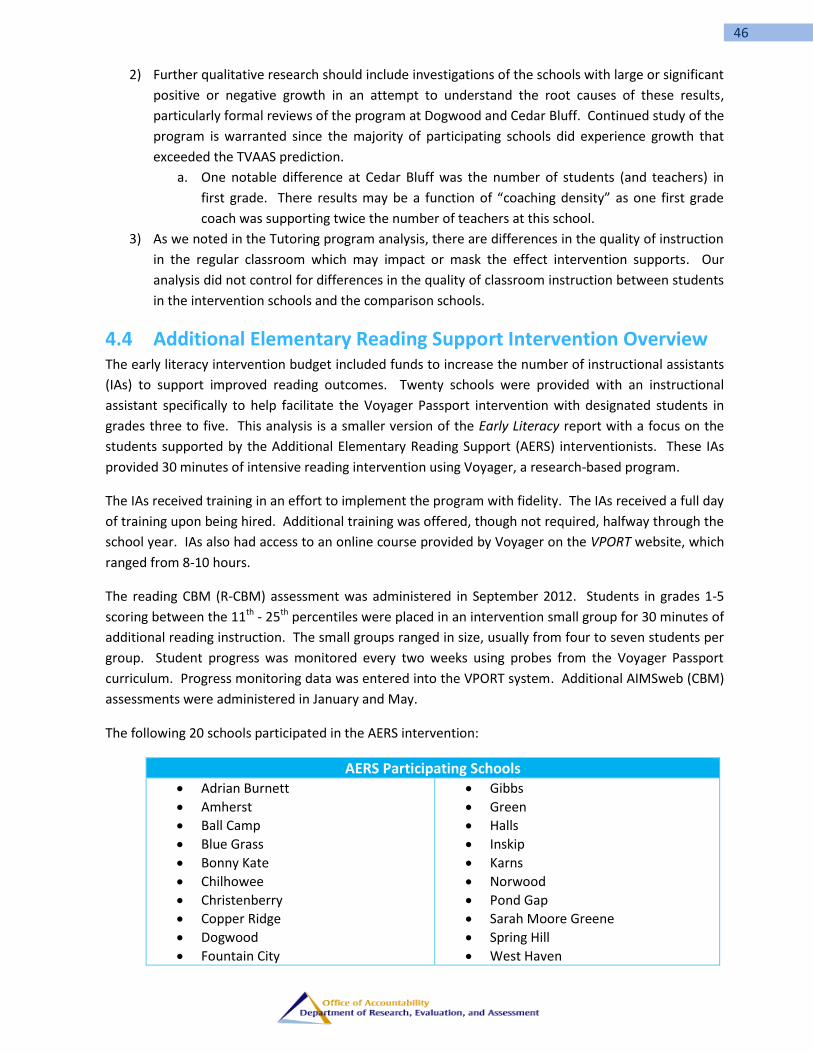
46
2) Further qualitative research should include investigations of the schools with large or significant
positive or negative growth in an attempt to understand the root causes of these results,
particularly formal reviews of the program at Dogwood and Cedar Bluff. Continued study of the
program is warranted since the majority of participating schools did experience growth that
exceeded the TVAAS prediction.
a. One notable difference at Cedar Bluff was the number of students (and teachers) in
first grade. There results may be a function of “coaching density” as one first grade
coach was supporting twice the number of teachers at this school.
3) As we noted in the Tutoring program analysis, there are differences in the quality of instruction
in the regular classroom which may impact or mask the effect intervention supports. Our
analysis did not control for differences in the quality of classroom instruction between students
in the intervention schools and the comparison schools.
4.4 Additional Elementary Reading Support Intervention Overview The early literacy intervention budget included funds to increase the number of instructional assistants
(IAs) to support improved reading outcomes. Twenty schools were provided with an instructional
assistant specifically to help facilitate the Voyager Passport intervention with designated students in
grades three to five. This analysis is a smaller version of the Early Literacy report with a focus on the
students supported by the Additional Elementary Reading Support (AERS) interventionists. These IAs
provided 30 minutes of intensive reading intervention using Voyager, a research-based program.
The IAs received training in an effort to implement the program with fidelity. The IAs received a full day
of training upon being hired. Additional training was offered, though not required, halfway through the
school year. IAs also had access to an online course provided by Voyager on the VPORT website, which
ranged from 8-10 hours.
The reading CBM (R-CBM) assessment was administered in September 2012. Students in grades 1-5
scoring between the 11th - 25th percentiles were placed in an intervention small group for 30 minutes of
additional reading instruction. The small groups ranged in size, usually from four to seven students per
group. Student progress was monitored every two weeks using probes from the Voyager Passport
curriculum. Progress monitoring data was entered into the VPORT system. Additional AIMSweb (CBM)
assessments were administered in January and May.
The following 20 schools participated in the AERS intervention:
AERS Participating Schools Adrian Burnett
Amherst
Ball Camp
Blue Grass
Bonny Kate
Chilhowee
Christenberry
Copper Ridge
Dogwood
Fountain City
Gibbs
Green
Halls
Inskip
Karns
Norwood
Pond Gap
Sarah Moore Greene
Spring Hill
West Haven
47
Findings
Students included in the program evaluation were differentiated as AERS students. The 20 intervention
assistants hired specifically for this program kept rosters of their AERS students, tracking attendance
and R-CBM performance. The comparison between the two groups, AERS students and non-AERS
students, provides information about how well the intervention worked. Student growth was
measured differently by grade level. TCAP predicted scale scores were used in grade three, while NCEs
were used in grades four and five.
There were roughly 611 students in the treatment group from the twenty schools. After eliminating
students who did not have a predicted score, who moved to a non-AERS school, or who were not listed
on the Voyager Passport data file, there 494 students remaining with a complete data set. We were
able to link the data of 198 third graders who were both Voyager and AERS students. Among our fourth
and fifth graders, we had 296 students in our data set.
We have several findings related to the intervention program results as well as its implementation:
1) In grades four and five, where NCE scores were used to assess progress, the mean of the
students in the intervention was significantly greater than predicted and twice as large as non-
AERS students. (While twice as large, the gain was not statistically significantly in comparison
to the peer group.) A matched-pair design comparing demographically equivalent students
confirmed these results.
2) In grades 4 and 5, Pond Gap and West Haven led the way by exhibiting significant growth for
their AERS students.
3) Student progress in grade 3 was measured by predicted achievement scale scores. Students in
the intervention exhibited statistically significant losses both as compared to their predicted
means and compared to demographically equivalent students in the control group. This trend
was evident at many individual schools in addition to the group as a whole.
4) The predicted scores of AERS students are significantly below their non-AERS peers.
a. The AERS students in grades 4 and 5 had previously performed much lower than their
peers, but they grew at a faster rate. This indicates that this intervention was helpful in
closing the reading gap in fourth and fifth grades. It is also evidence that AERS students
were those in the target population of underperforming students.
b. For third grade, the non-AERS students exhibited a small, but not significant, gain of
0.34 of a scale score point, while our treatment group, the AERS students, exhibited a
significant 5.35 mean scale score loss. Thus, the AERS students in third grade did not
appear to benefit from this support at all.
The following table summarizes the reading growth among AERS students in grade 3, which are
representative of the results for the overall evaluation.

48
Predicted Score Observed Score Growth
Mean Mean Mean Count
Adrian Burnett Elementary 743.3 725.8 -17.5 13
Amherst Elementary 742.4 736.2 -6.2 5
Ball Camp Elementary 735.3 732.3 -3.1 12
Blue Grass Elementary 751.8 751.2 -0.7 6
Bonny Kate Elementary 742.3 730.3 -12.0 3
Chilhowee Intermediate 736.8 739.8 2.9 16
Christenberry Elementary 735.3 743.5 8.2 13
Copper Ridge Elementary 735.1 730.4 -4.8 8
Dogwood Elementary 744.0 739.4 -4.6 7
Fountain City Elementary N/A N/A N/A N/A
Gibbs Elementary 745.3 737.3 -8.2 6
Green Elementary 727.1 710.3 -16.9 16
Halls Elementary 743.1 730.3 -12.8 12
Inskip Elementary 743.8 745.9 2.1 20
Karns Elementary N/A N/A N/A N/A
Norwood Elementary 718.4 707.8 -10.6 13
Pond Gap Elementary 731.7 724.6 -7.1 10
Sarah Moore Greene Elementary
730.0 720.9 -9.1 9
Spring Hill Elementary 737.6 741.7 4.1 11
West Haven Elementary 729.8 722.5 -7.4 18
Total 736.1 730.8 -5.4 198
In terms of instructional intervention assistants (IAs) and implementation of the program, our program
evaluation and the Parthenon Group survey data revealed several findings. (See Appendix 10:
Parthenon Analysis – Instructional Assistants.)
5) Principal survey data showed that there is not a consistent way in which IAs were deployed
across the district or within the schools.
6) On average, 30% of IAs’ time is spent on Voyager specifically, with 50% of their time overall
spent on intervention programs in general.
7) Survey data indicated both principals and teachers believe there is an opportunity to provide
greater training of instructional assistants.
8) Principals and teachers reported different experiences in terms of who is delivering Voyager
intervention to participating students.
a. Survey data revealed that Voyager instruction was delivered by multiple types of staff
across the schools including: instructional assistants; other teachers in the building; the
student’s classroom teacher; literacy coaches; and special education instructional
assistants. There were also occasions where other adults in the building, such as
interns and support staff, facilitated the intervention for students.
b. General education instructional assistants were responsible for over half of Voyager
implementation, but the reported mix of other adults responsible varied depending on
who was asked.
49
9) Instructional assistants, though used regularly for the purposes of delivering Voyager, were
perceived as less effective than coaches and classroom teachers.
Recommendations
As the district endeavors to improve outcomes for students and invest its resources wisely, there are a
few recommendations to consider.
1) Further qualitative investigation at individual schools should be pursued to ascertain why the
results are so different (and disappointing) at the third grade level.
2) Both teachers and principals indicated that instructional assistants were not as effective in
delivering intervention supports. Yet, unlike the analysis in the general Early Literacy overview,
it is clear that AERS students did meet the criteria for targeted support based on CBM and prior
TCAP performance. The district should consider if it is wise to continue to rely so heavily on
instructional assistants to provide intervention services to students who are struggling the
most.
3) Alternately, the district must provide instructional assistants with the appropriate training to
execute these intervention programs due to their substantial participation in delivering
intervention services. Moreover, district leaders should better define the role of these
assistants such that they can focus on instructional activities and build their expertise if they are
going to be the primary resource for intervention delivery.
4) Data on intervention implementation was not always available and thus, instructional assistants
could not be linked to student outcomes in a useful way. As such, Voyager implementation
data must be carefully collected and recorded. The program evaluation may be limited by the
consistency and accuracy of the data entered into the VPORT management system. School
leaders should work to ensure that student information is tracked carefully. Furthermore, the
district should explore opportunities to record intervention data in student information systems
and/or our district learning management system.
4.5 Summer Bridge Overview The Knox County Schools Summer Bridge program was originally designed as an intervention for rising
high school freshman that were identified by early warning flags based on attendance, grades, and
TCAP assessment results. The intent of the program was to provide a “bridge” between middle and
high school to get potentially off-track students back on-track. The traditional focus of the six to eight
week summer bridge was to re-teach Reading/English Language Arts (R/ELA), math, and study skills.
In 2012-2013, the Summer Bridge program was expanded to include rising 6th graders to bridge
between elementary and middle schools. The expanded Summer Bridge pilot involved students who
would be attending two different Knox County middle schools (Northwest and Whittle Springs). The
initial selection of students for the expanded Summer Bridge program was based solely on TCAP results
and included only students who performed at the basic or below basic level in third and fourth grade in
reading, math, social studies, or science. Student selection from 15 elementary schools was based on
the number of subjects in which a student had failed to reach proficiency and who were zoned to
attend Northwest or Whittle Springs for middle school.

50
The Summer Bridge was held from June 3 through July 16, 2013 from 8:30 am until 11:30 am. Only
highly effective teachers with Level 5 TVAAS and summative scores were selected to teach in the
program. Additionally, content-specific training was provided to the selected teachers prior to the
beginning of the program. The schedule was designed so that the students would have one hour of
math (Moving with Math), one hour of literacy (Read 180), and one hour of study skills/science each
day. Fridays were “Science Days” in the lab where students focused on the completion of a science-
based learning task.
The Summer Bridge program differed from the regular summer school program because it was
extremely targeted to allow teachers to provide a more rigorous, individualized learning program. The
goal was to enable students to demonstrate growth toward mastery of the essential concepts in
reading/language arts, mathematics and study skills that are necessary for success in middle school.
Findings
Please note: The data to properly evaluate the pilot summer bridge program for rising 6th graders will
not be available until 2013-2014 summative data is released from the state. As such, we analyzed data
from the high school summer bridge program, upon which the 6th grade model is based (a proof-of-
concept analysis).
There were 90 students enrolled in the rising high school freshman summer bridge program, with 45
students each at Northwest and Whittle Springs Middle Schools. There were three classes of 15
students each. We reviewed student performance from two time periods, from grade 7 to 8, which we
considered to be pre-treatment, and from grade 7 to 9, which we considered to be post-treatment. The
measurements included NCE scores based on 7th grade TCAP results in RLA and Math and state
percentiles on English and Algebra I end-of-course (EOC) exams. We also created a control group with a
similar distribution of test performance in order to compare their performance to the treatment group.
1) There is evidence that the high school summer bridge program had its intended effect of
getting students back on track with their academic peers.
a. Comparing the change between 7th to 8th grade and 7th to 9th grade, the mean change in
RLA NCE improved after students participated in the summer bridge program.
2) Based on a comparison of EOC results in English and Math, summer bridge students exhibited
consistent performance when compared to their non-bridge peers (control group).
3) Gains can be seen in the NCE data in both of the subject areas (reading and math), and there is
some evidence that bridge students are increasing math NCEs at a faster rate than their peers.
In the pre-treatment period, bridge students grew more slowly than their peers in the control
group. However, post-treatment, the bridge students performed as well as their control peers,
with no statistically significant difference between the two groups. (See the table below.)
Percent of Students Exhibiting an Increase in Math NCE
Control Treatment
Treatment minus Control
p-value
From 7th to 8th (pre-treatment)
73% 59% -14% 0.0003
From 7th to 9th (post-treatment)
60% 58% -2% 0.7294
51
Because data for rising 6th grade students who attended the summer bridge program will not be
available until 2013-2014 summative data is released from the state, we used data from the Scholastic
Reading Inventory (SRI) and Scholastic Math Inventory (SMI) pre and post-tests as proxies. The results
are promising but will be validated once 2014 TCAP results are available.
4) Twenty percent of the rising 6th graders who attended the summer bridge exhibited one year of
growth as measured by SRI lexiles.
5) Forty percent of the rising 6th graders who attended the summer bridge exhibited at least one
year of growth as measured by SMI lexiles.
Recommendations
The Summer Bridge program appears to help identified students close achievement gaps in comparison
to their academic peers. There are some key considerations to ensure continued and greater success of
the program:
1) The district should examine why students in the lowest math quintile performed worse than
their non-bridge peers in order to identify strategies to improve the program impact for
students in that performance level.
2) The REA team will need to conduct future analysis using the summative data from the 2013-
2014 school year to confirm initial results.
a. If the program continues to have positive results, the district should consider
expansion to additional students or schools.
b. If expanded, replicating the program from the pilot schools will be important to ensure
fidelity and, consequently, similar results.
4.6 High School Learning Centers Overview Learning Centers represent an opportunity for students to complete unearned credits, learn software
skills, create résumés, and work with the teaching staff to increase graduation rates. The centers are
actually computer labs that students use for intervention and enrichment in high schools. They are
staffed with teaching assistants and/or teachers who work with students who are scheduled to attend
or those who are referred to the center as needed. Students may also use the online learning tool,
Odyssey, to earn new credits or recover attempted credits. In the 2012-2013 school year, two high
schools were chosen to expand their learning centers, Gibbs and Carter. The expansion aimed to:
Upgrade existing Learning Center staff to certified teachers or add additional staff.
Expand the Learning Center’s capacity through additional computers, new software, or other
equipment for students to use for the following purposes:
o Research for courses and homework help
o Completion of Odyssey coursework
o Access to grades and homework assignments
Add a tutoring component that may utilize peer tutors, parent and community volunteers, and/or
college students.
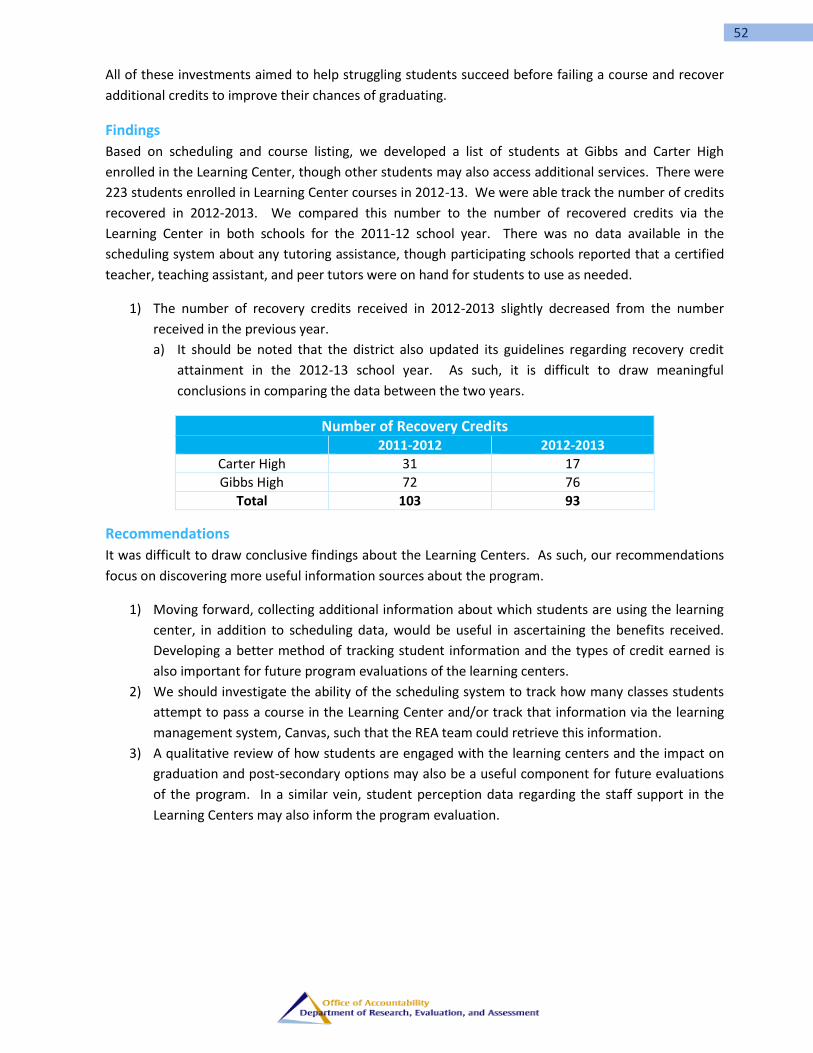
52
All of these investments aimed to help struggling students succeed before failing a course and recover
additional credits to improve their chances of graduating.
Findings
Based on scheduling and course listing, we developed a list of students at Gibbs and Carter High
enrolled in the Learning Center, though other students may also access additional services. There were
223 students enrolled in Learning Center courses in 2012-13. We were able track the number of credits
recovered in 2012-2013. We compared this number to the number of recovered credits via the
Learning Center in both schools for the 2011-12 school year. There was no data available in the
scheduling system about any tutoring assistance, though participating schools reported that a certified
teacher, teaching assistant, and peer tutors were on hand for students to use as needed.
1) The number of recovery credits received in 2012-2013 slightly decreased from the number
received in the previous year.
a) It should be noted that the district also updated its guidelines regarding recovery credit
attainment in the 2012-13 school year. As such, it is difficult to draw meaningful
conclusions in comparing the data between the two years.
Number of Recovery Credits 2011-2012 2012-2013
Carter High 31 17
Gibbs High 72 76
Total 103 93
Recommendations
It was difficult to draw conclusive findings about the Learning Centers. As such, our recommendations
focus on discovering more useful information sources about the program.
1) Moving forward, collecting additional information about which students are using the learning
center, in addition to scheduling data, would be useful in ascertaining the benefits received.
Developing a better method of tracking student information and the types of credit earned is
also important for future program evaluations of the learning centers.
2) We should investigate the ability of the scheduling system to track how many classes students
attempt to pass a course in the Learning Center and/or track that information via the learning
management system, Canvas, such that the REA team could retrieve this information.
3) A qualitative review of how students are engaged with the learning centers and the impact on
graduation and post-secondary options may also be a useful component for future evaluations
of the program. In a similar vein, student perception data regarding the staff support in the
Learning Centers may also inform the program evaluation.

53
5. Enrichment Programs
Overview
There were a few programs included in the Enrichment budget that provided services to students,
though they did not track individual student participation. As such, the following is a qualitative
description of these efforts that does not present any quantitative findings based on student academic
outcomes. However, the value of these programs was intended for students performing at or above
district goals and was to be used to provide extension opportunities for these students.
Enhanced Learning
Schools were asked to submit proposals detailing how they would allocate $3,000 to supplement
learning opportunities for students. (See Appendix 11: Enrichment Allocation Proposals.) This
supplement was available to all elementary and secondary schools. Any school that applied was
awarded the grant money, provided their plans were in alignment with the intended goals. These goals
entailed providing enhanced learning opportunities – including STEM activities beyond traditional
coursework, academic competitions, clubs, and other activities to encourage academic exploration.
The funds typically supported activities and events that took place between January and May 2013.
The table below highlights a few of the school endeavors that were funded by the supplemental
learning dollars. A total of 63 schools applied for and received the enhanced learning grant money.

54
Sample Projects Funded by the Supplemental Learning Grants
School Level Projects
Elementary
Robotics Camp
News Broadcast Student Team
Science Family Fun Night
Portable Technology Studio
Family Reading Night
Middle
Science Bowl Competition
Rocket Supplies
Robotics Kits
Science and Math Olympiad
Video Club
Technology Student Association fees
High
Community Garden
Math Club
Outdoor Club
Robotics Club
State National History Day Project
Fine Arts
Another enrichment program included the Fine Arts summer camp. The
camp was conducted during the month of June 2013 at Sarah Moore
Greene and Green Magnet elementary schools. Almost 100 students in
grades one through five participated in various activities that centered on
weekly themes of different continents (Africa, Asia, South America, and
North America). The classes each day were art, music, physical education,
and dance. The program lasted four weeks. There was also an
international taste-testing event sponsored by School Nutrition Services
and a parent education program component. Teachers received training
and classroom stipends to purchase materials.
Just under $32,000 was spent on the Fine Arts summer camp.
Fine Arts Summer Camp 2012-2013
Item Cost
Teacher Stipends (8 x $2,300) $ 18,400
Site Coordinators (2 x $2,800) $ 5,600
Nurse $ 1,400
Equipment & Supplies $ 2,000
Technology $ 3,360
Training $ 100
International Food $ 1,000
Total $ 31,860

55
Robotics
High schools were afforded the opportunity to establish a FIRST Robotics competition team. FIRST
Robotics is a national program that encourages students to learn about science and technology through
the practical application of building a robot. Both schools and students were self-selected for this
program in that they applied to the competition and for the district funds to participate. The table
below shows the number of students in each team.
School Students Farragut High School 27
Gibbs High School 17
Halls High School 11
Hardin Valley Academy 43
L & N STEM Academy 42
South-Doyle High School 22
West High School 5
All of the robotics teams participated in the Smoky Mountain Regional FIRST Robotics Competition in
March 2013. Hardin Valley Academy and Halls High School both won at the regional competition and
advanced to the FIRST Robotics National Championship in St. Louis, Missouri. The championship had
four divisions of 100 teams each. Hardin Valley Academy placed 10th in its division and Halls High
finished in 100th in the same division. The Hardin Valley Academy team (the RoHAWKtics) also won the
National Additive Manufacturing Innovation Institute First Place award for significant use of three-
dimensional printing to solve advanced design and manufacturing challenges.
Investment Analysis
The budgeted amounts in this area were structured as allocations to schools to support the initiative.
As such, expenditure from the general purpose fund is represented as 100% of the budgeted amount,
as the dollars were forwarded to schools to spend based on proposals or budgets they submitted. The
enhanced learning opportunities were $3,000 grants to individual schools in FY2013. The FIRST
Robotics line item was allocated to support and expand our district participation by providing half of the
total cost per team or $7,500 to each of eight school teams. A detailed breakdown of the expenditures
for the fine arts summer academy was provided in the overview.
The student counts represent the student participation as reported by the project leaders. For the
enhanced learning opportunities, the total student count represents all students in the designated
schools.
Initiative
FY13 Budget FY13 Actual
Expenditures
# of
Students
Cost Per
Student Other Early
Literacy
Enhanced learning opportunities $ 264,000 $ - $ 264,000 50,130 $ 5
Fine Arts summer academies $ 32,000 $ - $ 31,860 97 $ 330
FIRST Robotics Teams $ 60,000 $ - $ 60,000 167 $ 359
ENRICHMENT $ 356,000 $ - $ 355,860 50,394 $ 7

56
Note: STEMSpark Hub activities were not included in this program evaluation. As such, the $94,000
included for STEM activities in the original $7 million budget is not included in this budget summary for
enrichment.
Recommendations
The enrichment programs did provide enhanced learning opportunities for students as intended.
Recommendations programs are as follows:
1) The district may consider a centralized project account to provide coordinated resources for
schools interested in funding enhanced learning opportunities.
2) The Fine Arts Summer Camp was a complement to the Summer Boost Academy programming
at Sarah Moore Greene, which was a component of its School Improvement Grant. This was a
successful collaboration and should be considered for continuation in the summer 2014.
3) The FIRST Robotics competition was a hands-on learning experience from which student were
able to apply learning across multiple disciplines. The district should seek to expand this
experience to all high schools.
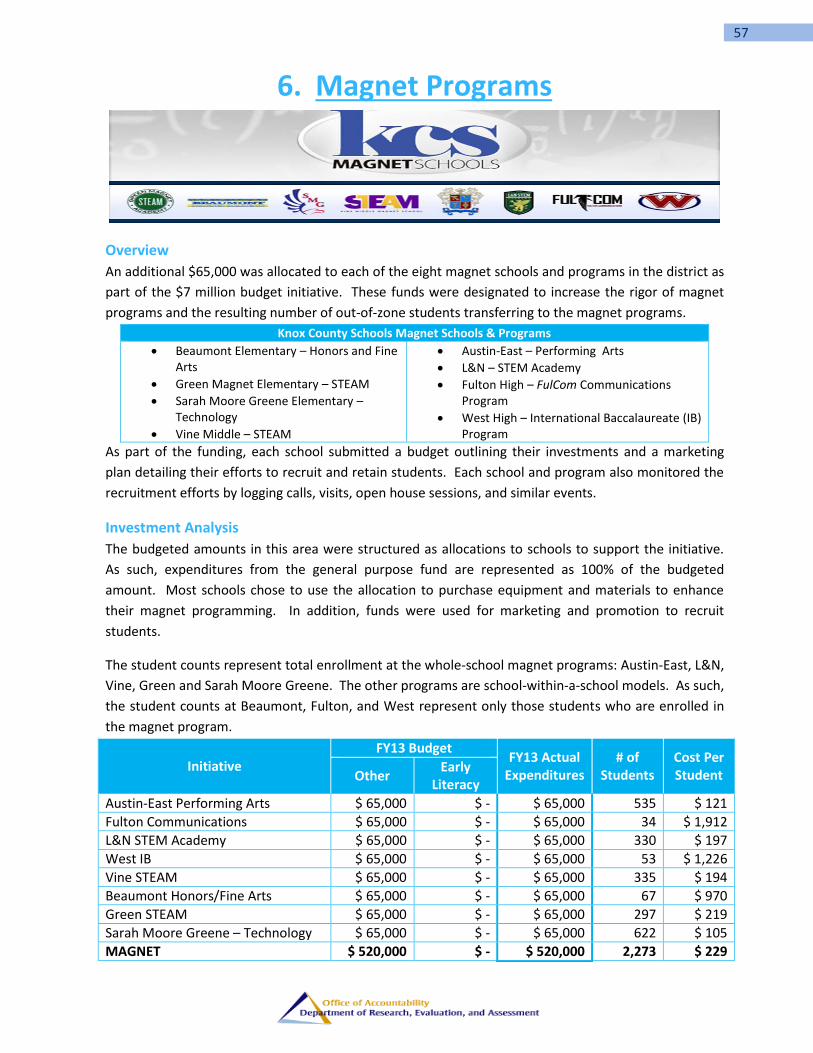
57
6. Magnet Programs
Overview
An additional $65,000 was allocated to each of the eight magnet schools and programs in the district as
part of the $7 million budget initiative. These funds were designated to increase the rigor of magnet
programs and the resulting number of out-of-zone students transferring to the magnet programs.
Knox County Schools Magnet Schools & Programs
Beaumont Elementary – Honors and Fine Arts
Green Magnet Elementary – STEAM
Sarah Moore Greene Elementary – Technology
Vine Middle – STEAM
Austin-East – Performing Arts
L&N – STEM Academy
Fulton High – FulCom Communications Program
West High – International Baccalaureate (IB) Program
As part of the funding, each school submitted a budget outlining their investments and a marketing
plan detailing their efforts to recruit and retain students. Each school and program also monitored the
recruitment efforts by logging calls, visits, open house sessions, and similar events.
Investment Analysis
The budgeted amounts in this area were structured as allocations to schools to support the initiative.
As such, expenditures from the general purpose fund are represented as 100% of the budgeted
amount. Most schools chose to use the allocation to purchase equipment and materials to enhance
their magnet programming. In addition, funds were used for marketing and promotion to recruit
students.
The student counts represent total enrollment at the whole-school magnet programs: Austin-East, L&N,
Vine, Green and Sarah Moore Greene. The other programs are school-within-a-school models. As such,
the student counts at Beaumont, Fulton, and West represent only those students who are enrolled in
the magnet program.
Initiative FY13 Budget
FY13 Actual Expenditures
# of Students
Cost Per Student Other
Early Literacy
Austin-East Performing Arts $ 65,000 $ - $ 65,000 535 $ 121
Fulton Communications $ 65,000 $ - $ 65,000 34 $ 1,912
L&N STEM Academy $ 65,000 $ - $ 65,000 330 $ 197
West IB $ 65,000 $ - $ 65,000 53 $ 1,226
Vine STEAM $ 65,000 $ - $ 65,000 335 $ 194
Beaumont Honors/Fine Arts $ 65,000 $ - $ 65,000 67 $ 970
Green STEAM $ 65,000 $ - $ 65,000 297 $ 219
Sarah Moore Greene – Technology $ 65,000 $ - $ 65,000 622 $ 105
MAGNET $ 520,000 $ - $ 520,000 2,273 $ 229
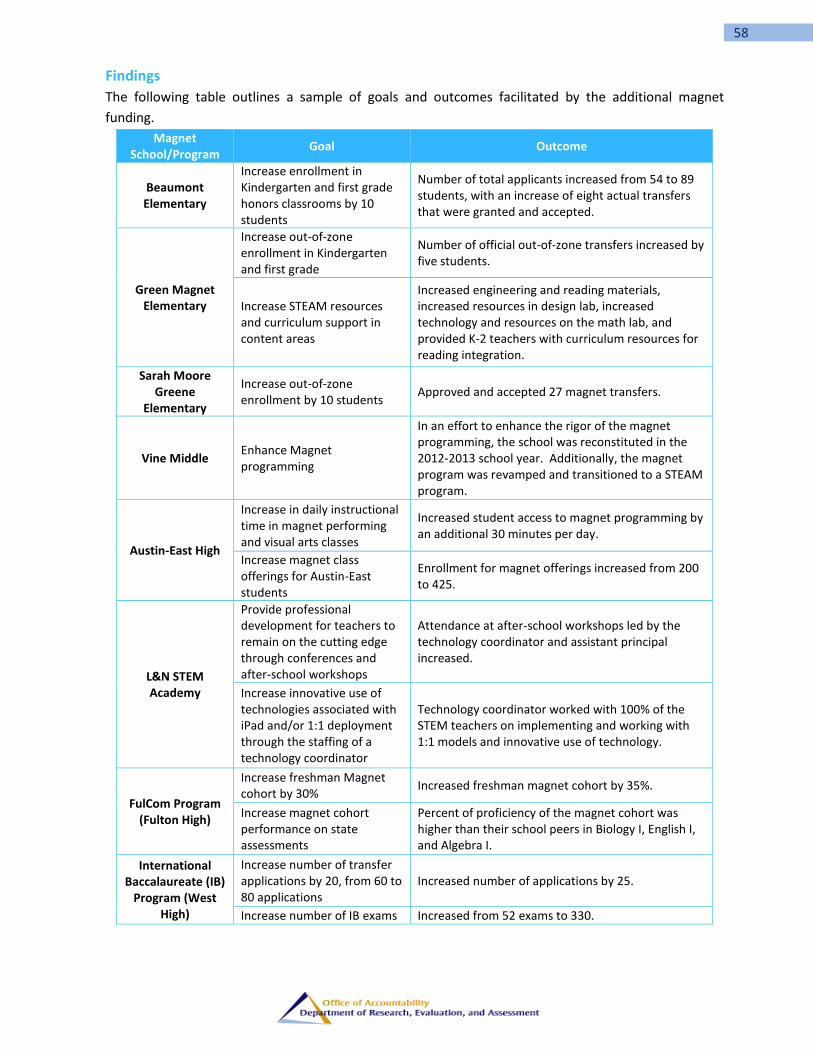
58
Findings
The following table outlines a sample of goals and outcomes facilitated by the additional magnet
funding.
Magnet School/Program
Goal Outcome
Beaumont Elementary
Increase enrollment in Kindergarten and first grade honors classrooms by 10 students
Number of total applicants increased from 54 to 89 students, with an increase of eight actual transfers that were granted and accepted.
Green Magnet Elementary
Increase out-of-zone enrollment in Kindergarten and first grade
Number of official out-of-zone transfers increased by five students.
Increase STEAM resources and curriculum support in content areas
Increased engineering and reading materials, increased resources in design lab, increased technology and resources on the math lab, and provided K-2 teachers with curriculum resources for reading integration.
Sarah Moore Greene
Elementary
Increase out-of-zone enrollment by 10 students
Approved and accepted 27 magnet transfers.
Vine Middle Enhance Magnet programming
In an effort to enhance the rigor of the magnet programming, the school was reconstituted in the 2012-2013 school year. Additionally, the magnet program was revamped and transitioned to a STEAM program.
Austin-East High
Increase in daily instructional time in magnet performing and visual arts classes
Increased student access to magnet programming by an additional 30 minutes per day.
Increase magnet class offerings for Austin-East students
Enrollment for magnet offerings increased from 200 to 425.
L&N STEM Academy
Provide professional development for teachers to remain on the cutting edge through conferences and after-school workshops
Attendance at after-school workshops led by the technology coordinator and assistant principal increased.
Increase innovative use of technologies associated with iPad and/or 1:1 deployment through the staffing of a technology coordinator
Technology coordinator worked with 100% of the STEM teachers on implementing and working with 1:1 models and innovative use of technology.
FulCom Program (Fulton High)
Increase freshman Magnet cohort by 30%
Increased freshman magnet cohort by 35%.
Increase magnet cohort performance on state assessments
Percent of proficiency of the magnet cohort was higher than their school peers in Biology I, English I, and Algebra I.
International Baccalaureate (IB)
Program (West High)
Increase number of transfer applications by 20, from 60 to 80 applications
Increased number of applications by 25.
Increase number of IB exams Increased from 52 exams to 330.
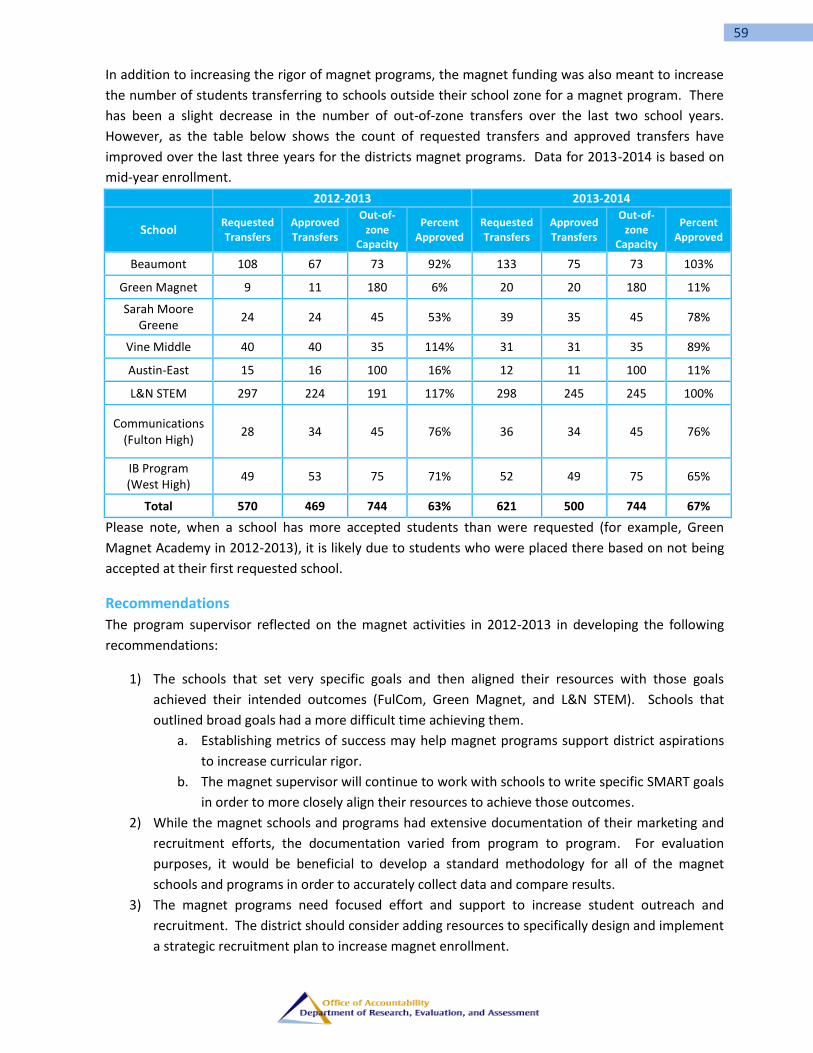
59
In addition to increasing the rigor of magnet programs, the magnet funding was also meant to increase
the number of students transferring to schools outside their school zone for a magnet program. There
has been a slight decrease in the number of out-of-zone transfers over the last two school years.
However, as the table below shows the count of requested transfers and approved transfers have
improved over the last three years for the districts magnet programs. Data for 2013-2014 is based on
mid-year enrollment.
2012-2013 2013-2014
School Requested Transfers
Approved Transfers
Out-of-zone
Capacity
Percent Approved
Requested Transfers
Approved Transfers
Out-of-zone
Capacity
Percent Approved
Beaumont 108 67 73 92% 133 75 73 103%
Green Magnet 9 11 180 6% 20 20 180 11%
Sarah Moore Greene
24 24 45 53% 39 35 45 78%
Vine Middle 40 40 35 114% 31 31 35 89%
Austin-East 15 16 100 16% 12 11 100 11%
L&N STEM 297 224 191 117% 298 245 245 100%
Communications (Fulton High)
28 34 45 76% 36 34 45 76%
IB Program (West High)
49 53 75 71% 52 49 75 65%
Total 570 469 744 63% 621 500 744 67%
Please note, when a school has more accepted students than were requested (for example, Green
Magnet Academy in 2012-2013), it is likely due to students who were placed there based on not being
accepted at their first requested school.
Recommendations
The program supervisor reflected on the magnet activities in 2012-2013 in developing the following
recommendations:
1) The schools that set very specific goals and then aligned their resources with those goals
achieved their intended outcomes (FulCom, Green Magnet, and L&N STEM). Schools that
outlined broad goals had a more difficult time achieving them.
a. Establishing metrics of success may help magnet programs support district aspirations
to increase curricular rigor.
b. The magnet supervisor will continue to work with schools to write specific SMART goals
in order to more closely align their resources to achieve those outcomes.
2) While the magnet schools and programs had extensive documentation of their marketing and
recruitment efforts, the documentation varied from program to program. For evaluation
purposes, it would be beneficial to develop a standard methodology for all of the magnet
schools and programs in order to accurately collect data and compare results.
3) The magnet programs need focused effort and support to increase student outreach and
recruitment. The district should consider adding resources to specifically design and implement
a strategic recruitment plan to increase magnet enrollment.

This page intentionally left blank.

61
TECHNICAL REPORTS The following section contains the technical reports of each of the programs the REA evaluated.
These technical reports offer brief descriptions of the programs, plus detailed information about the
methodology used for the program evaluations. The results of our statistical analyses are presented
with conclusions and considerations for future research. These reports are intended for those
readers who wish to understand how and why we reached the conclusions we did for each program.
We also provided enough detail for any readers who want to duplicate our studies as well. Any
questions about the methodology or results should be forwarded to the department at

62
This page intentionally left blank.

63
7. Community Schools Community Schools is a strategy that aligns schools and community resources to provide services that
meet the social, physical, cognitive, and economic needs of both students and families. In particular,
it provides enhanced learning opportunities for students and their families via tutoring and
mentoring; family engagement activities; health, mental and social services; and early childhood
development. This strategy also helps increase linkages between schools and partners and teachers
and parents. It is one component of the “engaged community and parents” goal in the KCS strategic
plan, Excellence for All Children, adopted in 2009.
Methodology
While the entire schools were engaged with some community school activities, we have followed 246
students who actively participated in the after-school programs throughout the year and were
evaluated in the interim reports. We will be considering these same students for this report. We will
designate these 246 as high-risk students and their peers as non-high-risk students.
A logic model was created concerning how the initiative would be assessed for interim reports and for
this summative report. It was determined that the following indicators would be used:
Student attendance
Parental engagement
Discipline referrals
Academic achievement
Academic growth
The data from the model will be measured in two ways. As the high-risk students are subsets of the
schools, we will measure the high-risk students against their peers. We will also measure the high-
risk students against themselves where baseline data is available. As there is no baseline or
comparison data for parental engagement, it will not be included in this study. For any statistical test,
a p-value of less than .05 (p < .05) will be considered statistically significant as it will indicate that the
probability of a result that extreme happening by chance would be less than one out of twenty.
Results: Student Attendance
Students who were not enrolled for the entire 175 days of the school year had their absences
prorated to be out of 175. We did not consider students who were enrolled for fewer than 20 days to
avoid skewing the results. While the number of students in each group is different, the distribution of
absences between high-risk students and non-high-risk is very similar in shape. These are presented
in figure 7.1.

64
Figure 7.1: The Distribution of the Number of Prorated Absences in the Community Schools
We subjected the number of prorated absences between high-risk students and their peers using a
two-sample t-test for each of the schools and for the aggregate of the schools. The results of these
tests can be found in table 7.1 below.
Table 7.1: Two-sample t-tests on the Number of Prorated Absences in the Community Schools
Community School Student The probability of a difference this extreme
happening by chance No Yes Difference
School Mean Count Mean Count Mean (p-value)
Green 12.8 295 10.0 57 2.9 .042
Lonsdale 10.2 319 5.7 93 4.5 .000
Norwood 11.3 551 8.7 96 2.5 .007
Total 11.4 1165 7.9 246 3.5 .000
There is a significant difference between the number of absences for the two groups at each school
and for the schools combined. High-risk students have fewer mean prorated absences. Since
students did not become high-risk students through a random process, it is possible that this
difference may be due to a selection bias.
We were able to gather baseline attendance data for 193 of our 246 high-risk students as well as for
695 of our 1165 comparison students. We subtracted the baseline data from the current year in
order that a negative number would represent a decrease in the number of absences from year to
year. The distribution of the change in absences is represented in figure 7.2.
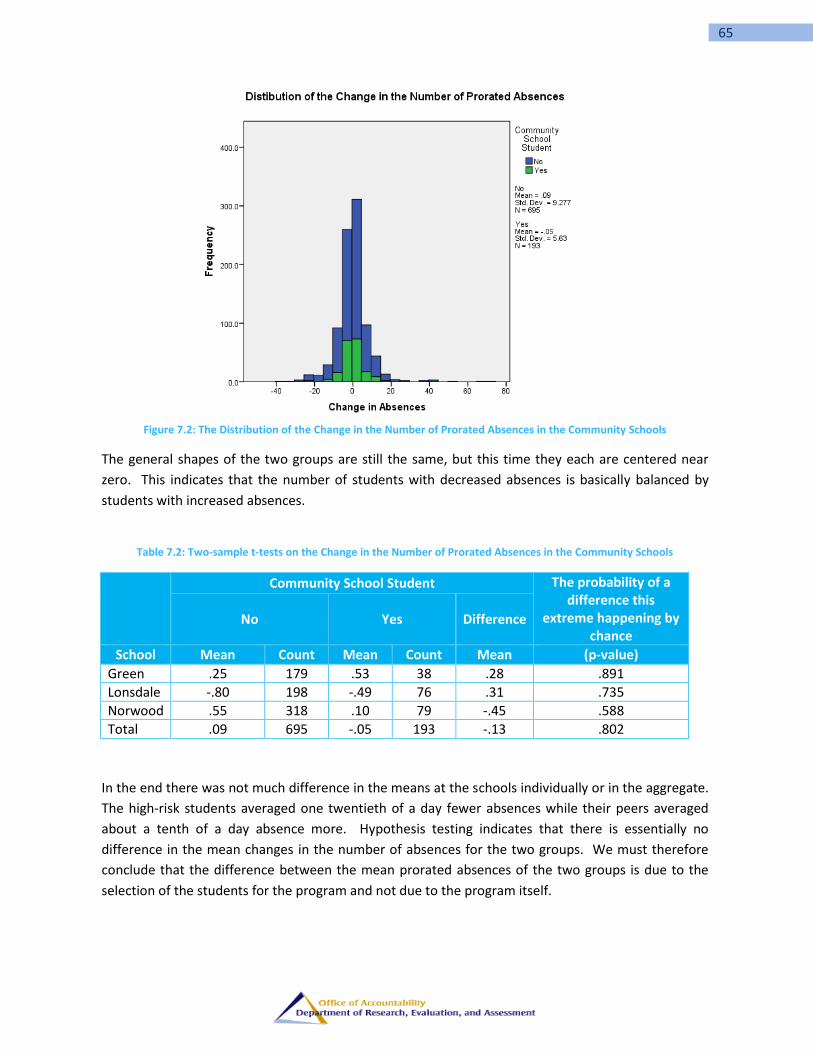
65
Figure 7.2: The Distribution of the Change in the Number of Prorated Absences in the Community Schools
The general shapes of the two groups are still the same, but this time they each are centered near
zero. This indicates that the number of students with decreased absences is basically balanced by
students with increased absences.
Table 7.2: Two-sample t-tests on the Change in the Number of Prorated Absences in the Community Schools
Community School Student The probability of a difference this
extreme happening by chance
No Yes Difference
School Mean Count Mean Count Mean (p-value)
Green .25 179 .53 38 .28 .891
Lonsdale -.80 198 -.49 76 .31 .735
Norwood .55 318 .10 79 -.45 .588
Total .09 695 -.05 193 -.13 .802
In the end there was not much difference in the means at the schools individually or in the aggregate.
The high-risk students averaged one twentieth of a day fewer absences while their peers averaged
about a tenth of a day absence more. Hypothesis testing indicates that there is essentially no
difference in the mean changes in the number of absences for the two groups. We must therefore
conclude that the difference between the mean prorated absences of the two groups is due to the
selection of the students for the program and not due to the program itself.
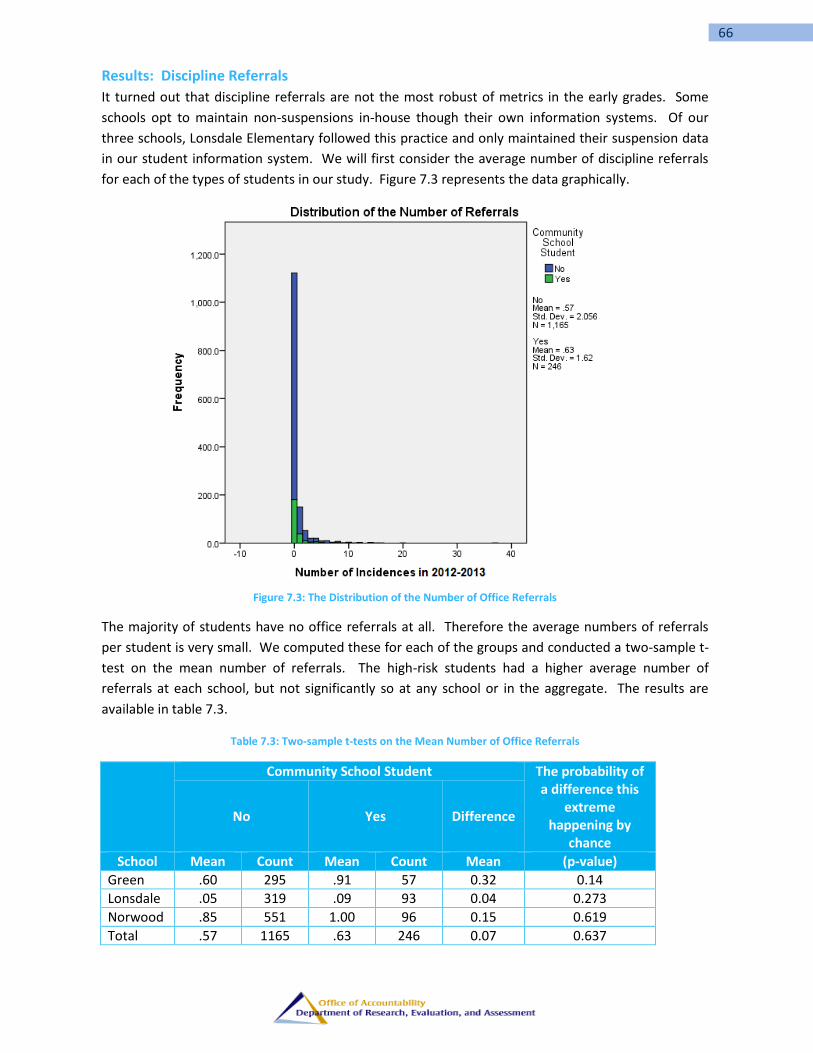
66
Results: Discipline Referrals
It turned out that discipline referrals are not the most robust of metrics in the early grades. Some
schools opt to maintain non-suspensions in-house though their own information systems. Of our
three schools, Lonsdale Elementary followed this practice and only maintained their suspension data
in our student information system. We will first consider the average number of discipline referrals
for each of the types of students in our study. Figure 7.3 represents the data graphically.
Figure 7.3: The Distribution of the Number of Office Referrals
The majority of students have no office referrals at all. Therefore the average numbers of referrals
per student is very small. We computed these for each of the groups and conducted a two-sample t-
test on the mean number of referrals. The high-risk students had a higher average number of
referrals at each school, but not significantly so at any school or in the aggregate. The results are
available in table 7.3.
Table 7.3: Two-sample t-tests on the Mean Number of Office Referrals
Community School Student The probability of a difference this
extreme happening by
chance
No Yes Difference
School Mean Count Mean Count Mean (p-value)
Green .60 295 .91 57 0.32 0.14
Lonsdale .05 319 .09 93 0.04 0.273
Norwood .85 551 1.00 96 0.15 0.619
Total .57 1165 .63 246 0.07 0.637

67
As was the case with absences, we were able to concentrate on students who had a discipline record
for two years in an effort to see if the high-risk students had a change in their mean number of
discipline referrals. This turns out to be a much smaller population of students as represented in
figure 7.4.
Figure 7.4: The Distribution of the Change in the Number of Office Referrals
When we break this down by school we find that the high-risk students with two years of referrals at
Green decreased by almost one referral per student while it increased by more than one referral per
student for the non-high-risk students. Yet, the counts are small enough to keep this from being a
significant difference in the mean number of referrals at Green. While the situations differ at the
other schools, neither of them, nor the aggregate showed a significant difference in the means of the
two groups.
Table 7.4: Two-sample t-tests on the Mean of the Change in the Number of Office Referrals
Community School Student The probability of a difference this
extreme happening by chance
No Yes Difference
School Mean Count Mean Count Mean (p-value)
Green 1.05 22 -.86 7 -1.90 0.062
Lonsdale -1.50 6 -.50 2 1.00 0.728
Norwood -0.65 37 .85 13 1.49 0.464
Total -.15 65 .18 22 0.34 0.794
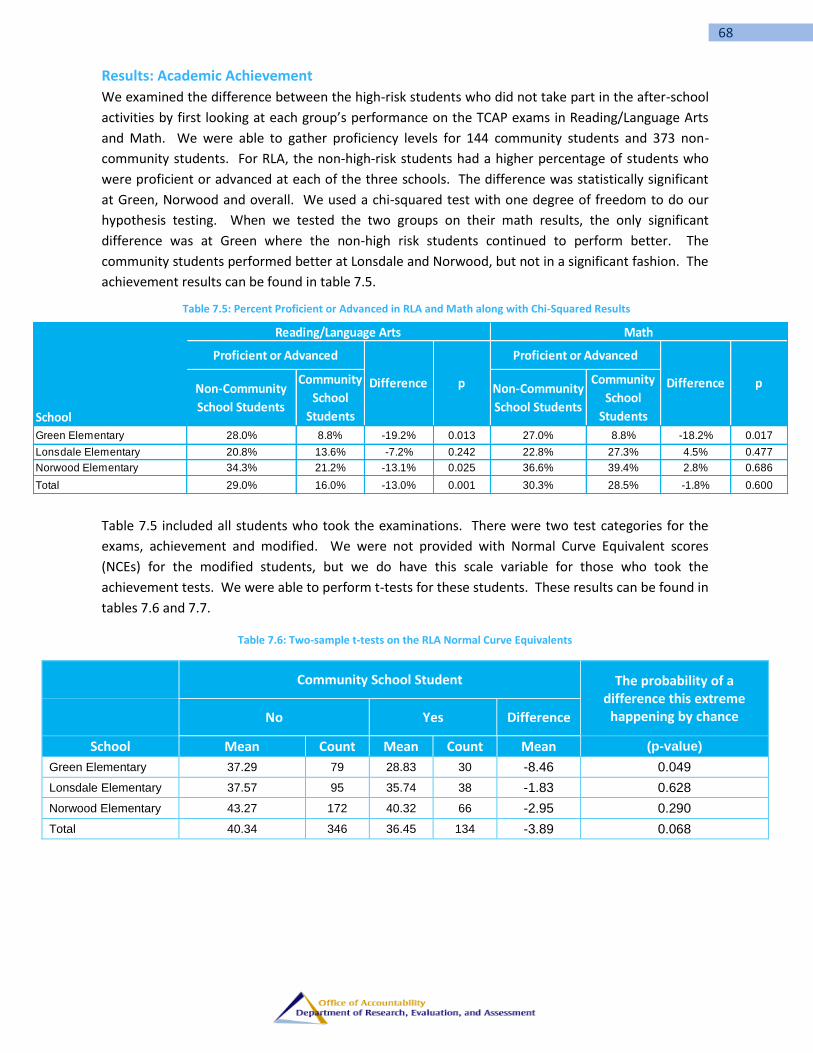
68
School
Non-Community
School Students
Community
School
Students
Non-Community
School Students
Community
School
Students
Green Elementary 28.0% 8.8% -19.2% 0.013 27.0% 8.8% -18.2% 0.017
Lonsdale Elementary 20.8% 13.6% -7.2% 0.242 22.8% 27.3% 4.5% 0.477
Norwood Elementary 34.3% 21.2% -13.1% 0.025 36.6% 39.4% 2.8% 0.686
Total 29.0% 16.0% -13.0% 0.001 30.3% 28.5% -1.8% 0.600
Proficient or Advanced Proficient or Advanced
Difference p
Reading/Language Arts Math
Difference p
Results: Academic Achievement
We examined the difference between the high-risk students who did not take part in the after-school
activities by first looking at each group’s performance on the TCAP exams in Reading/Language Arts
and Math. We were able to gather proficiency levels for 144 community students and 373 non-
community students. For RLA, the non-high-risk students had a higher percentage of students who
were proficient or advanced at each of the three schools. The difference was statistically significant
at Green, Norwood and overall. We used a chi-squared test with one degree of freedom to do our
hypothesis testing. When we tested the two groups on their math results, the only significant
difference was at Green where the non-high risk students continued to perform better. The
community students performed better at Lonsdale and Norwood, but not in a significant fashion. The
achievement results can be found in table 7.5.
Table 7.5: Percent Proficient or Advanced in RLA and Math along with Chi-Squared Results
Table 7.5 included all students who took the examinations. There were two test categories for the
exams, achievement and modified. We were not provided with Normal Curve Equivalent scores
(NCEs) for the modified students, but we do have this scale variable for those who took the
achievement tests. We were able to perform t-tests for these students. These results can be found in
tables 7.6 and 7.7.
Table 7.6: Two-sample t-tests on the RLA Normal Curve Equivalents
Community School Student The probability of a
difference this extreme happening by chance No Yes Difference
School Mean Count Mean Count Mean (p-value)
Green Elementary 37.29 79 28.83 30 -8.46 0.049
Lonsdale Elementary 37.57 95 35.74 38 -1.83 0.628
Norwood Elementary 43.27 172 40.32 66 -2.95 0.290
Total 40.34 346 36.45 134 -3.89 0.068
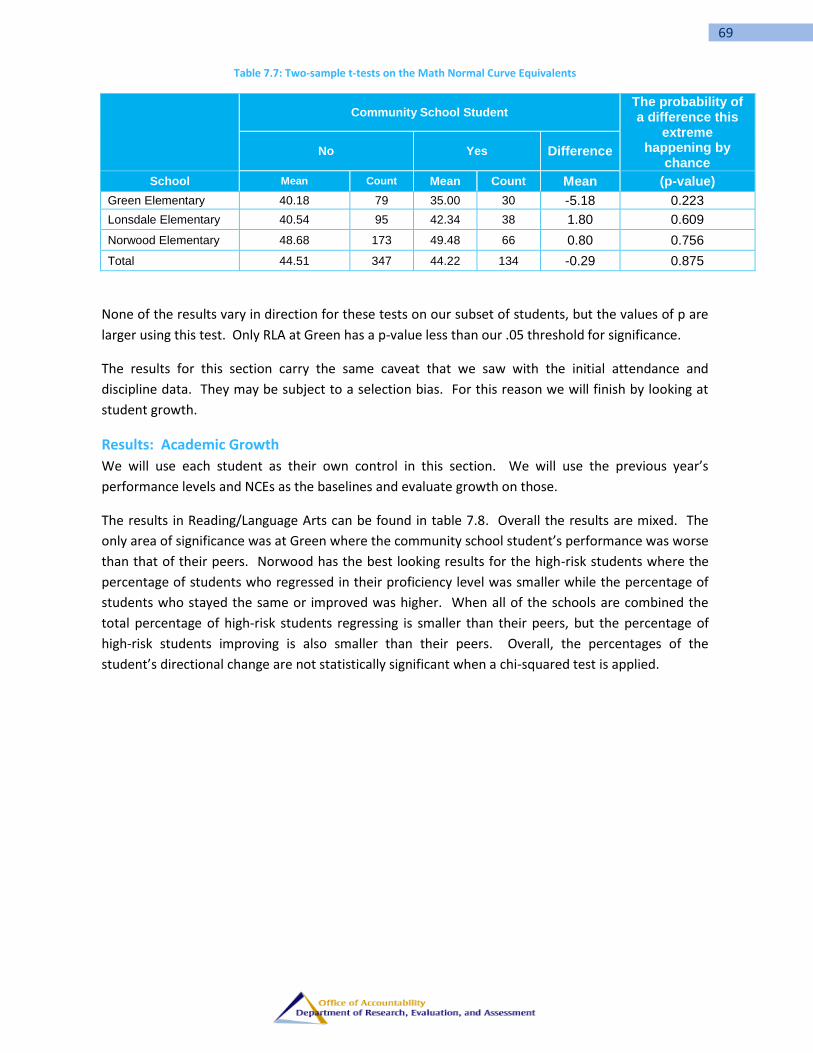
69
Table 7.7: Two-sample t-tests on the Math Normal Curve Equivalents
Community School Student The probability of a difference this
extreme happening by
chance No Yes Difference
School Mean Count Mean Count Mean (p-value)
Green Elementary 40.18 79 35.00 30 -5.18 0.223
Lonsdale Elementary 40.54 95 42.34 38 1.80 0.609
Norwood Elementary 48.68 173 49.48 66 0.80 0.756
Total 44.51 347 44.22 134 -0.29 0.875
None of the results vary in direction for these tests on our subset of students, but the values of p are
larger using this test. Only RLA at Green has a p-value less than our .05 threshold for significance.
The results for this section carry the same caveat that we saw with the initial attendance and
discipline data. They may be subject to a selection bias. For this reason we will finish by looking at
student growth.
Results: Academic Growth
We will use each student as their own control in this section. We will use the previous year’s
performance levels and NCEs as the baselines and evaluate growth on those.
The results in Reading/Language Arts can be found in table 7.8. Overall the results are mixed. The
only area of significance was at Green where the community school student’s performance was worse
than that of their peers. Norwood has the best looking results for the high-risk students where the
percentage of students who regressed in their proficiency level was smaller while the percentage of
students who stayed the same or improved was higher. When all of the schools are combined the
total percentage of high-risk students regressing is smaller than their peers, but the percentage of
high-risk students improving is also smaller than their peers. Overall, the percentages of the
student’s directional change are not statistically significant when a chi-squared test is applied.
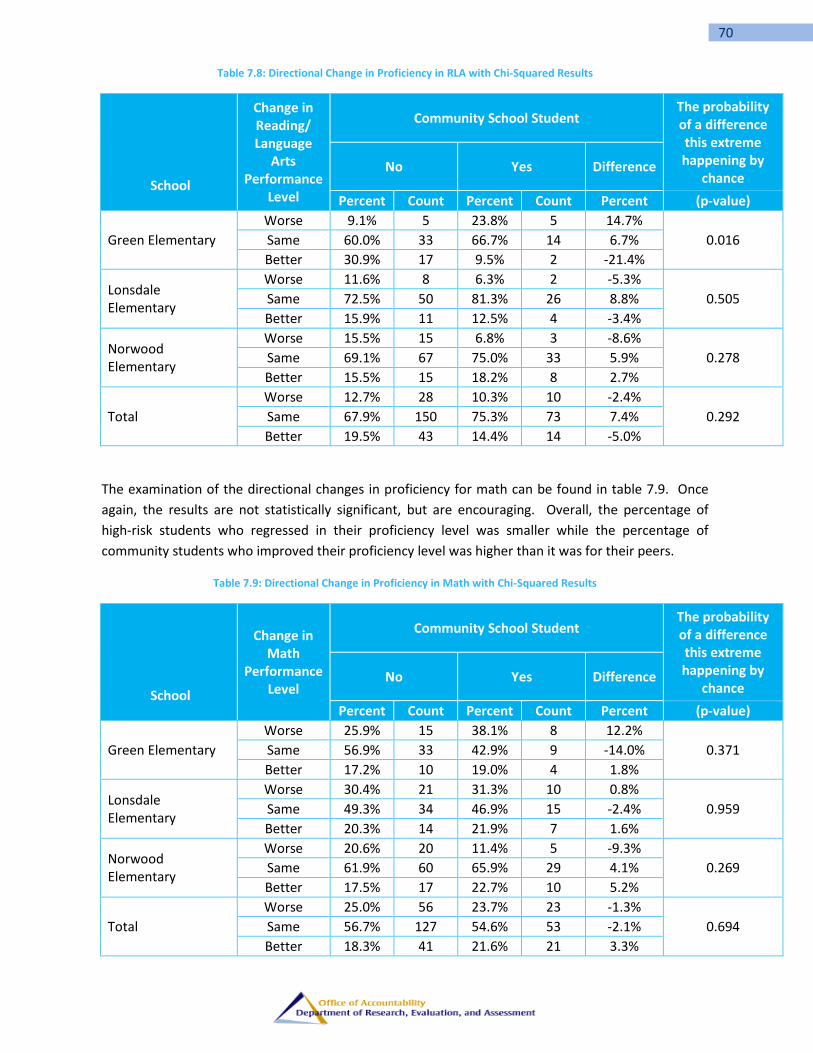
70
Table 7.8: Directional Change in Proficiency in RLA with Chi-Squared Results
School
Change in Reading/ Language
Arts Performance
Level
Community School Student The probability of a difference this extreme happening by
chance No Yes Difference
Percent Count Percent Count Percent (p-value)
Green Elementary
Worse 9.1% 5 23.8% 5 14.7%
0.016 Same 60.0% 33 66.7% 14 6.7%
Better 30.9% 17 9.5% 2 -21.4%
Lonsdale Elementary
Worse 11.6% 8 6.3% 2 -5.3%
0.505 Same 72.5% 50 81.3% 26 8.8%
Better 15.9% 11 12.5% 4 -3.4%
Norwood Elementary
Worse 15.5% 15 6.8% 3 -8.6%
0.278 Same 69.1% 67 75.0% 33 5.9%
Better 15.5% 15 18.2% 8 2.7%
Total
Worse 12.7% 28 10.3% 10 -2.4%
0.292 Same 67.9% 150 75.3% 73 7.4%
Better 19.5% 43 14.4% 14 -5.0%
The examination of the directional changes in proficiency for math can be found in table 7.9. Once
again, the results are not statistically significant, but are encouraging. Overall, the percentage of
high-risk students who regressed in their proficiency level was smaller while the percentage of
community students who improved their proficiency level was higher than it was for their peers.
Table 7.9: Directional Change in Proficiency in Math with Chi-Squared Results
School
Change in Math
Performance Level
Community School Student The probability of a difference this extreme happening by
chance No Yes Difference
Percent Count Percent Count Percent (p-value)
Green Elementary
Worse 25.9% 15 38.1% 8 12.2%
0.371 Same 56.9% 33 42.9% 9 -14.0%
Better 17.2% 10 19.0% 4 1.8%
Lonsdale Elementary
Worse 30.4% 21 31.3% 10 0.8%
0.959 Same 49.3% 34 46.9% 15 -2.4%
Better 20.3% 14 21.9% 7 1.6%
Norwood Elementary
Worse 20.6% 20 11.4% 5 -9.3%
0.269 Same 61.9% 60 65.9% 29 4.1%
Better 17.5% 17 22.7% 10 5.2%
Total
Worse 25.0% 56 23.7% 23 -1.3%
0.694 Same 56.7% 127 54.6% 53 -2.1%
Better 18.3% 41 21.6% 21 3.3%
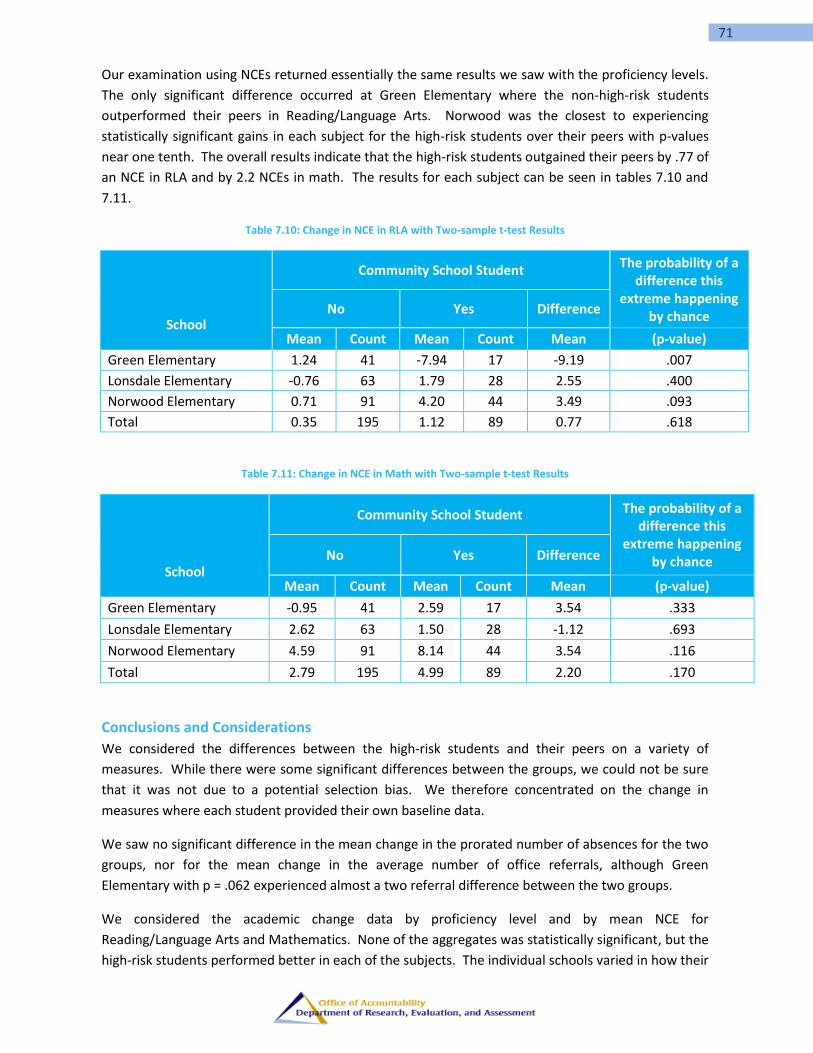
71
Our examination using NCEs returned essentially the same results we saw with the proficiency levels.
The only significant difference occurred at Green Elementary where the non-high-risk students
outperformed their peers in Reading/Language Arts. Norwood was the closest to experiencing
statistically significant gains in each subject for the high-risk students over their peers with p-values
near one tenth. The overall results indicate that the high-risk students outgained their peers by .77 of
an NCE in RLA and by 2.2 NCEs in math. The results for each subject can be seen in tables 7.10 and
7.11.
Table 7.10: Change in NCE in RLA with Two-sample t-test Results
School
Community School Student The probability of a
difference this extreme happening
by chance No Yes Difference
Mean Count Mean Count Mean (p-value)
Green Elementary 1.24 41 -7.94 17 -9.19 .007
Lonsdale Elementary -0.76 63 1.79 28 2.55 .400
Norwood Elementary 0.71 91 4.20 44 3.49 .093
Total 0.35 195 1.12 89 0.77 .618
Table 7.11: Change in NCE in Math with Two-sample t-test Results
School
Community School Student The probability of a difference this
extreme happening by chance No Yes Difference
Mean Count Mean Count Mean (p-value)
Green Elementary -0.95 41 2.59 17 3.54 .333
Lonsdale Elementary 2.62 63 1.50 28 -1.12 .693
Norwood Elementary 4.59 91 8.14 44 3.54 .116
Total 2.79 195 4.99 89 2.20 .170
Conclusions and Considerations
We considered the differences between the high-risk students and their peers on a variety of
measures. While there were some significant differences between the groups, we could not be sure
that it was not due to a potential selection bias. We therefore concentrated on the change in
measures where each student provided their own baseline data.
We saw no significant difference in the mean change in the prorated number of absences for the two
groups, nor for the mean change in the average number of office referrals, although Green
Elementary with p = .062 experienced almost a two referral difference between the two groups.
We considered the academic change data by proficiency level and by mean NCE for
Reading/Language Arts and Mathematics. None of the aggregates was statistically significant, but the
high-risk students performed better in each of the subjects. The individual schools varied in how their
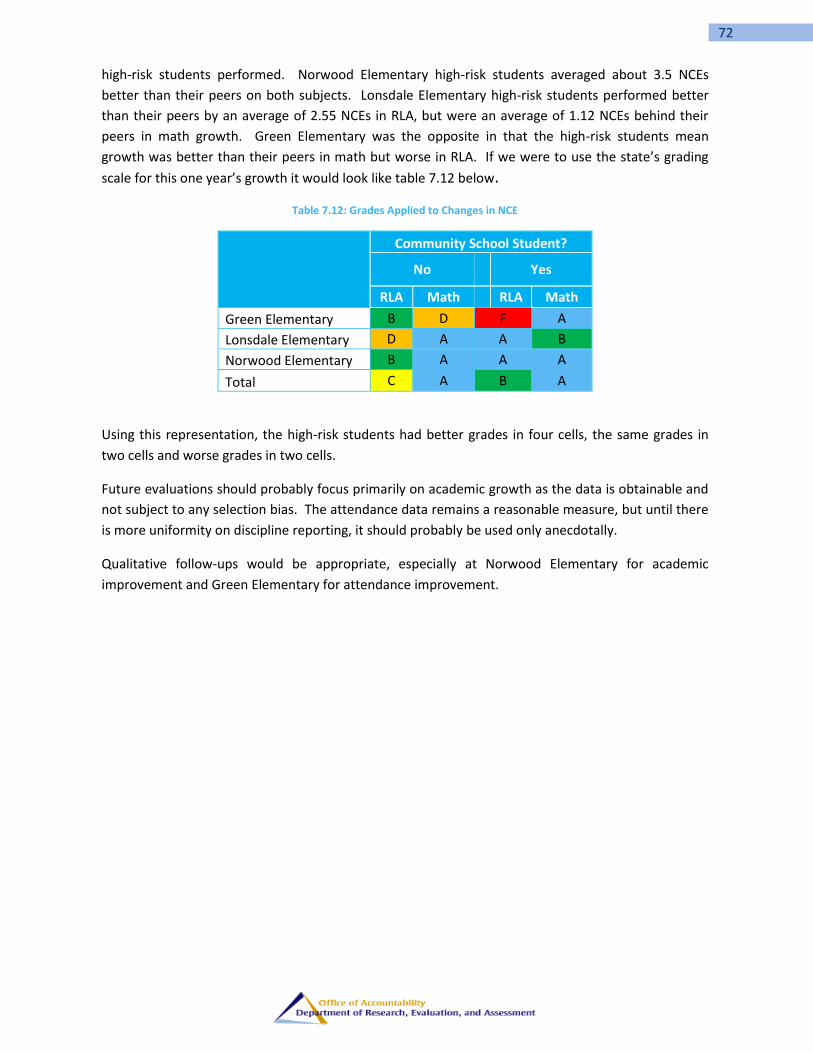
72
high-risk students performed. Norwood Elementary high-risk students averaged about 3.5 NCEs
better than their peers on both subjects. Lonsdale Elementary high-risk students performed better
than their peers by an average of 2.55 NCEs in RLA, but were an average of 1.12 NCEs behind their
peers in math growth. Green Elementary was the opposite in that the high-risk students mean
growth was better than their peers in math but worse in RLA. If we were to use the state’s grading
scale for this one year’s growth it would look like table 7.12 below.
Table 7.12: Grades Applied to Changes in NCE
Community School Student?
No
Yes
RLA Math
RLA Math
Green Elementary B D F A
Lonsdale Elementary D A A B
Norwood Elementary B A A A
Total C A B A
Using this representation, the high-risk students had better grades in four cells, the same grades in
two cells and worse grades in two cells.
Future evaluations should probably focus primarily on academic growth as the data is obtainable and
not subject to any selection bias. The attendance data remains a reasonable measure, but until there
is more uniformity on discipline reporting, it should probably be used only anecdotally.
Qualitative follow-ups would be appropriate, especially at Norwood Elementary for academic
improvement and Green Elementary for attendance improvement.
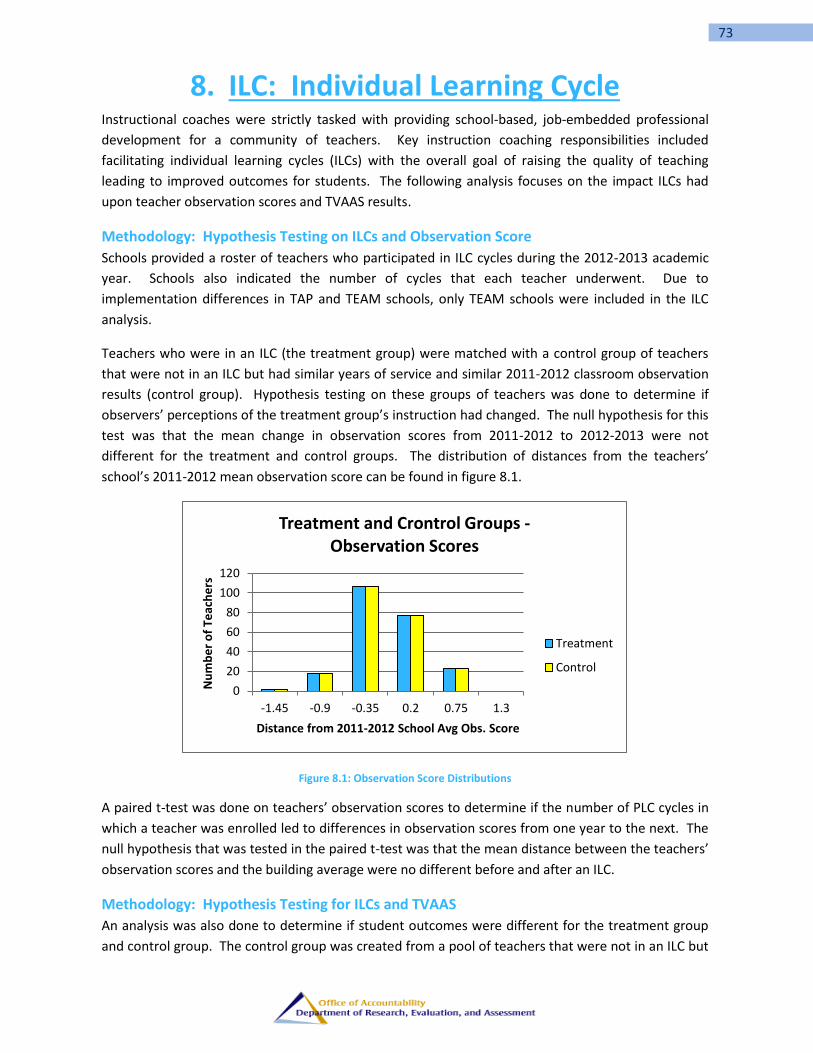
73
8. ILC: Individual Learning Cycle Instructional coaches were strictly tasked with providing school-based, job-embedded professional
development for a community of teachers. Key instruction coaching responsibilities included
facilitating individual learning cycles (ILCs) with the overall goal of raising the quality of teaching
leading to improved outcomes for students. The following analysis focuses on the impact ILCs had
upon teacher observation scores and TVAAS results.
Methodology: Hypothesis Testing on ILCs and Observation Score
Schools provided a roster of teachers who participated in ILC cycles during the 2012-2013 academic
year. Schools also indicated the number of cycles that each teacher underwent. Due to
implementation differences in TAP and TEAM schools, only TEAM schools were included in the ILC
analysis.
Teachers who were in an ILC (the treatment group) were matched with a control group of teachers
that were not in an ILC but had similar years of service and similar 2011-2012 classroom observation
results (control group). Hypothesis testing on these groups of teachers was done to determine if
observers’ perceptions of the treatment group’s instruction had changed. The null hypothesis for this
test was that the mean change in observation scores from 2011-2012 to 2012-2013 were not
different for the treatment and control groups. The distribution of distances from the teachers’
school’s 2011-2012 mean observation score can be found in figure 8.1.
Figure 8.1: Observation Score Distributions
A paired t-test was done on teachers’ observation scores to determine if the number of PLC cycles in
which a teacher was enrolled led to differences in observation scores from one year to the next. The
null hypothesis that was tested in the paired t-test was that the mean distance between the teachers’
observation scores and the building average were no different before and after an ILC.
Methodology: Hypothesis Testing for ILCs and TVAAS
An analysis was also done to determine if student outcomes were different for the treatment group
and control group. The control group was created from a pool of teachers that were not in an ILC but
0
20
40
60
80
100
120
-1.45 -0.9 -0.35 0.2 0.75 1.3
Nu
mb
er
of
Teac
he
rs
Distance from 2011-2012 School Avg Obs. Score
Treatment and Crontrol Groups - Observation Scores
Treatment
Control

74
had similar years of service and similar TVAAS indices in 2011-2012. An estimated TVAAS composite
index was created from RLA/English and Math/Algebra gains and standard errors (using SAS
calculation procedures). A delta TVAAS index was calculated as the estimated TVAAS composite index
from 2012-2013 minus the estimated TVAAS composite index from 2011-2012. Hypothesis testing on
the delta TVAAS was conducted to determine if student outcomes were different between the
treatment and control groups. The null hypothesis for this test was that the delta TVAAS indices from
2011-2012 to 2012-2013 were no different for the treatment and control groups. The distributions
on 2011-2012 estimated TVAAS composite index for both the treatment group and the control group
can be found in figure 8.2.
Figure 8.2: TVAAS distributions for Treatment and Control Groups
Results: Hypothesis Testing on ILCs and Observation Scores
The raw TEAM observation score (observations plus professionalism ratings) was difficult to use in the
analysis because of school-to-school variation in the mean TEAM observation score. To remove the
school-to-school variation in the TEAM observation score, the difference between a teacher’s score
and the mean TEAM score in each school (and in each year of study) was calculated. A delta was
calculated as the difference between the teacher’s score and the school‘s mean in 2013-2012 minus
the difference between the teacher’s score and the school’s mean in 2011-2012. Table 8.1 and figure
8.1 both indicate that, on average, the control and treatment groups were below their school’s
average observation score in 2011-2012. Figure 8.3 and table 8.2 contain the results of the
hypothesis testing on the change in observation score from 2011-2012 to 2012-2013.
0
5
10
15
20
25
-2.5 0 2.5 5 12
Nu
mb
er
of
TEac
he
rs
2011-2012 Estimated TVAAS Composite Index
Treatment and Control Groups - TVAAS
Treatment
Control
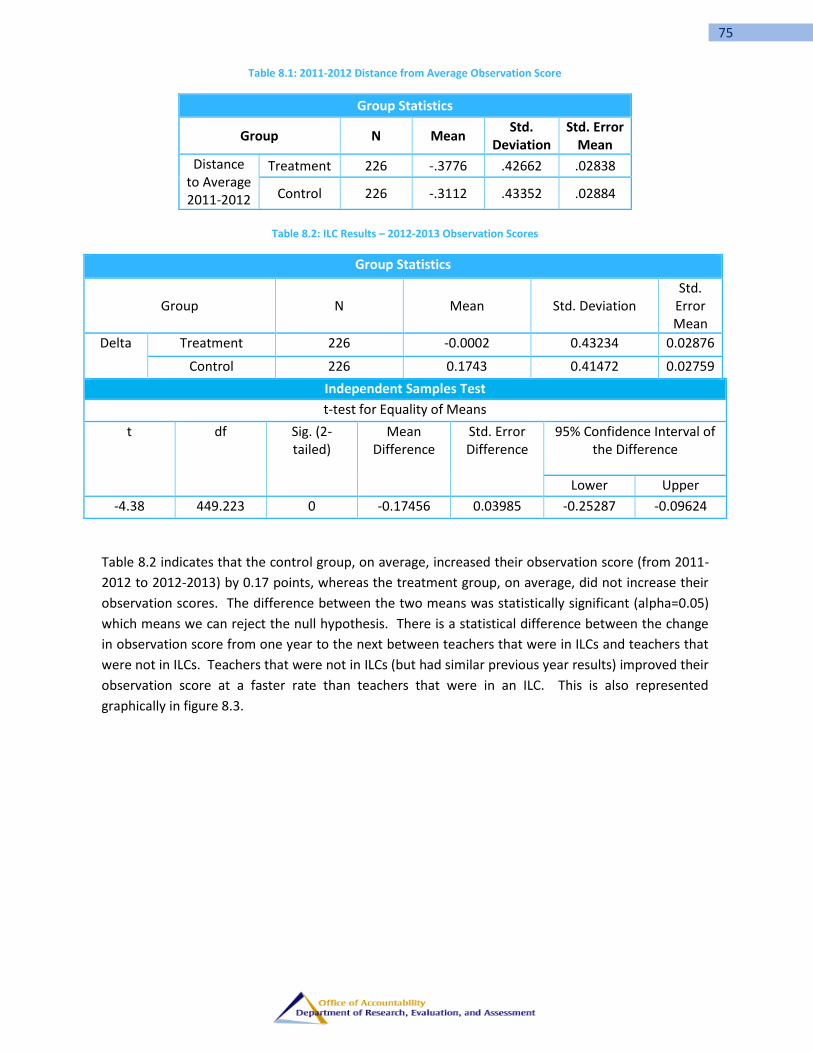
75
Table 8.1: 2011-2012 Distance from Average Observation Score
Group Statistics
Group N Mean Std.
Deviation Std. Error
Mean
Distance to Average 2011-2012
Treatment 226 -.3776 .42662 .02838
Control 226 -.3112 .43352 .02884
Table 8.2: ILC Results – 2012-2013 Observation Scores
Group Statistics
Group N Mean Std. Deviation Std.
Error Mean
Delta Treatment 226 -0.0002 0.43234 0.02876
Control 226 0.1743 0.41472 0.02759
Independent Samples Test
t-test for Equality of Means
t df Sig. (2-tailed)
Mean Difference
Std. Error Difference
95% Confidence Interval of the Difference
Lower Upper
-4.38 449.223 0 -0.17456 0.03985 -0.25287 -0.09624
Table 8.2 indicates that the control group, on average, increased their observation score (from 2011-
2012 to 2012-2013) by 0.17 points, whereas the treatment group, on average, did not increase their
observation scores. The difference between the two means was statistically significant (alpha=0.05)
which means we can reject the null hypothesis. There is a statistical difference between the change
in observation score from one year to the next between teachers that were in ILCs and teachers that
were not in ILCs. Teachers that were not in ILCs (but had similar previous year results) improved their
observation score at a faster rate than teachers that were in an ILC. This is also represented
graphically in figure 8.3.
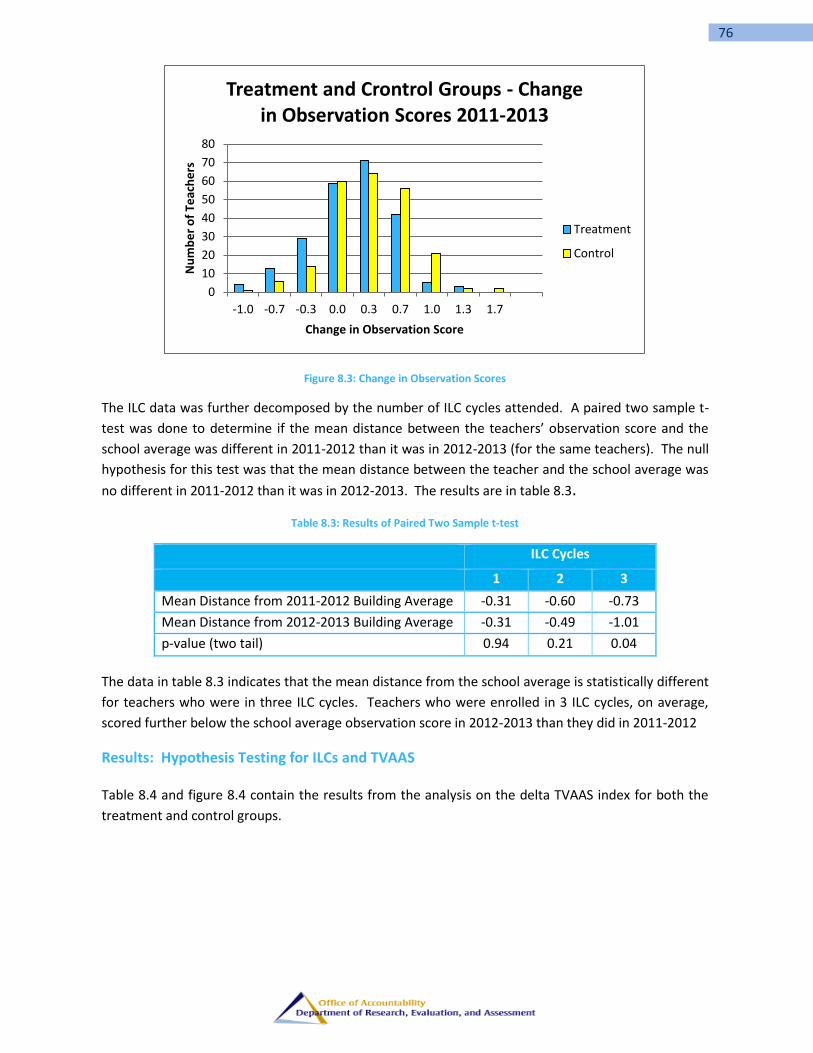
76
Figure 8.3: Change in Observation Scores
The ILC data was further decomposed by the number of ILC cycles attended. A paired two sample t-
test was done to determine if the mean distance between the teachers’ observation score and the
school average was different in 2011-2012 than it was in 2012-2013 (for the same teachers). The null
hypothesis for this test was that the mean distance between the teacher and the school average was
no different in 2011-2012 than it was in 2012-2013. The results are in table 8.3.
Table 8.3: Results of Paired Two Sample t-test
ILC Cycles
1 2 3
Mean Distance from 2011-2012 Building Average -0.31 -0.60 -0.73
Mean Distance from 2012-2013 Building Average -0.31 -0.49 -1.01
p-value (two tail) 0.94 0.21 0.04
The data in table 8.3 indicates that the mean distance from the school average is statistically different
for teachers who were in three ILC cycles. Teachers who were enrolled in 3 ILC cycles, on average,
scored further below the school average observation score in 2012-2013 than they did in 2011-2012
Results: Hypothesis Testing for ILCs and TVAAS
Table 8.4 and figure 8.4 contain the results from the analysis on the delta TVAAS index for both the
treatment and control groups.
0
10
20
30
40
50
60
70
80
-1.0 -0.7 -0.3 0.0 0.3 0.7 1.0 1.3 1.7
Nu
mb
er
of
Teac
he
rs
Change in Observation Score
Treatment and Crontrol Groups - Change in Observation Scores 2011-2013
Treatment
Control
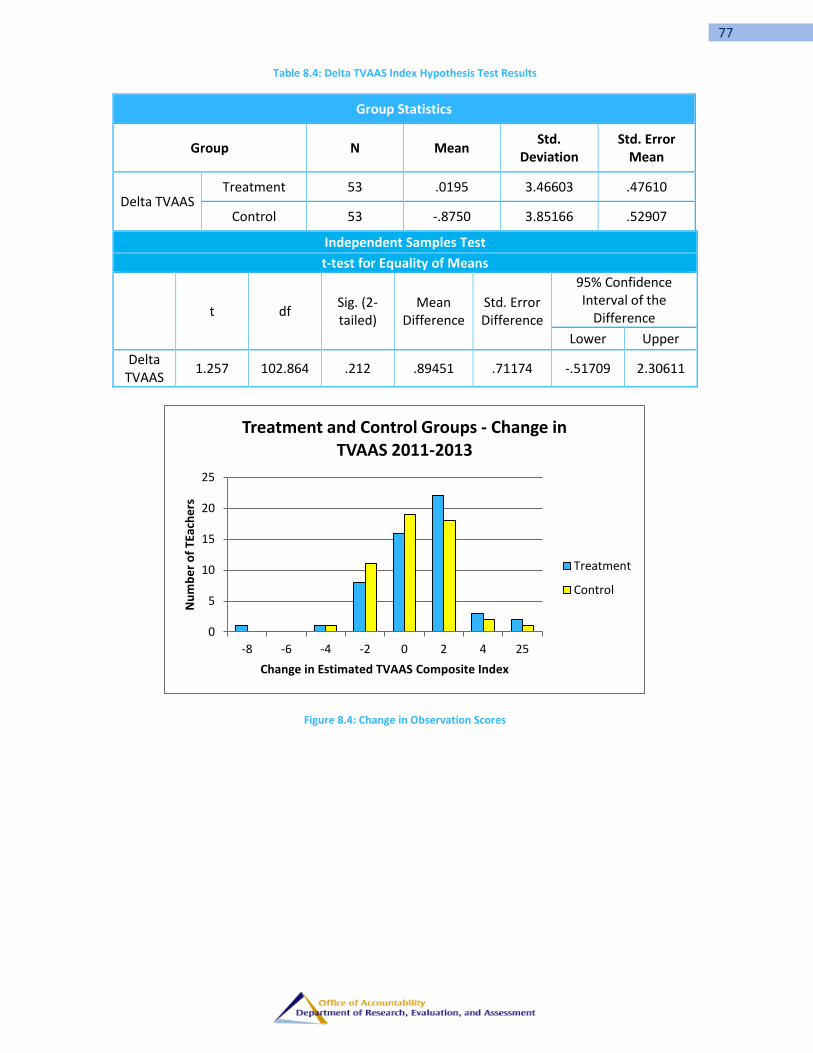
77
Table 8.4: Delta TVAAS Index Hypothesis Test Results
Group Statistics
Group N Mean Std.
Deviation Std. Error
Mean
Delta TVAAS Treatment 53 .0195 3.46603 .47610
Control 53 -.8750 3.85166 .52907
Independent Samples Test
t-test for Equality of Means
t df
Sig. (2-tailed)
Mean Difference
Std. Error Difference
95% Confidence Interval of the
Difference
Lower Upper
Delta TVAAS
1.257 102.864 .212 .89451 .71174 -.51709 2.30611
Figure 8.4: Change in Observation Scores
0
5
10
15
20
25
-8 -6 -4 -2 0 2 4 25
Nu
mb
er
of
TEac
he
rs
Change in Estimated TVAAS Composite Index
Treatment and Control Groups - Change in TVAAS 2011-2013
Treatment
Control

78
Results indicate that the treatment group increased their mean change in
TVAAS index from 2011-2012 to 2012-2013, whereas the control group
decreased in mean TVAAS index in the same time periods. However,
there was no statistical difference between the mean change in TVAAS
index from 2011-2012 to 2012-2013 when the treatment and control
groups were compared (alpha = 0.5).
Sample sizes were too small to do a pairwise analysis relating the number
of ILC cycles to changes in TVAAS scores while controlling for years of
service. Restrictions that individuals had to have two years of TVAAS data,
be at a TEAM school, and be able to be matched limited the sizes of the
samples for both the control and treatment groups in this analysis.
Conclusions and Considerations
The difficulty with interpretations of the results of this study hinges on the
timing of the coaching cycles. Some teachers who were enrolled in a
single ILC cycle were exposed to instructional coaching in the fall, while
other teachers were not exposed to the instructional coaching until the
second semester. There may have been insufficient time for new or
refined classroom strategies to take hold and influence the outcome data
that is being analyzed. A more complete analysis of those that underwent
ILCs in 2012-2013 can be done once the 2013-2014 observation and
TVAAS data is available.
Keeping this caveat in mind, there was no statistical evidence of increases
in mean outcome data based on participation in an ILC. The mean
observation scores for teachers who did not participate in an ILC
increased at a higher, statistically significant, rate than teachers who
participated in an ILC.
According to the data, the mean observation score for teachers enrolled
in 3 ILC cycles fell further behind the school average than teachers that
were enrolled in fewer cycles. This may indicate that teachers that were
assigned this level of support may need a different type of support (such
as the Intensive Assistance Program) to show improvement.
Although there were no statistically significant differences in the change
in mean TVAAS scores from one year to the next, the mean increase in the
treatment group was higher than that of the control group. This may
indicate that the lessons learned through the course of the ILC were
starting to pay dividends. The analysis should be repeated with outcome
data from 2013-2014 to determine if any sustainable gains occurred.

79
9. PLC: Professional Learning Communities Instructional coaches provide school-based, job-embedded professional development for a
community of teachers in order to raise the quality of teaching and learning across a school and build
collective leadership to improve outcomes for students. Instructional coaches typically model
lessons; provide and interpret data with principals and faculty; facilitate PLC and ILC meetings; and
help screen students for interventions, all by way of SMART goals. SMART stands for specific,
measurable, attainable, relevant, and time-bound—these goals are used to promote performance
measurement.
Methodology
SMART goals were set for each coach in coordination with supervisors. These goals were typically
tied to PLCs by way of individual schools, grade levels, and content area. Goal attainment was
recorded at the end of each PLC cycle and the data was then sorted by school, grade, and content
area. Since there are no students directly tied to coaches, school results were used as a proxy
outcome measure. In particular, for each participating school, we used the school’s 2012-2013 TVAAS
growth index by grade level and subject area as a measure of overall school performance. The
growth index was calculated by dividing the school TVAAS gain (difference between last year and the
current year’s score) in the given grade and subject by its standard error. For example,
School Grade Subject Growth
Measure Gain Std
Error Growth Index
Sample Third Science 1.8 0.2 1.8/0.2 = 9
Sample Third Math 2.7 1.5 2.7/1.5 = 1.8
Then, using that growth index, we matched it to the SMART goals within the school based on the
grade and subject. This is reflected in the table below.
Elementary School
Grade Subject Growth Index Smart Goal Achieved?
Sample School Sixth Science 1.9 Yes
Sample School Sixth Reading 6.7 No
We wanted to see if, at the school level, meeting SMART goals aligned with the TVAAS Growth Index.
We used a t-test to see if the two groups performed differently—in this case, the two groups are
based on “yes” and “no” answers for SMART goal attainment. The null hypothesis tested was that the
mean TVAAS growth index was no different for the schools/grade/subject combination that achieved
SMART goals and those that did not. The sample size was 604 SMART goals across 72 schools for the
2012-2013 school year.
In addition to an overall look at SMART goal attainment across all schools, we also separated TEAM
and TAP schools and compared their mean TVAAS growth index using a t-test. The main reason for
differentiating TEAM from TAP schools is that TAP schools have “clusters” that function much like
PLCs.
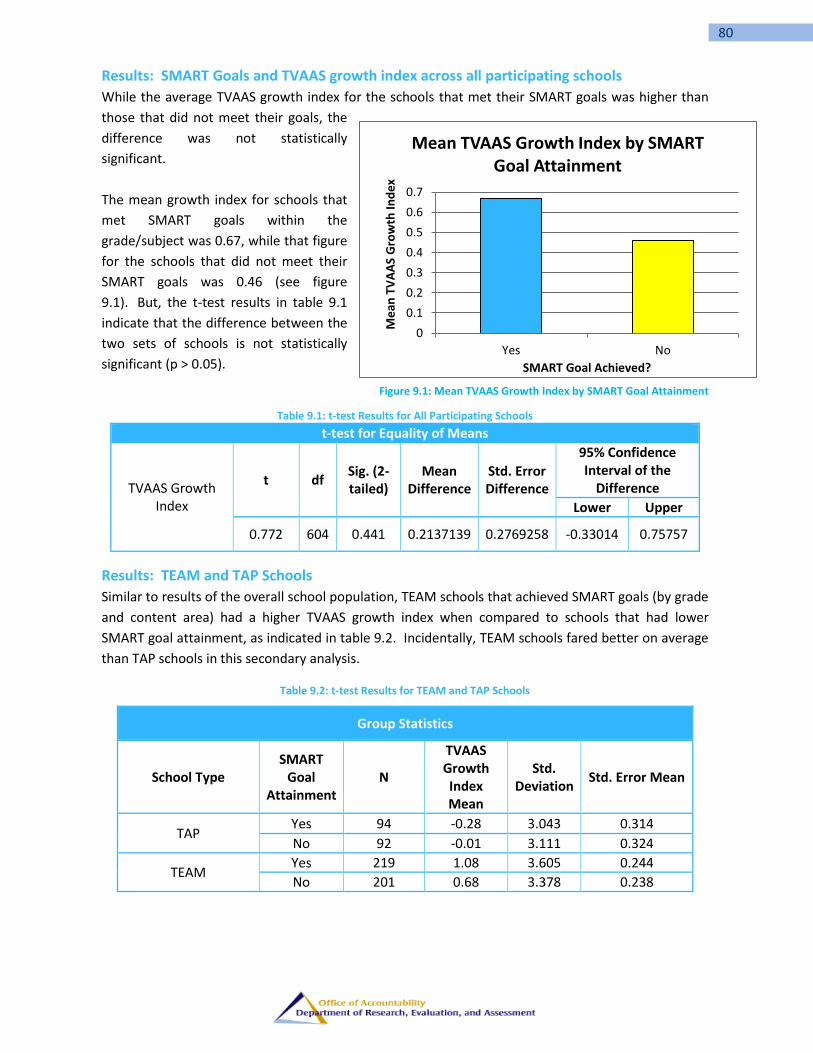
80
0
0.1
0.2
0.3
0.4
0.5
0.6
0.7
Yes No
Me
an T
VA
AS
Gro
wth
Ind
ex
SMART Goal Achieved?
Mean TVAAS Growth Index by SMART Goal Attainment
Results: SMART Goals and TVAAS growth index across all participating schools
While the average TVAAS growth index for the schools that met their SMART goals was higher than
those that did not meet their goals, the
difference was not statistically
significant.
The mean growth index for schools that
met SMART goals within the
grade/subject was 0.67, while that figure
for the schools that did not meet their
SMART goals was 0.46 (see figure
9.1). But, the t-test results in table 9.1
indicate that the difference between the
two sets of schools is not statistically
significant (p > 0.05).
Figure 9.1: Mean TVAAS Growth Index by SMART Goal Attainment
Table 9.1: t-test Results for All Participating Schools
t-test for Equality of Means
TVAAS Growth Index
t df Sig. (2-tailed)
Mean Difference
Std. Error Difference
95% Confidence Interval of the
Difference
Lower Upper
0.772 604 0.441 0.2137139 0.2769258 -0.33014 0.75757
Results: TEAM and TAP Schools
Similar to results of the overall school population, TEAM schools that achieved SMART goals (by grade
and content area) had a higher TVAAS growth index when compared to schools that had lower
SMART goal attainment, as indicated in table 9.2. Incidentally, TEAM schools fared better on average
than TAP schools in this secondary analysis.
Table 9.2: t-test Results for TEAM and TAP Schools
Group Statistics
School Type SMART
Goal Attainment
N
TVAAS Growth Index Mean
Std. Deviation
Std. Error Mean
TAP Yes 94 -0.28 3.043 0.314
No 92 -0.01 3.111 0.324
TEAM Yes 219 1.08 3.605 0.244
No 201 0.68 3.378 0.238
81
Conclusions and Considerations
Due to the lack of statistically significant results, we cannot
conclusively say that SMART goal attainment is tied to student learning
outcomes. However, the lack of a significant relationship between
school performance and SMART goal attainment may be partly due to
a lack of robustness of SMART goals, as well as PLC implementation.
As such, developing high quality SMART goals and ensuring fidelity of
implementation in PLC sessions are concerns that the Professional
Development Director is working to address and implement
throughout the coaches network and in schools.
Looking forward, it will be more informative to have coaches tied to
the teachers with whom they work the most because we can use
teachers’ individual TVAAS scores in the analysis, as well as school
growth. Changes have been made to the collection form coaches use
to track PLC and SMART goal data, which should permit teacher level
TVAAS and SMART goal analysis, which can be used in addition to
school-level analysis.

82
10. Lead Teachers Lead teachers provide instructional support and coaching, as well as rate classroom observations in
conjunction with the TEAM formal evaluation process. Lead teachers plan and lead building level
staff development, especially pertaining to the TEAM classroom observation rubric. They facilitate
and lead PLC sessions to support the use of research-based teaching and learning strategies. Lead
teachers are also tasked with helping analyze school-wide data, participating in the development of
school improvement plans and SMART goals.
There were approximately 240 lead teachers in the district during the 2012-13 school year. Over half
were in elementary schools, while the remaining half was split between middle (20%) and high
schools (30%).
Methodology
Since one of the major goals in the coaching model is to increase the number of observations by a
lead teacher, we simply took the number of observations per school and found the percent of
observations done by a lead teacher. The results are in table 10.1.
Results: Observations by Lead Teachers
As a district, approximately 35% of observations were done by lead teachers. The goal for the 2012-
2013 school year was set at 30%, so the district met its goal. Some schools had almost half of their
observations conducted by lead teachers; Mooreland Heights topped all other schools with over 70%
of observations in the building done by a lead teacher. (Please note that at Mooreland Heights the
Arts360 coordinator was also a lead teacher, and, as such, completed more observations than typical
at other schools.)
Table 10.1: Percent of Observations by a Lead Teacher
School Name Percent of
Observations by Lead Teacher
A.L. Lotts Elementary 34.8%
Adrian Burnett Elementary 30.0%
Amherst Elementary 38.0%
Ball Camp Elementary 64.4%
Bearden Elementary 46.7%
Bearden High 22.0%
Bearden Middle 37.0%
Beaumont Elementary/Magnet 30.6%
Blue Grass Elementary 46.0%
Bonny Kate Elementary 48.5%
Brickey McCloud Elementary 26.4%
Byington-Solway CTE Center 0.0%
Carter Elementary 39.7%
Cedar Bluff Elementary 45.1%
Cedar Bluff Middle 18.2%

83
School Name Percent of
Observations by Lead Teacher
Central High 38.4%
Chilhowee Intermediate 40.0%
Christenberry Elementary 41.1%
Copper Ridge Elementary 13.3%
Corryton Elementary 37.8%
Kelley Volunteer Academy 0.0%
Fair Garden 34.5%
Farragut High 41.2%
Farragut Intermediate 47.5%
Farragut Middle 40.7%
Farragut Primary 48.3%
Fountain City Elementary 12.5%
Ft. Sanders 0.0%
Fulton High 26.6%
Gap Creek Elementary 25.0%
Gibbs Elementary 35.6%
Gibbs High 38.7%
Green Magnet 40.3%
Gresham Middle 51.6%
Halls Elementary 61.9%
Halls High 54.2%
Halls Middle 43.6%
Hardin Valley Academy 39.6%
Hardin Valley Elementary 35.2%
Inskip Elementary 60.2%
Karns Elementary 21.7%
Karns High 57.1%
Karns Middle 36.5%
Knox Adaptive Education Center 22.9%
Knox Consolidated 1.3%
Knox County Adult High 0.0%
Knox County's Central Office 7.4%
Knox County Stem Academy 0.0%
Maynard Elementary 26.5%
Mooreland Heights Elementary 70.8%
Mt Olive Elementary 60.7%
New Hopewell Elementary 32.1%
North Knox Career and Tec 54.2%
Northshore Elementary 39.4%
Norwood Elementary 12.9%
Pleasant Ridge Elementary 13.8%
Powell Elementary 44.4%
Powell High 54.7%
Powell Middle 44.1%

84
School Name Percent of
Observations by Lead Teacher
Richard Yoakley 1.6%
Ridgedale Alternative 12.0%
Rocky Hill Elementary 42.7%
Sam E. Hill Family 36.7%
Sequoyah Elementary 43.5%
Shannondale Elementary 44.1%
South Knox Elementary 30.8%
Sterchi Elementary 40.3%
Sunnyview Primary 31.9%
West High 43.2%
West Hills Elementary 37.7%
West Valley Middle 41.8%
Whittle Springs Middle 21.5%
District 35.3%
It should be noted that TAP schools do not have lead teachers, and therefore, were excluded from the
table above.
Conclusions and Considerations
While the goal to increase the number of observations by a lead teacher was met, did it achieve its
intended outcome? Teacher survey data indicates that only 20% of teachers feel the observation
process has a meaningful impact on their professional growth. Moving forward, our evaluation of
lead teachers should include additional metrics and outcome data to analyze the effectiveness of the
program. Proper training and certification in the TEAM system is also a critical component to ensure
lead teacher effectiveness. There is a small, measurable relationship between schools that are
implementing TEAM with greater fidelity and the TVAAS index gains demonstrated by teachers at
those schools. Principal survey data indicates that the observation rubric and process is a valuable
tool for impacting teacher effectiveness, though this perception has not necessarily trickled down to
the teacher level.
85
11. All Star All Star Tutoring is an after-school tutoring program for students in grades 3 through 5 with certified
teachers. Knox County Schools implemented the All-Star after-school tutoring program in 2012-2013
in an effort to raise performance on elementary TCAP and SAT10 test results. The schools
participating in the program were Adrian Burnett, Amherst, Ball Camp, Bearden, Beaumont, Belle
Morris, Brickey-McCloud, Christenberry, Copper Ridge, East Knox, Green, Halls, Lonsdale, Maynard,
New Hopewell, Norwood, Pond Gap, Powell, Ritta, Sarah Moore Greene, Sterchi, and West Hills
Elementary Schools. Schools were directed to enroll students whom they felt were most likely to
move from basic to proficient, but in practice, there was little consistency in the criteria driving
student enrollment in the tutoring program. This program offered 25-minute tutoring sessions twice
a week for 21 weeks. Students were provided an additional 1.5 hours of instruction in both reading
and math.
The tutoring itself was centered on instruction in both Math and Reading and the two subject areas
were analyzed separately. The aggregate data was analyzed to determine if All-star Tutoring, as a
whole, was successful in meeting its program goals. The analysis was also extended to the school
level to attempt to pinpoint localized successes.
Methodology
The analysis used multiple analysis methods to quantify the success of the program. The outcome
data in the analysis was the 2012-2013 4th and 5th grade TCAP data. Only students who were in the 4th
and 5th grade could be used for the analysis, as this was the subset of students who had test results in
both 2011-2012 and 2012-2013. This was not ideal for the analysis, as the tutoring program targeted
students beyond these grade levels.
Schools provided a roster of students that participated in the tutoring program. Students were
screened to determine which individuals had test results from both 2011-2012 and 2012-2013. A
control group was created from a pool of students at the same subset of schools who had the same
distribution of 2011-2012 normal curve equivalents (NCEs). Control group students were randomly
selected from the pool of available students to provide the same number of students with the same
predicted score distribution in the control group compared to the tutored (treatment) group. The
distribution of 2011-2012 subject specific NCEs for either group is available in figures 11.1 and 11.2.

86
Figure 11.1: Distribution of 2011-2012 TCAP RLA NCEs
Figure 11.2: Distribution of 2011-2012 TCAP Math NCEs
As evident from figure 11.1, the program seemed to target students with mid to low RLA
performance. Approximately 70% of students in the screened group fell between the 20th and 60th
percentiles in 2011-2012 RLA TCAP results. The distribution of math NCEs was more normally
distributed, with 55% of students between the 20th and 60th percentiles.
0
20
40
60
80
100
120
140
1 t
o 5
5 t
o 1
0
10
to
15
15
to
20
20
to
25
25
to
30
30
to
35
35
to
40
40
to
45
45
to
50
50
to
55
55
to
60
60
to
65
65
to
70
70
to
75
75
to
80
80
to
85
85
to
90
90
to
95
95
to
99
Co
un
t o
f St
ud
en
ts
2011-2012 TCAP NCE
Distribution of 2011-2012 TCAP NCEs for Treatment and Control Group: RLA
Treatment
Control
0102030405060708090
100
1 t
o 5
5 t
o 1
0
10
to
15
15
to
20
20
to
25
25
to
30
30
to
35
35
to
40
40
to
45
45
to
50
50
to
55
55
to
60
60
to
65
65
to
70
70
to
75
75
to
80
80
to
85
85
to
90
90
to
95
95
to
99
Co
un
t o
f St
ud
en
ts
2011-2012 TCAP NCE
Distribution of 2011-2012 TCAP NCEs for Treatment and Control Group: Math
Treatment
Control

87
The final program analysis compared the distributions of 2012-2013 subject-specific NCEs to note any
trends in the data between the control and treatment groups.
Methodology: Hypothesis test
Hypothesis testing was done to determine if there was a statistical difference in the subject specific
mean TCAP exam scores of the treatment and control groups. The null hypothesis was that there was
no difference between the mean TCAP exam score between the control and treatment groups.
Methodology: Chi-squared test
A chi-squared test was used to determine if more students increased proficiency levels in the control
or treatment group. The null hypothesis was that there was no difference in the distribution of
students moving through proficiency levels between the control and treatment groups.
Methodology: Linear Regression
Linear regression was also used to determine relative performance of the control and treatment
groups at each NCE for each subject.
Results
The distributions of 2012-2013 subject specific TCAP exam scores for the treatment and control
groups are contained in figures 11.3 and 11.4.
Figure 11.3: 2012-2013 RLA TCAP Exam Scores Distributions
Figure 11.3 indicates that the treatment group had fewer students’ score in the lowest NCEs (1 to 30)
and the highest NCEs (60-99). Tutored students concentrated in the 30-60 NCE range.
0
20
40
60
80
100
120
140
1 t
o 5
5 t
o 1
0
10
to
15
15
to
20
20
to
25
25
to
30
30
to
35
35
to
40
40
to
45
45
to
50
50
to
55
55
to
60
60
to
65
65
to
70
70
to
75
75
to
80
80
to
85
85
to
90
90
to
95
95
to
99Nu
mb
er
of
Stu
de
nts
Sco
rin
g
2012-2013 TCAP Exam Score
Distribution of 2012-2013 TCAP Exam Scores After Treatment: RLA
Control
Treatment
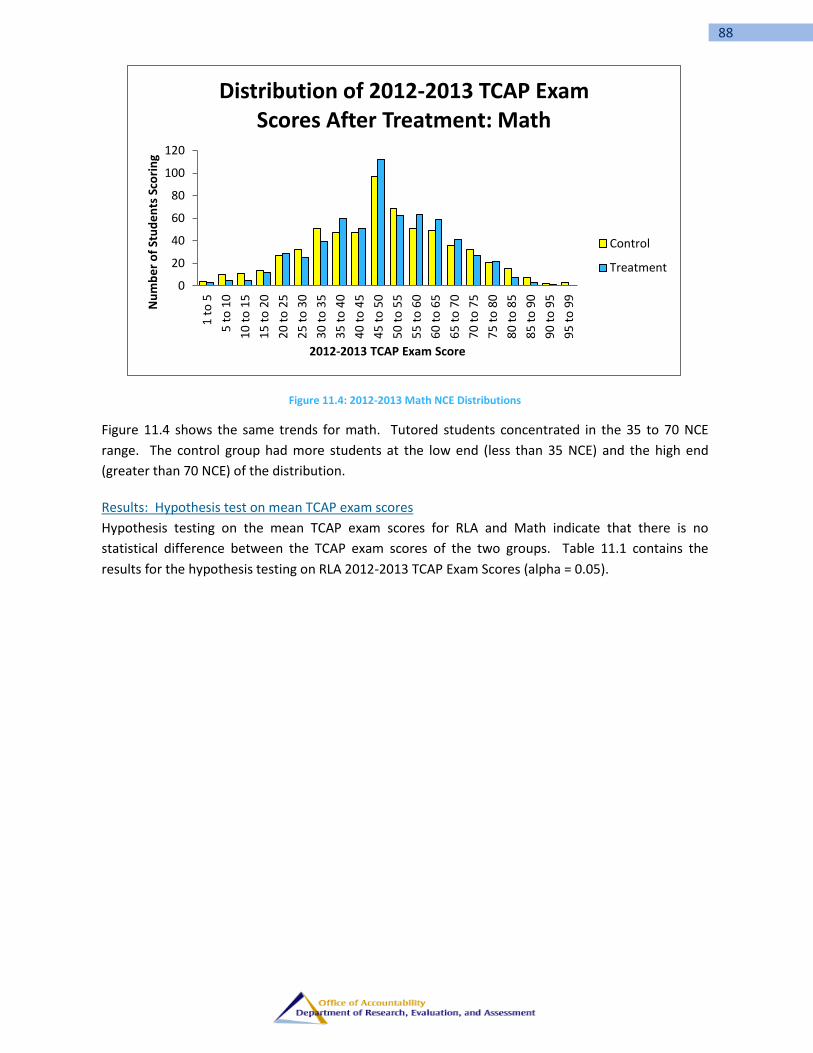
88
Figure 11.4: 2012-2013 Math NCE Distributions
Figure 11.4 shows the same trends for math. Tutored students concentrated in the 35 to 70 NCE
range. The control group had more students at the low end (less than 35 NCE) and the high end
(greater than 70 NCE) of the distribution.
Results: Hypothesis test on mean TCAP exam scores
Hypothesis testing on the mean TCAP exam scores for RLA and Math indicate that there is no
statistical difference between the TCAP exam scores of the two groups. Table 11.1 contains the
results for the hypothesis testing on RLA 2012-2013 TCAP Exam Scores (alpha = 0.05).
0
20
40
60
80
100
120
1 t
o 5
5 t
o 1
0
10
to
15
15
to
20
20
to
25
25
to
30
30
to
35
35
to
40
40
to
45
45
to
50
50
to
55
55
to
60
60
to
65
65
to
70
70
to
75
75
to
80
80
to
85
85
to
90
90
to
95
95
to
99
Nu
mb
er
of
Stu
de
nts
Sco
rin
g
2012-2013 TCAP Exam Score
Distribution of 2012-2013 TCAP Exam Scores After Treatment: Math
Control
Treatment
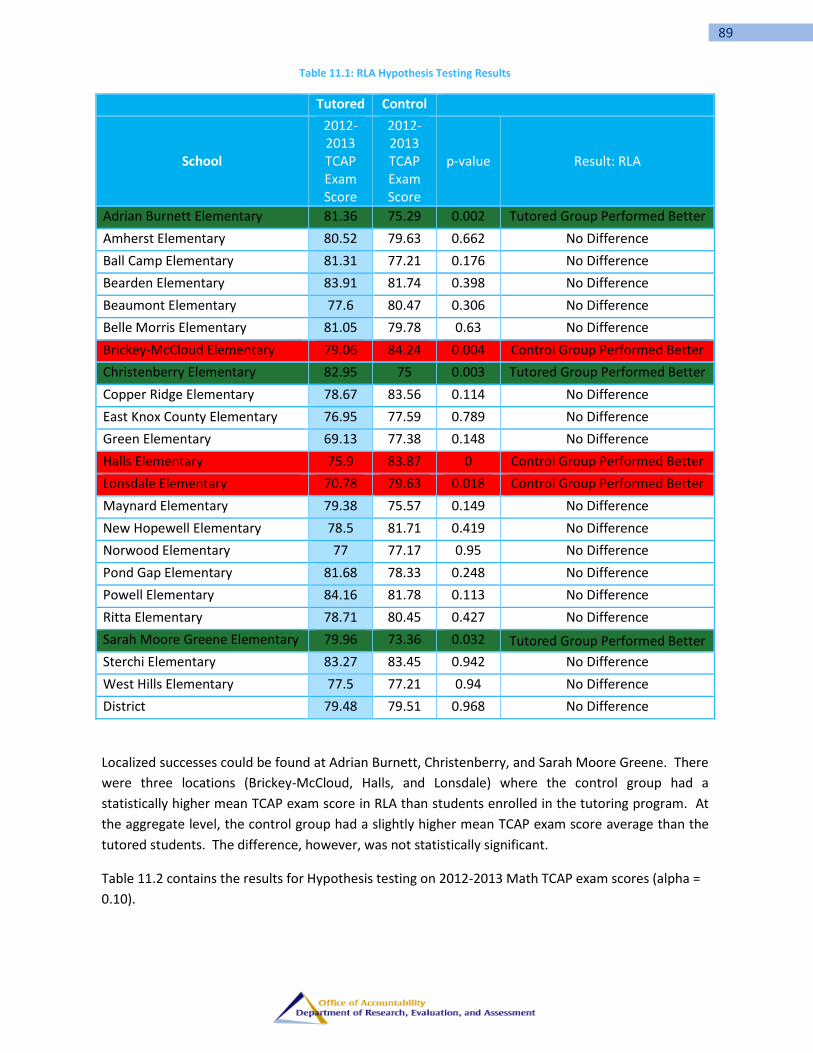
89
Table 11.1: RLA Hypothesis Testing Results
Tutored Control
School
2012-2013 TCAP Exam Score
2012-2013 TCAP Exam Score
p-value Result: RLA
Adrian Burnett Elementary 81.36 75.29 0.002 Tutored Group Performed Better
Amherst Elementary 80.52 79.63 0.662 No Difference
Ball Camp Elementary 81.31 77.21 0.176 No Difference
Bearden Elementary 83.91 81.74 0.398 No Difference
Beaumont Elementary 77.6 80.47 0.306 No Difference
Belle Morris Elementary 81.05 79.78 0.63 No Difference
Brickey-McCloud Elementary 79.06 84.24 0.004 Control Group Performed Better
Christenberry Elementary 82.95 75 0.003 Tutored Group Performed Better
Copper Ridge Elementary 78.67 83.56 0.114 No Difference
East Knox County Elementary 76.95 77.59 0.789 No Difference
Green Elementary 69.13 77.38 0.148 No Difference
Halls Elementary 75.9 83.87 0 Control Group Performed Better
Lonsdale Elementary 70.78 79.63 0.018 Control Group Performed Better
Maynard Elementary 79.38 75.57 0.149 No Difference
New Hopewell Elementary 78.5 81.71 0.419 No Difference
Norwood Elementary 77 77.17 0.95 No Difference
Pond Gap Elementary 81.68 78.33 0.248 No Difference
Powell Elementary 84.16 81.78 0.113 No Difference
Ritta Elementary 78.71 80.45 0.427 No Difference
Sarah Moore Greene Elementary 79.96 73.36 0.032 Tutored Group Performed Better
Sterchi Elementary 83.27 83.45 0.942 No Difference
West Hills Elementary 77.5 77.21 0.94 No Difference
District 79.48 79.51 0.968 No Difference
Localized successes could be found at Adrian Burnett, Christenberry, and Sarah Moore Greene. There
were three locations (Brickey-McCloud, Halls, and Lonsdale) where the control group had a
statistically higher mean TCAP exam score in RLA than students enrolled in the tutoring program. At
the aggregate level, the control group had a slightly higher mean TCAP exam score average than the
tutored students. The difference, however, was not statistically significant.
Table 11.2 contains the results for Hypothesis testing on 2012-2013 Math TCAP exam scores (alpha =
0.10).

90
Table 11.2: Math Hypothesis Testing Results
Tutored Control
School
2012-2013 TCAP Exam Score
2012-2013 TCAP Exam Score
p value
Result: Math
Adrian Burnett Elementary 78.94 71.49 0.004 Tutored Group Performed Better
Amherst Elementary 76.89 74.71 0.469 No Difference
Ball Camp Elementary 78.06 77.83 0.945 No Difference
Bearden Elementary 77.59 77.18 0.928 No Difference
Beaumont Elementary 75.75 77.68 0.566 No Difference
Belle Morris Elementary 82.27 80.72 0.658 No Difference
Brickey-McCloud Elementary 76.26 84.59 0 Control Group Performed Better
Christenberry Elementary 84.71 79.53 0.085 No Difference
Copper Ridge Elementary 81.26 82.77 0.637 No Difference
East Knox County Elementary 76.55 72.79 0.338 No Difference
Green Elementary 67 71.42 0.399 No Difference
Halls Elementary 71.9 82.4 0 Control Group Performed Better
Lonsdale Elementary 71.47 71.35 0.976 No Difference
Maynard Elementary 75 72.78 0.743 No Difference
New Hopewell Elementary 79.03 86.33 0.038 Control Group Performed Better
Norwood Elementary 76.64 78.61 0.481 No Difference
Pond Gap Elementary 75.42 72.43 0.326 No Difference
Powell Elementary 83.96 77.2 0.001 Tutored Group Performed Better
Ritta Elementary 74.36 75.13 0.792 No Difference
Sarah Moore Greene Elementary
76.38 69.68 0.03 Tutored Group Performed Better
Sterchi Elementary 86.53 91.22 0.023 Control Group Performed Better
West Hills Elementary 76.3 75.19 0.825 No Difference
District 77.92 77.03 0.196 No Difference
Localized successes could be found at Adrian Burnett, Christenberry, Powell and Sarah Moore Greene.
There were four locations (Brickey-McCloud, Halls, New Hopewell and Sterchi) where statistically the
control group had a higher mean TCAP exam score in Math than students enrolled in the tutoring
program. At the aggregate level, the treatment group had a slightly higher mean TCAP exam score
average than the control. The difference, however, was not statistically significant.
Results: Chi-squared test on proficiency levels
A chi-squared test was performed to determine if either group of students were moving through
proficiency levels at a different rate than the other. Results are contained in tables 11.3 and 11.4.
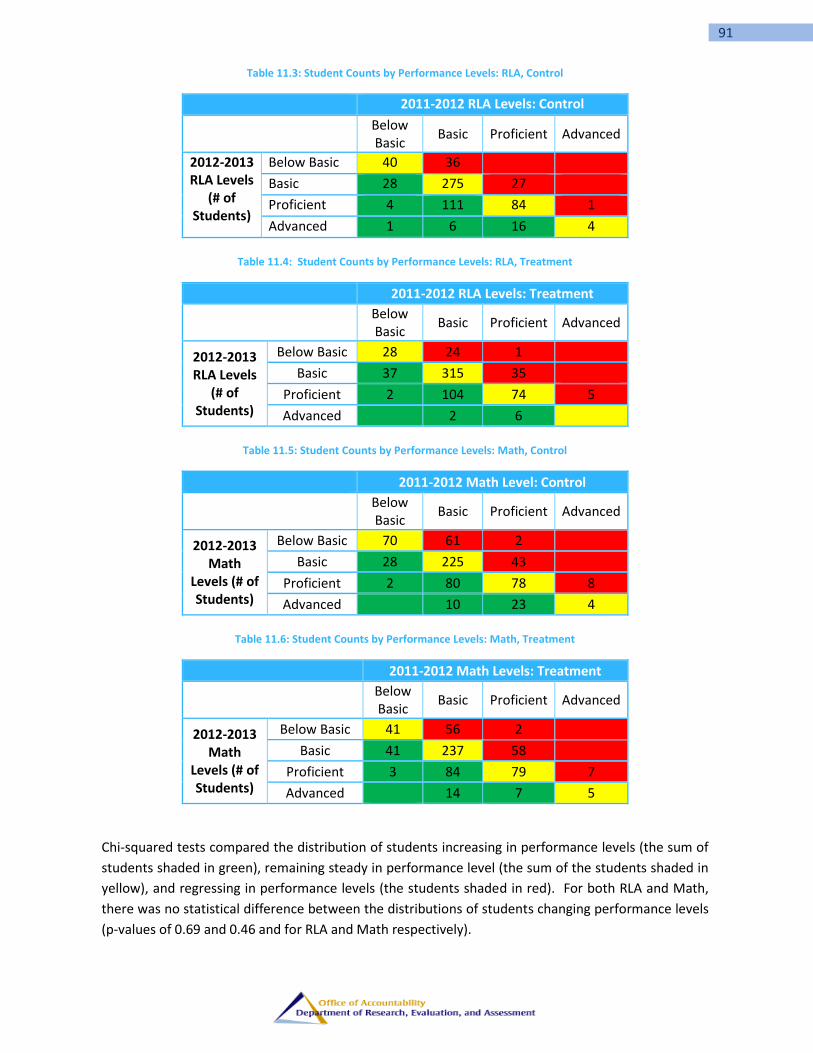
91
Table 11.3: Student Counts by Performance Levels: RLA, Control
2011-2012 RLA Levels: Control
Below Basic
Basic Proficient Advanced
2012-2013 RLA Levels
(# of Students)
Below Basic 40 36
Basic 28 275 27
Proficient 4 111 84 1
Advanced 1 6 16 4
Table 11.4: Student Counts by Performance Levels: RLA, Treatment
2011-2012 RLA Levels: Treatment
Below Basic
Basic Proficient Advanced
2012-2013 RLA Levels
(# of Students)
Below Basic 28 24 1
Basic 37 315 35
Proficient 2 104 74 5
Advanced
2 6
Table 11.5: Student Counts by Performance Levels: Math, Control
2011-2012 Math Level: Control
Below Basic
Basic Proficient Advanced
2012-2013 Math
Levels (# of Students)
Below Basic 70 61 2
Basic 28 225 43
Proficient 2 80 78 8
Advanced
10 23 4
Table 11.6: Student Counts by Performance Levels: Math, Treatment
2011-2012 Math Levels: Treatment
Below Basic
Basic Proficient Advanced
2012-2013 Math
Levels (# of Students)
Below Basic 41 56 2
Basic 41 237 58
Proficient 3 84 79 7
Advanced
14 7 5
Chi-squared tests compared the distribution of students increasing in performance levels (the sum of
students shaded in green), remaining steady in performance level (the sum of the students shaded in
yellow), and regressing in performance levels (the students shaded in red). For both RLA and Math,
there was no statistical difference between the distributions of students changing performance levels
(p-values of 0.69 and 0.46 and for RLA and Math respectively).
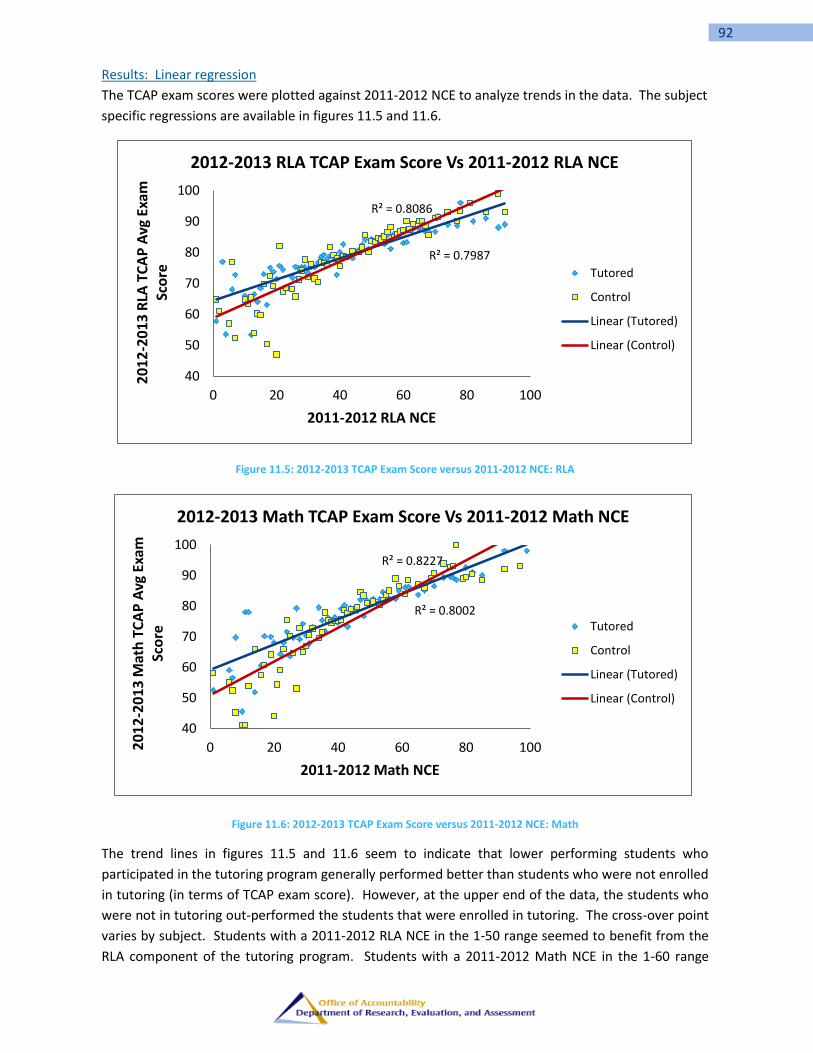
92
Results: Linear regression
The TCAP exam scores were plotted against 2011-2012 NCE to analyze trends in the data. The subject
specific regressions are available in figures 11.5 and 11.6.
Figure 11.5: 2012-2013 TCAP Exam Score versus 2011-2012 NCE: RLA
Figure 11.6: 2012-2013 TCAP Exam Score versus 2011-2012 NCE: Math
The trend lines in figures 11.5 and 11.6 seem to indicate that lower performing students who
participated in the tutoring program generally performed better than students who were not enrolled
in tutoring (in terms of TCAP exam score). However, at the upper end of the data, the students who
were not in tutoring out-performed the students that were enrolled in tutoring. The cross-over point
varies by subject. Students with a 2011-2012 RLA NCE in the 1-50 range seemed to benefit from the
RLA component of the tutoring program. Students with a 2011-2012 Math NCE in the 1-60 range
R² = 0.7987
R² = 0.8086
40
50
60
70
80
90
100
0 20 40 60 80 100
20
12
-20
13
RLA
TC
AP
Avg
Exa
m
Sco
re
2011-2012 RLA NCE
2012-2013 RLA TCAP Exam Score Vs 2011-2012 RLA NCE
Tutored
Control
Linear (Tutored)
Linear (Control)
R² = 0.8002
R² = 0.8227
40
50
60
70
80
90
100
0 20 40 60 80 10020
12
-20
13
Mat
h T
CA
P A
vg E
xam
Sc
ore
2011-2012 Math NCE
2012-2013 Math TCAP Exam Score Vs 2011-2012 Math NCE
Tutored
Control
Linear (Tutored)
Linear (Control)
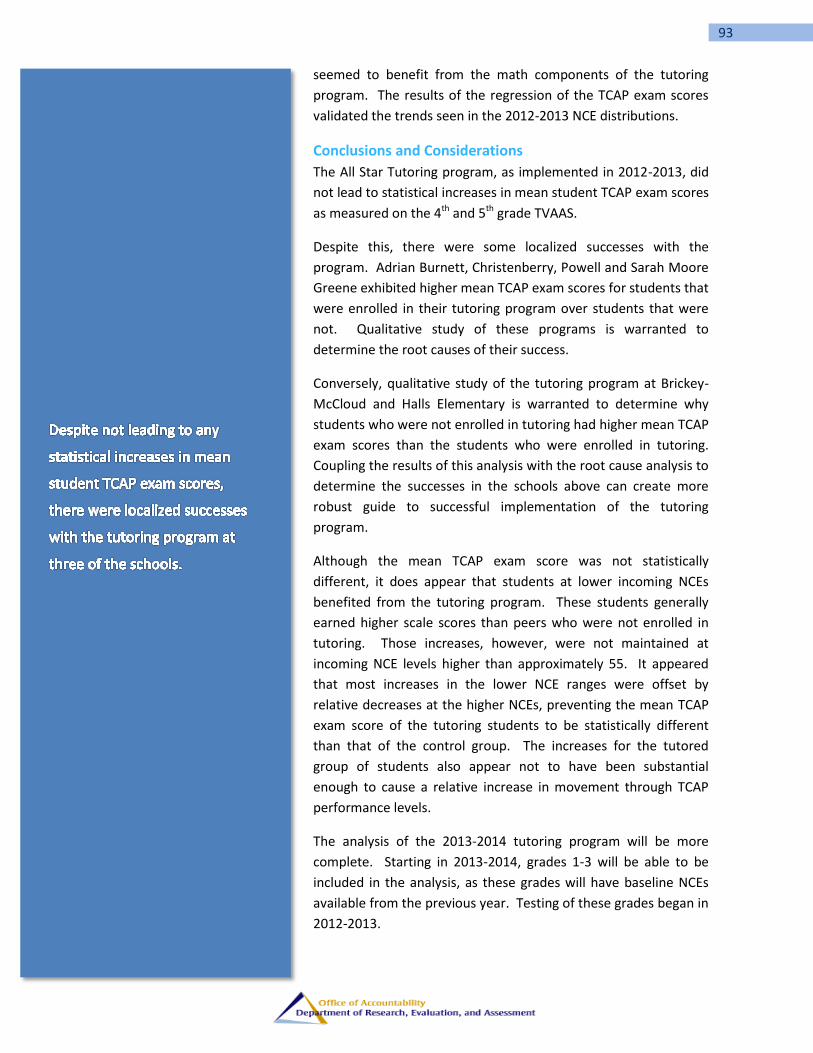
93
seemed to benefit from the math components of the tutoring
program. The results of the regression of the TCAP exam scores
validated the trends seen in the 2012-2013 NCE distributions.
Conclusions and Considerations
The All Star Tutoring program, as implemented in 2012-2013, did
not lead to statistical increases in mean student TCAP exam scores
as measured on the 4th and 5th grade TVAAS.
Despite this, there were some localized successes with the
program. Adrian Burnett, Christenberry, Powell and Sarah Moore
Greene exhibited higher mean TCAP exam scores for students that
were enrolled in their tutoring program over students that were
not. Qualitative study of these programs is warranted to
determine the root causes of their success.
Conversely, qualitative study of the tutoring program at Brickey-
McCloud and Halls Elementary is warranted to determine why
students who were not enrolled in tutoring had higher mean TCAP
exam scores than the students who were enrolled in tutoring.
Coupling the results of this analysis with the root cause analysis to
determine the successes in the schools above can create more
robust guide to successful implementation of the tutoring
program.
Although the mean TCAP exam score was not statistically
different, it does appear that students at lower incoming NCEs
benefited from the tutoring program. These students generally
earned higher scale scores than peers who were not enrolled in
tutoring. Those increases, however, were not maintained at
incoming NCE levels higher than approximately 55. It appeared
that most increases in the lower NCE ranges were offset by
relative decreases at the higher NCEs, preventing the mean TCAP
exam score of the tutoring students to be statistically different
than that of the control group. The increases for the tutored
group of students also appear not to have been substantial
enough to cause a relative increase in movement through TCAP
performance levels.
The analysis of the 2013-2014 tutoring program will be more
complete. Starting in 2013-2014, grades 1-3 will be able to be
included in the analysis, as these grades will have baseline NCEs
available from the previous year. Testing of these grades began in
2012-2013.
94
12. EXPLORE Tutoring The EXPLORE test is a national assessment based on the subject areas of high school and post-
secondary education (English, Math, Reading and Science) that is administered to 8th grade students
in Knox County. The EXPLORE assessment is the first national assessment to serve as an indicator of
college readiness. Knox County Schools implemented an EXPLORE tutoring program in 2012-2013 in
an effort to increase the number of students scoring a 17 on the assessment (which is considered a
district benchmark for college readiness on the EXPLORE assessment). The schools participating in
the program were Bearden, Halls, Northwest, Powell, South-Doyle, Vine, and Whittle Springs Middle
Schools.
The tutoring program spanned the test window for the EXPLORE assessment. Because of this, the
students that were enrolled in the tutoring program were 7th grade students who would not be taking
the EXPLORE assessment until October 2013. A model was constructed to predict EXPLORE results
from formative assessment data (Discovery Education Assessment, test 3). The ultimate validation of
the program will not occur until 2013-2014 EXPLORE results are returned.
Methodology
The first step in the analysis was to create a linear model that could predict EXPLORE results from
formative Discovery Education (DE) data. A linear model was created from 2011-2012 DE Test 1 data.
The model using DE test 1 data was developed to provide principals with a prediction of which
students were already on track to score at or above a scale score of 17. The prediction model was
generated using linear regression with DE Math and Reading normal curve equivalents (NCEs) as
independent variables, and the mean of the 2011-2012 EXPLORE section scale scores as the
dependent variable. The results of the linear regressions are available in table 12.1.\
Table 12.1: Linear Regression Models
Model Parameters (Coefficients)
Prediction Model
Model F Model
Sig. Model
R2 Constant RLA NCE Math NCE
Basis - DE Test 1 4707.493 0.000 0.729 6.749 0.088 0.067
The results of the linear regression indicate that 73% of the variation in EXPLORE scores can be
described by the model. The model was therefore considered acceptable for predicting EXPLORE
outcomes from DE Reading and Math NCEs.
Principals at the participating schools were provided a roster of all students at their school and their
predicted EXPLORE score based on DE test 1. From this roster, the principals selected students for
tutoring. Generally, students who were closest to a predicted composite scale score of 17 were
chosen for the tutoring program. A control group was then created to which the outcome data from
the treatment (tutored) students would be compared. The control group was selected from students
at the same set of schools. Students in the control group had the same distribution of predicted

95
EXPLORE composites based on the DE test 1 model. The distribution of the predicted EXPLORE
composites for both the treatment and control groups is available in figure 12.1.
Figure 12.1: Distribution of Predicted EXPLORE Composites - DE Test 1
Once the control group was determined, hypothesis testing could be done to see if there was a
difference in EXPLORE results. Chi-squared testing was also performed to determine if the percent of
students scoring 17 or higher was any different between the treatment and control group.
Results: EXPLORE Composite Scores
The distributions of EXPLORE composites are contained in figure 12.2.
0
5
10
15
20
25
30
35
40
45
50
9 10 11 12 13 14 15 16 17 18 19 >=20
Nu
mb
er
of
Stu
de
nts
Sco
rin
g
Predicted (From DE Test 1) EXPLORE Composite
Distribution of Predicted EXPLORE Scores in Treatment and Control Groups
Treatment
Control

96
Figure 12.2: Distribution of Predicted EXPLORE Composites - DE Test 3
Table 12.2 contains the results of the hypothesis testing on the mean EXPLORE composite scores at
each school. The null hypothesis was that there was no difference between mean EXPLORE
composites. All hypothesis testing was based on alpha=0.05.
Table 12.2: Hypothesis Testing Results
Treatment Group Control Group Difference of
Avg.
School Average Count Average Count Treatment
minus Control Result
Bearden Middle 14.98 40 16.44 48 -1.46 Treatment Worse
Halls Middle 17.12 26 15.77 69 1.35 Treatment Better
Northwest Middle 13.69 49 14.68 25 -0.99 Treatment Worse
Powell Middle 17.34 41 15.91 58 1.43 Treatment Better
South-Doyle Middle 15.13 45 15.05 39 0.08 Same Performance
Vine Middle 12.30 10 13.69 16 -1.39 Treatment Worse
Whittle Springs Middle
14.18 56 13.92 12 0.26 Same Performance
Grand Total 15.07 267 15.51 267 -0.43 Treatment Worse
The district results indicated that the students who were in the tutoring program had a lower mean
EXPLORE composite when compared to students who were not enrolled in the EXPLORE tutoring
program. Powell Middle and Halls Middle exhibited a mean EXPLORE composite that was higher
(statistically significant) for their treatment groups when compared to their control group. Please
0
10
20
30
40
50
60
9 10 11 12 13 14 15 16 17 >=20
Nu
mb
er
of
Stu
de
nts
Sco
rin
g
2013-2014 EXPLORE Composites
Distribution of Final EXPLORE Scores in Treatment and Control Groups
Treatment
Control
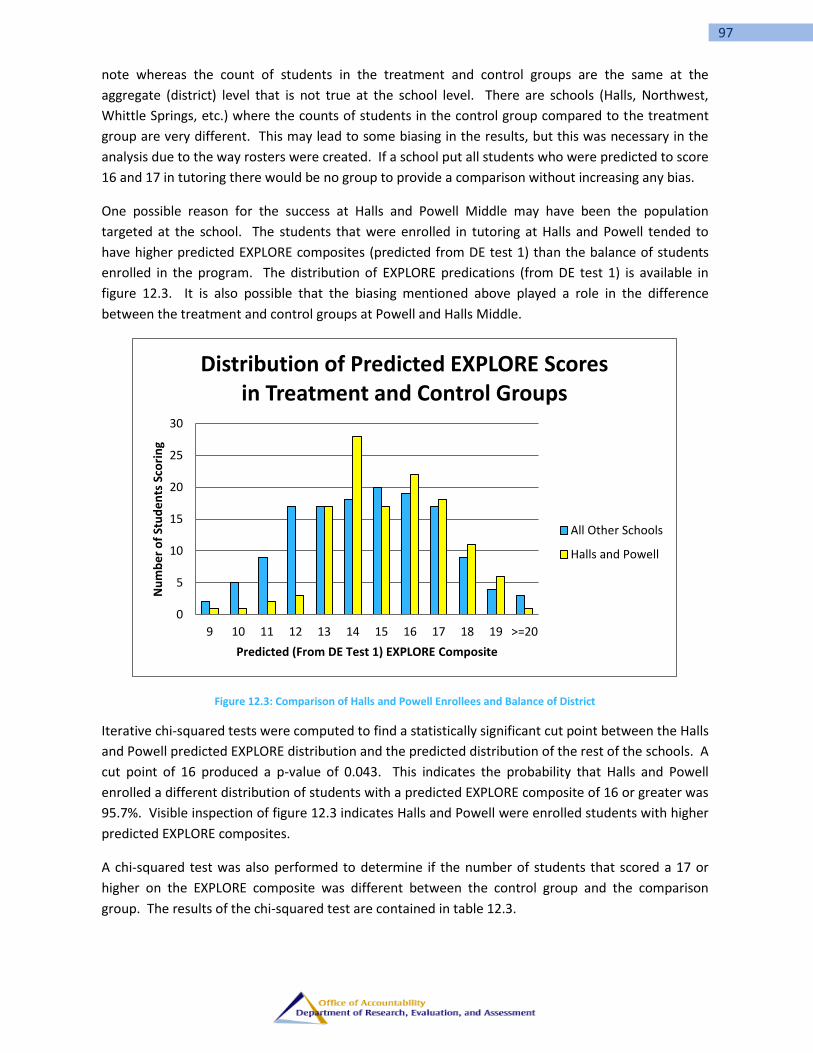
97
note whereas the count of students in the treatment and control groups are the same at the
aggregate (district) level that is not true at the school level. There are schools (Halls, Northwest,
Whittle Springs, etc.) where the counts of students in the control group compared to the treatment
group are very different. This may lead to some biasing in the results, but this was necessary in the
analysis due to the way rosters were created. If a school put all students who were predicted to score
16 and 17 in tutoring there would be no group to provide a comparison without increasing any bias.
One possible reason for the success at Halls and Powell Middle may have been the population
targeted at the school. The students that were enrolled in tutoring at Halls and Powell tended to
have higher predicted EXPLORE composites (predicted from DE test 1) than the balance of students
enrolled in the program. The distribution of EXPLORE predications (from DE test 1) is available in
figure 12.3. It is also possible that the biasing mentioned above played a role in the difference
between the treatment and control groups at Powell and Halls Middle.
Figure 12.3: Comparison of Halls and Powell Enrollees and Balance of District
Iterative chi-squared tests were computed to find a statistically significant cut point between the Halls
and Powell predicted EXPLORE distribution and the predicted distribution of the rest of the schools. A
cut point of 16 produced a p-value of 0.043. This indicates the probability that Halls and Powell
enrolled a different distribution of students with a predicted EXPLORE composite of 16 or greater was
95.7%. Visible inspection of figure 12.3 indicates Halls and Powell were enrolled students with higher
predicted EXPLORE composites.
A chi-squared test was also performed to determine if the number of students that scored a 17 or
higher on the EXPLORE composite was different between the control group and the comparison
group. The results of the chi-squared test are contained in table 12.3.
0
5
10
15
20
25
30
9 10 11 12 13 14 15 16 17 18 19 >=20
Nu
mb
er
of
Stu
de
nts
Sco
rin
g
Predicted (From DE Test 1) EXPLORE Composite
Distribution of Predicted EXPLORE Scores in Treatment and Control Groups
All Other Schools
Halls and Powell
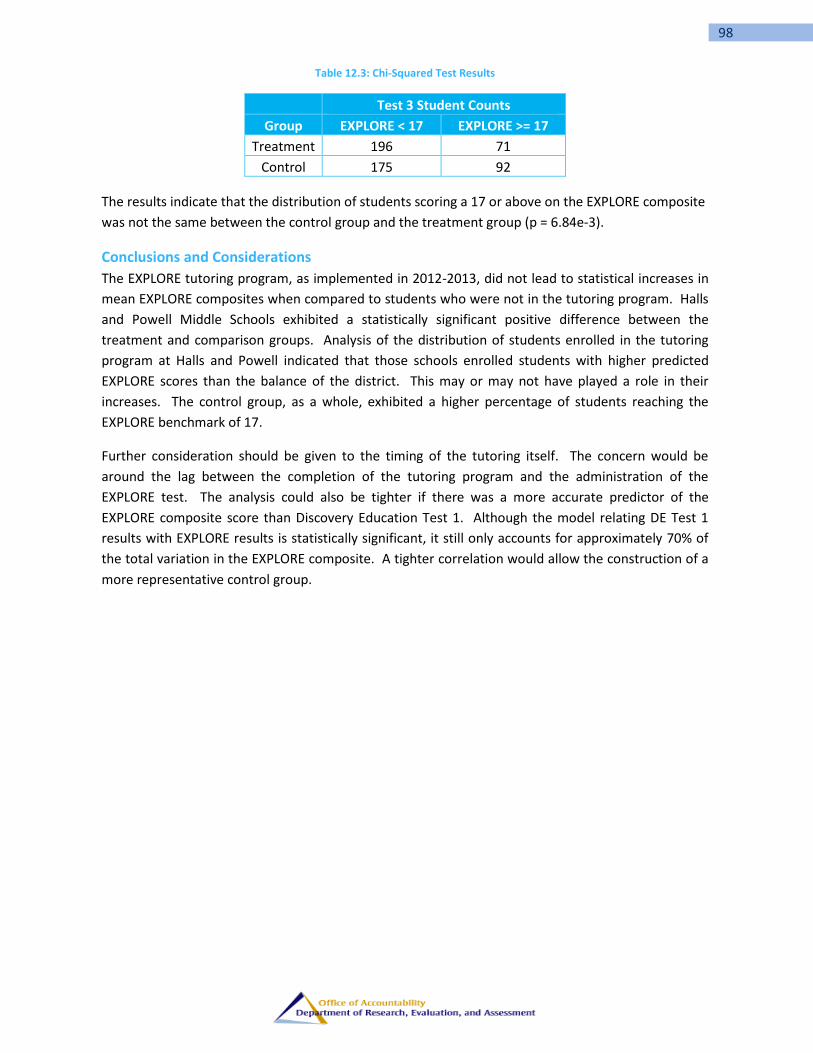
98
Table 12.3: Chi-Squared Test Results
Test 3 Student Counts
Group EXPLORE < 17 EXPLORE >= 17
Treatment 196 71
Control 175 92
The results indicate that the distribution of students scoring a 17 or above on the EXPLORE composite
was not the same between the control group and the treatment group (p = 6.84e-3).
Conclusions and Considerations
The EXPLORE tutoring program, as implemented in 2012-2013, did not lead to statistical increases in
mean EXPLORE composites when compared to students who were not in the tutoring program. Halls
and Powell Middle Schools exhibited a statistically significant positive difference between the
treatment and comparison groups. Analysis of the distribution of students enrolled in the tutoring
program at Halls and Powell indicated that those schools enrolled students with higher predicted
EXPLORE scores than the balance of the district. This may or may not have played a role in their
increases. The control group, as a whole, exhibited a higher percentage of students reaching the
EXPLORE benchmark of 17.
Further consideration should be given to the timing of the tutoring itself. The concern would be
around the lag between the completion of the tutoring program and the administration of the
EXPLORE test. The analysis could also be tighter if there was a more accurate predictor of the
EXPLORE composite score than Discovery Education Test 1. Although the model relating DE Test 1
results with EXPLORE results is statistically significant, it still only accounts for approximately 70% of
the total variation in the EXPLORE composite. A tighter correlation would allow the construction of a
more representative control group.

99
13. ACT Tutoring The ACT test is a national benchmark for college readiness, and as such, ACT results serve as
benchmarks in Knox County’s strategic plan to help gauge quality and rigor of instruction in the
district. A pilot program was instituted in 2012-2013 at a select group of Knox County high schools to
provide targeted tutoring around ACT test taking strategies. The overall goal of the program was to
increase student performance on the ACT.
The schools involved in the pilot were Carter High, Central High, Halls High, Karns High and Powell
High.
Methodology
Schools provided a roster of students that participated in the tutoring program. The tutored students
were matched up to their predicted state percentile on the ACT (as calculated by SAS and reported on
the TVAAS website). A control group was created from a pool of students at the same schools who
had the same distribution of predicted ACT percentiles. Control group students were randomly
selected from this pool to provide the same number of students with the same predicted score
distribution as the tutored group. The final distribution of predicted ACT percentiles for the
treatment and control group is available in figure 13.1.
Figure 13.1: Distribution of Predicted ACT Percentile
The final program analysis was done on a student’s best ACT score (when a student in either the
treatment or control group took the ACT multiple times).
Hypothesis testing was done to determine if there was a statistical difference between the mean ACT
scores of the tutored and control groups. The null hypothesis was that the difference of the mean
ACT test scores between the control and tutored groups was zero.
0
5
10
15
20
25
30
1 t
o 5
5 t
o 1
0
10
to
15
15
to
20
20
to
25
25
to
30
30
to
35
35
to
40
40
to
45
45
to
50
50
to
55
55
to
60
60
to
65
65
to
70
70
to
75
75
to
80
80
to
85
85
to
90
90
to
95
95
to
99
Co
un
t o
f St
ud
en
ts
Predicted Percentile
Distribution of Predicted ACT Percentiles for Treatment and Control Group
Control
Treatment

100
A chi-squared test was also done to test if the distribution of students scoring a 21 or higher on the
ACT (a specific benchmark in the strategic plan) was different between the two groups. The null
hypothesis of the chi-squared test was that there was no difference between the distribution of
students scoring above and below the threshold of 21 between the control and treatment groups.
Results: ACT Scores of treatment and control Groups
The distributions of best ACT test scores for the tutored and control group are contained in figure
13.2.
Figure 13.2: Best ACT Score Distribution
From the distribution, it can be seen that the control group had more students scoring at the lower
end of the ACT scale (17 and below), whereas the treatment group had more students scoring at the
high end (29 and higher). The control group had more students with an actual ACT score of 21, but
overall the treatment group had 4 more students scoring 21 or higher than the control group.
Hypothesis testing (alpha = 0.10) indicates that the mean ACT score was higher at most locations that
piloted the tutoring program. Results are available in table 13.1.
Table 13.1: Hypothesis Testing Results
Control Treatment
Name Average of
Best ACT Score Average of Best
ACT Score p-value Result
Carter High 20.42 19.89 0.26 NDD* Between Groups
Central High 20.53 21.98 0.08 Higher Avg for Tutored Group
Halls High 21.30 22.80 0.04 Higher Avg for Tutored Group
Karns High 21.08 22.36 0.07 Higher Avg for Tutored Group
Powell High 21.19 21.08 0.45 NDD Between Groups
District 20.98 21.62 0.05 Higher Avg for Tutored Group
*No discernible difference
0
5
10
15
20
25
30
35
40
10 12 14 16 18 20 22 24 26 28 30 32 34 36
Nu
mb
er
of
Stu
de
nts
Sco
rin
g
ACT Score
Distribution of Best ACT Scores
Control
Treatment
ACT Score Greater Than or Equal to 21
ACT Score Less Than 21
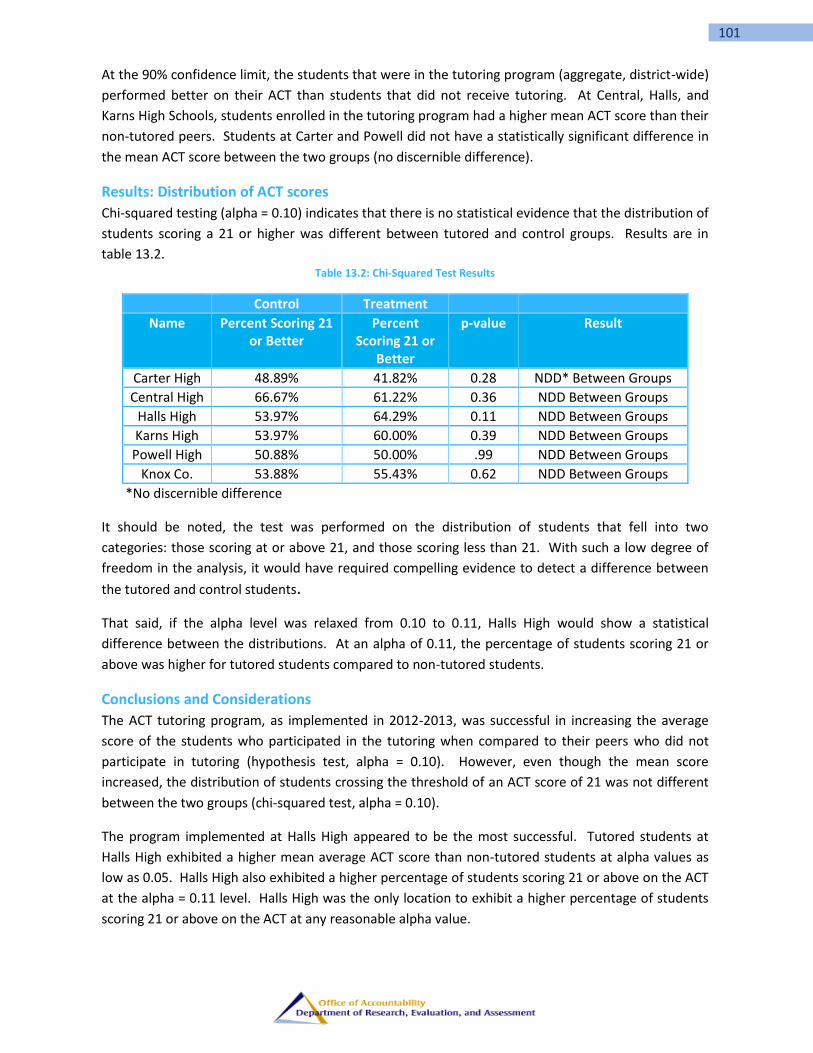
101
At the 90% confidence limit, the students that were in the tutoring program (aggregate, district-wide)
performed better on their ACT than students that did not receive tutoring. At Central, Halls, and
Karns High Schools, students enrolled in the tutoring program had a higher mean ACT score than their
non-tutored peers. Students at Carter and Powell did not have a statistically significant difference in
the mean ACT score between the two groups (no discernible difference).
Results: Distribution of ACT scores
Chi-squared testing (alpha = 0.10) indicates that there is no statistical evidence that the distribution of
students scoring a 21 or higher was different between tutored and control groups. Results are in
table 13.2. Table 13.2: Chi-Squared Test Results
Control Treatment
Name Percent Scoring 21 or Better
Percent Scoring 21 or
Better
p-value Result
Carter High 48.89% 41.82% 0.28 NDD* Between Groups
Central High 66.67% 61.22% 0.36 NDD Between Groups
Halls High 53.97% 64.29% 0.11 NDD Between Groups
Karns High 53.97% 60.00% 0.39 NDD Between Groups
Powell High 50.88% 50.00% .99 NDD Between Groups
Knox Co. 53.88% 55.43% 0.62 NDD Between Groups
*No discernible difference
It should be noted, the test was performed on the distribution of students that fell into two
categories: those scoring at or above 21, and those scoring less than 21. With such a low degree of
freedom in the analysis, it would have required compelling evidence to detect a difference between
the tutored and control students.
That said, if the alpha level was relaxed from 0.10 to 0.11, Halls High would show a statistical
difference between the distributions. At an alpha of 0.11, the percentage of students scoring 21 or
above was higher for tutored students compared to non-tutored students.
Conclusions and Considerations
The ACT tutoring program, as implemented in 2012-2013, was successful in increasing the average
score of the students who participated in the tutoring when compared to their peers who did not
participate in tutoring (hypothesis test, alpha = 0.10). However, even though the mean score
increased, the distribution of students crossing the threshold of an ACT score of 21 was not different
between the two groups (chi-squared test, alpha = 0.10).
The program implemented at Halls High appeared to be the most successful. Tutored students at
Halls High exhibited a higher mean average ACT score than non-tutored students at alpha values as
low as 0.05. Halls High also exhibited a higher percentage of students scoring 21 or above on the ACT
at the alpha = 0.11 level. Halls High was the only location to exhibit a higher percentage of students
scoring 21 or above on the ACT at any reasonable alpha value.

102
Future work on refinement of the ACT tutoring program should involve qualitative research into the
differences of program implementation at the various locations. The Halls High model of tutoring
should be expanded at that location to maximize the benefits of the tutoring program (assuming
capacity exists to expand the program at the same level of instructional quality). Root cause analysis
of the program implementation at schools that did not exhibit gains (Carter and Halls) should be
undertaken to understand why these schools did not exhibit the same gains as other schools involved
in the program.
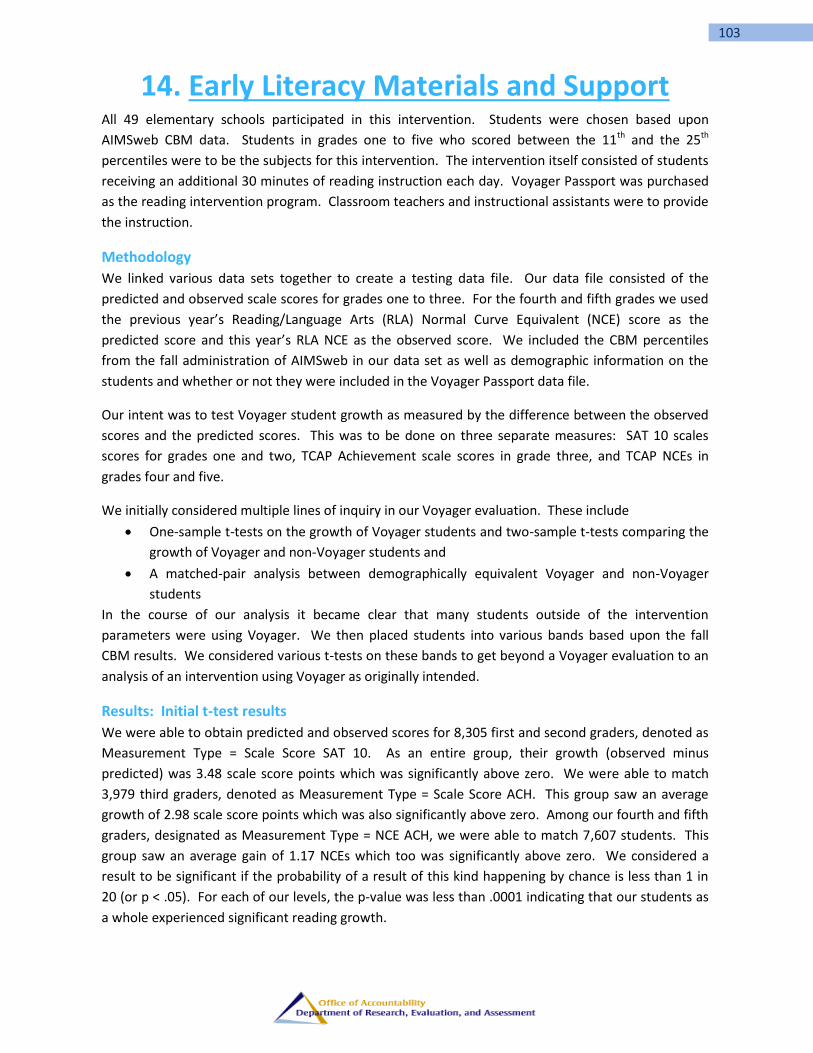
103
14. Early Literacy Materials and Support All 49 elementary schools participated in this intervention. Students were chosen based upon
AIMSweb CBM data. Students in grades one to five who scored between the 11th and the 25th
percentiles were to be the subjects for this intervention. The intervention itself consisted of students
receiving an additional 30 minutes of reading instruction each day. Voyager Passport was purchased
as the reading intervention program. Classroom teachers and instructional assistants were to provide
the instruction.
Methodology
We linked various data sets together to create a testing data file. Our data file consisted of the
predicted and observed scale scores for grades one to three. For the fourth and fifth grades we used
the previous year’s Reading/Language Arts (RLA) Normal Curve Equivalent (NCE) score as the
predicted score and this year’s RLA NCE as the observed score. We included the CBM percentiles
from the fall administration of AIMSweb in our data set as well as demographic information on the
students and whether or not they were included in the Voyager Passport data file.
Our intent was to test Voyager student growth as measured by the difference between the observed
scores and the predicted scores. This was to be done on three separate measures: SAT 10 scales
scores for grades one and two, TCAP Achievement scale scores in grade three, and TCAP NCEs in
grades four and five.
We initially considered multiple lines of inquiry in our Voyager evaluation. These include
One-sample t-tests on the growth of Voyager students and two-sample t-tests comparing the
growth of Voyager and non-Voyager students and
A matched-pair analysis between demographically equivalent Voyager and non-Voyager
students
In the course of our analysis it became clear that many students outside of the intervention
parameters were using Voyager. We then placed students into various bands based upon the fall
CBM results. We considered various t-tests on these bands to get beyond a Voyager evaluation to an
analysis of an intervention using Voyager as originally intended.
Results: Initial t-test results
We were able to obtain predicted and observed scores for 8,305 first and second graders, denoted as
Measurement Type = Scale Score SAT 10. As an entire group, their growth (observed minus
predicted) was 3.48 scale score points which was significantly above zero. We were able to match
3,979 third graders, denoted as Measurement Type = Scale Score ACH. This group saw an average
growth of 2.98 scale score points which was also significantly above zero. Among our fourth and fifth
graders, designated as Measurement Type = NCE ACH, we were able to match 7,607 students. This
group saw an average gain of 1.17 NCEs which too was significantly above zero. We considered a
result to be significant if the probability of a result of this kind happening by chance is less than 1 in
20 (or p < .05). For each of our levels, the p-value was less than .0001 indicating that our students as
a whole experienced significant reading growth.
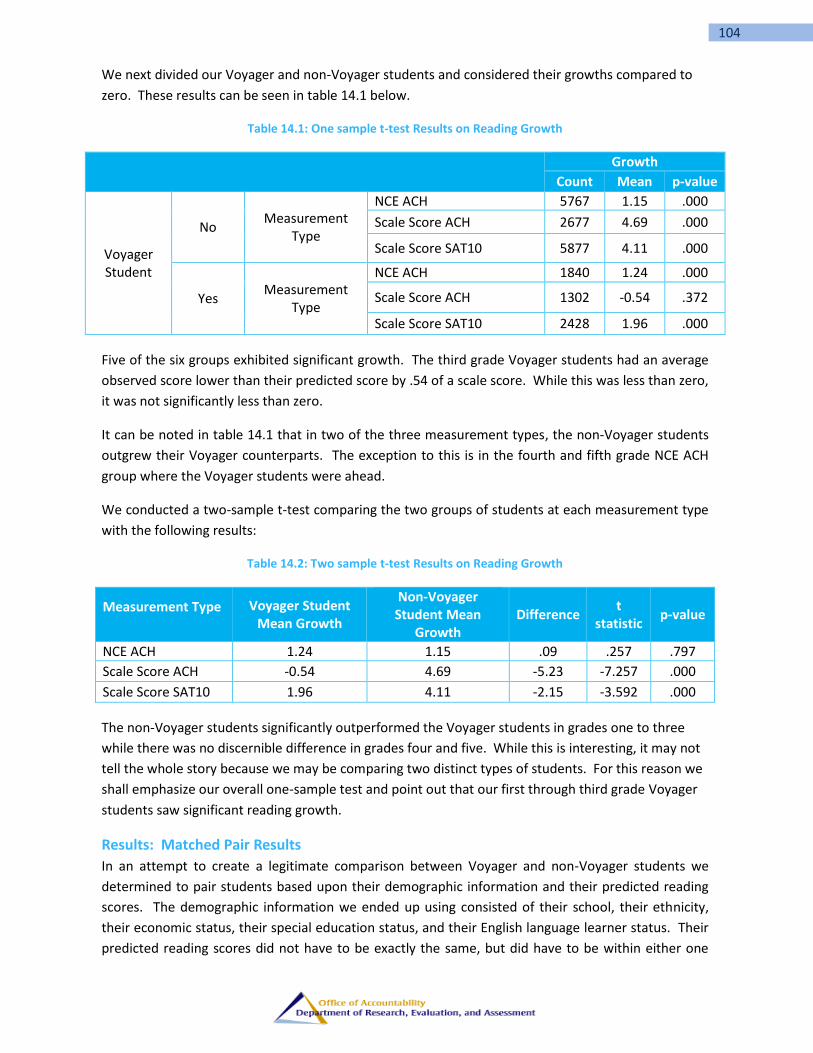
104
We next divided our Voyager and non-Voyager students and considered their growths compared to
zero. These results can be seen in table 14.1 below.
Table 14.1: One sample t-test Results on Reading Growth
Growth
Count Mean p-value
Voyager Student
No Measurement
Type
NCE ACH 5767 1.15 .000
Scale Score ACH 2677 4.69 .000
Scale Score SAT10 5877 4.11 .000
Yes Measurement
Type
NCE ACH 1840 1.24 .000
Scale Score ACH 1302 -0.54 .372
Scale Score SAT10 2428 1.96 .000
Five of the six groups exhibited significant growth. The third grade Voyager students had an average
observed score lower than their predicted score by .54 of a scale score. While this was less than zero,
it was not significantly less than zero.
It can be noted in table 14.1 that in two of the three measurement types, the non-Voyager students
outgrew their Voyager counterparts. The exception to this is in the fourth and fifth grade NCE ACH
group where the Voyager students were ahead.
We conducted a two-sample t-test comparing the two groups of students at each measurement type
with the following results:
Table 14.2: Two sample t-test Results on Reading Growth
Measurement Type Voyager Student Mean Growth
Non-Voyager Student Mean
Growth Difference
t statistic
p-value
NCE ACH 1.24 1.15 .09 .257 .797
Scale Score ACH -0.54 4.69 -5.23 -7.257 .000
Scale Score SAT10 1.96 4.11 -2.15 -3.592 .000
The non-Voyager students significantly outperformed the Voyager students in grades one to three
while there was no discernible difference in grades four and five. While this is interesting, it may not
tell the whole story because we may be comparing two distinct types of students. For this reason we
shall emphasize our overall one-sample test and point out that our first through third grade Voyager
students saw significant reading growth.
Results: Matched Pair Results
In an attempt to create a legitimate comparison between Voyager and non-Voyager students we
determined to pair students based upon their demographic information and their predicted reading
scores. The demographic information we ended up using consisted of their school, their ethnicity,
their economic status, their special education status, and their English language learner status. Their
predicted reading scores did not have to be exactly the same, but did have to be within either one
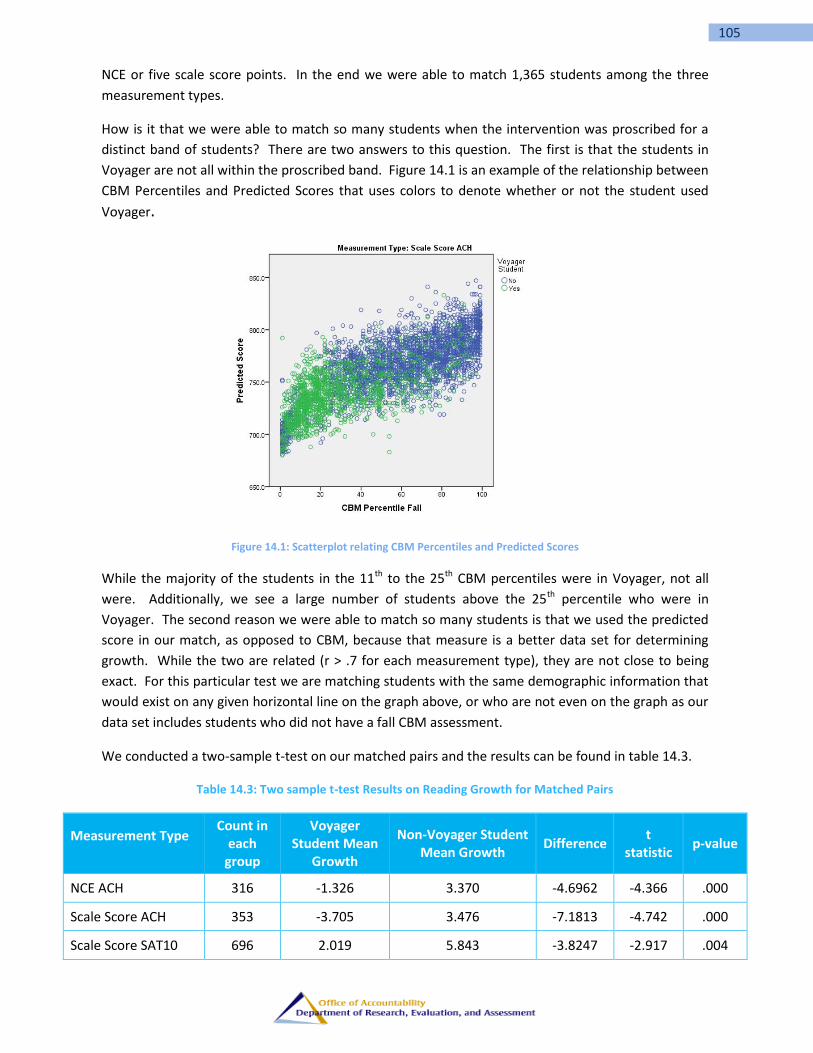
105
NCE or five scale score points. In the end we were able to match 1,365 students among the three
measurement types.
How is it that we were able to match so many students when the intervention was proscribed for a
distinct band of students? There are two answers to this question. The first is that the students in
Voyager are not all within the proscribed band. Figure 14.1 is an example of the relationship between
CBM Percentiles and Predicted Scores that uses colors to denote whether or not the student used
Voyager.
Figure 14.1: Scatterplot relating CBM Percentiles and Predicted Scores
While the majority of the students in the 11th to the 25th CBM percentiles were in Voyager, not all
were. Additionally, we see a large number of students above the 25th percentile who were in
Voyager. The second reason we were able to match so many students is that we used the predicted
score in our match, as opposed to CBM, because that measure is a better data set for determining
growth. While the two are related (r > .7 for each measurement type), they are not close to being
exact. For this particular test we are matching students with the same demographic information that
would exist on any given horizontal line on the graph above, or who are not even on the graph as our
data set includes students who did not have a fall CBM assessment.
We conducted a two-sample t-test on our matched pairs and the results can be found in table 14.3.
Table 14.3: Two sample t-test Results on Reading Growth for Matched Pairs
Measurement Type Count in
each group
Voyager Student Mean
Growth
Non-Voyager Student Mean Growth
Difference t
statistic p-value
NCE ACH 316 -1.326 3.370 -4.6962 -4.366 .000
Scale Score ACH 353 -3.705 3.476 -7.1813 -4.742 .000
Scale Score SAT10 696 2.019 5.843 -3.8247 -2.917 .004

106
For each measurement type the non-Voyager students grew significantly faster than their Voyager
peers. This indicates that not only did Voyager not help these students when compared to their peers
but it may have actually had a harmful effect on their mean scores. Figure 14.2 provides a visual
perspective. In it we see that blue dots representing the non-Voyager students are scattered about
the upper horizontal line, which is their mean growth, while the Voyager students are scattered about
the lower line.
Figure 14.2: Scatterplot relating Predicted Scores and Growth
This particular graph concerns third graders. The scale for this exam is between 600 and 900 points.
In the larger scheme the means for the two groups are fairly close, but due to the number of
participants, the gap is statistically significant. The matched pair results by school can be found in
Appendix 12: Early Literacy Matched Pair Analysis. While some of the school’s Voyager students
outgrew their peers, none did so in a statistically significant way.
Results: Intervention Results Based Upon CBM Placement
Our matched pair analysis focused on matching students in a way that used the predicted TCAP
Reading/Language Arts Achievement outcomes or the predicted SAT 10 Reading outcomes. We
believe that this is the best method for matching students because in the end it is the results of the
TCAP or SAT 10 that we desire to improve. Yet, the basis for placing students into Voyager was,
ostensibly, the results of the fall administration of the AIMSweb CBM. In reality, only 37% of the
students (2,074) who were in Voyager had a CBM result in the targeted 11th to 25th CBM percentiles,
while 685 students who were in this targeted range did not participate in the intervention. All of the
various numbers and percentages can be found in table 14.4.

107
Table 14.4: Voyager Participation by CBM Percentile Bands
We conducted one-sample t-tests on each of the four categories for each of the three measurement
types for each of the Voyager Student types. The results of these tests are in table 14.5.
Table 14.5: One sample t-test Results by CBM Percentile Bands
The results indicate that Voyager students in the targeted band exhibited significant growth in grades
one, two, four, and five while also exhibiting a non-significant decline in grade three. What is more
encouraging is that for each measurement type, the Voyager students had a higher growth than the
non-Voyager students. We ran two-sample t-tests between the two groups, but the differences were
not statistically significant.
Count Mean p
Above Target CBM 4961 1.2 .000
Below Target CBM 265 .5 .558
No Fall CBM 233 .7 .429
Target CBM 308 .6 .471
Above Target CBM 2213 5.5 .000
Below Target CBM 179 5.9 .003
No Fall CBM 176 -2.3 .167
Target CBM 109 -2.4 .223
Above Target CBM 4867 6.0 .000
Below Target CBM 366 -13.6 .000
No Fall CBM 376 .2 .885
Target CBM 268 -.4 .794
Above Target CBM 596 .9 .093
Below Target CBM 261 .7 .389
No Fall CBM 236 3.3 .001
Target CBM 747 1.1 .032
Above Target CBM 476 3.5 .000
Below Target CBM 211 -5.7 .002
No Fall CBM 162 -3.0 .092
Target CBM 453 -1.6 .113
Above Target CBM 931 6.1 .000
Below Target CBM 322 -8.9 .000
No Fall CBM 301 -.6 .658
Target CBM 874 2.4 .004
Growth
Voyager
Student
NoMeasurement
Type
NCE
ACH
Band
Name
Scale
Score
ACH
Band
Name
Scale
Score
SAT10
Band
Name
YesMeasurement
Type
NCE
ACH
Band
Name
Scale
Score
ACH
Band
Name
Scale
Score
SAT10
Band
Name
Count Row N % Count Row N % Count Row N % Count Row N % Count Row N %
No 12041 84.1% 810 5.7% 785 5.5% 685 4.8% 14321 100.0%
Yes 2003 36.0% 794 14.3% 699 12.5% 2074 37.2% 5570 100.0%
Total 14044 70.6% 1604 8.1% 1484 7.5% 2759 13.9% 19891 100.0%
Voyager
Student
Band Name
Above Target CBM Below Target CBM No Fall CBM Target CBM Total
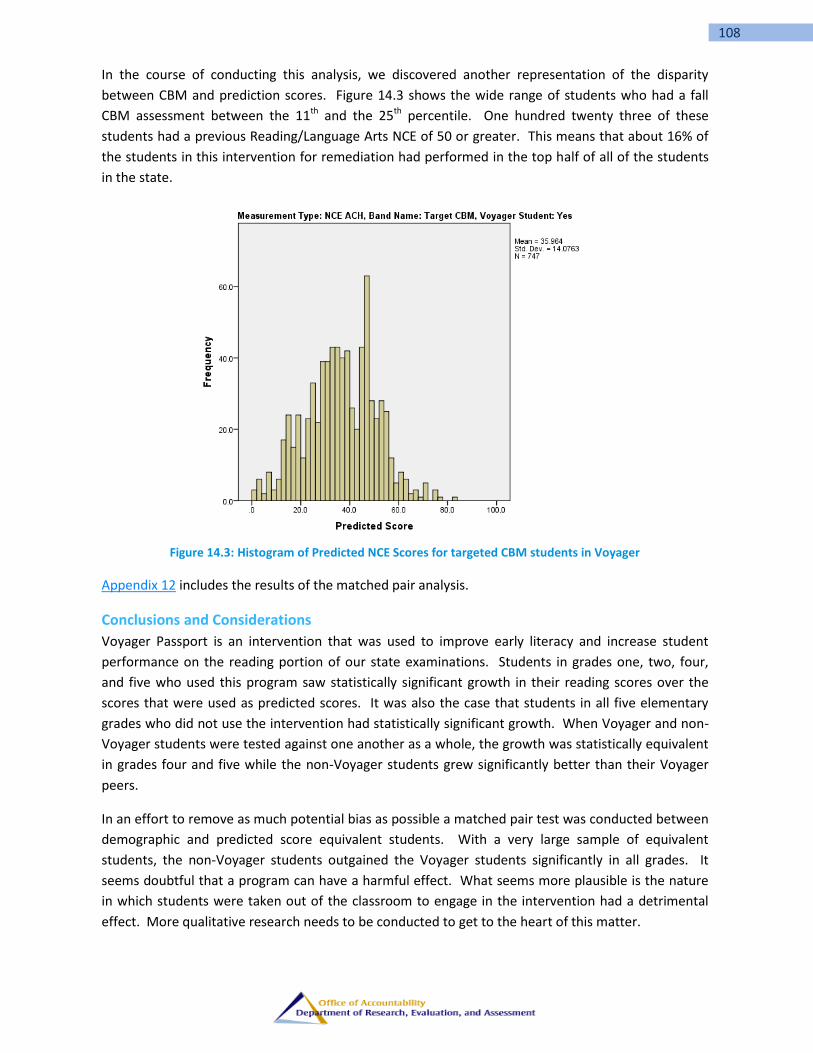
108
In the course of conducting this analysis, we discovered another representation of the disparity
between CBM and prediction scores. Figure 14.3 shows the wide range of students who had a fall
CBM assessment between the 11th and the 25th percentile. One hundred twenty three of these
students had a previous Reading/Language Arts NCE of 50 or greater. This means that about 16% of
the students in this intervention for remediation had performed in the top half of all of the students
in the state.
Figure 14.3: Histogram of Predicted NCE Scores for targeted CBM students in Voyager
Appendix 12 includes the results of the matched pair analysis.
Conclusions and Considerations
Voyager Passport is an intervention that was used to improve early literacy and increase student
performance on the reading portion of our state examinations. Students in grades one, two, four,
and five who used this program saw statistically significant growth in their reading scores over the
scores that were used as predicted scores. It was also the case that students in all five elementary
grades who did not use the intervention had statistically significant growth. When Voyager and non-
Voyager students were tested against one another as a whole, the growth was statistically equivalent
in grades four and five while the non-Voyager students grew significantly better than their Voyager
peers.
In an effort to remove as much potential bias as possible a matched pair test was conducted between
demographic and predicted score equivalent students. With a very large sample of equivalent
students, the non-Voyager students outgained the Voyager students significantly in all grades. It
seems doubtful that a program can have a harmful effect. What seems more plausible is the nature
in which students were taken out of the classroom to engage in the intervention had a detrimental
effect. More qualitative research needs to be conducted to get to the heart of this matter.
109
We noticed that the means with which we designed our match pair did not take into account the
original design of the intervention. While addressing this we saw that the use of the intervention
went well beyond the original design. When we restricted our data to include only the targeted
students for whom the intervention was designed, we did find that this group of Voyager students
grew significantly in grades one, two, four, and five; and grew faster than their non-Voyager peers in
all grades, although not in a statistically significant way.
We saw that CBM testing is correlated fairly well with the predicted scores for students, but not tight
enough to prevent students with a wide range of predicted scores being placed into a targeted
intervention group. We would recommend using the predicted scores for placing students in
interventions if possible, as was done this year, and only using CBMs if the predicted scores are not
available.
Based upon the matched pair results, we would recommend reducing the pool of students going into
an intervention by judiciously examining a number of indicators that would warrant the intervention.

110
15. First Grade Intervention Fifteen schools were assigned a full-time literacy coach in order to implement the Early Literacy
Grant. These schools were selected based upon previous results on the Kindergarten Literacy
Assessment and the First Grade AIMSweb Assessment. Literacy coaches and first grade teachers
attended monthly professional development sessions and coaches provided daily support to teachers
and students. Additionally, an Early Literacy Consultant provided oversight for the 15 schools.
Methodology
Various internal assessments were performed during the Fall, Winter, and Spring. Most of these
assessments indicated improvement for most of the schools in the Early Literacy Grant. The results
for these assessments can be found at the end of this subsection. For this evaluation we will examine
how students performed on the Reading portion of the SAT 10 exam. The SAT 10 was administered
to the first grade students during the Fall and then again in the Spring. This is an exam that is
provided by the state and growth is measured by SAS (originally Statistical Analysis Systems) and
made available through TVAAS (Tennessee Value Added Assessment System.) Growth was measured
by the difference between the Observed Scores and the Predicted Scores on the Spring
administration of the exam. For our analysis we considered three methods of hypothesis testing:
1. Growth by the students at these schools,
2. A matched pair test on growth when compared to schools with similar predicted results, and
3. A matched pair test on students with the same demographics and predicted results against
other schools in the district.
Results: Growth by students at the intervention schools
Figure 15.1 displays how students at the First Grade Intervention schools were predicted to perform
as well as how they actually performed. Students at eleven of the fifteen schools exceeded their
predictions and students at two of those schools who did not were within one scale score point. To
determine if these students had statistically significant growth we performed a t-test using the null
hypothesis that there is no growth. We used p<.05 as significant on this and all other significance
tests. The average growth was just over 4 scale score points and the p-value turned out to be
considerably less than .05. We were therefore able to reject the null hypothesis in favor of the
alternative hypothesis that the growth was not zero and was, in fact, positive. These results can be
seen in table 15.1.

111
Figure 15.1: Predicted and Observed Spring SAT 10 Scores
Table 15.1: One Sample t-test on the Reading Growth of First Grade Intervention Students
Test Value = 0
95% Confidence Interval of
the
t df Sig. (2-tailed) Mean Difference Lower Upper
Growth 5.59 1231 0.000 4.1844 2.716 5.653
We also tested the students at the individual schools in a similar fashion. Eight of the schools had
statistically significant positive growth. Two schools had statistically significant negative growth while
the other schools had p-values that were greater than .05 and therefore not considered as being
statistically significant. These schools are listed in table 15.2 and color coded as follows: Green
indicates a positive growth, Red indicates a negative growth, dark colors indicate statistical
significance, while light colors indicate a lack of statistical significance.
510
520
530
540
550
560
570
580
590
Re
adin
g Sc
ale
d S
core
s
Predicted and Observed Spring SAT 10 Scores
Mean Predicted Score Mean Student Score

112
Table 15.2: Growth by school with t-test results
Growth
Mean Median Minimum Maximum Standard Deviation
Count
Adrian Burnett Elementary
9.9 10.7 -43.0 65.0 23.4 87
Beaumont Elementary 7.3 10.4 -54.4 69.2 24.1 83
Cedar Bluff Elementary -6.6 -8.0 -81.0 92.8 26.5 171
Christenberry Elementary
-.6 -.4 -56.7 81.1 26.1 70
Dogwood Elementary 9.1 7.6 -61.1 71.2 25.0 106
East Knox County Elementary
1.0 -2.0 -49.5 92.8 24.8 71
Green Elementary -11.1 -8.7 -93.5 32.9 23.8 45
Inskip Elementary 9.4 7.8 -45.3 68.3 23.8 74
Lonsdale Elementary 5.1 6.0 -46.9 80.9 24.3 79
Mount Olive Elementary
6.0 2.7 -55.4 82.3 32.2 46
Norwood Elementary 9.0 13.8 -66.1 54.8 25.4 89
Sarah Moore Greene Elementary
-.4 3.2 -48.5 53.1 25.8 95
Spring Hill Elementary 13.1 9.8 -38.1 87.2 28.4 70
Sunnyview Primary 7.8 11.0 -56.3 74.3 25.1 90
West Haven Elementary 10.2 9.7 -52.8 78.5 25.6 56
Total 4.2 4.7 -93.5 92.8 26.3 1232
Results: Growth of the intervention schools matched against similar schools
While the previous results indicate growth, we will next consider whether the growth at the
intervention schools stands out or if growth over the prediction is the norm for the district. We will
do this by using a matched pair design on the schools. To eliminate a possible bias, intervention
schools were blindly paired with schools that had similar predicted Reading scale score means.
Schools were sorted according to their Reading growth and intervention schools were paired with the
closest non-intervention school that had not already been paired. School names were kept hidden
and the pairs were designated by an alphabet letter followed by a Y or an N indicating whether or not
they were an intervention school. Using this naming convention, school AY had the smallest
predicted reading score among the intervention schools and it was compared to a very similar school,
AN. School OY had the highest predicted reading score among the intervention schools and it was
paired with school ON. The spacing on figure 15.2 is not perfect as the pairs should line up blue, then
green; but while less than desirable, the graph indicates that none of the comparison schools had a
negative growth in Reading. The results show that the comparison schools had a higher mean growth
than the intervention schools. (See table 15.3.)
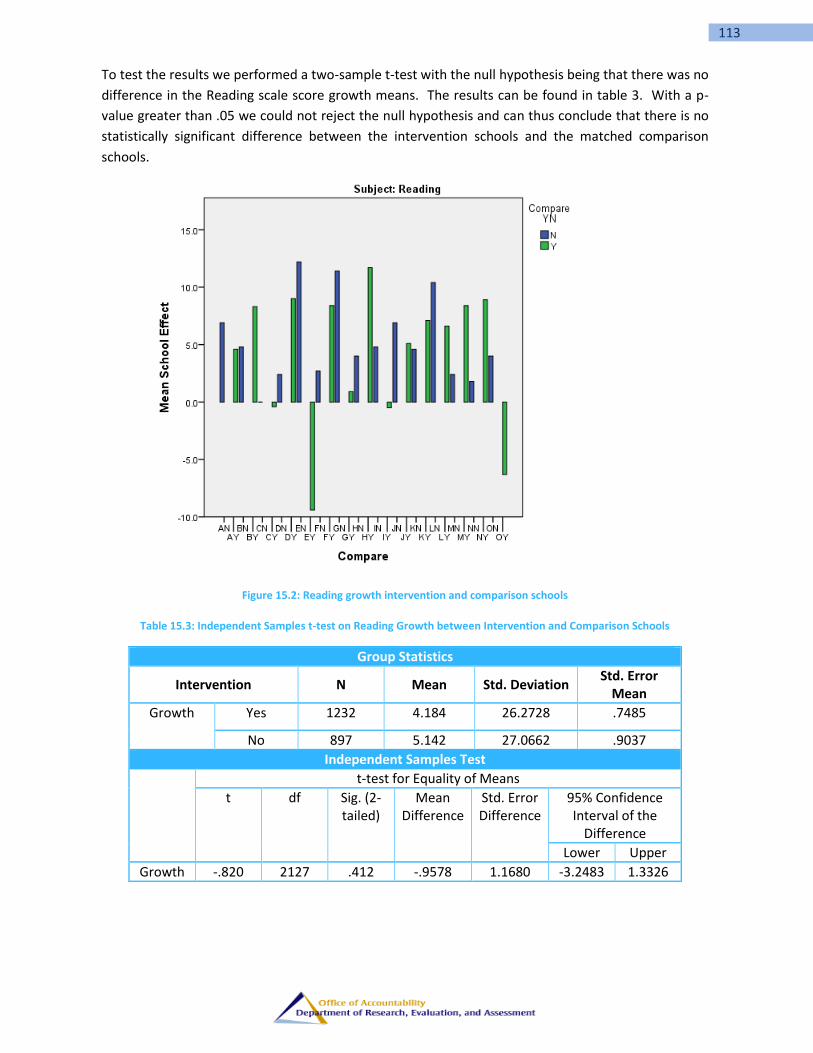
113
To test the results we performed a two-sample t-test with the null hypothesis being that there was no
difference in the Reading scale score growth means. The results can be found in table 3. With a p-
value greater than .05 we could not reject the null hypothesis and can thus conclude that there is no
statistically significant difference between the intervention schools and the matched comparison
schools.
Figure 15.2: Reading growth intervention and comparison schools
Table 15.3: Independent Samples t-test on Reading Growth between Intervention and Comparison Schools
Group Statistics
Intervention N Mean Std. Deviation Std. Error
Mean
Growth Yes 1232 4.184 26.2728 .7485
No 897 5.142 27.0662 .9037
Independent Samples Test
t-test for Equality of Means
t df Sig. (2-tailed)
Mean Difference
Std. Error Difference
95% Confidence Interval of the
Difference
Lower Upper
Growth -.820 2127 .412 -.9578 1.1680 -3.2483 1.3326
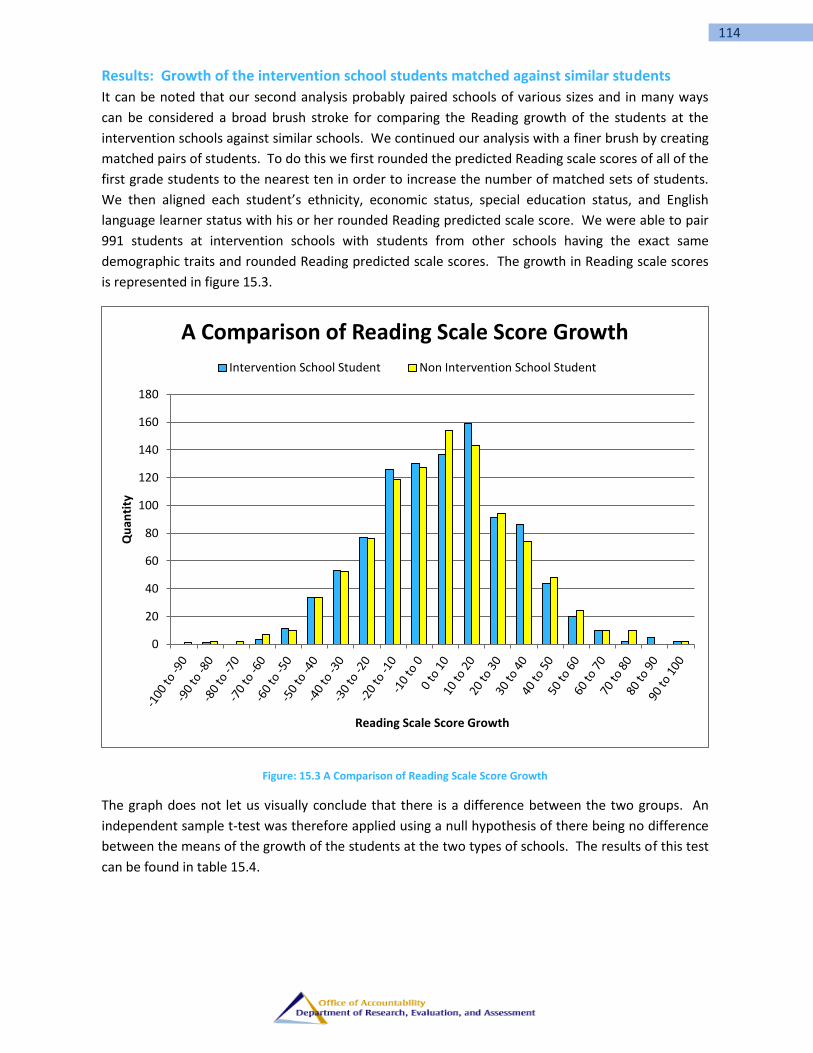
114
Results: Growth of the intervention school students matched against similar students
It can be noted that our second analysis probably paired schools of various sizes and in many ways
can be considered a broad brush stroke for comparing the Reading growth of the students at the
intervention schools against similar schools. We continued our analysis with a finer brush by creating
matched pairs of students. To do this we first rounded the predicted Reading scale scores of all of the
first grade students to the nearest ten in order to increase the number of matched sets of students.
We then aligned each student’s ethnicity, economic status, special education status, and English
language learner status with his or her rounded Reading predicted scale score. We were able to pair
991 students at intervention schools with students from other schools having the exact same
demographic traits and rounded Reading predicted scale scores. The growth in Reading scale scores
is represented in figure 15.3.
Figure: 15.3 A Comparison of Reading Scale Score Growth
The graph does not let us visually conclude that there is a difference between the two groups. An
independent sample t-test was therefore applied using a null hypothesis of there being no difference
between the means of the growth of the students at the two types of schools. The results of this test
can be found in table 15.4.
0
20
40
60
80
100
120
140
160
180
Qu
anti
ty
Reading Scale Score Growth
A Comparison of Reading Scale Score Growth
Intervention School Student Non Intervention School Student

115
Table 15.4: Independent samples t-test on Reading growth between students
Group Statistics
Intervention N Mean Std. Deviation Std. Error Mean
Growth Yes 996 4.463 26.5105 .8400
No 996 4.998 27.3313 .8660
Independent Samples Test
t-test for Equality of Means
t df Sig. (2-tailed)
Mean Difference
Std. Error Difference
95% Confidence Interval of the
Difference
Lower Upper
Growth -.443 1990 .658 -.5349 1.2065 -2.9011 1.8312
-.443 1988.153 .658 -.5349 1.2065 -2.9011 1.8312
Matching at the student level saw the students at the intervention schools had a slightly smaller
growth mean than their non-intervention school peers. Since p = .658, which is greater than .05, we
cannot reject the null hypothesis and can thus conclude that there is no statistical difference between
the two groups.
We were able to perform this same statistical test on the individual schools. The results can be seen
in table 15.5. They indicate that 10 of the 15 schools had growth means for their students that were
better than the comparison means. Dogwood Elementary had a mean increase of 9.8 scale score
points. This increase resulted in a p-value of .014 indicating that the probability of a result being this
extreme by random chance is less than 2%. As this value is less than p = .05 it is considered to be
statistically significant. Five of the 15 schools had growth means that were worse than those
generated by the comparison students. Among these schools Cedar Bluff was outperformed by 17.6
scale score points which was also statistically significant.

116
Table 15.5: Independent Samples t-test on Reading Growth between Students for Each Intervention School
School Count Mean School
Student Growth
Comparison Student Growth
Difference t-test
p-value
Adrian Burnett Elementary 77 9.1 5.4 3.7 0.349
Beaumont Elementary 73 7.9 .9 6.9 0.114
Cedar Bluff Elementary 152 -6.3 11.3 -17.6 0.000
Christenberry Elementary 57 -1.4 2.7 -4.2 0.379
Dogwood Elementary 82 8.3 -1.5 9.8 0.014
East Knox County Elementary 69 1.5 4.3 -2.8 0.515
Green Elementary 29 -7.6 2.7 -10.3 0.179
Inskip Elementary 64 10.2 7.2 3.0 0.522
Lonsdale Elementary 50 5.8 4.0 1.9 0.742
Mount Olive Elementary 44 6.4 1.9 4.5 0.529
Norwood Elementary 65 10.5 7.0 3.4 0.483
Sarah Moore Greene Elementary
50 1.8 4.6 -2.8 0.603
Spring Hill Elementary 54 10.1 3.3 6.8 0.263
Sunnyview Primary 83 6.6 3.7 2.9 0.441
West Haven Elementary 47 11.7 9.7 2.0 0.696
Total 996 4.5 5.0 -0.5 0.658
Conclusions and Considerations
Our analyses indicate that first grade students at the intervention schools exhibited significant growth
on the Reading portion of the SAT 10 exam; yet, this fact is tempered by the evidence that the
students at the intervention schools and the schools themselves have not been shown to be
statistically different from the students at the non-intervention schools and non-intervention schools
themselves. It should be noted that the SAT 10 is only one type of quantitative measure. It was used
because we were able to receive student prediction scores for it. Further qualitative research should
include investigations of the schools with large or significant positive or negative growth in an
attempt to understand the root causes of these results. Additional investigations can attempt to
relate the SAT 10 results with the other assessment results.

117
16. Additional Elementary Reading Support
Intervention Twenty schools were provided with an instructional assistant to improve Reading/Language Arts
scores and to help facilitate a Voyager Passport intervention with designated students in grades three
to five. This analysis is a smaller version of the Early Literacy Materials Report with a focus on the
students supported by the Additional Elementary Reading Support (AERS) interventionists.
Methodology
We linked various data sets together to create a testing data file. Our data file contained the
predicted and observed scale scores for grade three. For the fourth and fifth grades, we used the
previous year’s Reading/Language Arts (RLA) Normal Curve Equivalent (NCE) score as the predicted
score and the current year’s RLA NCE as the observed score. To control for as many variables as
possible, we decided to measure student growth only for and against students who were in the
Voyager file. This was done in part because the vast majority of AERS students were Voyager
students as well. We started with 611 students from the twenty schools. After eliminating students
who did not have a predicted score or moved to a non-AERS school or who were not listed on the
Voyager Passport data file, we ended up with 494 students with a complete data set.
The methodology of choice was to test student growth as measured by the difference between the
observed scores and the predicted scores. This was to be done on two separate measures: TCAP
Achievement scale scores in grade three, and TCAP NCEs in grades four and five.
We proposed to evaluate the AERS intervention by using
One-sample t-tests on the growth of the AERS students and two-sample t-tests comparing the
growth of AERS and non-AERS students who each were Voyager students, and
A matched-pair analysis between demographically equivalent AERS and non-AERS Voyager
students
Results: Initial t-test results
We were able to link the data of 198 third graders who were both Voyager and AERS students. This
grade was denoted as Measurement Type = Scale Score ACH. This group saw an average growth of
(negative) -5.35 scale score points which was significantly below zero. This indicates that this group
had a mean score below what was predicted for them. Among our fourth and fifth graders whose
scores were designated as Measurement Type = NCE ACH, we had 296 students in our data set. This
group saw an average gain of 2.21 NCEs which was significantly above zero. For significance we
considered a result to be significant if the probability of a result of this kind happening by chance was
less than 1 in 20 (or p<.05).
Mean gains by school were calculated and these results are in tables 16.1 and 16.2 below.

118
Table 16.1: One-sample t-tests on Reading Growth among AERS Students in Grades 4 and 5 by School
Predicted Score
Observed Score
Growth
Mean Mean Mean Count p
Adrian Burnett Elementary 34.8 33.0 -1.9 47 0.34
Amherst Elementary 35.3 38.2 2.9 22 0.257
Ball Camp Elementary 31.3 35.4 4.1 14 0.264
Blue Grass Elementary 43.6 39.9 -3.8 8 0.619
Bonny Kate Elementary 35.7 39.6 3.9 11 0.572
Chilhowee Intermediate 34.4 41.2 6.8 16 0.059
Christenberry Elementary 27.5 28.5 0.9 13 0.823
Copper Ridge Elementary 36.7 32.3 -4.3 6 0.084
Dogwood Elementary 33.6 31.7 -1.9 13 0.677
Fountain City Elementary 32.6 38.1 5.5 16 0.101
Gibbs Elementary 42.2 41.9 -0.3 10 0.959
Green Elementary 30.6 27.0 -3.6 14 0.312
Halls Elementary 30.2 38.1 7.8 13 0.077
Inskip Elementary N/A N/A N/A N/A N/A
Karns Elementary 35.2 39.2 4 30 0.109
Norwood Elementary 26.8 24.1 -2.7 15 0.371
Pond Gap Elementary 36.5 43.5 6.9 11 0.015
Sarah Moore Greene Elementary 27.6 22.0 -5.6 5 0.47
Spring Hill Elementary 35.3 38.2 2.9 14 0.527
West Haven Elementary 33.7 46.6 12.8 18 0
Total 33.9 36.1 2.2 296 0.008
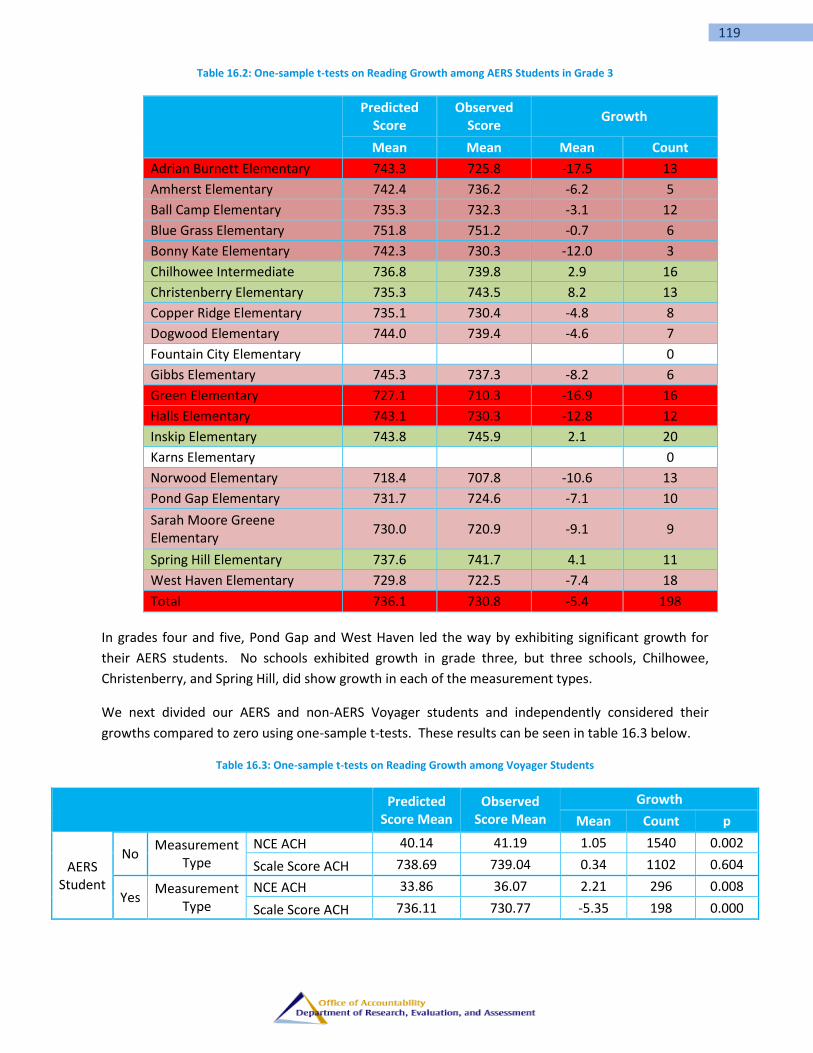
119
Table 16.2: One-sample t-tests on Reading Growth among AERS Students in Grade 3
Predicted
Score Observed
Score Growth
Mean Mean Mean Count
Adrian Burnett Elementary 743.3 725.8 -17.5 13
Amherst Elementary 742.4 736.2 -6.2 5
Ball Camp Elementary 735.3 732.3 -3.1 12
Blue Grass Elementary 751.8 751.2 -0.7 6
Bonny Kate Elementary 742.3 730.3 -12.0 3
Chilhowee Intermediate 736.8 739.8 2.9 16
Christenberry Elementary 735.3 743.5 8.2 13
Copper Ridge Elementary 735.1 730.4 -4.8 8
Dogwood Elementary 744.0 739.4 -4.6 7
Fountain City Elementary 0
Gibbs Elementary 745.3 737.3 -8.2 6
Green Elementary 727.1 710.3 -16.9 16
Halls Elementary 743.1 730.3 -12.8 12
Inskip Elementary 743.8 745.9 2.1 20
Karns Elementary 0
Norwood Elementary 718.4 707.8 -10.6 13
Pond Gap Elementary 731.7 724.6 -7.1 10
Sarah Moore Greene Elementary
730.0 720.9 -9.1 9
Spring Hill Elementary 737.6 741.7 4.1 11
West Haven Elementary 729.8 722.5 -7.4 18
Total 736.1 730.8 -5.4 198
In grades four and five, Pond Gap and West Haven led the way by exhibiting significant growth for
their AERS students. No schools exhibited growth in grade three, but three schools, Chilhowee,
Christenberry, and Spring Hill, did show growth in each of the measurement types.
We next divided our AERS and non-AERS Voyager students and independently considered their
growths compared to zero using one-sample t-tests. These results can be seen in table 16.3 below.
Table 16.3: One-sample t-tests on Reading Growth among Voyager Students
Predicted Score Mean
Observed Score Mean
Growth
Mean Count p
AERS Student
No Measurement
Type
NCE ACH 40.14 41.19 1.05 1540 0.002
Scale Score ACH 738.69 739.04 0.34 1102 0.604
Yes Measurement
Type
NCE ACH 33.86 36.07 2.21 296 0.008
Scale Score ACH 736.11 730.77 -5.35 198 0.000

120
As mentioned above, our fourth and fifth grade AERS students exhibited a significant RLA gain; but
the non-AERS students exhibited a significant gain as well. The table indicates that the AERS students
had a 2.21 mean NCE gain while their peers had a 1.05 mean NCE gain. As a note of interest, the
Predicted Scores of AERS students are significantly below their non-AERS peers. This indicates that
choosing AERS students was deliberate. This group that had previously performed much lower than
their peers grew at a faster rate. This indicates that this intervention was helpful in closing the
reading gap in fourth and fifth grades.
Third grade tells a different story. While the mean predicted scores for the AERS students is lower,
736 to 739 scale score points, the difference is not significant. What is significant is how the two
groups grew. The non-AERS students exhibited a small, but not statistically significant, gain of .34 of a
scale score point, while our treatment group, the AERS students, exhibited a significant 5.35 mean
scale score loss.
A two-sample t-test was conducted comparing the two groups. The mean gains for the two NCE ACH
groups turned out to be no different from a statistical perspective (p = .174). At the third grade level,
the AERS students performed significantly worse than their non-AERS peers (p < .001). These results
are summarized in table 16.4. Table 16.4: Two-sample t-tests on Reading Growth for Voyager Students
Measurement Type AERS Student Mean Growth
Non-AERS Student Mean Growth Difference t statistic p-value
NCE ACH 2.21 1.06 1.15 1.359 0.174
Scale Score ACH -5.35 0.35 -5.7 -3.395 0.001
Matched Pair Results
In an attempt to create a tight comparison between AERS and non-AERS Voyager students, students
were paired based upon their demographic information and their predicted reading scores. The
demographic information used consisted of their ethnicity, their economic status, their special
education status, and their English language learner status. Their predicted reading scores did not
have to be exactly the same, but did have to be within either one NCE or five scale score points. In
the end we were able to match 453 pairs of students among the two measurement types.
We conducted a two-sample t-test on our matched pairs and these results can be found in table 16.5.
Table 16.5: Two-sample t-tests on Reading Growth for the Matched Pairs
Measurement Type
Count in Each Group
AERS Student Mean Growth
Non-AERS Student Mean Growth Difference t statistic p-value
NCE ACH 261 2.29 1.22 1.07 0.899 0.369
Scale Score ACH 192 -6.31 -0.23 -6.08 -3.04 0.003
121
The results mimic our previous results. The mean growths were a little bit different for each group,
but we continued to see that the third grade AERS group had a significant mean loss when compared
to their non-AERS peers.
Conclusions
The Additional Elementary Reading Support intervention is a tale of two tests. In grades four and five
where Normal Curve Equivalent scores were used to assess progress, the mean growth of the
students in the intervention was significantly greater than predicted and twice as large as Voyager
students who were not in this intervention (while twice as large, the gain was not significantly larger
than this peer group.) A matched-pair design comparing demographically equivalent students
confirmed these results.
The results changed direction for third grade. This group was measured by Achievement Scale Scores
and the students in the intervention exhibited significant losses both against the predicted means and
against demographically equivalent students. This reversal was evident at many schools in addition to
the group as a whole.
Further qualitative investigation is needed to ascertain why the results would be so different at the
third grade level. It may be an unintended consequence of the third-grade retention policy, but the
match pair design results should have negated this potential.

122
17. Summer Bridge The Knox County summer bridge program was originally designed as an intervention for rising
freshman that raised warning flags in attendance, grades, and state testing results. The intent of the
program was to provide a “bridge” between middle and high school to get potentially off-track
students back on-track. The traditional focus of the 6-8 week summer bridge was to re-teach
Reading/English Language Arts (RLA/ELA), Math and study skills.
In 2012-2013, the summer bridge program was expanded to include rising 6th graders to bridge
between elementary and middle schools. The expanded summer bridge pilot involved students who
would be attending two different Knox County middle schools (Northwest and Whittle Springs). The
initial selection of students for the expanded summer bridge program was based solely on state test
results (students who were basic or below basic).
Methodology
Although the summer bridge program has been around in Knox County since the 2009-2010 academic
year, there has been no systematic study of its effectiveness. Therefore, the first step in this analysis
is to determine the effectiveness of the pre-existing (high school) summer bridge program. Once the
legitimacy of the summer bridge program is established, we will look at some interim results from the
expanded summer bridge program and discuss future analysis of expanded summer bridge once
2013-2014 TCAP results are available.
The initial analysis of the high school summer bridge program was conducted to determine changes in
trajectory of enrolled students. Baseline Math and RLA NCEs were calculated from 7th grade TCAP
results. A match-pair design was used to create a control group who had similar NCEs in 7th grade but
were never enrolled in the bridge program. The distributions of 7th grade NCEs for both Math and
RLA for the treatment and control groups are in figures 17.1 and 17.2.
Figure 17.1: Initial Distribution of RLA NCEs
0
5
10
15
20
25
30
35
40
45
50
10 20 30 40 50 60 70 80
Nu
mb
er
of
Stu
de
nts
7th Grade RLA NCE
Distribution of 7th Grade RLA NCEs
Treatment
Control
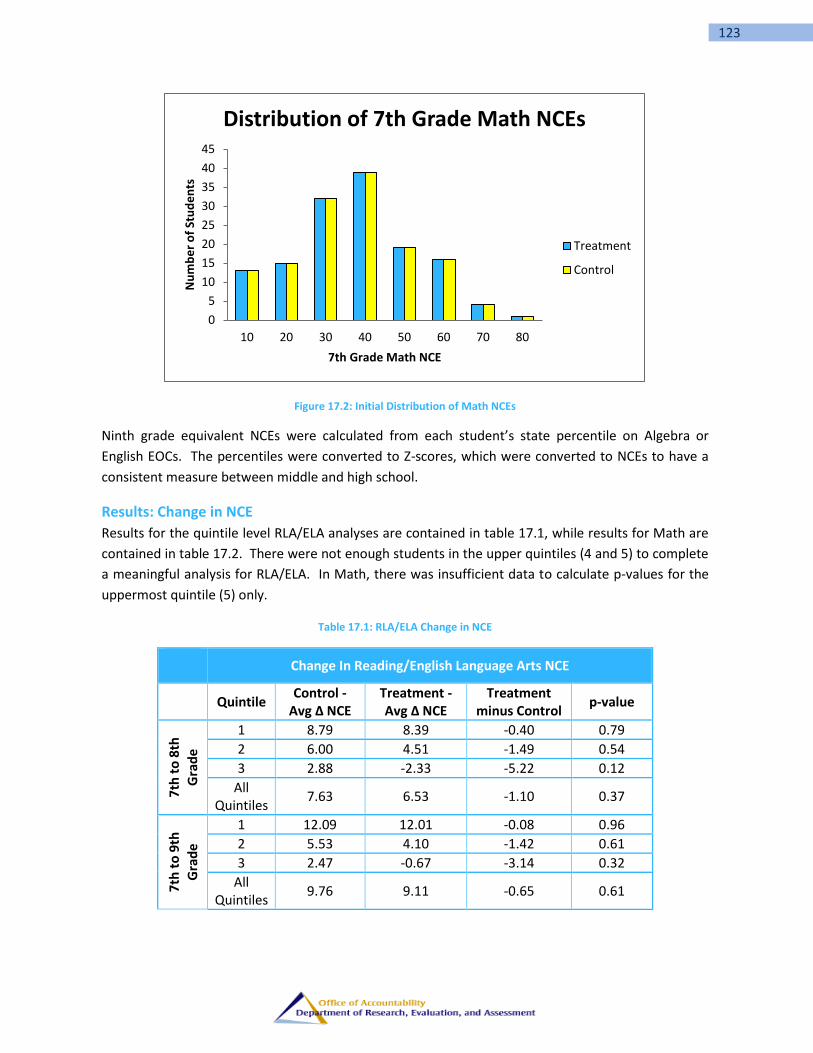
123
Figure 17.2: Initial Distribution of Math NCEs
Ninth grade equivalent NCEs were calculated from each student’s state percentile on Algebra or
English EOCs. The percentiles were converted to Z-scores, which were converted to NCEs to have a
consistent measure between middle and high school.
Results: Change in NCE
Results for the quintile level RLA/ELA analyses are contained in table 17.1, while results for Math are
contained in table 17.2. There were not enough students in the upper quintiles (4 and 5) to complete
a meaningful analysis for RLA/ELA. In Math, there was insufficient data to calculate p-values for the
uppermost quintile (5) only.
Table 17.1: RLA/ELA Change in NCE
Change In Reading/English Language Arts NCE
Quintile
Control - Avg Δ NCE
Treatment - Avg Δ NCE
Treatment minus Control
p-value
7th
to
8th
Gra
de
1 8.79 8.39 -0.40 0.79
2 6.00 4.51 -1.49 0.54
3 2.88 -2.33 -5.22 0.12
All Quintiles
7.63 6.53 -1.10 0.37
7th
to
9th
Gra
de
1 12.09 12.01 -0.08 0.96
2 5.53 4.10 -1.42 0.61
3 2.47 -0.67 -3.14 0.32
All Quintiles
9.76 9.11 -0.65 0.61
0
5
10
15
20
25
30
35
40
45
10 20 30 40 50 60 70 80
Nu
mb
er
of
Stu
de
nts
7th Grade Math NCE
Distribution of 7th Grade Math NCEs
Treatment
Control

124
Inspection of the difference of mean change in NCE (treatment minus control) indicates the change in
mean NCE improved after students were exposed to the summer bridge program (though in some
cases, the difference was not statistically significant). Deficits between the treatment group and
control group moderated after the summer bridge intervention. This moderation provides some
evidence that the gap (in mean NCE) between bride and non-bridge students is no longer growing.
The p-values in tables 17.1 and 17.2 are the probabilities that the mean change in NCE is the same for
both treatment and control groups. We can see in table 17.1 that after treatment, there is a higher
probability in each quintile that the scores are the same. This provides some evidence that the
summer bridge program is putting bridge students back on track with their peers.
Table 17.2: Math Change in NCE
Change In Math NCE
Quintile
Control - Avg Δ NCE
Treatment - Avg Δ NCE
Treatment minus Control
p-value
7th
to
8th
Gra
de
1 11.20 10.14 -1.06 0.70
2 11.26 2.62 -8.64 0.00
3 1.33 -2.90 -4.23 0.23
4 4.91 -3.75 -8.66 0.10
All Quintiles
9.18 4.75 -4.43 0.01
7th
to
9th
Gra
de
1 11.34 8.27 -3.07 0.32
2 4.05 3.86 -0.19 0.96
3 -4.67 -5.90 -1.23 0.73
4 -2.45 -4.58 -2.13 0.69
All Quintiles
5.66 3.75 -1.91 0.35
The Math data exhibits some of the same trends. In every quintile but the first, the difference
between the mean change in NCE decreases after students have been enrolled in the summer bridge.
In quintiles 2 through 4, the p-value indicates that the mean change in NCE aligns more closely with
the control group after summer bridge intervention. The greatest effect is seen in quintile 2. Prior to
treatment, there was virtually zero probability that the treatment and control groups were exhibiting
the same change in NCE from year to year. After the intervention, there was a 96% probability that
the growth was the same between 7th and 9th grade.
Despite these apparent successes, it is troubling that students in the first quintile appear that they are
being outpaced by their non-bridge peers. Most troubling is that this quintile accounts for 46% of the
students that are enrolled in the summer bridge program.
The results of the chi-squared tests on the distribution of students with year-over-year increases in
NCE are contained in tables 17.3 and 17.4.
125
Table 17.3: Chi-Squared Test Results - RLA
Percent of Students Exhibiting an Increase in RLA/ELA NCE
Control Treatment
Treatment minus Control
p-value
From 7th to 8th 72% 67% -6% 0.1450
From 7th to 9th 79% 74% -6% 0.1090
Analysis of the reading distributions indicate that summer bridge students are exhibiting consistent
improvement when compared to their non-bridge peers. The p-value, which is the probability that
the distribution of students exhibiting year-over-year increase in NCE is the same between treatment
and control, indicates that there is a slightly lower probability that the distributions are the same after
treatment. Whereas table 17.1 indicates that RLA/ELA NCEs are improving at a faster rate in the
bridge program, table 17.3 indicates that growth may be from a distinct population of those students,
rather than from across the cohort as a whole.
Table 17.4: Chi-Squared Test Results - Math
Percent of Students Exhibiting an Increase in Math NCE
Control Treatment
Treatment minus Control
p-value
From 7th to 8th 73% 59% -14% 0.0003
From 7th to 9th 60% 58% -2% 0.7294
The math results are more encouraging. The p-value indicates that there was very low probability
that the control group and treatment group had the same distribution of students with increasing
year-over -year NCEs. However, after the summer bridge, the difference between the two groups has
considerably decreased, and the probability that the two groups have the same distribution of
students increasing year over year NCEs has increased. Coupled with the data in table 17.2, this
indicates that growth is coming from a large population of students. However, as was already
discussed, there are still potential issues with growth in the first quintile for math students.
Outcome data for students that were involved in the new elementary to middle bridge program will
not be available until 2013-2014 test results are released. As such, the Scholastic Reading Inventory
(SRI) pre and post-tests were used as a proxy for growth. Results indicated that about 20% of
students enrolled in the elementary to middle summer bridge exhibited at least 1 year of growth (as
measured by the SRI lexiles). Math growth was measured through the elementary-to-middle summer
bridge program using the Scholastic Math Inventory assessment. On this assessment, about 40% of
students enrolled in the expanded summer bridge program exhibited at least 1 year of growth.
Without comparison data, it is impossible to determine the effectiveness of the expanded bridge
program. The analysis of the expanded summer bridge program will be carried out in the same way
as the high school bridge analysis above once 2013-2014 TCAP data is available.

126
Conclusions and Considerations
The directional data (p-values and means) seem to indicate that the program is having its intended
effect of putting students back on track with their academic peers. Gains, however, are seldom
sufficiently large enough to provide strong statistical evidence of the program’s merits. Gains can be
seen in the NCE data in both of the subject areas (reading and math) and there is some evidence that
bridge students are increasing math NCEs at a faster rate than their peers. The greatest concern for
the summer bridge program should be the students in the first math quintile. This is the only area in
which there is some evidence that achievement gaps are growing rather than decreasing.
The detailed analysis on the expanded summer bridge program will occur once the summative data
from 2013-2014 is available. The methodology for that analysis will mirror the analysis presented in
this section regarding the high school summer bridge program.
127
APPENDIX The following Appendices include information referenced in the Management and Technical Reports.
These documents provide further context and additional analysis to support the reports’ conclusions
and recommendations.

128
This page intentionally left blank.

129
1. Appendix: 2012 ROI Executive Summary
Executive Summary for Return on Investment Report
In July 2009, the Knox County Board of Education adopted a strategic plan for the Knox County
Schools (KCS) entitled, Building on Strength: Excellence for All Children. Through a continued focus on
implementation of the plan, and by reallocating existing resources, strategically targeting federal and
private dollars, and implementing internal efficiencies, the Knox County Schools has begun to meet
some of the milestones and academic goals outlined in the plan. Our goals are purposefully ambitious
however, and while improvements in student achievement are encouraging and noteworthy, they
have been largely incremental and continue to reflect some significant challenges facing our school
district.
Acknowledging the need to accelerate improvements in our academic outcomes and recognizing that
the strategies and initiatives necessary to make these improvements require resources beyond our
current funding level presented a compelling case for a detailed analysis in the following areas:
1. Current funding sources and allocation practices
2. Expenditures versus student performance outcomes
3. Present return on investment for major district initiatives
4. Comparison study of other schools with similar demographics but better outcomes
The financial analysis revealed that the vast majority of the Knox County Schools budget represents
the cost of the people necessary to perform the work of education, and the increase in the budget
since fiscal year (FY) 2009 has totaled $14.5 million, an average of only 1.3% annually. The vast
majority of that increase has been committed to instruction and instructional support expenditures,
with debt service also taking up the next largest proportion of the total increase. The budget increase
over the past three years has generally not been for salaries and wages, which have remained
relatively stable since 2009, but rather can be largely attributed to the impact of required increases in
insurance premiums and retirement contributions (principally for teachers) which the school system
does not directly control. The budget increases of the past three years were funded almost entirely
(97.8%) by additional revenues from the state basic education program (BEP). Funding from Knox
County sources is roughly equal in FY 2012 to where it was in FY 2009, essentially because sales tax
revenue has decreased more than property and other local tax revenue has increased. To maintain an
essentially flat budget, the Knox County Schools has made use of grants and other time-limited
resources and aggressively managed non-instructional expenses to maximize the proportion of funds
available for instruction and support.
It is also clear that the funding provided from the state through the “Basic Education Program" is
insufficient to adequately meet the needs of the students in Knox County and woefully insufficient to
attain the ambitious goals outlined in the Knox County Schools Strategic Plan. In absence of significant
enhancements to the BEP, the burden will continue to fall on our local community to provide
adequate resources necessary to ensure Excellence for All Children.

130
Several operational themes emerged from our return on investment analyses:
Time matters. The amount of time students are meaningfully engaged in learning and their
level of expectations for themselves are directly proportional to academic outcomes.
We need the right people doing the right work. Clearly defined roles and skills matched to
role can make or break an initiative.
Leadership, consistency, focus and resources make a difference. Outcomes of an educational
initiative depend on fidelity of implementation. Fidelity of implementation requires
consistency in focus and support. The level of focus and support depends on the level of
leadership and investment.
We need data to keep score and inform decisions. Appropriate data for decision-making
requires an infrastructure and culture of assessment and accountability to investments from
the outset.
Below is a summary of the operational recommendations associated with each of these themes, with
rationale and highlights from the details provided in the full text of the report. These
recommendations are designed to maximize the return on our educational investment.
Time on Task and Student Expectations
Scheduling Models: Maintain current middle school schedule but allow/encourage hybrid
scheduling in high school.
Excellence Through Literacy: Revise structure of literacy interventions in middle and high
school. Ensure that middle school and high school students received the full grade-level
course of language arts regardless of reading-specific intervention.
Magnet and Project GRAD: Increase academic rigor in magnet schools and continue Project
GRAD scholarship program.
Kindergarten: Implement a full-day Kindergarten program for all students in the district.
Benchmarking: Explore options for more time on task at all levels, informed by an
examination at the school level of the amount of time during the existing school day that
students are not – but could be – engaged in learning.
Defined Roles and Appropriate Skills
Instructional Coaching Model and Excellence Through Literacy (Elementary): Clearly define a
feasible set of coaching roles and responsibilities focused on professional development and
facilitation of professional learning communities (PLCs).
Project GRAD: Discontinue academic components; for remaining Project GRAD math coaches,
assess skills and match to the KCS coaching model, where appropriate. If the scope of the
Project GRAD partnership will be broader than the college access program in future years,
outline in the contract details of the activities and staff associated with the KCS dollars
committed as well as a reporting structure that defines accountability to the Project GRAD
staff and principals.
131
Block scheduling: Targeted professional development to ensure that in every high school, the
personnel responsible for the master schedule have the appropriate skills for the complexity
of the task.
Magnet: Develop specific criteria for staff selection and consider significant restructuring
where necessary to ensure highly effective education
Benchmark: Continue to provide principals with flexibility for staffing their schools via the
budget allocation formula as long as decisions have and continue to lead to improved
outcomes.
Focus, Consistency, and Support
Coaching Model:
o Build into the budget additional assistance matched to need for schools that do not
have assistant principals.
o Maintain a full-time coaching model in elementary schools and consistent school
assignments for coaches.
o Implement a supervisory structure for coaches to report to content supervisors as
well as principals to ensure district-wide coordination and support.
Magnet: Develop rigorous and specialized curriculum for magnet offerings, and provide
ample resources to support implementation.
Staffing formulas: It is important that the current staffing model be reviewed and adjusted
each year to ensure that its philosophical underpinnings translate to rational allocations.
All present and future initiatives: Develop assessment plan including short-term
fidelity/quality measures and longer-term outcome indicators and workload priorities.
Culture of Data Driven Decision-making (Quantitative and Qualitative)
All present and future initiatives: Develop and execute assessment plan as noted above,
including collection of data/information from the outset and funding contingent on short-
term quality and progress measures and project milestones for termination or expansion
based on achievement of outcomes.
Project GRAD: Develop in coordination with Project GRAD an analysis plan including agreed-
upon structure and content for tracking and data collection regarding students in the
scholarship program.
Middle and high school reading interventions: Convene a representative selection of
principals, teachers, coaches, and directors to review full program evaluation data for
Language! and develop a data-driven course of action.
Elementary school scheduling model (parallel block) and coaching: Ensure focus in
elementary PLCs with coaches to facilitate and assess quality and continue to collect data to
assess appropriate staffing ratios and the effect of full Excellence Through Literacy
investment.

132
These recommendations and analyses support the broader priorities for several important initiatives,
including: more instructional time for students, enhanced instructional support for teachers,
interventions for struggling students and enrichment opportunities for excelling students, consistently
excellent magnet programs, and expanded performance pay to recruit and retain the very best
educators. However, these priorities appear not to be within reach of the Knox County Schools’
current revenue structure and instructionally-focused budget. This analysis suggests that if the KCS
wants to accelerate and enhance student growth and achievement and be competitive at regional,
state and national levels, additional investment will be needed. Therefore, it is recommended that the
district develop a five-year budget proposal that identifies priority areas for additional resources
based on these findings and an assessment plan and progress measures that lead toward the
anticipated impact on student achievement and attaining the district’s ambitious goal of Excellence
for All Children.

133
2. Appendix: $7MM Investment Summary

134
3. Appendix: Smarter School Spending “Smarter School Spending”
Project Overview July 2013
Background Knox County Schools has received a grant from the Bill & Melinda Gates Foundation (Gates Foundation) for an initiative aimed at strengthening our ability to align resources to district priorities. An initial investment of $840,000 will be funded through the Gates Foundation, with the remaining 30 percent of the investment being provided by the Knox County Schools per the grant guidelines. The total value of the grant is estimated at $1.2 million. Knox County Schools (KCS) is one of four school districts across the country to receive funding from the Gates Foundation for this important work. (The other districts are Fayette County Public Schools in KY, Lake County Schools in FL, and Rochester City School District in NY.) To support our effort to ensure that we are allocating resources in a manner that most strategically supports student learning, KCS has retained The Parthenon Group (Parthenon) and Education Resource Strategies to assist with data collection, resource utilization, and return on investment analysis. Between July and December, we will work together to assess how we can make KCS’ most critical and high-impact initiatives more effective and create opportunities to realign resources in a way that maximizes student success. This is an opportune time for the KCS to think critically about resource alignment as we begin a process to develop a new five-year strategic plan that builds on the current Excellence for All Children roadmap. When the “Smarter School Spending” project is complete, we will have developed a set of sustainable recommendations regarding resource allocation, a budgetary framework for implementing the recommendations, and a sustainable process for continuous improvement going forward. Focus Areas Identified for Deeper Resource Analysis As part of this initiative, KCS has identified a range of focus areas for careful analysis. These are areas where the district has made investments and is looking to better understand their realized or potential impact on student achievement. The end goal of the “Smarter School Spending” project is to identify ways to maximize resources for the highest impact programs and initiatives. Focus Areas
High School Block Scheduling Instructional Coaching Model Utilization and Effectiveness General Education Instructional Aides Utilization and Effectiveness Teacher Evaluation System, including Lead Teachers Professional Development Supports, including the TAP model Strategic Compensation (APEX) Special Education Early Grade Intervention Programs Personalizing Student Learning

135
4. Appendix: ERS/Parthenon Analysis –
Overall Resource Allocation
Note: (1) Central Office expenditure total differs from the cross-district comparison figure due to $55 per pupil in “system-wide” spending that is included for purposes of comparison with benchmarks but excluded from the KCS Central Office definition. (2) Districts included in the median are Duval, Hall, Fulton, Prince Georges County, AISD, Baltimore, Denver, DC, Newark, Cleveland, Lake. Source: ERS Financial Analysis, Parthenon Analysis

136
Note: Median does not include KCS. Source: KCS 2011-12 expenditure data; ERS analysis
Note: Central Office spending is defined as district governance and management of support services provided to schools. It includes personnel who report to work at the Central Office and non-personnel “overhead” costs that cannot be attributed to schools in any way. KCS % Central Office does not include system-wide spending. Median does not include KCS. Source: KCS 2011-12 expenditure data; ERS analysis.
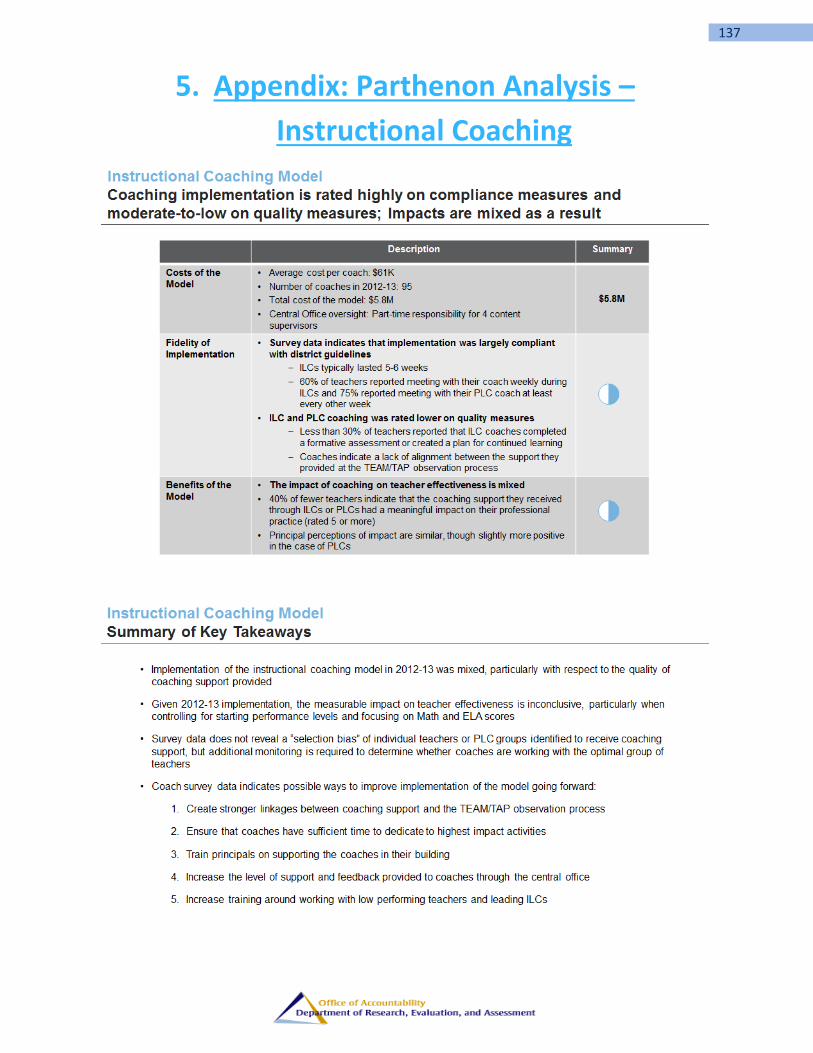
137
5. Appendix: Parthenon Analysis –
Instructional Coaching
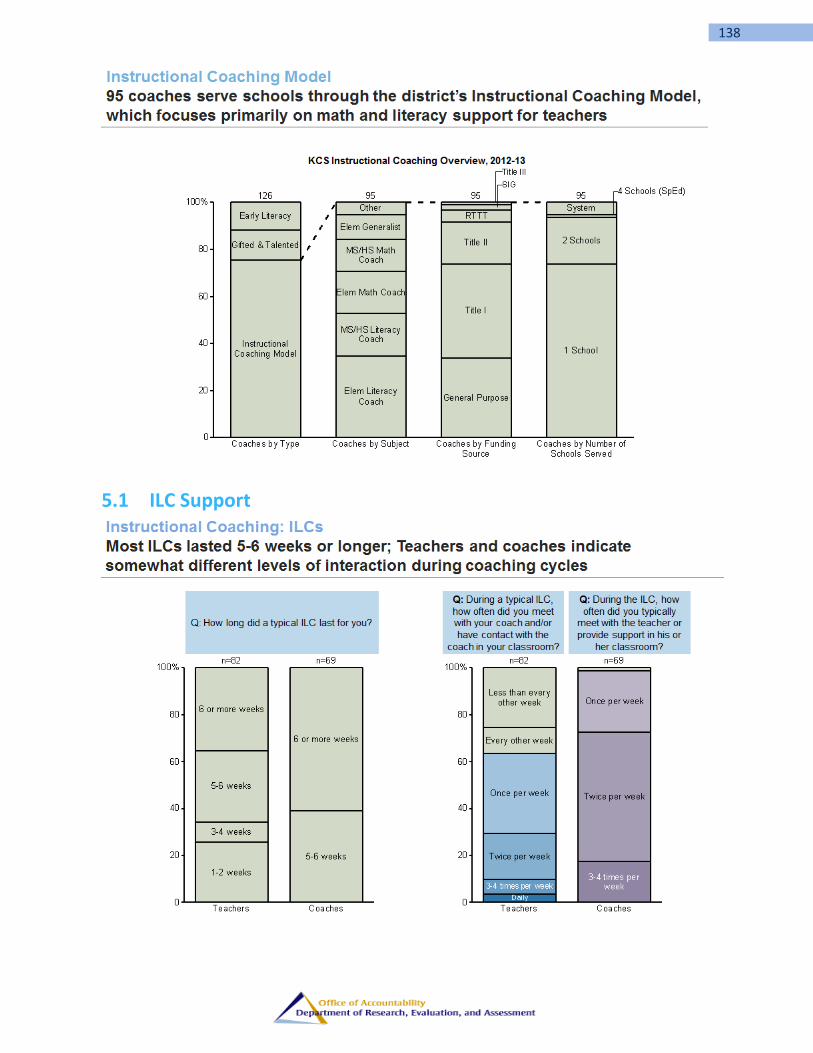
138
5.1 ILC Support

139
Source: Parthenon/KCS Survey, Fall 2013; n = 82 teachers

140
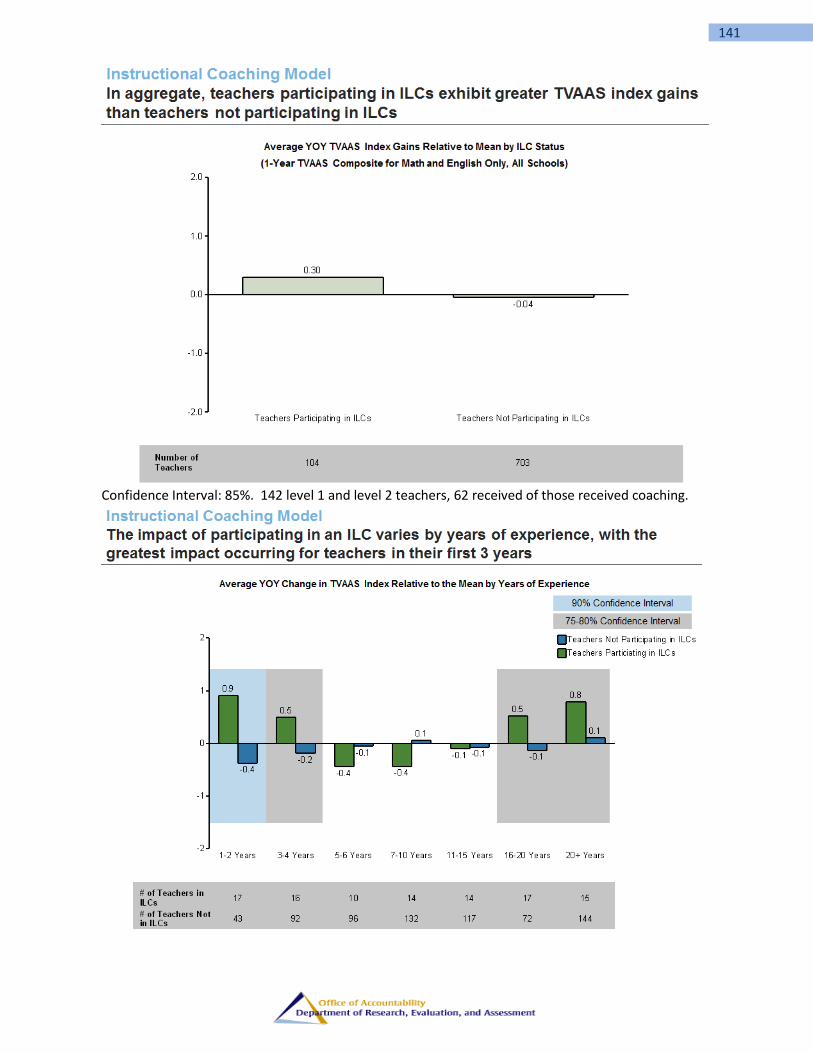
141
Confidence Interval: 85%. 142 level 1 and level 2 teachers, 62 received of those received coaching.
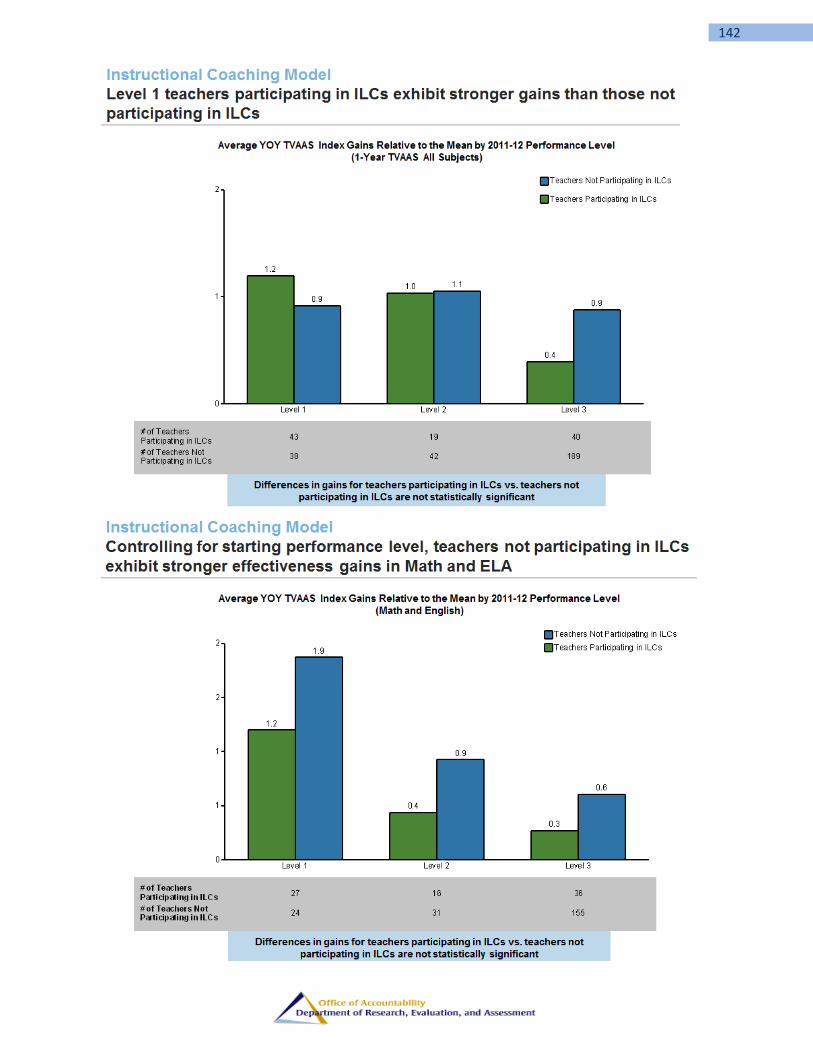
142

143
5.2 PLC Support

144
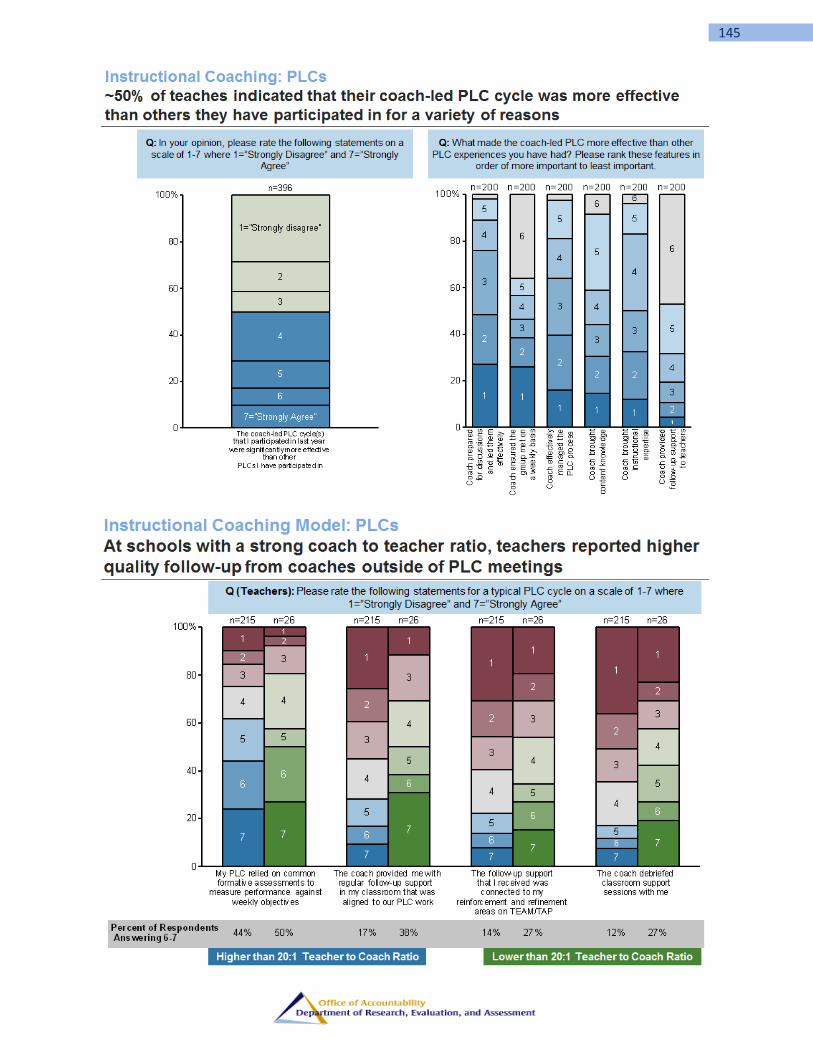
145

146

147
Note: Analysis excludes high school PLCs due to incomplete data mapping coaches to particular subject areas

149
6. Appendix: PLC SMART Goal Examples The following table includes SMART goals from the 2012-2013 school year.

150
7. Appendix: Parthenon Analysis –
Lead Teachers and TEAM Evaluation

151

152

153

154
Note: Outlier observations are defined as those 2 or more points higher than TVAAS levels, using 2012-13 average observation scores and 2012-13 3 year average TVAAS (non-TAP schools); Source: KCS TEAM observation data (2012-13)

155

156
8. Appendix: Parthenon Analysis –
TAP Model

157

158
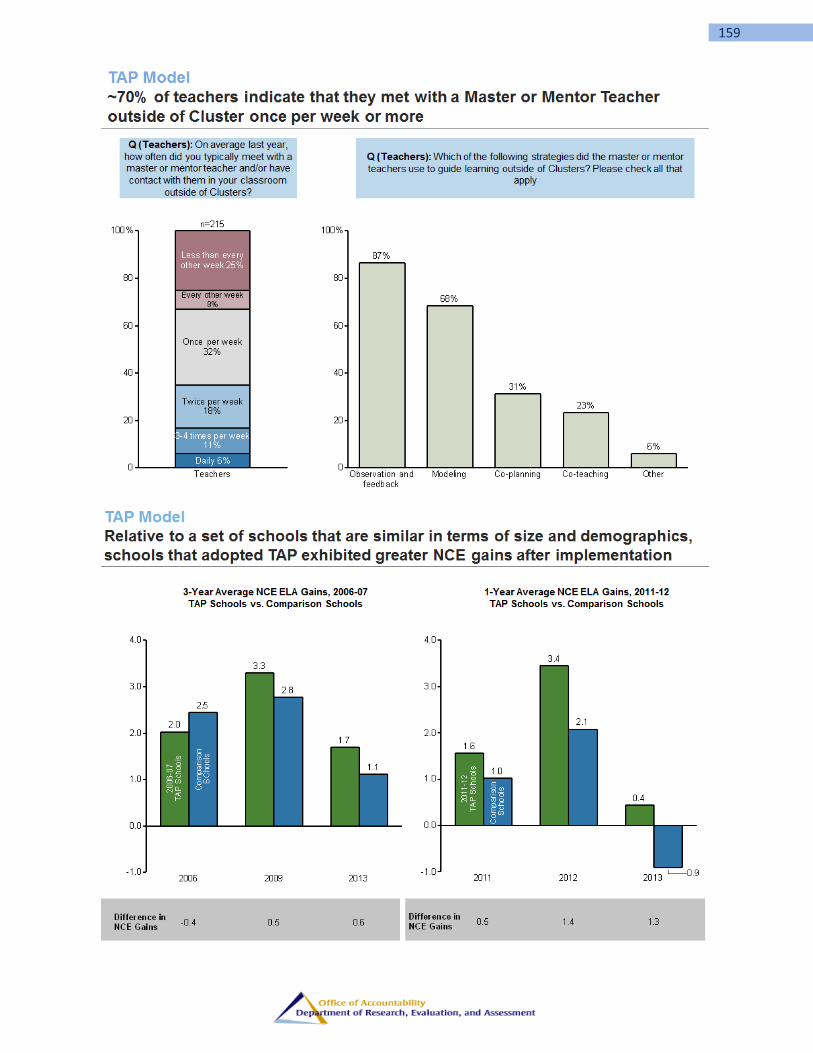
159
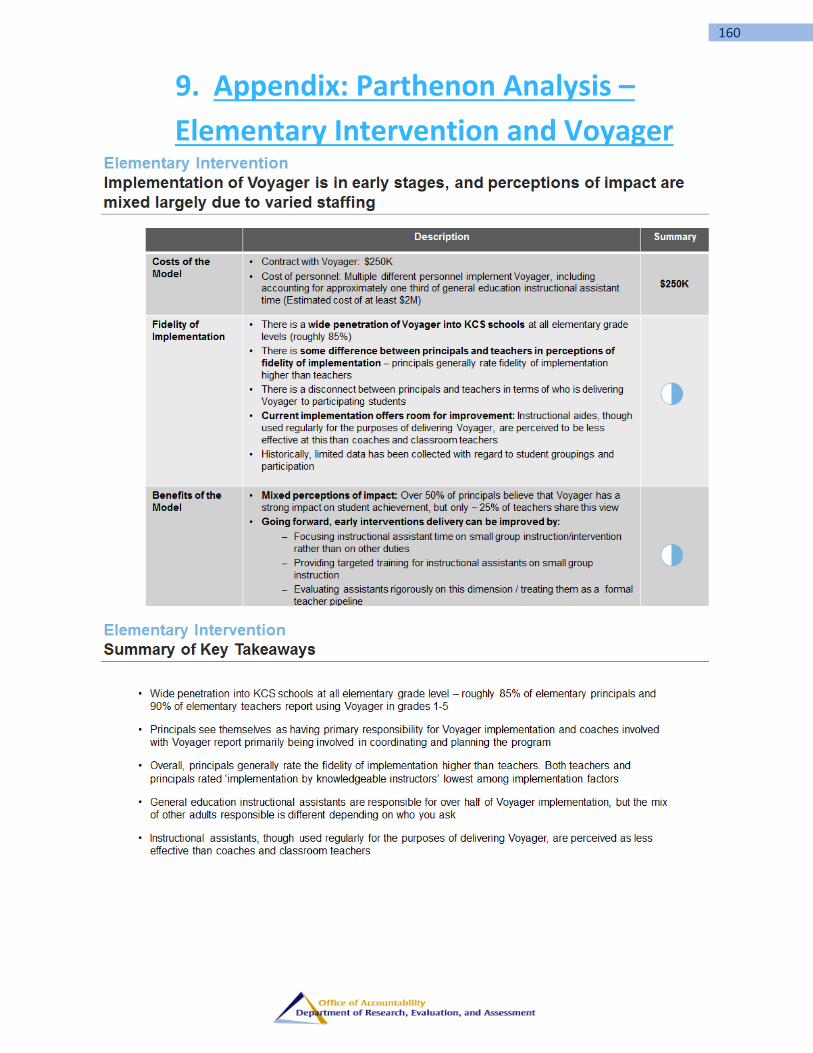
160
9. Appendix: Parthenon Analysis –
Elementary Intervention and Voyager

161
Source: Parthenon/KCS Survey, Fall 2013; n = 34 ES principals, 185 K-5 teachers
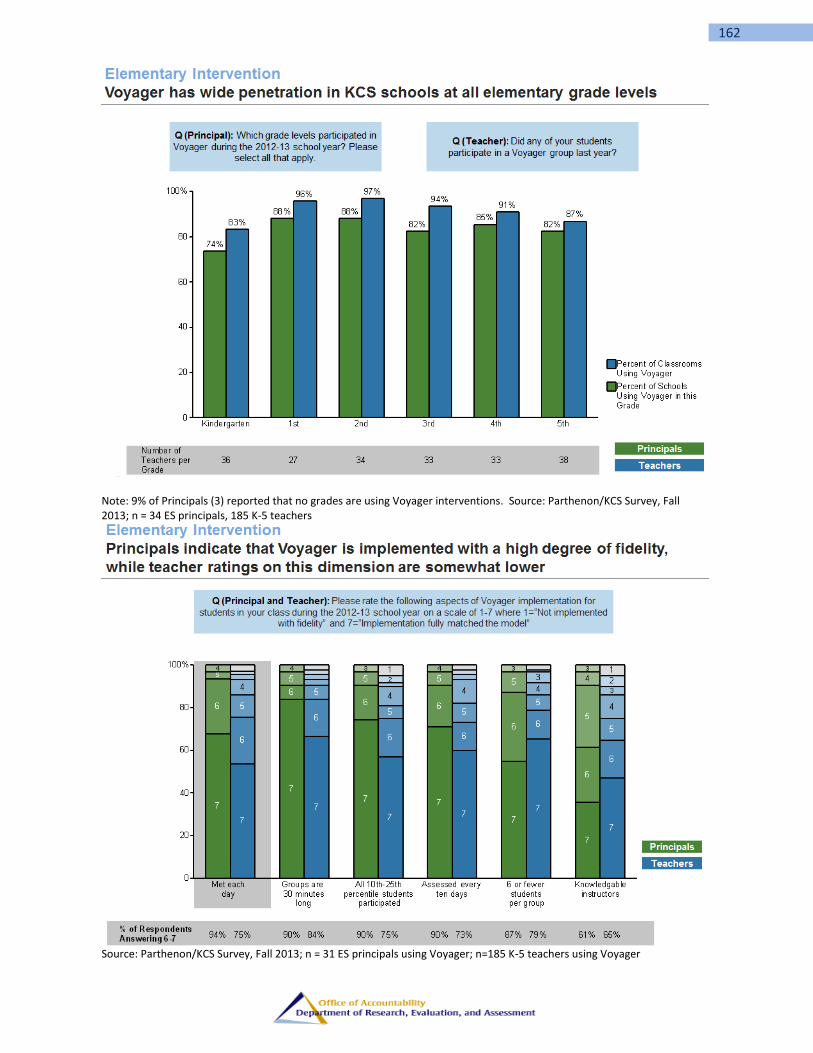
162
Note: 9% of Principals (3) reported that no grades are using Voyager interventions. Source: Parthenon/KCS Survey, Fall 2013; n = 34 ES principals, 185 K-5 teachers
Source: Parthenon/KCS Survey, Fall 2013; n = 31 ES principals using Voyager; n=185 K-5 teachers using Voyager

163

164

165
10. Appendix: Parthenon Analysis –
Instructional Assistants

166
Note: *Indicates option was not included as option in teacher survey; the majority of teachers who listed “other” indicated assistants doing lunch duty, principals cited other coverage responsibilities.
Parthenon/KCS Survey, Fall 2013; n = 34 principals, n=176 teachers

167

168
Source: Parthenon/KCS Survey, Fall 2013; n = 130 with 2013 TVAAS (of 176 receiving assistant support)
169
11. Appendix: Enrichment Allocation
Proposals This appendix includes a sample of five proposals that schools sent in order to receive the enhanced
learning grant. (See Enrichment Programs Management Report). There are two from elementary
schools (Adrian Burnett and Brickey-McCloud) and three from secondary schools (Cedar Bluff Middle,
South-Doyle Middle and West High).

170
11.1 Adrian Burnett Elementary
What: The district is providing the possibility for each school to receive up to a $3,000 allotment for the purpose
of providing enhanced learning opportunities (academic enrichment) for its students. These opportunities should
allow students the option of participating in activities such as the following:
Science, Technology, Engineering and Mathematics (STEM) activities beyond traditional coursework
School sponsored academic competitions
School sponsored clubs related to STEM
The above activities are not meant to be all encompassing. If you have ideas other than the ones listed
above, please feel free to submit those as a part of your plan. Be CREATIVE!
Who: Select a target audience within your school:
Students in grades 3-5 whose TCAP scores are close to proficient in PS 2: (Motion, Forces, and Nature)
will be invited. Proficient and Advanced students will be included based on TVAAS probability of success.
Fifty students maximum will be served.
When: These funds are for an activity or series of activities to occur at a designated time between January and
May of 2013.
Requirements: Each school will have to submit a site plan which should include, at a minimum, the following:
What activities will you expend the funds on this year?
Two AMSE Energy outreach programs: $440 ($110 each)
Two AMSE follow-up sessions facilitated by the GT Coach, the Math Coach, certified
teachers, and PTSO volunteers: $320 (Stipends are for Knox County employees.)
Hands-on materials ($24 per child) for follow-up sessions: $1200
Hands-on Science materials to be used in lessons for all students in Grades 3-5 (to be
facilitated by the Adrian Burnett Energy Academy students, coaches, and certified staff):
$1040
What is the target student population for each type of activity?
Energy Outreach: Up to 50 students as described above
Follow-up Sessions: Up to 50 students as described above
Hands-on Materials: Up to 50 students as described above
Interactive classroom lessons facilitated by academy members: All ABES students in
Grades 3-5 (approximately 350 students)
What are the intended outcomes for each activity?
Energy Outreach: Provide academy members with a foundation for learning to ultimately
increase TCAP achievement as well as leadership skills.
Follow-up Sessions: Reinforce activities presented by AMSE and prepare students for
leadership roles
Hands-on Materials: Appeal to a variety of learning styles to help students make real
world personal connections and to consider careers in science and math.
Interactive classroom lessons: Provide all students in Grades 3-5 with a similar
enrichment opportunity with the ultimate goal of increased achievement on the TCAP.
Peer-to-peer interactions with student leaders will increase curiosity, inquiry skills, and
motivation of learners.
How do the activities connect to your TSIP plan? See excerpt from the Adrian Burnett TSIP below.
Strategy: A Four-week after school academy will focus on building skills necessary for students in
Grades 3-5 to excel on the Science TCAP. This will be combined with two outreach programs
facilitated by AMSE, follow-up sessions by staff members and parent volunteers, and classroom
presentations led by academy members.

171
Implementation Plan: Teachers will work in PLCs to regularly assess data (students in programs
will be tracked on a data wall). Two high-quality Science programs focusing on Motion, Forces,
and Nature will be brought in to the school, and follow-up sessions will be held after each one.
Outreach sessions will reinforce the activities in the after school club. Staff members will partner
with PTSO volunteers to implement the program. The academy members will be trained to
facilitate classroom activities. Students will be selected based on test scores. Pre and post testing
will be conducted to evaluate students’ readiness for TCAPs.
Desired outcomes: Adrian Burnett Elementary School 3rd
-5th
Grade TCAP Science Scores will
increase 3%, with emphasis on students in the slightly Below Proficient, Proficient, and Advanced
subgroups. Interest for careers in STEM will increase.
Projected costs and funding sources: Knox County Schools will provide up to $3000 to fund this
initiative. Any other needed funding will come from the school and the parents.
Describe how this specific strategy will help you achieve your goals for the 2012-13 school year
and address areas of challenge from the past year: This initiative will help raise student achievement
in Science, and will inspire them to pursue the increased number of careers in this field that will be
available in the future.
How do the activities connect to the district’s strategic plan?
Goal 1: Objective I: High expectations and academic rigor are essential to ensuring
Excellence for All Children.
Goal 1: Objective II: Individual Student Learning will be used to develop the whole child
with varied academic support. Academic support will be accomplished through
differentiated instruction in order to establish multiple pathways and strategies to success.
How will you monitor the whether or not the outcomes were achieved?
Staff members will use TCAP and TVAAS predictive data to formulate Energy Academy
groups.
Academy staff will create common assessments, maintain performance based portfolios
(including interactive notebooks and response journals).
Staff and volunteers will provide quality academic feedback in order to monitor progress
and provide meaningful differentiated instruction after each session.
Emphasis will be based on inquiry learning using S.T.E.M. initiatives to reinforce
learning PS 2: (Forces and Motion in Nature).
Staff will assist Academy members with common assessments and implementation of
interactive lessons in third, fourth and fifth grade classrooms.
All Academy members will develop and implement common pre and post-assessments for
peer-to-peer instruction.
Presentation performances will determine success with expected outcomes. (Data response
below will be used to see if outcomes were achieved.)
What kind of data will you use to monitor the success of these activities?
Pre and post common assessments, Discovery Education Science Probes and D.E. Science
Benchmark assessments, Presentations, Interactive Notebooks, TCAP Practice and TCAP
tests, Constructed Response Assessments
Include a complete budget sheet. (see next page)
The plan should be returned to Nancy Maland by November 28, 2012. (We will spend December arranging the
budget payment.)

172
Adrian Burnett Energy Academy Budget
Item Cost Per Unit Total Cost
AMSE Energy Outreach Programs (4) $110 $440
Stipends for 2 Certified Staff for $25.00 for 4 two-hour sessions ($50.00 x 4 sessions x 2 hours each)
$100 $400
Hands-on Materials for Follow-up Sessions $24 per child $1,120
Hands-on Materials for Classroom Lessons TBA $1,040

173
11.2 Brickey McCloud Elementary
Purpose of Grant: The purpose of this grant is to provide the students of Brickey McCloud an enhanced learning opportunity in mathematics, science and engineering.
Target Audience: The target audiences for these activities are our advanced students in grades 3, 4 and 5. Student lists are attached. When: These activities will take place on Mondays (3rd grade students) and Fridays (4th/5th grade students) beginning February 1, 2013 and concluding approximately May 1, 2013 from 2:45 – 4:00 p.m. Additionally, students will be taking Saturday field trips that support the enhanced learning opportunity with parents providing the transportation. Rationale: The activities support our school improvement plan to increase our TVAAS gains for all quintiles. In all subjects, our top quintile has not made the gains that we would like to see over the past three years. The activities will consider Common Core standards, as well as grade-level specific curriculum target skills in science, math, and engineering. Activities will focus on enriching the advanced learner in these areas. Advanced students in 5th Grade did not make TVAAS math and science gains on the 2012 TCAP. As far as KCS Strategic Plan, these activities support the following objective: High Expectations and Academic Rigor o High Expectations for All Students o Student Advancement Based on Mastery o Relationships o Literacy and STEM o High Quality Career and Technical Education o Refine Curriculum Tools and Create Common Assessments Plan of Implementation:
Tammy Roberts, our Gifted/Talented coach, will take on the planning, organizing, and presentations of activities. Fourth grade teacher, Stacy Landers, will be a co-teacher and will implement her plans.
The 2012 TCAP scores will identify 4th and 5th grade students who are advanced and 3rd grade advanced students will be identified by the 2nd grade 2012 Stanford 10. (See attached lists.)
To monitor our students’ progress and success, we will use the KCS Science benchmark tests, Discovery Education benchmark tests, and teacher-made tests for formative assessment information.
Budget:
Tammy Roberts, Director - $1,500 (60 hours at a rate of $25.00 an hour) Certified Staff Member (TBD) - $1,000 (40 hours at a rate of $25.00 an hour) Materials - $500

174
11.3 Cedar Bluff Elementary
Enhanced Learning Opportunity Proposal
2012-2013 School Year
Activities: *Science Bowl Competition at Roane State Oak Ridge Campus and Club Practices sponsored by Catherine Jennings, 7th Grade Science Teacher. *Scholastic Math Competition at Pellissippi State Knoxville Campus and Club Practices sponsored by Shawna Wolbert, 6th Grade Math Teacher. Funding for these programs would cover transportation, practice books and/or materials, team tee-shirts for identification during competition, substitute teacher coverage during competition day if needed, and sponsor stipends. Target Student Population: Students who are advanced in science and/or math as evidenced by selection into honors classes or other evidence of outstanding aptitude and interest in the areas of Science, Technology, Engineering, and/or Math. Intended Outcomes and Connection to TSIP: *Increased student proficiency on advanced math and science skills. *Enhanced student interest in STEM. *Improved ability for students to handle increased instructional rigor and transition to Common Core Standards Connection to District Strategic Plan: Goal 1: Focus on the Student Objective I: High Expectations and Academic Rigor Objective II: Individual Student Learning The Science and Math Competitions support a STEM focus through Small Learning Communities developed within the club practice/competition groups. Working towards a goal of competing with other high achieving students will demonstrate high expectations and pave a pathway to increased academic rigor. These advanced students will be given the opportunity to develop individual learning plans based upon their interests in their chosen group. Assessment Data: Participating students will take pre- and post-tests to indicate growth/achievement. Successful completion of their chosen competition will also indicate student progress. Students’ grades in math and/or science classes will be monitored. Student surveys will indicate levels of interest in STEM activities before and after club practices and competition.

175
11.4 South Doyle Middle School Based Enhanced Learning Opportunities
2012-2013
What activities will you expend the funds on this year? o Science Olympiad: Providing a stipend to the coaches in blocks
similar to ELP (25 hours=I block=$500) o Total of 6 blocks available to total $3000
What is the target student population for each type of activity? o All students grades 6-8 are privy to Science Olympiad. We target
a diversity that reflects the school population What are the intended outcomes for each activity?
o Increased proficiency on the science portion of the TCAP assessment is the ultimate goal
o Increased proficiency on the Discovery Ed assessment in science and/or science common formative assessments will be used to track progress toward TCAP
How do the activities connect to your TSIP plan? o This plan will directly impact increased proficiency for all students o Science Olympiad increases exposure to Common Core-type
reading and math activities as well as enhancing science content How do the activities connect to the district’s strategic plan?
o Goal 1: Focus on the Student-High expectations for all students; Individual Student Learning
o Goal 4: Infrastructure-Enabling Student Learning-Provide an Instructional Settings Where All Student Are Encouraged to Learn
How will you monitor the whether or not the outcomes were achieved?
o Discovery Education data and common formative assessments will be used to monitor data until we receive TCAP scores.
o TCAP scores will be used to determine impact What kind of data will you use to monitor the success of these
activities? o Discovery Education data and common formative assessments
will be used to monitor data until we receive TCAP scores. o TCAP scores will be used to determine impact
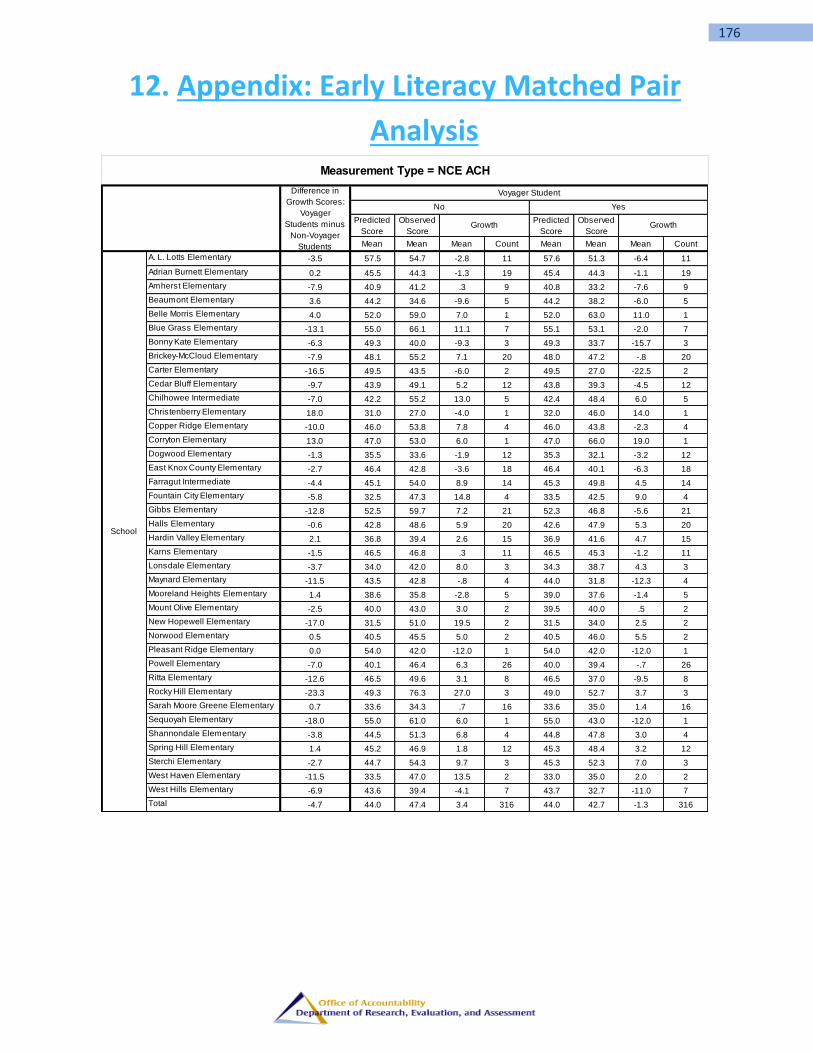
176
12. Appendix: Early Literacy Matched Pair
Analysis
Predicted
Score
Observed
Score
Predicted
Score
Observed
Score
Mean Mean Mean Count Mean Mean Mean Count
A. L. Lotts Elementary -3.5 57.5 54.7 -2.8 11 57.6 51.3 -6.4 11
Adrian Burnett Elementary 0.2 45.5 44.3 -1.3 19 45.4 44.3 -1.1 19
Amherst Elementary -7.9 40.9 41.2 .3 9 40.8 33.2 -7.6 9
Beaumont Elementary 3.6 44.2 34.6 -9.6 5 44.2 38.2 -6.0 5
Belle Morris Elementary 4.0 52.0 59.0 7.0 1 52.0 63.0 11.0 1
Blue Grass Elementary -13.1 55.0 66.1 11.1 7 55.1 53.1 -2.0 7
Bonny Kate Elementary -6.3 49.3 40.0 -9.3 3 49.3 33.7 -15.7 3
Brickey-McCloud Elementary -7.9 48.1 55.2 7.1 20 48.0 47.2 -.8 20
Carter Elementary -16.5 49.5 43.5 -6.0 2 49.5 27.0 -22.5 2
Cedar Bluff Elementary -9.7 43.9 49.1 5.2 12 43.8 39.3 -4.5 12
Chilhowee Intermediate -7.0 42.2 55.2 13.0 5 42.4 48.4 6.0 5
Christenberry Elementary 18.0 31.0 27.0 -4.0 1 32.0 46.0 14.0 1
Copper Ridge Elementary -10.0 46.0 53.8 7.8 4 46.0 43.8 -2.3 4
Corryton Elementary 13.0 47.0 53.0 6.0 1 47.0 66.0 19.0 1
Dogwood Elementary -1.3 35.5 33.6 -1.9 12 35.3 32.1 -3.2 12
East Knox County Elementary -2.7 46.4 42.8 -3.6 18 46.4 40.1 -6.3 18
Farragut Intermediate -4.4 45.1 54.0 8.9 14 45.3 49.8 4.5 14
Fountain City Elementary -5.8 32.5 47.3 14.8 4 33.5 42.5 9.0 4
Gibbs Elementary -12.8 52.5 59.7 7.2 21 52.3 46.8 -5.6 21
Halls Elementary -0.6 42.8 48.6 5.9 20 42.6 47.9 5.3 20
Hardin Valley Elementary 2.1 36.8 39.4 2.6 15 36.9 41.6 4.7 15
Karns Elementary -1.5 46.5 46.8 .3 11 46.5 45.3 -1.2 11
Lonsdale Elementary -3.7 34.0 42.0 8.0 3 34.3 38.7 4.3 3
Maynard Elementary -11.5 43.5 42.8 -.8 4 44.0 31.8 -12.3 4
Mooreland Heights Elementary 1.4 38.6 35.8 -2.8 5 39.0 37.6 -1.4 5
Mount Olive Elementary -2.5 40.0 43.0 3.0 2 39.5 40.0 .5 2
New Hopewell Elementary -17.0 31.5 51.0 19.5 2 31.5 34.0 2.5 2
Norwood Elementary 0.5 40.5 45.5 5.0 2 40.5 46.0 5.5 2
Pleasant Ridge Elementary 0.0 54.0 42.0 -12.0 1 54.0 42.0 -12.0 1
Powell Elementary -7.0 40.1 46.4 6.3 26 40.0 39.4 -.7 26
Ritta Elementary -12.6 46.5 49.6 3.1 8 46.5 37.0 -9.5 8
Rocky Hill Elementary -23.3 49.3 76.3 27.0 3 49.0 52.7 3.7 3
Sarah Moore Greene Elementary 0.7 33.6 34.3 .7 16 33.6 35.0 1.4 16
Sequoyah Elementary -18.0 55.0 61.0 6.0 1 55.0 43.0 -12.0 1
Shannondale Elementary -3.8 44.5 51.3 6.8 4 44.8 47.8 3.0 4
Spring Hill Elementary 1.4 45.2 46.9 1.8 12 45.3 48.4 3.2 12
Sterchi Elementary -2.7 44.7 54.3 9.7 3 45.3 52.3 7.0 3
West Haven Elementary -11.5 33.5 47.0 13.5 2 33.0 35.0 2.0 2
West Hills Elementary -6.9 43.6 39.4 -4.1 7 43.7 32.7 -11.0 7
Total -4.7 44.0 47.4 3.4 316 44.0 42.7 -1.3 316
Measurement Type = NCE ACH
School
Difference in
Growth Scores:
Voyager
Students minus
Non-Voyager
Students
Voyager Student
No Yes
Growth Growth
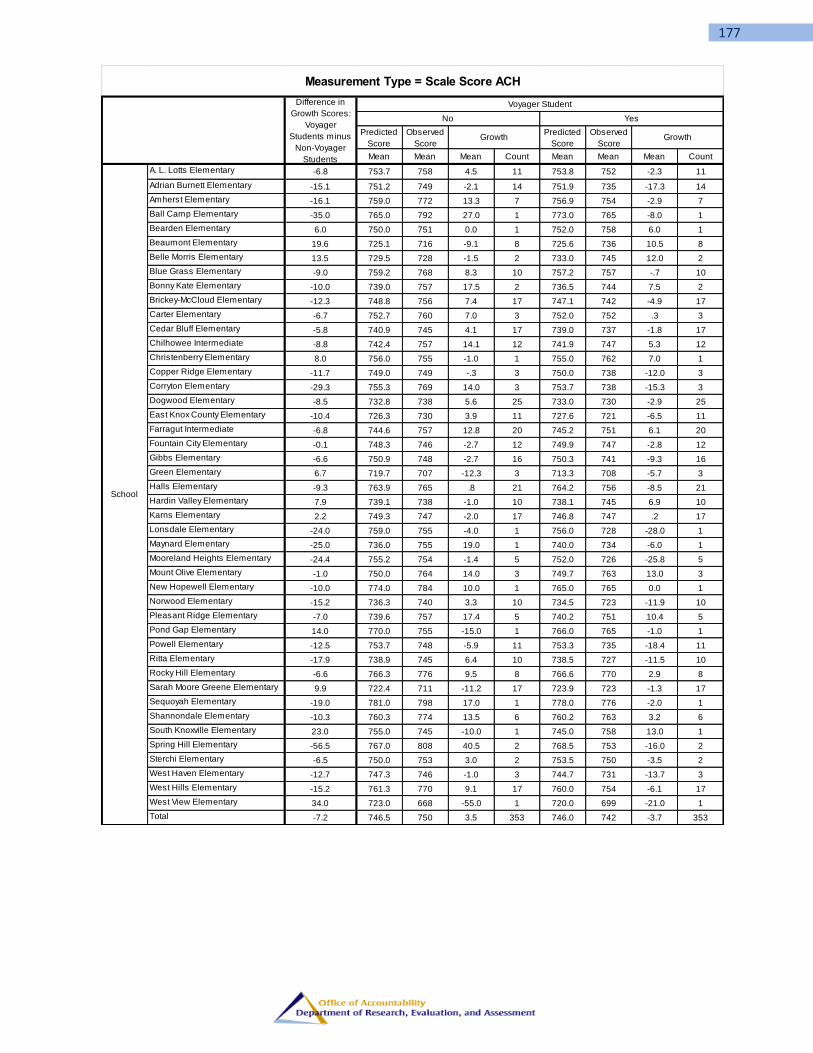
177
Predicted
Score
Observed
Score
Predicted
Score
Observed
Score
Mean Mean Mean Count Mean Mean Mean Count
A. L. Lotts Elementary -6.8 753.7 758 4.5 11 753.8 752 -2.3 11
Adrian Burnett Elementary -15.1 751.2 749 -2.1 14 751.9 735 -17.3 14
Amherst Elementary -16.1 759.0 772 13.3 7 756.9 754 -2.9 7
Ball Camp Elementary -35.0 765.0 792 27.0 1 773.0 765 -8.0 1
Bearden Elementary 6.0 750.0 751 0.0 1 752.0 758 6.0 1
Beaumont Elementary 19.6 725.1 716 -9.1 8 725.6 736 10.5 8
Belle Morris Elementary 13.5 729.5 728 -1.5 2 733.0 745 12.0 2
Blue Grass Elementary -9.0 759.2 768 8.3 10 757.2 757 -.7 10
Bonny Kate Elementary -10.0 739.0 757 17.5 2 736.5 744 7.5 2
Brickey-McCloud Elementary -12.3 748.8 756 7.4 17 747.1 742 -4.9 17
Carter Elementary -6.7 752.7 760 7.0 3 752.0 752 .3 3
Cedar Bluff Elementary -5.8 740.9 745 4.1 17 739.0 737 -1.8 17
Chilhowee Intermediate -8.8 742.4 757 14.1 12 741.9 747 5.3 12
Christenberry Elementary 8.0 756.0 755 -1.0 1 755.0 762 7.0 1
Copper Ridge Elementary -11.7 749.0 749 -.3 3 750.0 738 -12.0 3
Corryton Elementary -29.3 755.3 769 14.0 3 753.7 738 -15.3 3
Dogwood Elementary -8.5 732.8 738 5.6 25 733.0 730 -2.9 25
East Knox County Elementary -10.4 726.3 730 3.9 11 727.6 721 -6.5 11
Farragut Intermediate -6.8 744.6 757 12.8 20 745.2 751 6.1 20
Fountain City Elementary -0.1 748.3 746 -2.7 12 749.9 747 -2.8 12
Gibbs Elementary -6.6 750.9 748 -2.7 16 750.3 741 -9.3 16
Green Elementary 6.7 719.7 707 -12.3 3 713.3 708 -5.7 3
Halls Elementary -9.3 763.9 765 .8 21 764.2 756 -8.5 21
Hardin Valley Elementary 7.9 739.1 738 -1.0 10 738.1 745 6.9 10
Karns Elementary 2.2 749.3 747 -2.0 17 746.8 747 .2 17
Lonsdale Elementary -24.0 759.0 755 -4.0 1 756.0 728 -28.0 1
Maynard Elementary -25.0 736.0 755 19.0 1 740.0 734 -6.0 1
Mooreland Heights Elementary -24.4 755.2 754 -1.4 5 752.0 726 -25.8 5
Mount Olive Elementary -1.0 750.0 764 14.0 3 749.7 763 13.0 3
New Hopewell Elementary -10.0 774.0 784 10.0 1 765.0 765 0.0 1
Norwood Elementary -15.2 736.3 740 3.3 10 734.5 723 -11.9 10
Pleasant Ridge Elementary -7.0 739.6 757 17.4 5 740.2 751 10.4 5
Pond Gap Elementary 14.0 770.0 755 -15.0 1 766.0 765 -1.0 1
Powell Elementary -12.5 753.7 748 -5.9 11 753.3 735 -18.4 11
Ritta Elementary -17.9 738.9 745 6.4 10 738.5 727 -11.5 10
Rocky Hill Elementary -6.6 766.3 776 9.5 8 766.6 770 2.9 8
Sarah Moore Greene Elementary 9.9 722.4 711 -11.2 17 723.9 723 -1.3 17
Sequoyah Elementary -19.0 781.0 798 17.0 1 778.0 776 -2.0 1
Shannondale Elementary -10.3 760.3 774 13.5 6 760.2 763 3.2 6
South Knoxville Elementary 23.0 755.0 745 -10.0 1 745.0 758 13.0 1
Spring Hill Elementary -56.5 767.0 808 40.5 2 768.5 753 -16.0 2
Sterchi Elementary -6.5 750.0 753 3.0 2 753.5 750 -3.5 2
West Haven Elementary -12.7 747.3 746 -1.0 3 744.7 731 -13.7 3
West Hills Elementary -15.2 761.3 770 9.1 17 760.0 754 -6.1 17
West View Elementary 34.0 723.0 668 -55.0 1 720.0 699 -21.0 1
Total -7.2 746.5 750 3.5 353 746.0 742 -3.7 353
Measurement Type = Scale Score ACH
School
Difference in
Growth Scores:
Voyager
Students minus
Non-Voyager
Students
Voyager Student
No Yes
Growth Growth
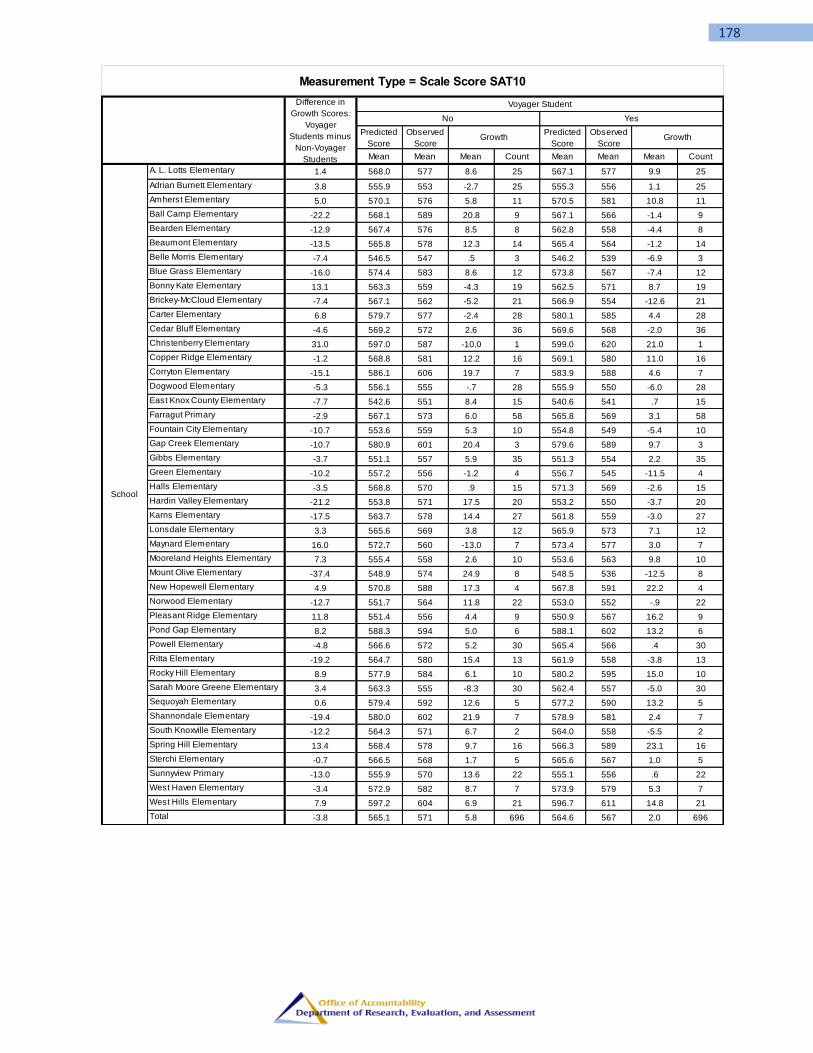
178
Predicted
Score
Observed
Score
Predicted
Score
Observed
Score
Mean Mean Mean Count Mean Mean Mean Count
A. L. Lotts Elementary 1.4 568.0 577 8.6 25 567.1 577 9.9 25
Adrian Burnett Elementary 3.8 555.9 553 -2.7 25 555.3 556 1.1 25
Amherst Elementary 5.0 570.1 576 5.8 11 570.5 581 10.8 11
Ball Camp Elementary -22.2 568.1 589 20.8 9 567.1 566 -1.4 9
Bearden Elementary -12.9 567.4 576 8.5 8 562.8 558 -4.4 8
Beaumont Elementary -13.5 565.8 578 12.3 14 565.4 564 -1.2 14
Belle Morris Elementary -7.4 546.5 547 .5 3 546.2 539 -6.9 3
Blue Grass Elementary -16.0 574.4 583 8.6 12 573.8 567 -7.4 12
Bonny Kate Elementary 13.1 563.3 559 -4.3 19 562.5 571 8.7 19
Brickey-McCloud Elementary -7.4 567.1 562 -5.2 21 566.9 554 -12.6 21
Carter Elementary 6.8 579.7 577 -2.4 28 580.1 585 4.4 28
Cedar Bluff Elementary -4.6 569.2 572 2.6 36 569.6 568 -2.0 36
Christenberry Elementary 31.0 597.0 587 -10.0 1 599.0 620 21.0 1
Copper Ridge Elementary -1.2 568.8 581 12.2 16 569.1 580 11.0 16
Corryton Elementary -15.1 586.1 606 19.7 7 583.9 588 4.6 7
Dogwood Elementary -5.3 556.1 555 -.7 28 555.9 550 -6.0 28
East Knox County Elementary -7.7 542.6 551 8.4 15 540.6 541 .7 15
Farragut Primary -2.9 567.1 573 6.0 58 565.8 569 3.1 58
Fountain City Elementary -10.7 553.6 559 5.3 10 554.8 549 -5.4 10
Gap Creek Elementary -10.7 580.9 601 20.4 3 579.6 589 9.7 3
Gibbs Elementary -3.7 551.1 557 5.9 35 551.3 554 2.2 35
Green Elementary -10.2 557.2 556 -1.2 4 556.7 545 -11.5 4
Halls Elementary -3.5 568.8 570 .9 15 571.3 569 -2.6 15
Hardin Valley Elementary -21.2 553.8 571 17.5 20 553.2 550 -3.7 20
Karns Elementary -17.5 563.7 578 14.4 27 561.8 559 -3.0 27
Lonsdale Elementary 3.3 565.6 569 3.8 12 565.9 573 7.1 12
Maynard Elementary 16.0 572.7 560 -13.0 7 573.4 577 3.0 7
Mooreland Heights Elementary 7.3 555.4 558 2.6 10 553.6 563 9.8 10
Mount Olive Elementary -37.4 548.9 574 24.9 8 548.5 536 -12.5 8
New Hopewell Elementary 4.9 570.8 588 17.3 4 567.8 591 22.2 4
Norwood Elementary -12.7 551.7 564 11.8 22 553.0 552 -.9 22
Pleasant Ridge Elementary 11.8 551.4 556 4.4 9 550.9 567 16.2 9
Pond Gap Elementary 8.2 588.3 594 5.0 6 588.1 602 13.2 6
Powell Elementary -4.8 566.6 572 5.2 30 565.4 566 .4 30
Ritta Elementary -19.2 564.7 580 15.4 13 561.9 558 -3.8 13
Rocky Hill Elementary 8.9 577.9 584 6.1 10 580.2 595 15.0 10
Sarah Moore Greene Elementary 3.4 563.3 555 -8.3 30 562.4 557 -5.0 30
Sequoyah Elementary 0.6 579.4 592 12.6 5 577.2 590 13.2 5
Shannondale Elementary -19.4 580.0 602 21.9 7 578.9 581 2.4 7
South Knoxville Elementary -12.2 564.3 571 6.7 2 564.0 558 -5.5 2
Spring Hill Elementary 13.4 568.4 578 9.7 16 566.3 589 23.1 16
Sterchi Elementary -0.7 566.5 568 1.7 5 565.6 567 1.0 5
Sunnyview Primary -13.0 555.9 570 13.6 22 555.1 556 .6 22
West Haven Elementary -3.4 572.9 582 8.7 7 573.9 579 5.3 7
West Hills Elementary 7.9 597.2 604 6.9 21 596.7 611 14.8 21
Total -3.8 565.1 571 5.8 696 564.6 567 2.0 696
School
Measurement Type = Scale Score SAT10
Difference in
Growth Scores:
Voyager
Students minus
Non-Voyager
Students
Voyager Student
No Yes
Growth Growth


