
2014 Interim Results
Aug. 28, 2014 Hong Kong ● Beijing

- 2 -
Forward-looking Statements
Certain statements contained in this presentation may be viewed as “forward-looking statements” within the meaning of Section 27A of U.S. Securities Act andSection 21E of U.S. Securities Exchange Act of 1934, as amended. Such forward-looking statements involve known and unknown risks, uncertainties and otherfactors, which may cause the actual performance, financial condition or results ofoperations of the Company to be materially different from any future performance,financial condition or results of operations implied by such forward-lookingstatements. Further information regarding these risks, uncertainties and otherfactors is included in the Company’s Annual Report on Form 20-F for the fiscal yearended December 31, 2013 filed with the U.S. Securities and Exchange Commission,or SEC, on April 25, 2014; and in the Company’s other filings with the SEC. TheCompany does not undertake any obligation to update any forward-lookingstatement, except as required under applicable law. All information provided in thispresentation is as of the date of this presentation, and the Company undertakes noduty to update such information, except as required under applicable law.
Unless otherwise indicated, the Chinese insurance market information set forth inthis presentation is based on public information released by CIRC.

Agenda
1H2014 OverviewSection I
- 3 -
Investment Performance Section IV
Business Review Section II
Embedded ValueSection V
Financial Summary Section III
Section I: 1H2014 OverviewSection I: 1H2014 Overview

Business Overview
- 5 -
Amidst complicated external situations and fierce competition, theCompany firmly adhered to the business strategy of “prioritizingvalue, stabilizing volume, optimizing structure, and expandingsources of profit”. In the first half of the year, we focused ongrowth of business value, actively adjusted business structure, andstrengthened cost control. As a result, business developmentsustained good momentum and overall results steadily improved.
Achieved steady growth in new business value, and the strategy of“prioritizing value” gained results
Proactively managed the tempo of business development, and recordedsteady growth
Increased the share of mid-to-long term regular premiums, and noticeablyoptimized premiums structure
Net investment income grew steadily, further improved overall results

Sustained economic growth with better quality will continue to improvethe external environment for the industry. The issuance of “SeveralOpinions of the State Council on Accelerating the Development of theModern Insurance Industry” will bring huge policy dividend for thereform and development of the industry in relation to taxation, pension,health insurance, annuity business and investment and other aspects.Pricing liberalization reform will promote product innovation and createnew development opportunities.However, China’s economy may experience downward pressure.Comprehensive operation of the financial industry is accelerating, cross-sector marketing and competition are changing the landscape of thetraditional financial industry. The pressure of competition from otherfinancial wealth management products still exists. Economic andfinancial transformation may experience uncertainties. Risk preventionstill has a long way to go. All these may bring challenges to thedevelopment of the sector.
Opportunities and Challenges for the Industry
- 6 -
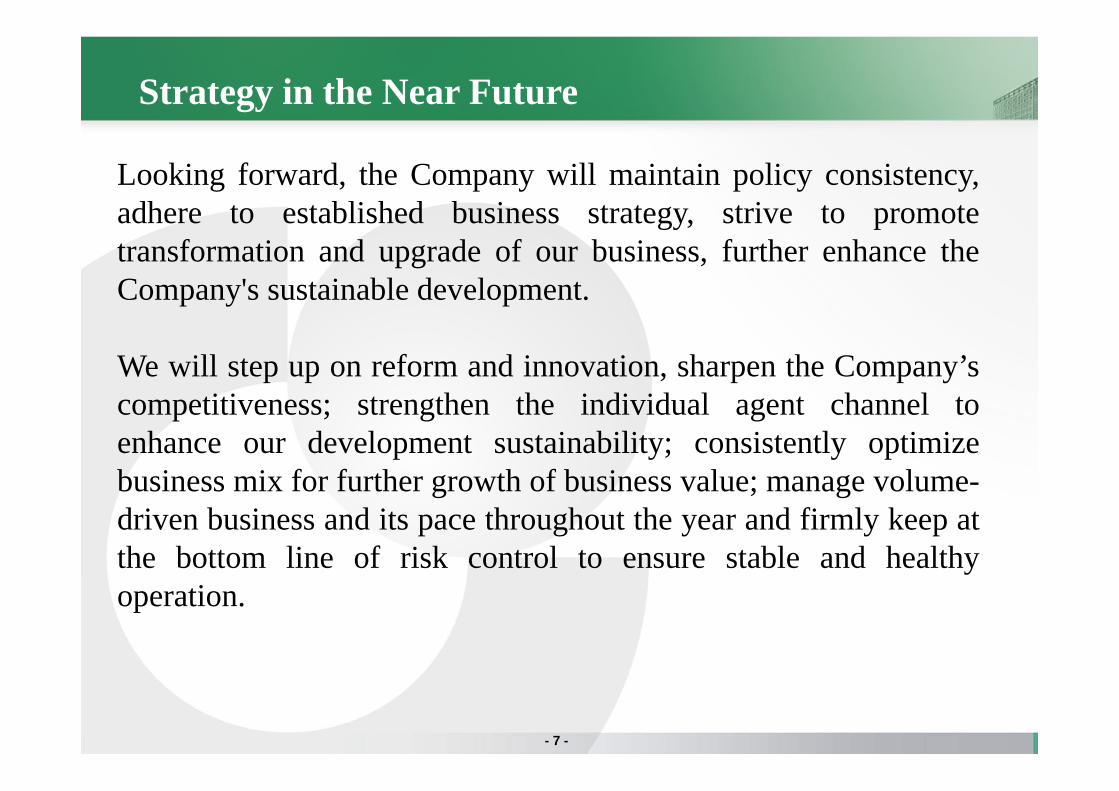
Strategy in the Near Future
- 7 -
Looking forward, the Company will maintain policy consistency,adhere to established business strategy, strive to promotetransformation and upgrade of our business, further enhance theCompany's sustainable development.
We will step up on reform and innovation, sharpen the Company’scompetitiveness; strengthen the individual agent channel toenhance our development sustainability; consistently optimizebusiness mix for further growth of business value; manage volume-driven business and its pace throughout the year and firmly keep atthe bottom line of risk control to ensure stable and healthyoperation.

Section II: Business ReviewSection II: Business Review

Life Insurance Sector in 1H2014
Development Features: Life sector grew rapidly in 1H2014 New premiums were the key driver
for growth Traditional life insurance sales
surged Market concentration decreased
624,250
767,130
1H2013 1H2014
RMB mn
- 9 -
Life insurance sector grew rapidly in 1H2014, with premium income slowing down after a vigorous growth in the first quarter. Product structure improved and the share of protection-oriented business grew significantly.
1H2014 Sector Gross Written Premiums

First-year Regular Premiums
24,197 27,668
1H2013 1H2014
112,301 105,922
1H2013 1H2014
79,912 76,653
1H2013 1H2014
Premium Income
Gross Written PremiumsRMB mn
Long-term First-year Premiums
Renewal Premiums
203,251 197,250
1H2013 1H2014
RMB mnRMB mn
RMB mn
- 10 -

Business Structure
Long-term FYP
First-year Regular Premiums
Long-term Premiums
Short-term Premiums
30% 36%
70% 64%
1H2013 1H2014First‐year Regular Premiums Single Premiums
29%15%
29%38%
42% 47%
1H2013 1H2014Less than 5 years 5‐9 years 10‐year‐or‐longer
58% 58%
42% 42%
1H2013 1H2014Renewal Premiums Long‐term FYP
61% 61%
39% 39%
1H2013 1H2014Short‐term Accident Short‐term Health
- 11 -
11,527
13,118
794
207
268
134
8,500
9,500
10,500
11,500
12,500
13,500
1H2013 1H2014
Individual Agent Bancassurance Group Insurance
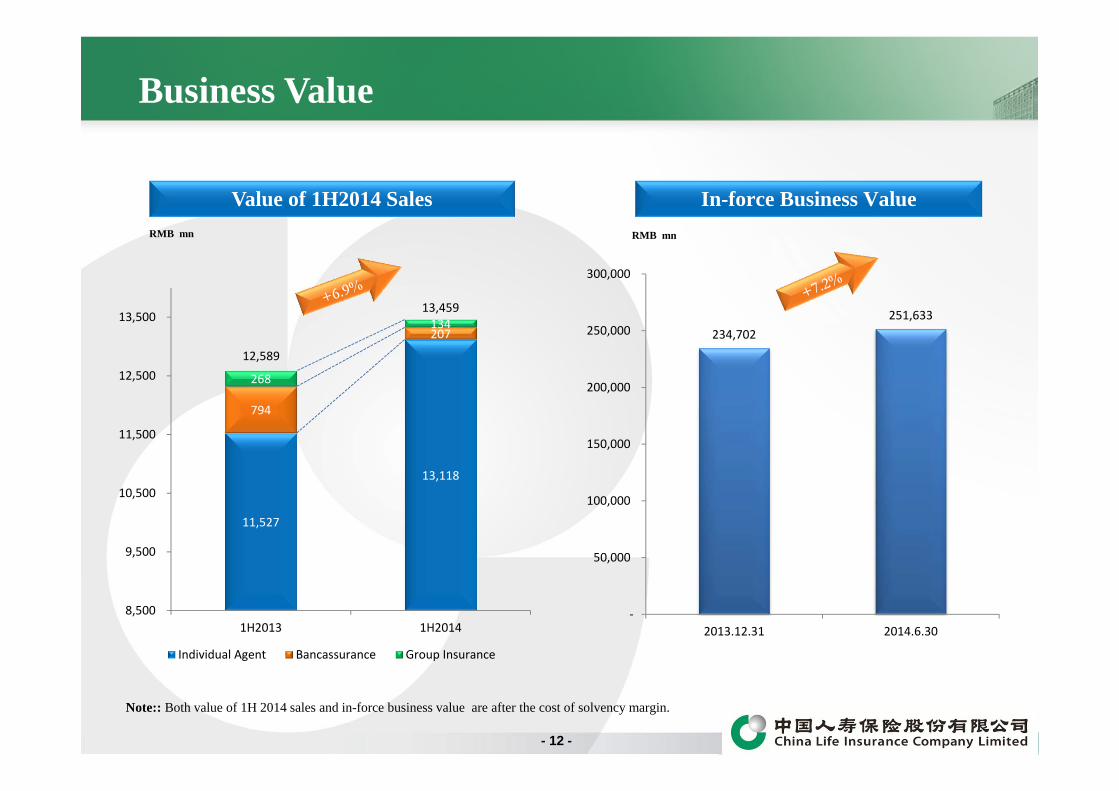
Business Value
Value of 1H2014 SalesRMB mn
In-force Business ValueRMB mn
12,589
13,459
234,702 251,633
‐
50,000
100,000
150,000
200,000
250,000
300,000
2013.12.31 2014.6.30
Note:: Both value of 1H 2014 sales and in-force business value are after the cost of solvency margin.
- 12 -

9.6%
10.4%
9.8%
10.7%
-5.1%
Individual, Group and Short-term Business (GWP)
- 13 -
1H2014
181,449
Change1H2013
1,126
10,782
4,183 3,810
6,599 5,960
191,186
1,027
9,770
RMB mn
3,893 1,268 207.0%
Individual Business
Group Business
Short-term Business
Short-term Health
Short-term Accident
Supplementary major medical insurance*
Note: Supplementary major medical insurance for urban and rural residents.

2.05%
3.34%
1H2013 1H2014
Surrender Rate and Persistency Rate
- 14 -
89.0% 88.5%
88.0% 87.5%
60%
65%
70%
75%
80%
85%
90%
95%
2013.12.31 2014.6.30
14 Months 26 Months
Surrender Rate Long-term Individual Policy Persistency Rate
Note:Surrender Rate = Surrender payment/(Liability of long-term insurance contracts at the beginning of the period + Premiums of long-term insurance contracts)
Policy persistency rate = in-force policies within the review month that are commenced 14/26 months prior to the review month / policies that are commenced 14/26 months prior to the review month
22,412 24,641
93,742 92,375
1H2013 1H2014
New Business Renewal Premiums
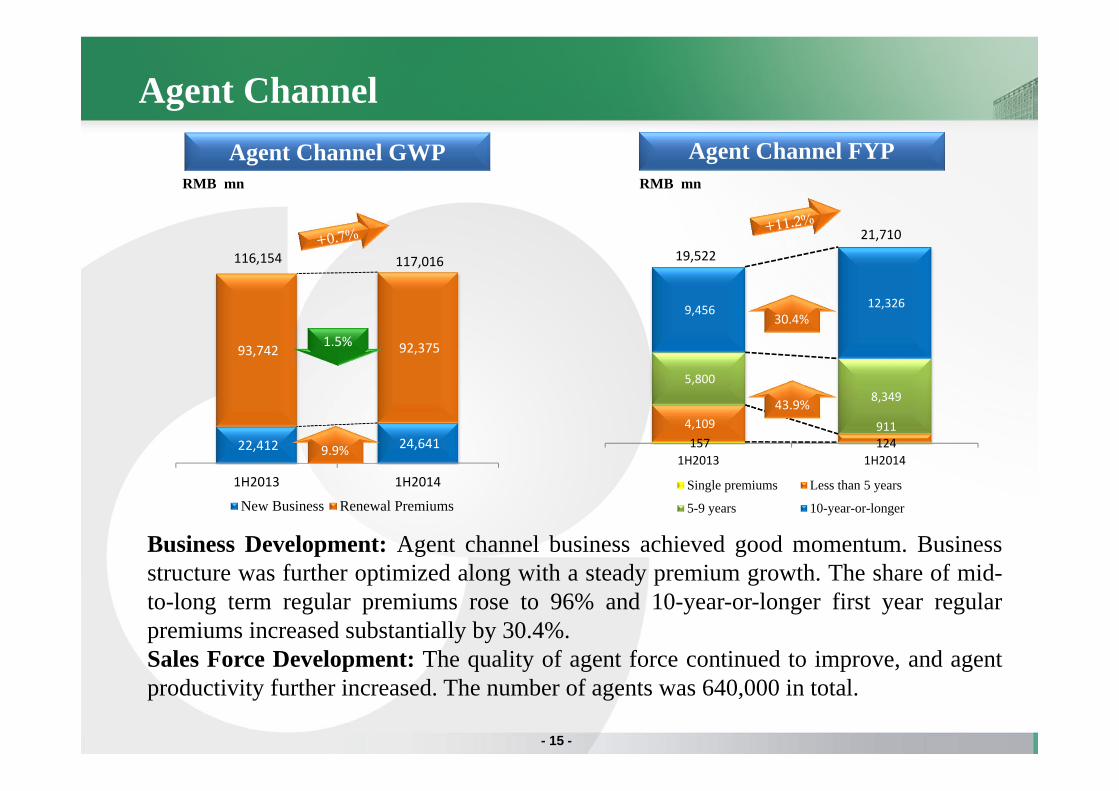
Agent Channel
Business Development: Agent channel business achieved good momentum. Businessstructure was further optimized along with a steady premium growth. The share of mid-to-long term regular premiums rose to 96% and 10-year-or-longer first year regularpremiums increased substantially by 30.4%.Sales Force Development: The quality of agent force continued to improve, and agentproductivity further increased. The number of agents was 640,000 in total.
- 15 -
Agent Channel GWPRMB mn
117,016116,154
Agent Channel FYP
1.5%
9.9% 157 124 4,109 911
5,800 8,349
9,456 12,326
1H2013 1H2014
Single premiums Less than 5 years
5-9 years 10-year-or-longer
RMB mn
30.4%
43.9%
21,71019,522

58,455 53,642
18,035 12,974
1H2013 1H2014
New Business Renewal Premiums
53,793 47,733
4,616 5,850
1H2013 1H2014
Single Premiums First‐year Regular Premiums
26.7%
Bancassurance Channel
Business Development: In accordance with the business strategy of “stabilizingvolume and optimizing structure”, bancassurance channel strived to promote regularpremiums while managing the pace of volume-oriented business. The shares of 1st-yearregular premiums and mid-to-long term regular premiums were both increased.Sales Force Development: Continued to develop the bancassurance account managerteam and the insurance planner team. Sales force grew to 53,000, among which 29,000insurance planners became major contributors to bancassurance regular premiums.
- 16 -
Bancassurance FYP
76,490
66,616
Bancassurance GWPRMB mnRMB mn
28.1%
11.3%‐8.2%
58,40953,583
6,831 7,783
2,158 1,464
1H2013 1H2014Short‐term Business Long‐term Business
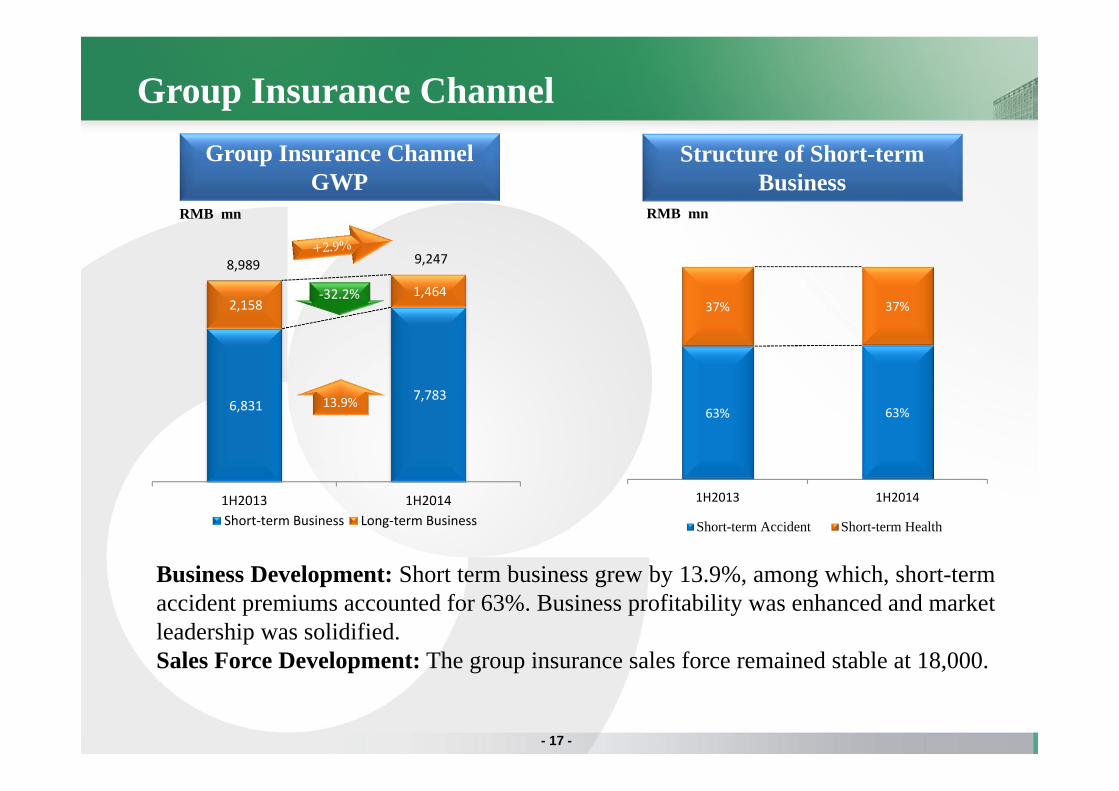
Group Insurance Channel
Business Development: Short term business grew by 13.9%, among which, short-termaccident premiums accounted for 63%. Business profitability was enhanced and marketleadership was solidified.Sales Force Development: The group insurance sales force remained stable at 18,000.
- 17 -
Group Insurance Channel GWP
Structure of Short-term Business
RMB mn RMB mn
8,989 9,247
13.9%
‐32.2%
63% 63%
37% 37%
1H2013 1H2014
Short-term Accident Short-term Health

Business Focuses in 2H2014
Adhere to the established business strategy and implement market-orientedand custom-centered business plans, focusing on five areas, i.e. regularpremiums, agent channel, sales force, urban market and value creation.Maintain steady business growth and achieve new breakthroughs in thetransformation and upgrade of the Company
Regular Premiums: Focus on the growth of regular premiums, especially the growth of5-year-or-longer payment regular premiums to enhance business sustainability
Agent Channel: Implement strategic management of the agent channel, maintainbusiness plan continuity and strategic input consistency, optimize the allocation ofresources and performance appraisals
Sales Force: Take the sales force as the key for business growth, innovate in sales forcedevelopment, and implement strategic input to ensure our leading position in sales force
Urban Markets: Focus on the urban markets, while strengthening our first moveradvantages in the rural market, both with a view to increasing our competitiveness
Business Value: Position business value as the core objective of the Company,vigorously develop value-driven business, strengthen cost control, and improve overallbusiness results
- 18 -

Section III: Financial Summary Section III: Financial Summary
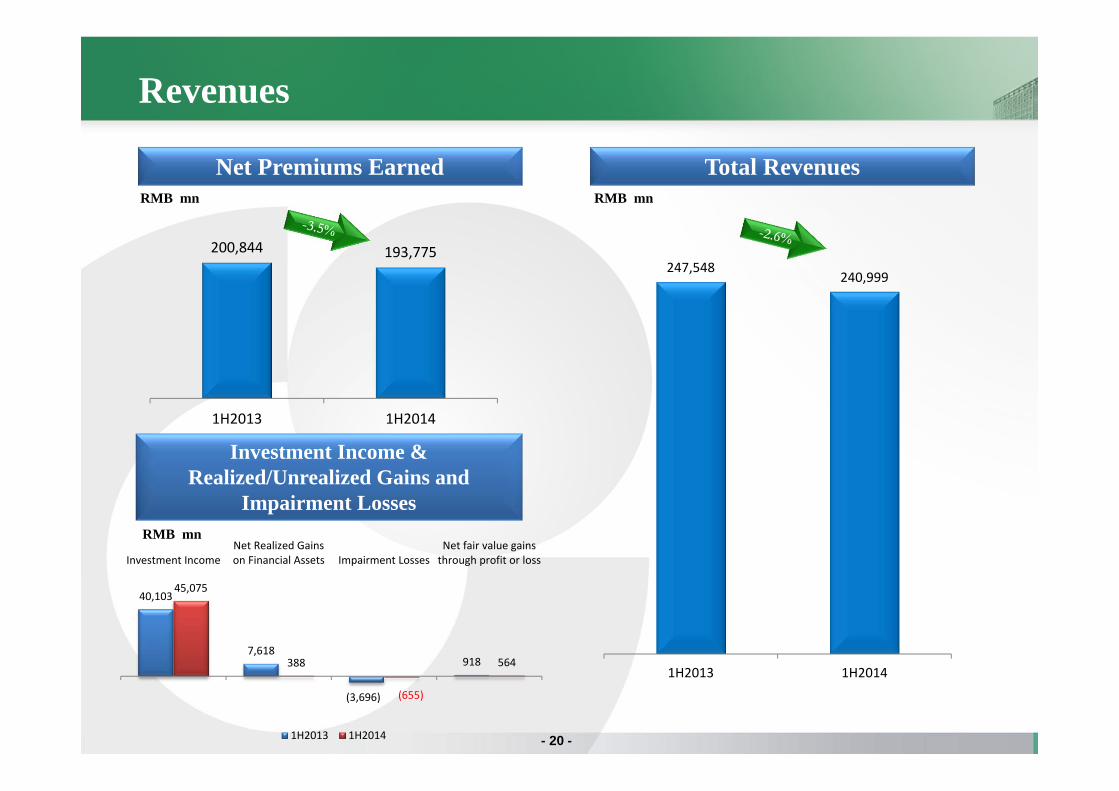
Revenues
Net Premiums Earned Total RevenuesRMB mn RMB mn
RMB mn
200,844 193,775
1H2013 1H2014
247,548 240,999
1H2013 1H2014
- 20 -
40,103
7,618
(3,696)
918
45,075
388
(655)
564
Investment IncomeNet Realized Gainson Financial Assets Impairment Losses
Net fair value gainsthrough profit or loss
1H2013 1H2014
Investment Income & Realized/Unrealized Gains and
Impairment Losses
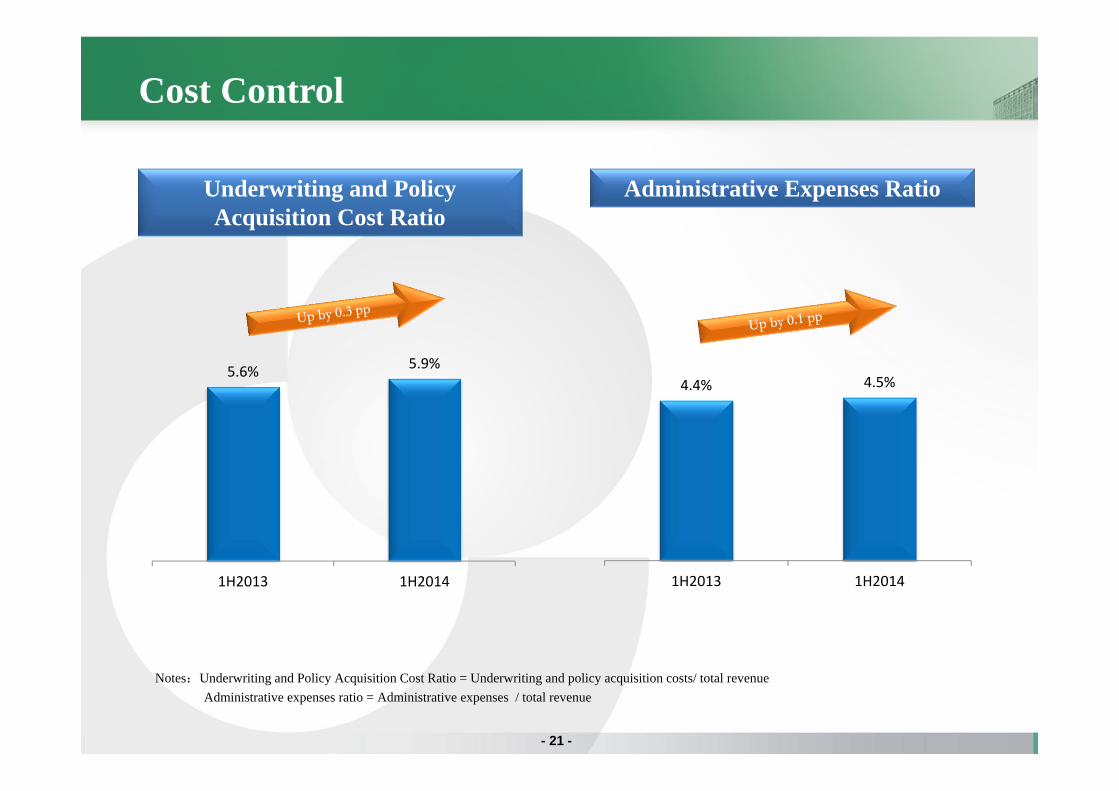
Cost Control
5.6% 5.9%
1H2013 1H2014
4.4% 4.5%
1H2013 1H2014
- 21 -
Underwriting and Policy Acquisition Cost Ratio
Administrative Expenses Ratio
Notes:Underwriting and Policy Acquisition Cost Ratio = Underwriting and policy acquisition costs/ total revenueAdministrative expenses ratio = Administrative expenses / total revenue

Profitability
RMB mn RMB yuan
0.57
0.65
1H2013 1H2014
16,198
18,407
1H2013 1H2014
7.11%7.89%
1H2013 1H2014
- 22 -
Net Profit Attributable to Equity Holders Weighted Average ROE EPS

Equity Holders’ Equity
RMB mn
- 23 -
220,331240,586
18,40710,327
0
50,000
100,000
150,000
200,000
250,000
300,000
2013.12.31 EquityAttributable to Equity
Holders of the Company
Net Profit Attributable toEquity Holders of the
Company
Other ComprehensiveIncome
Dividends 2014.06.30 EquityAttributable to Equity
Holders of the Company
(8,479)

Solvency Ratio
Solvency Ratio
Due to the combined effects of increase in comprehensive income, dividend payment for 2013 and increase in minimum capital requirement from business development, as at June 30, 2014,the Company’s solvency ratio stood at 240.99%.
- 24 -
226.22%240.99%
2013.12.31 2014.6.30

Section IV: Investment PerformanceSection IV: Investment Performance

Investment Assets & Portfolio
- 26 -
Fixed-maturity investments 90.12% 89.94%
Term deposits 34.77% 35.93%
Bonds 48.06% 47.25%
Insurance asset management products2 3.01% 2.98%
Other fixed-maturity investments3 4.28% 3.78%
Equity investments 7.56% 8.39%
Common stocks 2.98% 4.31%
Funds 2.28% 3.19%
Other equity investments4 2.30% 0.89%
Investment properties 0.07% 0.07%
Cash, cash equivalents and others5 2.25% 1.60%
Total 100.00% 100.00%
1,848,681 1,973,109
2013.12.31 2014.06.30
Investment Assets1
RMB mn
Note: 1.Investment assets include cash and cash equivalents, securities at fair value through profit or loss, available-for-sale securities, held-to-maturity securities, term deposits, securities purchased under agreements to resell, loans, statutory deposits-restricted, investment properties 2. Insurance asset management products under fixed-maturity investments include infrastructure and real estatedebt investment plan and project asset-backed plan.3. Other fixed-maturity investments include policy loans, trust schemes, statutory deposits-restricted, etc.4. Other equity investments include private equity funds, unlisted equities, equity investment plan, etc.5. Cash, cash equivalents and others include cash and cash equivalents and securities purchased under agreements to resell.
Asset Category 2014.06.30 2013.12.31

Investment Yields
- 27 -
4.42%4.75%
1H2013 1H2014
4.96% 4.78%
1H2013 1H2014
4.27%
6.19%
1H2013 1H2014
Gross Investment YieldNet Investment Yield Comprehensive
Investment Yield
Notes: Net investment yield = {[ (Investment income + Net income from investment properties-Business tax and extra charges forinvestment)/((Investment assets at the beginning of the period + Investment assets at the end of the period)/2) ]/181}×365Gross investment yield = {[(Investment income + Net realised gains/(losses) and impairment on financial assets + Net fair value gains/(losses)through profit or loss + Total income from investment properties - Business tax and extra charges for investment) / ((Investment assets at thebeginning of the period + Investment assets at the end of the period)/2)]/181} × 365Comprehensive investment yield = {[(Investment income + Net realized gains/(losses) and impairment on financial assets + Net fair valuegains/(losses) through profit or loss + Current net fair value changes of available-for-sale securities recognized in other comprehensive income +Total income from investment properties - Business tax and extra charges for investment) / ((Investment assets at the beginning of the period +Investment assets at the end of the period) /2) ]/181} × 365

Progress Made in Investment Management
Cumulative contract amount of PE fund investment reached RMB 17.5 bnCumulative contract amount of investments in domestic and overseas
commercial properties through equity and debt was about RMB 8 bnCumulative amount of infrastructure and property investment plans was
about RMB 62.6 bnCumulative amount invested in bank wealth management plans, trust
schemes and asset backed investment plans totaled RMB 37.5 bn
Optimized portfolio and steadily carried out alternative investments
Introduced market mechanisms and achieved breakthrough in entrusted investment
- 28 -
Selected the first batch of 15 domestic asset management institutions withinitial commissioned amount of RMB 20 bnIn the process of selecting overseas investment managers for global asset
allocation

Sector V: Embedded ValueSector V: Embedded Value

Embedded Value Breakdown by Components
2014.06.30RMB mn
138,734
390,367
290,105
(38,472)
0
50,000
100,000
150,000
200,000
250,000
300,000
350,000
400,000
450,000
500,000
Adjusted Net Worth In-force Business Value Cost of Solvency Margin Embedded Value
- 30 -

12,589 13,459
1H2013 1H2014
107,522 138,734
234,702
251,633
2013.12.31 2014.6.30
In‐force Business Value(After cost of solvency margin)
Adjusted Net Worth
Growth of Embedded Value and Value of New Business
Value of 1H 2014 SalesEmbedded ValueRMB mnRMB mn
390,367
342,224
- 31 -
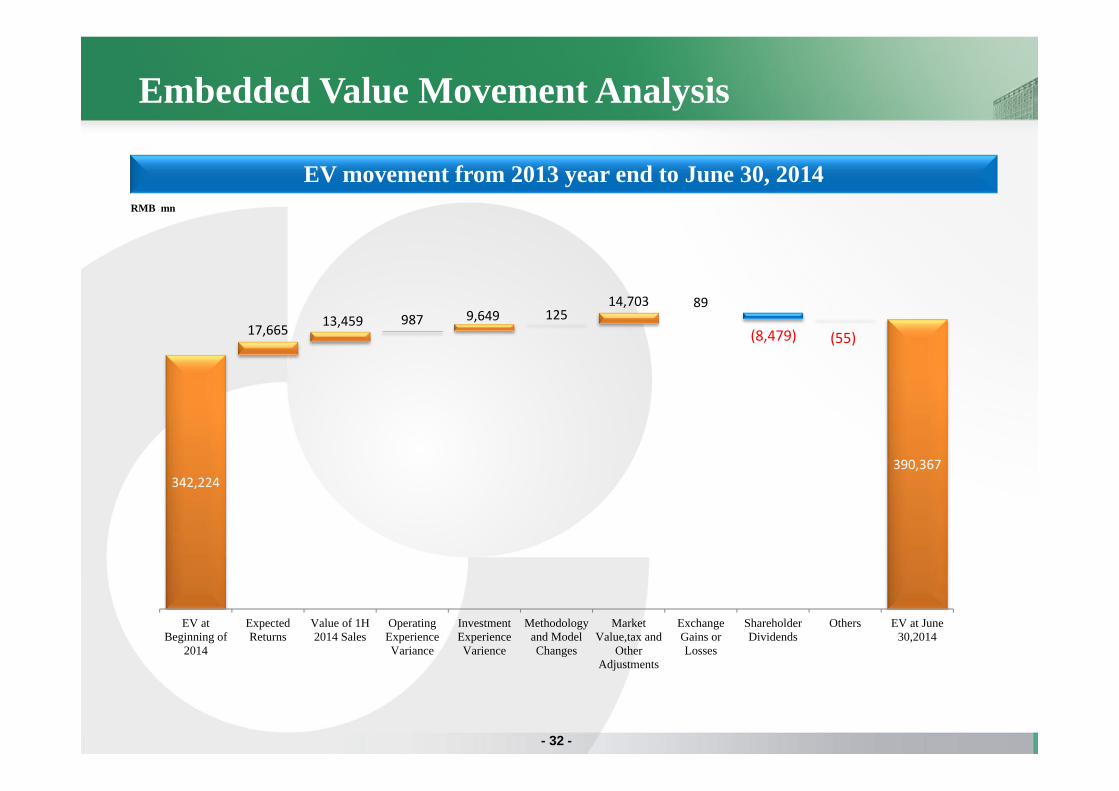
Embedded Value Movement Analysis
RMB mn
EV movement from 2013 year end to June 30, 2014
- 32 -
342,224 390,367
17,665 13,459 987 9,649 125 14,703 89
EV atBeginning of
2014
ExpectedReturns
Value of 1H2014 Sales
OperatingExperienceVariance
InvestmentExperienceVarience
Methodologyand ModelChanges
MarketValue,tax and
OtherAdjustments
ExchangeGains orLosses
ShareholderDividends
Others EV at June30,2014
(8,479) (55)

Q & A
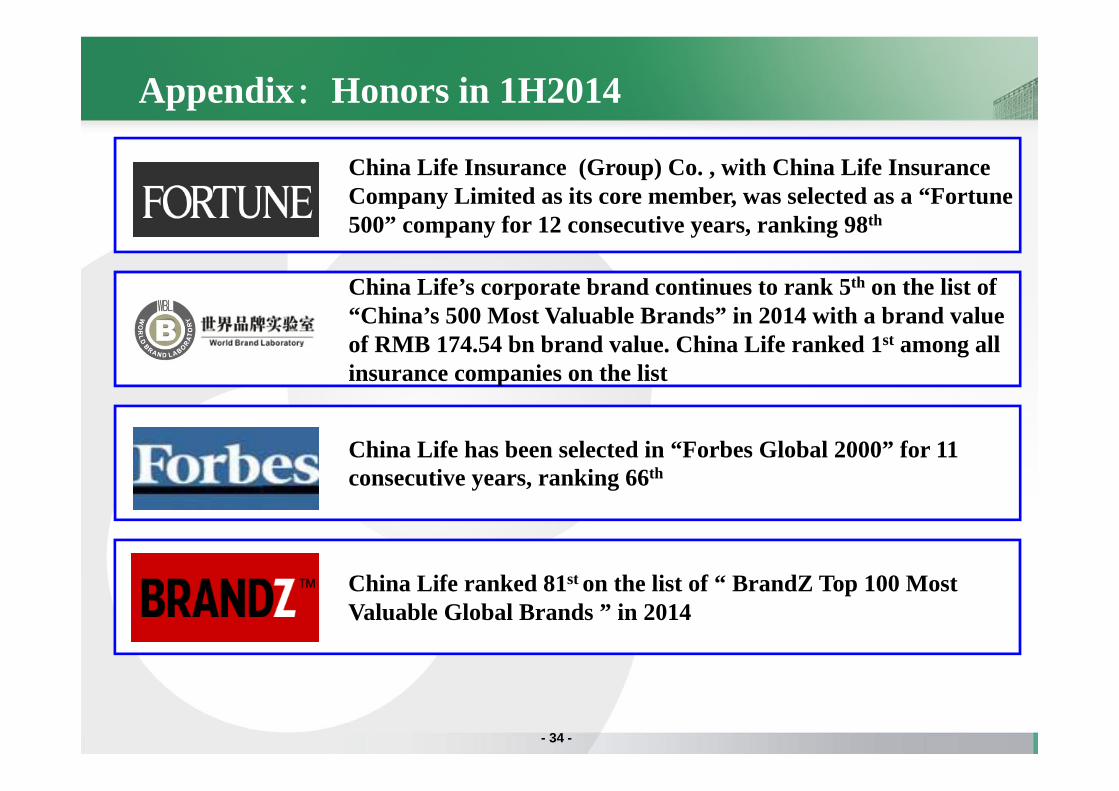
Appendix:Honors in 1H2014
China Life Insurance (Group) Co. , with China Life Insurance Company Limited as its core member, was selected as a “Fortune 500” company for 12 consecutive years, ranking 98th
China Life’s corporate brand continues to rank 5th on the list of “China’s 500 Most Valuable Brands” in 2014 with a brand value of RMB 174.54 bn brand value. China Life ranked 1st among all insurance companies on the list
China Life has been selected in “Forbes Global 2000” for 11 consecutive years, ranking 66th
China Life ranked 81st on the list of “ BrandZ Top 100 Most Valuable Global Brands ” in 2014
- 34 -
Fulfilling Corporate Social Responsibilities
Donated RMB 10.05 million through the China Life Foundation to provide funding for thepoverty alleviation projects in Yunxi County in Hubei Province as well as Tiandeng Countyand Longzhou County in Guangxi Province
Continued to provide support for orphans from the Wenchuan earthquake, the Yushuearthquake and the Zhouqu mudslide. Allocated sponsorship in an aggregate of approximatelyRMB 4.05 million to the civil affairs departments of the relevant districts, to provide orphansfrom these disaster-stricken areas with financial help and emotional support that is sustainedover the long term
Donated RMB 16 million to relevant foundations to subsidize families bereft of their onlychild, and to provide funding for the building of kidney dialysis clinics in grass-root hospitalsin rural areas of Liaoning Province, and to offer women in poverty-stricken areas with the“screening of two types of cancers” and the protection of serious diseases
- 35 -
The Company actively undertook its corporate social responsibilities, anddonated RMB 30 million to the China Life Foundation during thereporting period.
Note: unless otherwise stated, the initiatives were operated through the China Life Foundation,.

Sensitivity Analysis – Investment Return and Discount Rate
RMB mn RMB mn
- 36 -
251,633
( 39,775)
( 11,870)
12,742
40,102
InvestmentYield ‐10%
Risk AdjustedDiscount
rate=11.5%
Base Case Risk AdjustedDiscount
rate=10.5%
InvestmentYield +10%
13,459
( 1,871) ( 735)
790 1,894
InvestmentYield ‐10%
Risk AdjustedDiscount
rate=11.5%
Base Case Risk AdjustedDiscount
rate=10.5%
InvestmentYield +10%
Value of 1H 2014 Sales after the Cost of Solvency Margin
Value of In-force Business after the Cost of Solvency Margin
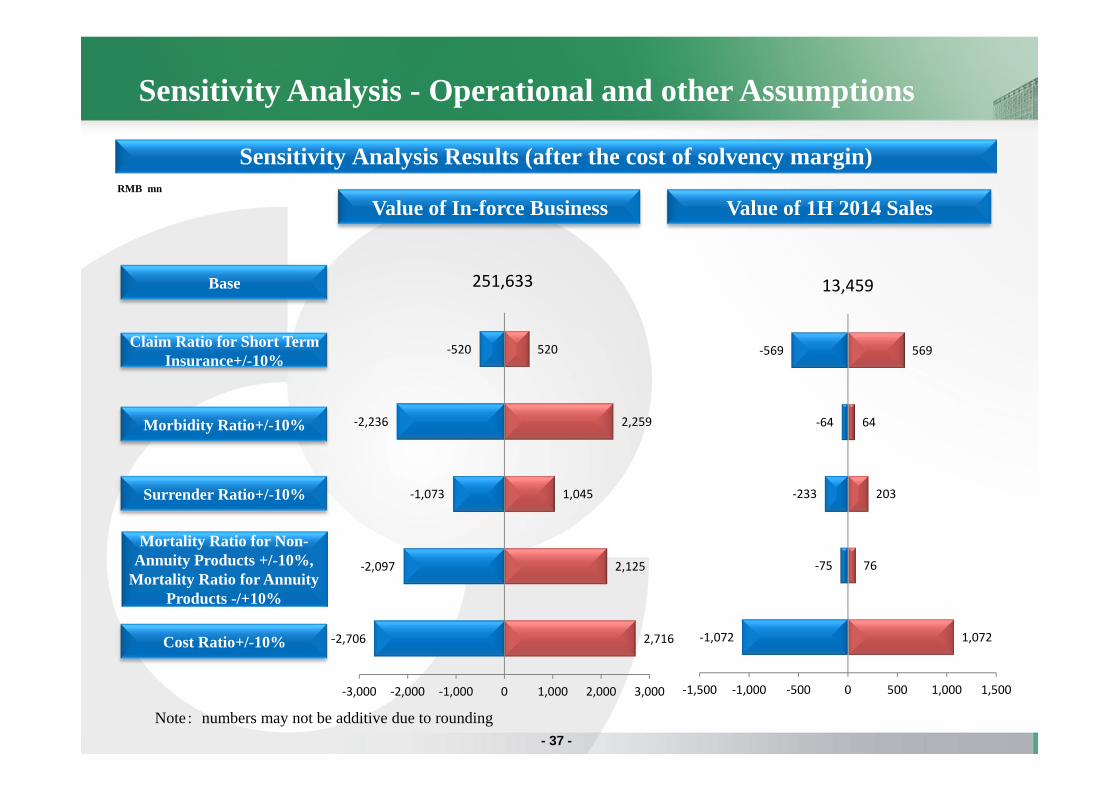
Sensitivity Analysis - Operational and other Assumptions
Sensitivity Analysis Results (after the cost of solvency margin)RMB mn
- 37 -
Base
Value of In-force Business Value of 1H 2014 Sales
‐1,072
‐75
‐233
‐64
‐569
1,072
76
203
64
569
‐1,500 ‐1,000 ‐500 0 500 1,000 1,500
‐2,706
‐2,097
‐1,073
‐2,236
‐520
2,716
2,125
1,045
2,259
520
‐3,000 ‐2,000 ‐1,000 0 1,000 2,000 3,000
251,633 13,459
Claim Ratio for Short Term Insurance+/-10%
Morbidity Ratio+/-10%
Surrender Ratio+/-10%
Mortality Ratio for Non-Annuity Products +/-10%,
Mortality Ratio for Annuity Products -/+10%
Cost Ratio+/-10%
Note:numbers may not be additive due to rounding

Sensitivity Analysis Results – other assumptions
Sensitivity Analysis ResultsRMB mn
Value of In-force Business after the Cost
of Solvency Margin
Value of 1H 2014 Sales after the Cost of Solvency Margin
Base 251,633 13,459
Solvency Margin at 150% of Statutory Minimum 232,815 12,483
Taxable income based on the accounting profit in accordance with “the Provisions on the Accounting Treatment Related to Insurance Contracts” under one scenario
255,016 12,957
- 38 -


