
Latin American regional integration: State of play and main challenges
Osvaldo RosalesChief, Division of International Trade and Integration
ECLAC
2nd Europe – Latin America Economic ForumECLAC, OCDE, Ecole d’Economie de Paris.
Paris, 20 May 2014

Outline
The region’s external economic environment The evolving architecture and dynamics of
regional (economic) integration in LAC Why is regional integration important for LAC? Stocktaking and suggestions for the way
forward
2

A very favorable international cycle is ending for LAC
• GDP growth decelerated since 2012, reaching 2.5% in 2013 ( 2.7% en 2014?)
– Compared to an average 4.8% in 2003-07 and 4.1% in 2010-13
• Exports slowed sharply in 2012 and stagnated in 2013• Increasing external vulnerability, reflected in a
deterioration of the region’s current account position• Lower commodity prices worsen LAC terms of trade• Withdrawal of monetary stimulus in the US reduces
available liquidity• In the coming years, greater emphasis will have to be
placed on the regional market as a source of growth

Regional exports slowed sharply in 2012 and 2013
LATIN AMERICA: ANNUAL GROWTH OF THE VALUE OF EXPORTS, 2000-2013(Percentages)
Source: Economic Commission for Latin America and the Caribbean (ECLAC), on the basis of official figures .

LATIN AMERICA: ESTIMATED RATE OF VARIATION IN THE TERMS OF TRADE, 2011-2013a
Source: Economic Commission for Latin America and the Caribbean (ECLAC) on the basis of official figuresa The figures relating to 2013 are projections.
The region’s terms of trade are declining
(Percentages)
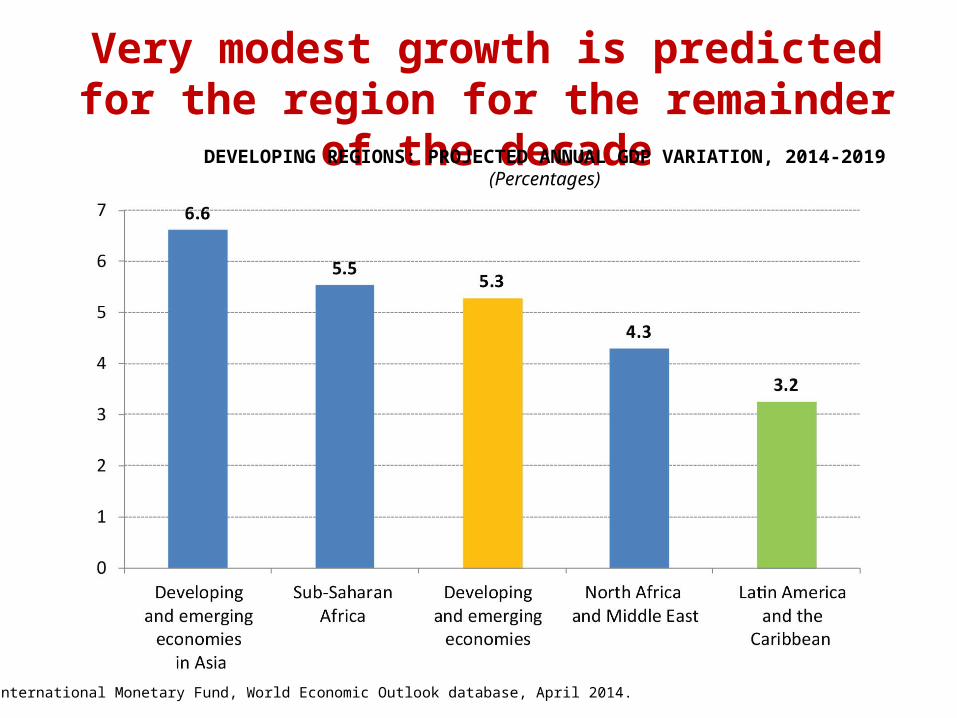
Very modest growth is predicted for the region for the remainder of the decade
DEVELOPING REGIONS: PROJECTED ANNUAL GDP VARIATION, 2014-2019(Percentages)
Source: International Monetary Fund, World Economic Outlook database, April 2014.

Main trends in the global context
Rapid technological change
• Information technology, cloud computing, cyber-servicies, “smart cities”
• 3-D printing, robotics, remote-controlled vehicles
• Biology, nanosciences and information sciences interface
• Energy, water and natural resources complex
Emergence of the developing countries
• In growth, trade, FDI, rise of the middle class, patents, new technologies
• This process is highly concentrated in China/Asia
• LAC lags behind
Value chains
• Three major factories:• North
America• Europe• East Asia
Mega-regional trade agreements
• TPP• TTIP• EU-Japan• ASEAN+6
(Regional Comprehensive Economic Partnership)
Need to address climate change and ensure that growth is environmentally sustainableNeed to address the drastic increase in inequality worldwide

LAC’s main strengths and weaknesses in the global economy
•Attractive and growing consumer market; expansion of the middle class
•Abundance of renewable and non-renewable natural resources
Strengths
•Limited involvement in the knowledge economy, low and heterogeneous productivity
•Strong concentration of exports: (i) in raw materials and assembly manufactures; and (ii) in a small number of large companies
Weaknesses

The architecture of LAC economic integration in the early 2000s was (relatively) simple…
9
Andean Community
(1969)
Mexico
MERCOSUR (1991)
Central American Common Market
(1960)
CARICOM (1973)Panama
Chile
NAFTA (1994)
Cuba
Dominican Republic
ALADI (1980)
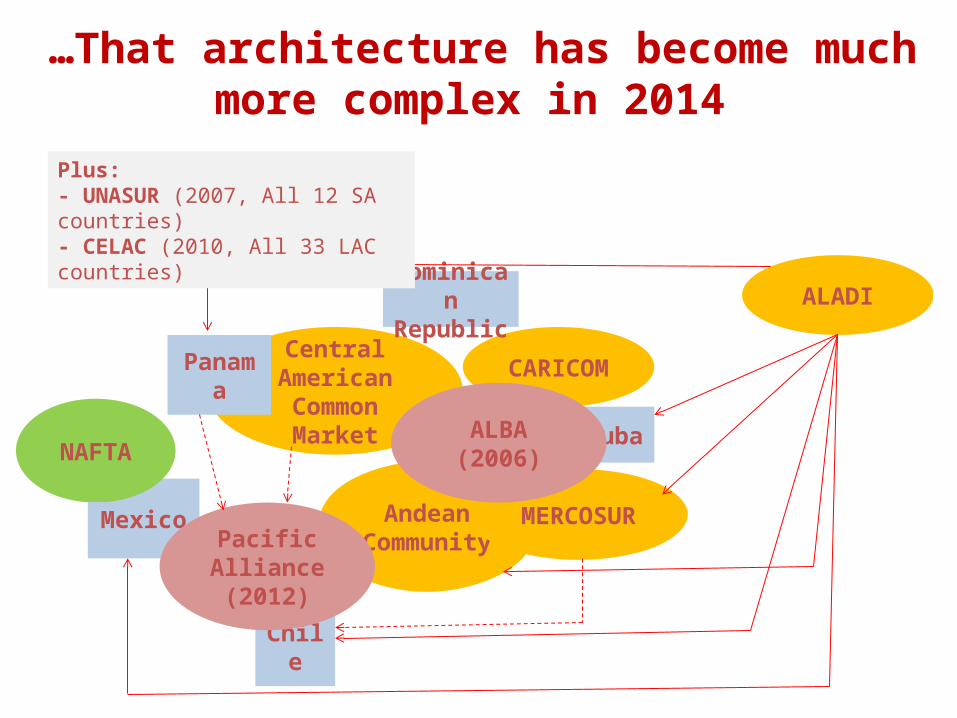
…That architecture has become much more complex in 2014
Andean Community
Mexico MERCOSUR
Central American Common Market
CARICOMPanama
Chile
NAFTACuba
Dominican Republic
ALADI
Pacific Alliance (2012)
ALBA (2006)
Plus:- UNASUR (2007, All 12 SA countries)- CELAC (2010, All 33 LAC countries)
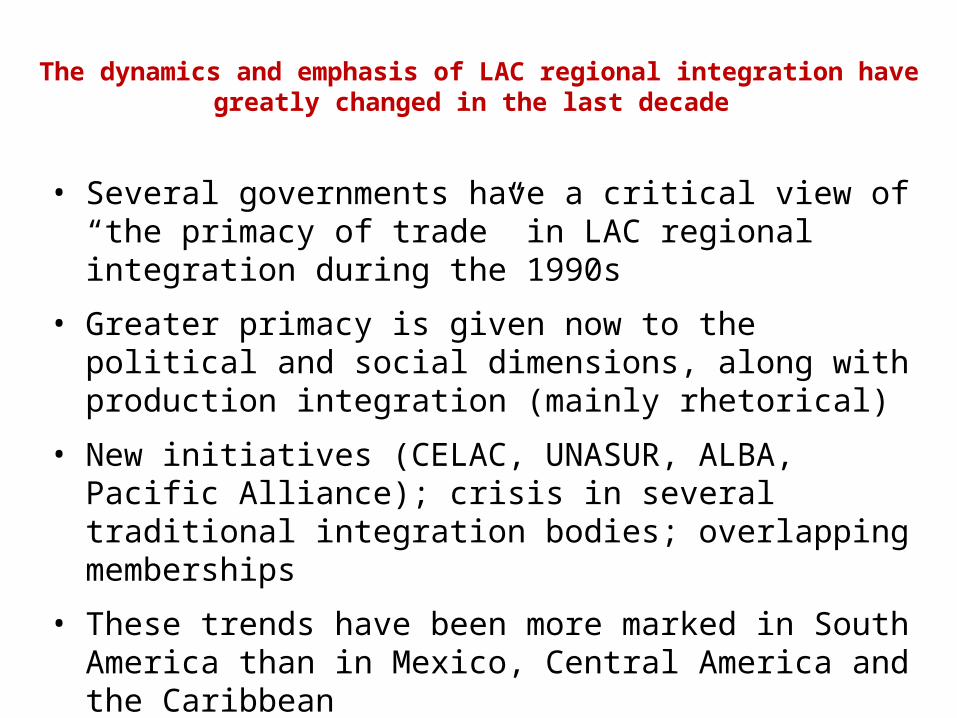
The dynamics and emphasis of LAC regional integration have greatly changed in the last decade
• Several governments have a critical view of “the primacy of trade” in LAC regional integration during the 1990s
• Greater primacy is given now to the political and social dimensions, along with production integration (mainly rhetorical)
• New initiatives (CELAC, UNASUR, ALBA, Pacific Alliance); crisis in several traditional integration bodies; overlapping memberships
• These trends have been more marked in South America than in Mexico, Central America and the Caribbean
• Traditional shortcomings (ex. low intra-regional trade and production integration) coexist with increasing “de facto” integration (migration, tourism, FDI, etc.)
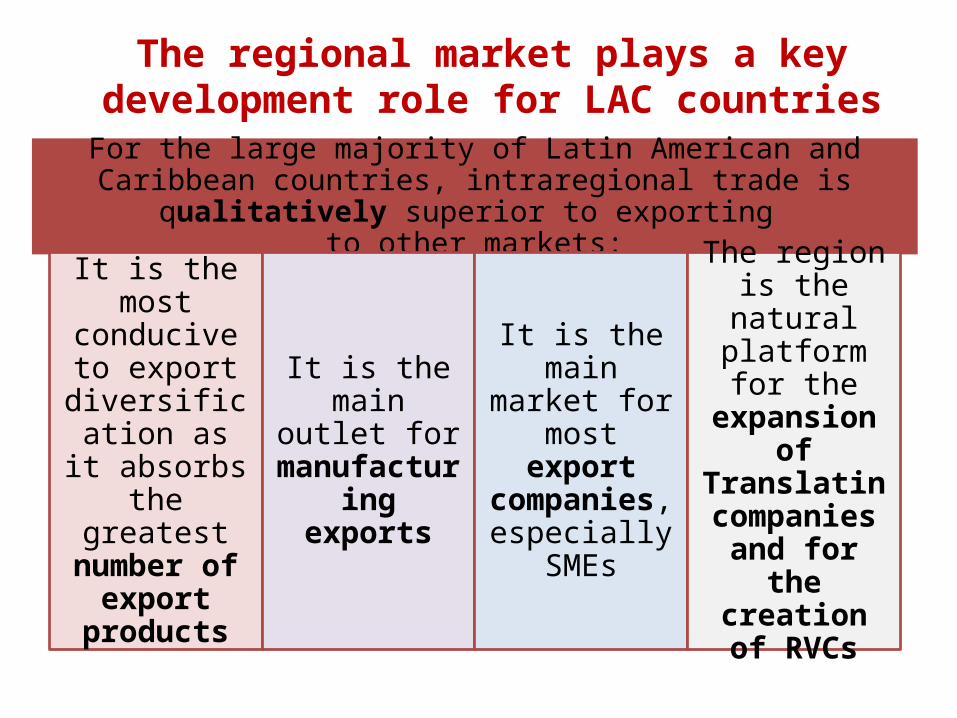
The regional market plays a key development role for LAC countries
For the large majority of Latin American and Caribbean countries, intraregional trade is qualitatively superior to exporting
to other markets:
It is the most conducive to
export diversification as it absorbs the greatest number of
export products
It is the main outlet for
manufacturing exports
It is the main market for
most export companies, especially
SMEs
The region is the natural platform for
the expansion of Translatin
companies and for the
creation of RVCs

The regional market is the most conducive to export diversification
NUMBER OF PRODUCTS EXPORTED BY LATIN AMERICAN COUNTRIES TO SELECTED MARKETS, 2012
Source: ECLAC, on the basis of COMTRADE.
Latin America and the
Caribbean
United States European Union China Japan
Argentina 3 591 1 465 1 712 407 388
Brazil 3 929 2 762 2 991 1 389 1 247
Chile 3 014 1 275 1 296 362 313
Colombia 3 239 1 708 1 250 253 201
Costa Rica 2 821 1 792 1 095 260 188
El Salvador 2 522 1 004 396 45 35
Guatemala 3 274 1 321 721 142 155
Jamaica 607 888 467 73 44
Mexico 3 857 4 164 2 803 1 367 1 272
Peru 3 037 1 796 1 602 266 575
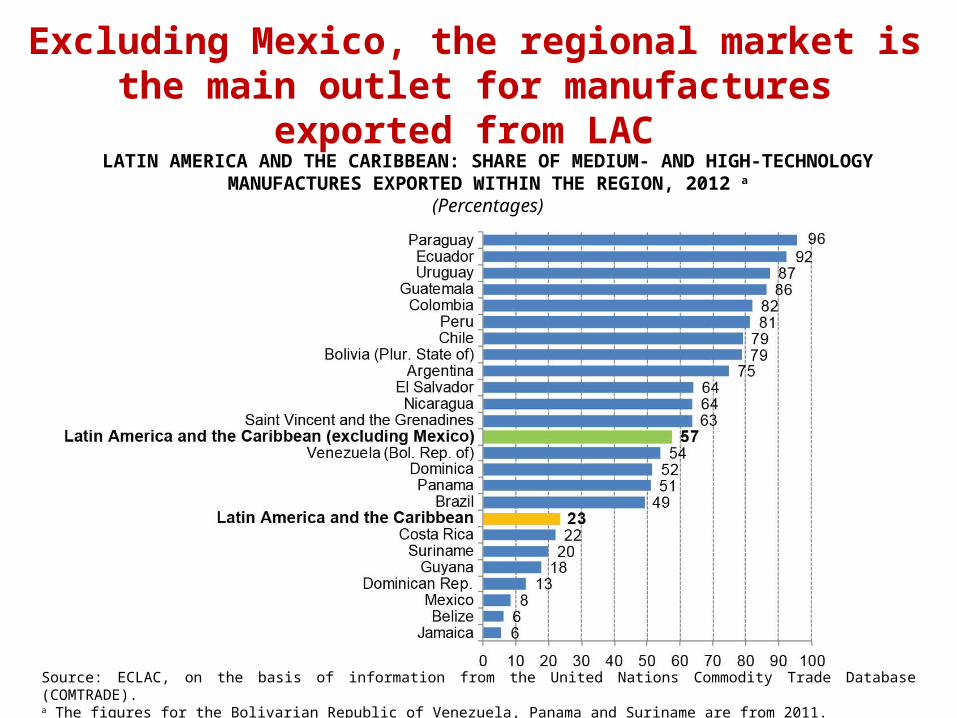
Excluding Mexico, the regional market is the main outlet for manufactures exported from LAC
LATIN AMERICA AND THE CARIBBEAN: SHARE OF MEDIUM- AND HIGH-TECHNOLOGY MANUFACTURES EXPORTED WITHIN THE REGION, 2012 a
(Percentages)
Source: ECLAC, on the basis of information from the United Nations Commodity Trade Database (COMTRADE).a The figures for the Bolivarian Republic of Venezuela, Panama and Suriname are from 2011.
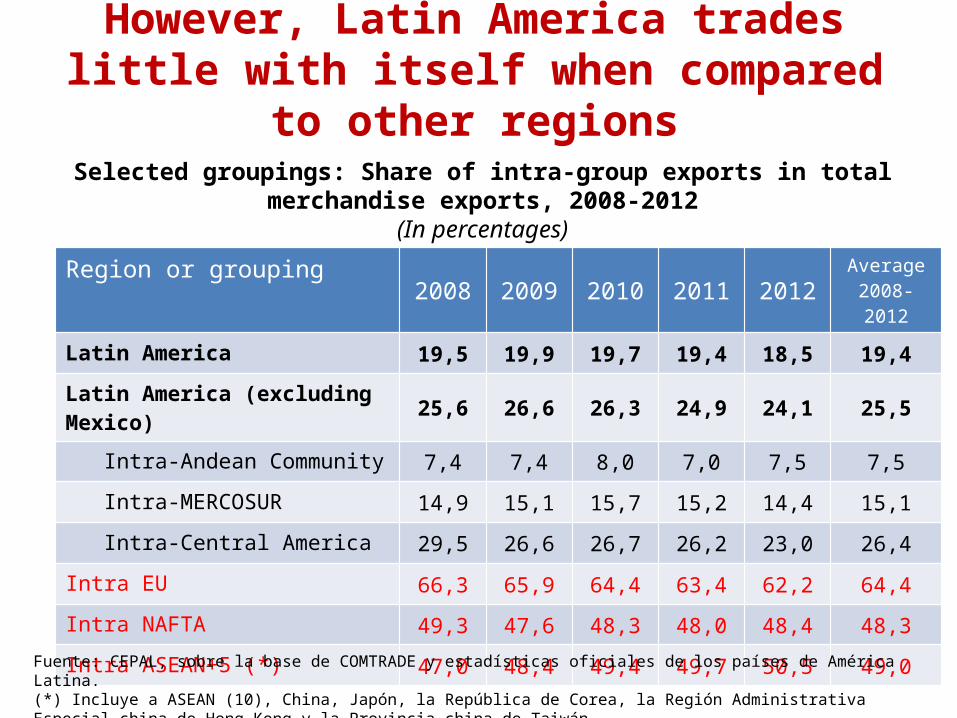
However, Latin America trades little with itself when compared to other regions
Region or grouping 2008 2009 2010 2011 2012 Average 2008-2012
Latin America 19,5 19,9 19,7 19,4 18,5 19,4
Latin America (excluding Mexico) 25,6 26,6 26,3 24,9 24,1 25,5
Intra-Andean Community 7,4 7,4 8,0 7,0 7,5 7,5
Intra-MERCOSUR 14,9 15,1 15,7 15,2 14,4 15,1
Intra-Central America 29,5 26,6 26,7 26,2 23,0 26,4
Intra EU 66,3 65,9 64,4 63,4 62,2 64,4
Intra NAFTA 49,3 47,6 48,3 48,0 48,4 48,3
Intra ASEAN+5 (*) 47,0 48,4 49,4 49,7 50,5 49,0
Selected groupings: Share of intra-group exports in total merchandise exports, 2008-2012(In percentages)
Fuente: CEPAL, sobre la base de COMTRADE y estadísticas oficiales de los países de América Latina.(*) Incluye a ASEAN (10), China, Japón, la República de Corea, la Región Administrativa Especial china de Hong Kong y la Provincia china de Taiwán.
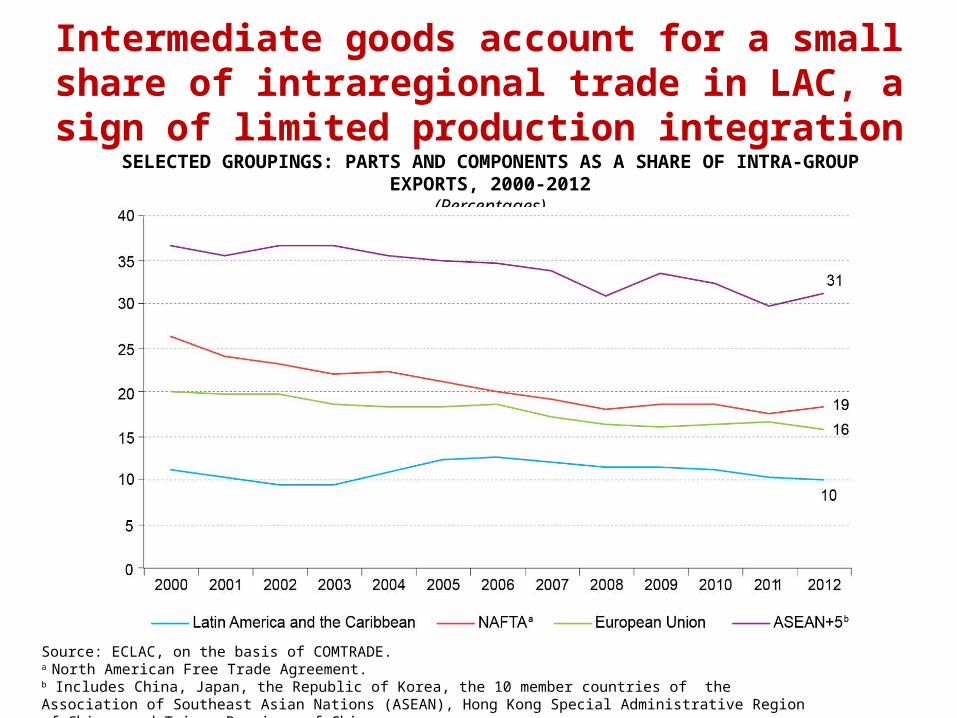
Intermediate goods account for a small share of intraregional trade in LAC, a sign of limited production
integrationSELECTED GROUPINGS: PARTS AND COMPONENTS AS A SHARE OF INTRA-GROUP EXPORTS, 2000-2012
(Percentages)
Source: ECLAC, on the basis of COMTRADE.a North American Free Trade Agreement. b Includes China, Japan, the Republic of Korea, the 10 member countries of the Association of Southeast Asian Nations (ASEAN), Hong Kong Special Administrative Region of China and Taiwan Province of China.
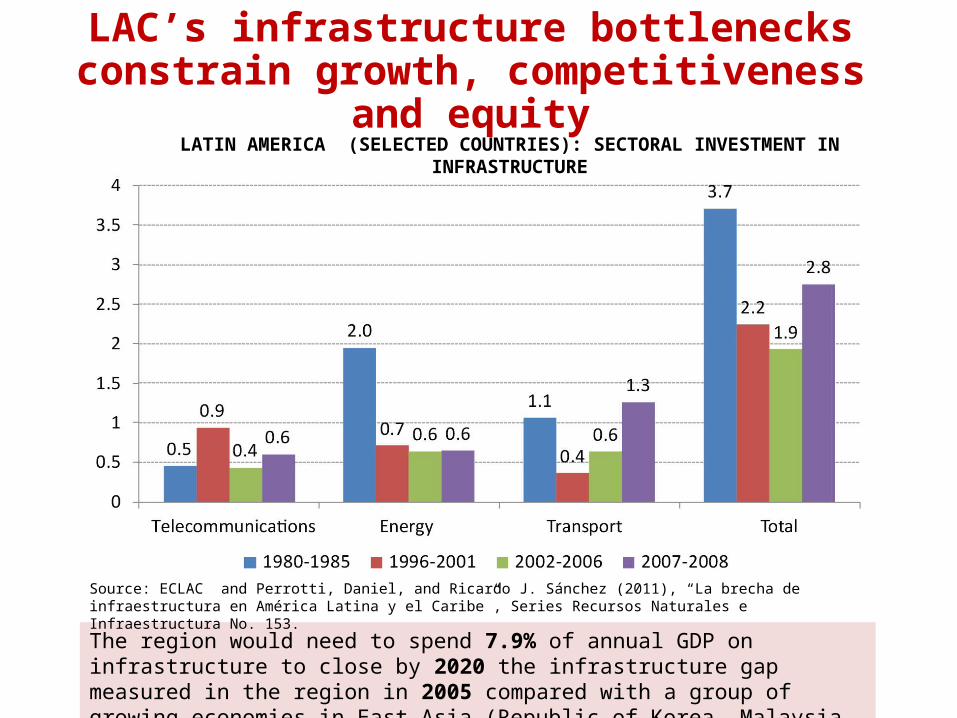
LAC’s infrastructure bottlenecks constrain growth, competitiveness and equity
LATIN AMERICA (SELECTED COUNTRIES): SECTORAL INVESTMENT IN INFRASTRUCTURE(Percentages of GDP)
The region would need to spend 7.9% of annual GDP on infrastructure to close by 2020 the infrastructure gap measured in the region in 2005 compared with a group of growing economies in East Asia (Republic of Korea, Malaysia, Singapore and Hong Kong SAR).
Source: ECLAC and Perrotti, Daniel, and Ricardo J. Sánchez (2011), “La brecha de infraestructura en América Latina y el Caribe”, Series Recursos Naturales e Infraestructura No. 153.

Regional economic integration: Taking stock
Strengths• Substantial progress in
reducing tariff barriers to intraregional trade
• Some regional cooperation in infrastructure (roads, energy, internet access, etc.)
• Some progress on easing people mobility
• Some financial cooperation (Latin American Reserve Fund, integration of stock exchanges of Chile, Colombia and Peru)
Shortcomings/challenges• Insufficient regulatory
harmonization: investment, services, technical standards, public procurement, trade facilitation, IPRs
• Weak dispute settlement mechanisms
• Missing trade links, notably a Mexico-Mercosur FTA
• Complex integration architecture, membership overlaps
• Geography and factor endowment also limit intra-regional trade:– Mexico, Central America & Caribbean gravitate towards the US market– Resource-rich South America increasingly gravitates towards Asia
• Lags in infrastructure, red tape are a tax on intraregional trade• Policies aimed at export diversification, SME internationalization
have proved insufficient – A few large firms, mostly in energy & mining, account for the bulk of LAC
exports – Those firms export mostly outside the region
• The region remains mostly out of value chain trade – Exceptions: Mexico, Central America with US; Argentina-Brazil auto trade
• Mega regional trade agreements may reinforce this situation– South America in particular may become further entrenched in commodity
exports
LAC trade integration: Taking stock (2)

Which way forward? LAC needs to maximize the benefits of intraregional trade, as it
is: The most conducive to the creation of high-quality employment
The most SME-friendly
And thus the most conducive to structural change, socially cohesive growth
Start by not doing harm: respect the agreed rules Be pragmatic: small, incremental steps in areas of common
interest often deliver more than grand projects with no follow-up Further trade liberalization remains controversial within the
region, but there is much that can be done in other areas: Regional cooperation in infrastructure, energy, trade facilitation, joint
export promotion
Promoting production integration through cumulation of origin, harmonization or mutual recognition of technical & SPS standards
Ensuring adequate financing for intraregional trade, especially for SMEs
The centrality of industrial policy• LAC needs a modern industrial policy that fosters:
– Participation in regional and global value chains– Moving up the VC hierarchy, transitioning to more sophisticated activities
in goods and services
• The promotion of regional value chains opens up scope for industrial policy with plurinational components, for example:– Programs that help SMEs to meet the requirements of their potential
buyers (quality, safety, sustainability, etc.)– Joint programs for the development of specialized human resources– Joint research, development of technology hubs in areas of shared
interest (renewable energy, biotechnology applied to agriculture and mining, etc.)
• None of this means “leaving natural resources behind” – On the contrary, it means adding knowledge and value to them, and
strengthening their linkages with the rest of the economy
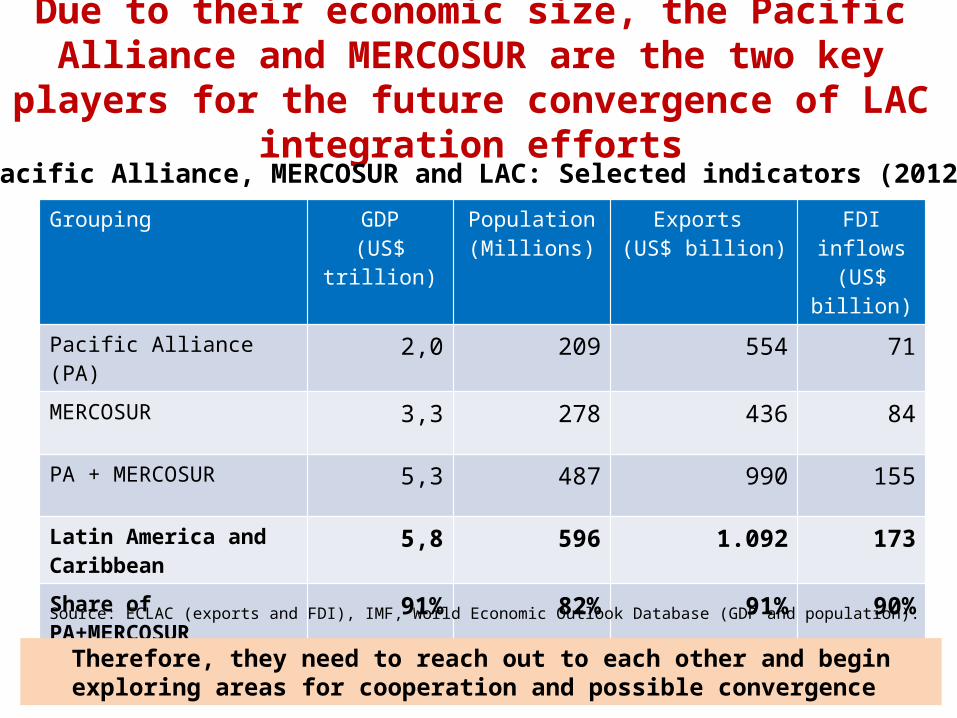
Due to their economic size, the Pacific Alliance and MERCOSUR are the two key players for the future
convergence of LAC integration efforts
Grouping GDP(US$ trillion)
Population (Millions)
Exports (US$ billion)
FDI inflows (US$ billion)
Pacific Alliance (PA) 2,0 209 554 71
MERCOSUR 3,3 278 436 84
PA + MERCOSUR 5,3 487 990 155
Latin America and Caribbean
5,8 596 1.092 173
Share of PA+MERCOSUR 91% 82% 91% 90%
Source: ECLAC (exports and FDI), IMF, World Economic Outlook Database (GDP and population).
Pacific Alliance, MERCOSUR and LAC: Selected indicators (2012)
Therefore, they need to reach out to each other and begin exploring areas for cooperation and possible convergence

Thank you – Gracias - Merci


