
2015 Thanksgiving Travel Forecast
Chaddick Institute for Metropolitan DevelopmentDePaul University | November, 2015
U.S. Intercity Bus Industry
2015 Thanksgiving Holiday Travel Overview U.S. Intercity Bus Industry
Chaddick Institute for Metropolitan Development, DePaul University
November 11, 2015
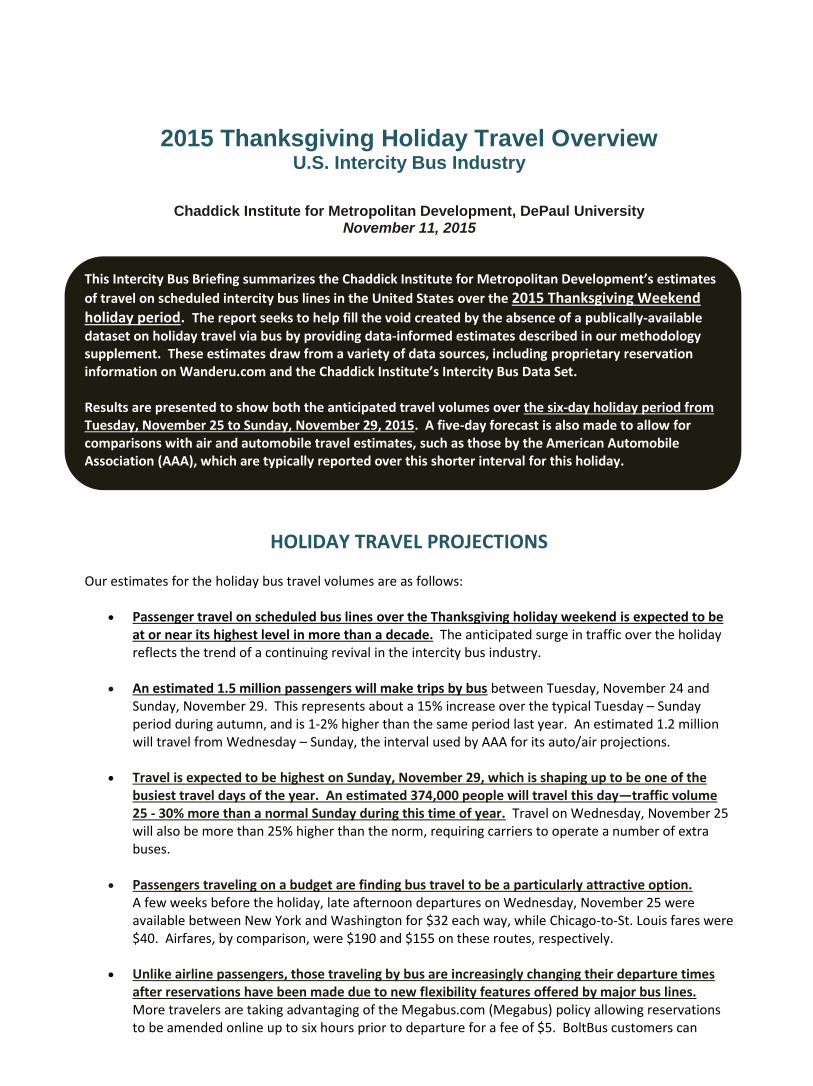
This Intercity Bus Briefing summarizes the Chaddick Institute for Metropolitan Development’s estimates
of travel on scheduled intercity bus lines in the United States over the 2015 Thanksgiving Weekend holiday period. The report seeks to help fill the void created by the absence of a publically-available dataset on holiday travel via bus by providing data-informed estimates described in our methodology supplement. These estimates draw from a variety of data sources, including proprietary reservation information on Wanderu.com and the Chaddick Institute’s Intercity Bus Data Set. Results are presented to show both the anticipated travel volumes over the six-day holiday period from Tuesday, November 25 to Sunday, November 29, 2015. A five-day forecast is also made to allow for comparisons with air and automobile travel estimates, such as those by the American Automobile Association (AAA), which are typically reported over this shorter interval for this holiday.
HOLIDAY TRAVEL PROJECTIONS
Our estimates for the holiday bus travel volumes are as follows:
Passenger travel on scheduled bus lines over the Thanksgiving holiday weekend is expected to be at or near its highest level in more than a decade. The anticipated surge in traffic over the holiday reflects the trend of a continuing revival in the intercity bus industry.
An estimated 1.5 million passengers will make trips by bus between Tuesday, November 24 and Sunday, November 29. This represents about a 15% increase over the typical Tuesday – Sunday period during autumn, and is 1-2% higher than the same period last year. An estimated 1.2 million will travel from Wednesday – Sunday, the interval used by AAA for its auto/air projections.
Travel is expected to be highest on Sunday, November 29, which is shaping up to be one of the busiest travel days of the year. An estimated 374,000 people will travel this day—traffic volume 25 - 30% more than a normal Sunday during this time of year. Travel on Wednesday, November 25 will also be more than 25% higher than the norm, requiring carriers to operate a number of extra buses.
Passengers traveling on a budget are finding bus travel to be a particularly attractive option. A few weeks before the holiday, late afternoon departures on Wednesday, November 25 were available between New York and Washington for $32 each way, while Chicago-to-St. Louis fares were $40. Airfares, by comparison, were $190 and $155 on these routes, respectively.
Unlike airline passengers, those traveling by bus are increasingly changing their departure times after reservations have been made due to new flexibility features offered by major bus lines. More travelers are taking advantaging of the Megabus.com (Megabus) policy allowing reservations to be amended online up to six hours prior to departure for a fee of $5. BoltBus customers can
rebook up to the day prior to the original planned departure for a $4.50 fee. In each case, travelers must also pay the difference in fare. Airlines generally charge a $75 - $200 change fee, in addition to the difference in fare.
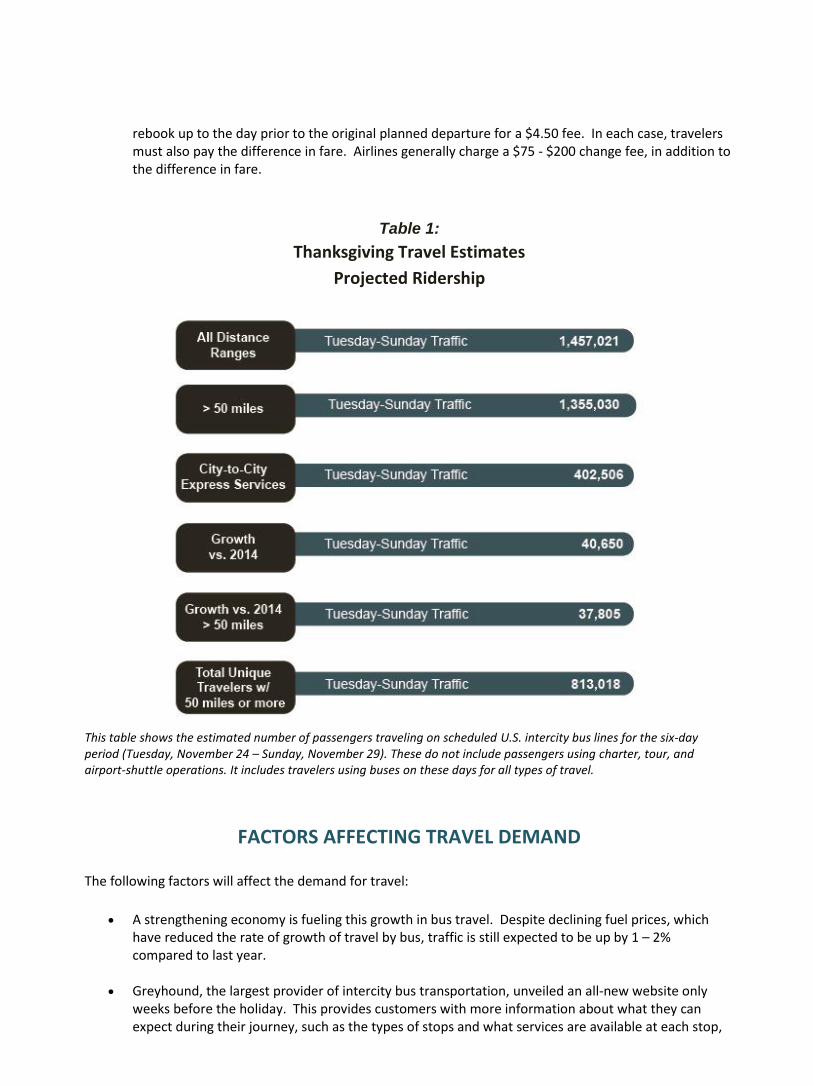
Table 1:
Thanksgiving Travel Estimates
Projected Ridership
This table shows the estimated number of passengers traveling on scheduled U.S. intercity bus lines for the six-day period (Tuesday, November 24 – Sunday, November 29). These do not include passengers using charter, tour, and airport-shuttle operations. It includes travelers using buses on these days for all types of travel.
FACTORS AFFECTING TRAVEL DEMAND
The following factors will affect the demand for travel:
A strengthening economy is fueling this growth in bus travel. Despite declining fuel prices, which have reduced the rate of growth of travel by bus, traffic is still expected to be up by 1 – 2% compared to last year.
Greyhound, the largest provider of intercity bus transportation, unveiled an all-new website only weeks before the holiday. This provides customers with more information about what they can expect during their journey, such as the types of stops and what services are available at each stop,
as well offering new features to “filter” search results.
Bus travelers will be reserving more seats this year than in any previous holiday period. Travelers this holiday will benefit from the recently introduced Megabus feature allowing travelers to choose among 20 seats per bus to reserve across its entire North American system.
Starting this year, travelers can alert family members about exactly when they will arrive. Greyhound recently unveiled BusTracker, a GPS tracking system that allows customers to see where their bus is and when it will arrive at their destination. The Megabus USA mobile bus tracking application affords travelers similar conveniences.
The growth of bus travel is being fueled by sophisticated booking sites that that allow customers to search for the best option. Wanderu estimates that 20% of its reservation activity involves incremental bookings that carriers would not otherwise attract--bookings spurred by value-added conveniences, such as the station locator and mobile apps.
Demand is also bolstered by the growing availability of discount city-to-city express services by BoltBus, Greyhound Express, Megabus, Peter Pan Express, and many other lines. These services include guaranteed seating, and other such amenities as free Wi-Fi and power outlets, which are now standard on most motorcoaches.
The rise in bus travel has several favorable implications. Buses are generally more fuel efficient than other major modes of intercity travel, creating environmental benefits. They also lessen congestion on roads by reducing private vehicular traffic, which is particularly important during high-traffic holiday travel periods. Bus travel is also generally priced less than air and rail travel.
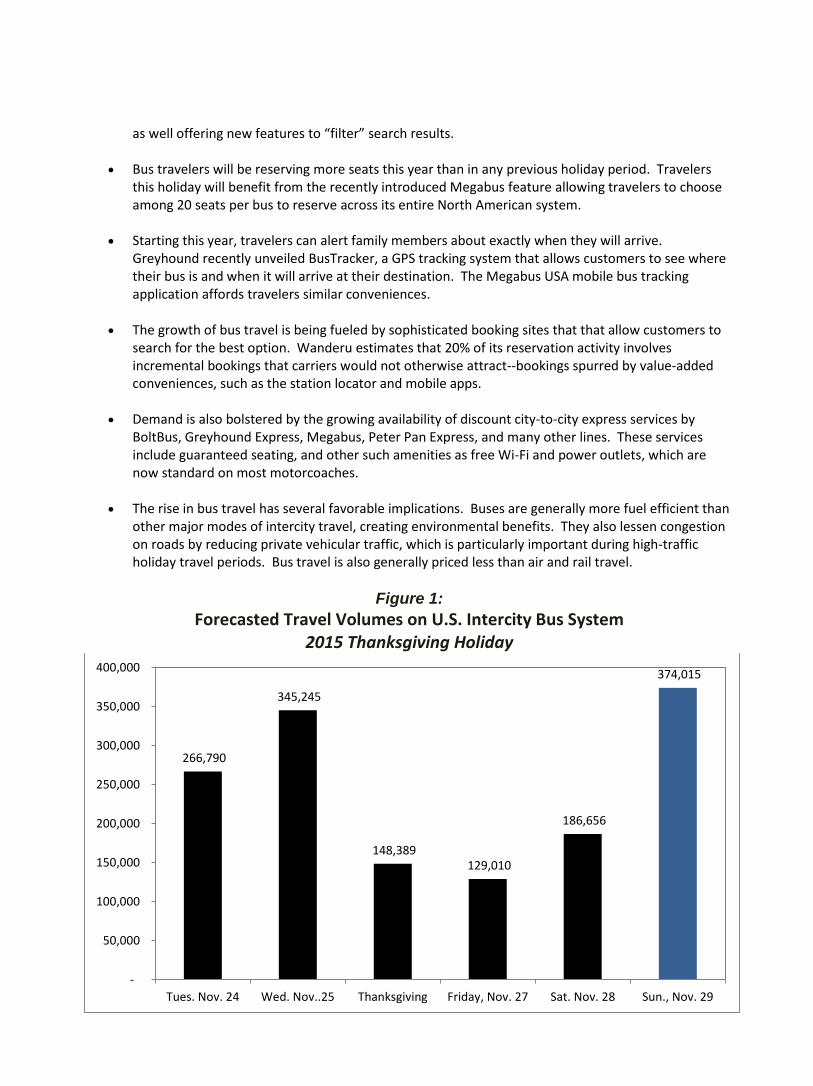
Figure 1:
Forecasted Travel Volumes on U.S. Intercity Bus System 2015 Thanksgiving Holiday
266,790
345,245
148,389 129,010
186,656
374,015
-
50,000
100,000
150,000
200,000
250,000
300,000
350,000
400,000
Tues. Nov. 24 Wed. Nov..25 Thanksgiving Friday, Nov. 27 Sat. Nov. 28 Sun., Nov. 29
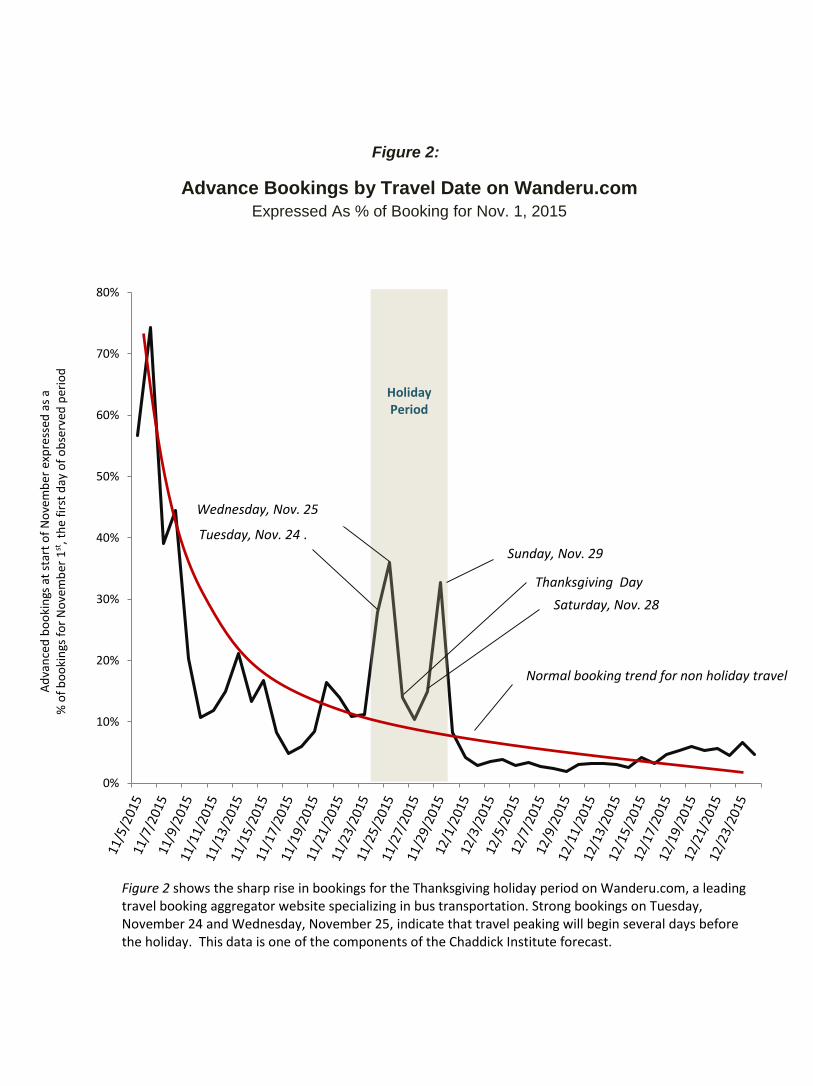
Figure 2:
Advance Bookings by Travel Date on Wanderu.com
Expressed As % of Booking for Nov. 1, 2015
0%
10%
20%
30%
40%
50%
60%
70%
80%
HolidayPeriod
Sunday, Nov. 29
Normal booking trend for non holiday travel
Tuesday, Nov. 24 .
Saturday, Nov. 28
Thanksgiving Day
Figure 2 shows the sharp rise in bookings for the Thanksgiving holiday period on Wanderu.com, a leading travel booking aggregator website specializing in bus transportation. Strong bookings on Tuesday, November 24 and Wednesday, November 25, indicate that travel peaking will begin several days before the holiday. This data is one of the components of the Chaddick Institute forecast.
Wednesday, Nov. 25
Ad
van
ced
bo
oki
ngs
at
star
t o
f N
ove
mb
er e
xpre
ssed
as
a
% o
f b
oo
kin
gs f
or
No
vem
ber
1st
, th
e fi
rst
day
of
ob
serv
ed p
erio
d
CONTACTS
Researchers for Study
Joseph Schwieterman, Ph.D. Director and Professor Chaddick Institute for Metropolitan Development DePaul University Chicago, IL 60422 312.362.5732 [email protected] Marisa Schulz Associate Director Chaddick Institute for Metropolitan Development DePaul University Chicago, IL 60422 312.362.5731 [email protected]
Industry Contacts Available for Comment
Polina Raygorodskaya CEO Wanderu.com Boston, MA [email protected] Dan Ronan Senior Director, Communications American Bus Association Washington D.C. [email protected]


