

INTERCITY TRANSIT2016 Annual Report2017-2022 Transit Development Plan
Prepared by Intercity Transit Development DepartmentApproved by Intercity Transit Authority
September 2017
Page | 1
Intercity Transit Authority:
Debbie Sullivan – Chair - City of Tumwater Karen Messmer – Vice Chair - Citizen Representative Virgil Clarkson – City of Lacey Bud Blake - Thurston County Molly Carmody- City of Yelm Art Delancy – Labor Representative Clark Gilman - City of Olympia Don Melnick - Citizen Representative Ryan Warner - Citizen Representative
Ann Freeman-Manzanares - General Manager: Intercity Transit 526 Pattison SE PO Box 659 Olympia, WA 98507 360-786-8585
Intercity Transit complies with all federal requirements under Title VI, which prohibits discrimination on the basis of race, color or national origin. If you have any questions concerning this policy or practice please, contact: Intercity Transit, 526 Pattison SE, PO Box 659, Olympia, WA 98507 or by calling the agency’s Title VI Officer at: 360.705.5885 or [email protected] This document can be made available in other accessible formats. Please contact Customer Service: 360-786-1881 or outside Thurston County: 1-800-287-6348 TTY: 360-943-5211, Fax: 360-943-8760 or [email protected].

Page | 2
Table of Contents
Introduction………………………………………………………… 3
Section 1: Organization…………………………………………. 4 Section 2: Physical Plant………………………………………… 7
Section 3: Service Characteristics………………………………. 7 Section 4: Service Connections…………………………………. 9 Section 5: Activities in 2016……………………………………... 10 Section 6: State Proposed Action Strategies 2017 – 2022.……. 11 Section 7: Summary of Proposed Changes 2017 - 2022………. 17 Section 8: Capital Improvement Program 2016 - 2022………... 18 Section 9: Operating Revenues & Expenditures 2016 - 2022… 23 Appendices:………………………………………………………….. 30
A: Organizational Chart B: Service Area C: Operating Data

Page | 3
Introduction to Intercity Transit’s 2016 Annual Report & 2017 - 2022 Transit Development Plan
In accordance with RCW 35.58.2795, Intercity Transit has prepared and submitted this Annual Report for 2016 and a subsequent Transit Development Plan (TDP) for years 2017 through 2022. The purpose of the Annual Report is to summarize the major or significant events that effected delivery of transit services in the Thurston County Public Transportation Benefit Area. Additionally, this document illustrates projected changes in local transit services in the next five years based on known facts, forecasted trends and political tendencies. Described in this plan are the methods and strategies proposed by Intercity Transit staff and endorsed by the Authority Board of Directors necessary to fulfill the provisions contained in our Mission and Vision statements. Mission Statement To provide and promote transportation choices that support an accessible, sustainable, livable, healthy and prosperous community. Vision Statement To be a leading transit system in the country, recognized for our well-trained, highly motivated, customer-focused, community-minded employees committed to enhancing the quality of life for all citizens of Thurston County. Public Hearing Public comment is encouraged with each annual update of the TDP. This year’s public hearing is scheduled to occur on Wednesday, August 16, 2017, 5:30 PM at the Transit Authority meeting, 526 Pattison St SE, Olympia, Washington. Following adoption, this Plan will be available at www.intercitytransit.com and will be distributed to the Washington State Department of Transportation, the Washington State Transportation Improvement Board, the Thurston Regional Planning Council, Thurston County, and the cities of Lacey, Olympia, Tumwater and Yelm. Strategic Plan This Transit Development Plan is a complementary document to a separate Strategic Plan which considers future service designs, capital facilities, equipment, agency policies and other key business strategies. Intercity Transit involves the public, agency staff, our Citizen Advisory Committee (CAC) and Transit Authority in annually reviewing and updating our Strategic Plan in a similar but separate process. The Strategic Plan contains components of the TDP, but provides the more in-depth analysis and discussions for developing the annual budget (2018) and provides guidance for the future direction of the agency.

Page | 4
Section 1: Organization
Intercity Transit is the business name for the Thurston County Public Transportation Benefit Area (PTBA) which was established in September 1980 as authorized by Washington State law, RCW 36.57A. A brief history of the agency follows.
Agency History
September 1980: Voters from Olympia, Lacey, Tumwater, and the surrounding urban area, approved collection of a local sales tax of 0.3% for the PTBA. On January 1, 1981, the PTBA Authority formally assumed control of local transit services previously operated through an intergovernmental agreement between the cities of Lacey, Olympia, and Tumwater.
May 1992: Further expansion of the Intercity Transit service area occurred and Thurston County voters outside the urbanized area approved the 0.3% sales tax to support the expansion of the PTBA to include all of Thurston County. The expansion included the several south county cities and towns as well as the rural areas of unincorporated Thurston County.
1995 – 1999: Local sales tax revenue slowed which resulted in the gradual reduction of bus service as a way of balancing operating costs with available revenues. In March 1999 a local ballot measure failed to pass which proposed a 0.2% increase in the transit sales tax necessary to preserve service as well as a modest expansion; the result was an 8% reduction in existing bus service. Moreover, the passage of statewide Initiative No. 695 in November 1999, removed Motor Vehicle Excise Tax (MVET) revenue was from transit use.
2000 – 2002: The loss of MVET funding resulted in a decrease of 40% in revenue and required a 42% service reduction in February 2000. In early 2002, a Public Transportation Improvement Conference was convened of the local jurisdictions in Thurston County; the Conference resulted in the establishment of the current service boundary which contains the urbanized areas of Olympia, Lacey, Tumwater and Yelm. In September 2002, voters within the new boundary approved a 0.3% increase to the local transit sales tax raising the rate to 0.6%; the new rate took effect in January 2003.
2003 – 2005: Incremental service increases began over three phases. Both Phase 1 (February 2003) and Phase 2 (September 2004) included 15% increases in service hours. A new corporate logo, bus graphics, and uniforms were also introduced in 2004. During 2005 the focus shifted to rebuilding the fleet, updating operational software and systems, improving facilities, accessibility and shelters at bus stops and completing market research and ridership studies.
2006 – 2007: A three phase increase of service hours was implemented exceeding 15% in expansion. A new circulator route called “Dash” began operating between the Capitol Campus and downtown Olympia. A fixed route Short and Long Range Service Plan was completed in 2006 and 26 expansion vanpools were acquired. The installation of a communications system with advanced digital radio, AVL tracking, stop announcements and auto-passenger counters were completed in 2007 as well as a new multi-year service plan. A small increase in service hours was implemented as well as upgrades to the fleet including 23 new buses (5 expansion), 3 Dial-A-Lift vans and 44 vanpools (27 expansion). Total system boardings in 2007 increased 12% above 2006. Intercity Transit completed a state-funded Trip Reduction program with state offices in Tumwater. Outreach efforts engaged over 1,000 participants in the annual Bicycle Commuter Contest and a new education program, “Smart Moves,” for middle and high school students was launched.
2008 – 2009: An 11% increase in service hours brought new local service enhancements and introduced 15 minute service on major corridors. Expansion of the Martin Way Park & Ride Lot

Page | 5
(Lacey) began and installation of on-board security camera for the fleet was completed. System wide ridership rose to new records exceeding 5.1 million boardings in 2008 as fuel prices nationwide climbed to an average $3.50 per gallon. Intercity Transit received two national awards in 2009: APTA’s “Outstanding Public Transportation System” for medium sized systems and FTA’s “Success in Enhancing Transit Ridership.” The Martin Way P&R expansion was completed (138 to 319 stalls) as well as major market research and ridership studies. During this time a master site plan for the expansion of the operations base, as well as an updated plan for the Olympia Transit Center (OTC) expansion were completed. Grants were received to construct a 300 stall Park &Ride lot on the Thurston County Waste and Recovery Center, and a ‘Safe Routes to Schools’ funded program for bicycling youth was introduced at several local schools. The base fare was increased from $.75 to $1.00 during this time period.
2010 – 2011: In 2010 the agency acquired 6 new hybrid-electric replacement buses and local voters approved a 0.2% increase in local transit sales tax raising the rate to the current 0.8%. A discounted bus pass pilot program began intending to help local non-profit and human service agencies with their client’s transportation needs. Commute Trip Reduction (CTR) law changes significantly increased the number of affected worksites in Thurston County and Intercity Transit celebrated its 30th anniversary in 2011. The agency was selected by the Federal Transit Administration (FTA) to receive ISO 14001-certified Environmental and Sustainability Management System (ESMS) training which resulted in a new ESMS program. Major capital facility projects for the Olympia Transit Center (OTC), Operations Base as well as the Hawks Prairie P&R Lot were continued. A Dial-a-Lift (paratransit) client survey was completed and the agency hit a record 5.3 million boardings, including fixed-route ridership of 4.5 million. An online trip planner, as well as a regional application for ‘next bus’ information were implemented.
2012: Intercity Transit became the first transit system in the country to be awarded ‘Gold Level’ APTA Sustainability Commitment status. Innovative programs were continued including Smart Moves youth outreach and Bike PARTners, a program that supports healthy commutes to schools. Bicycle Commuter Contest celebrated their 25th anniversary and passenger fare increased 25% on fixed route service (for adults) as well as a 10% increase on vanpool fares. The discounted pass program, which began in 2010, was approved for future years, however new federal legislation under MAP-21 removed important discretionary funding for buses and bus facilities.
2013: The Authority Board selects a new General Manager (Ann Freeman-Manzanares) and local base fare increased from $1.00 to $1.25. The new 332 stall Hawks Prairie Park & Ride Lot officially opened in NE Lacey and received the American Public Works Association “Project of the Year” for Washington state. The agency earned ISO 14001 Certification for Sustainability and Environmental practices and at the time was one of only nine transit systems in the country to have received the award. Two grant funded demonstration Express routes were implemented to offer commuter service between Tumwater/Lakewood as well as limited Sound Transit peak service between Olympia/Seattle.
2014: A new youth outreach program called ‘Walk N Roll’ along with Bike PARTners continued to grow and was present in every school district within the service area. Computer servers were relocated a state agency in Olympia as part of a technology enhancement project, which significantly reduced safety issues and on-site remodeling needs. Intercity Transit received the Thurston County Chamber of Commerce ‘Green Business of the Year Award’ and ridership growth began to stabilize—recording a modest 1% annual increase in fixed route ridership which became the agency’s 3rd highest ridership year.

Page | 6
2015: The ‘Walk N Roll’ program continued to grow; four bus shelters were installed and 30 bus stops received ADA enhancements. Travel Trainers assisted 72 individuals, coaching them to use bus service safely and confidently and Intercity Transit was awarded the first-ever statewide Grand Champion honor in State Public Transportation Roadeo competition.
2016: In partnership with the City of Tumwater, Intercity Transit received a regional grant to improve pedestrian accessibility and safety at the Tumwater Square transfer station. The 29th annual Bicycle Commuter Contest, sponsored by Intercity Transit, set a record of over 107,990 miles traveled by 1,853 registrants and 112 teams—an estimated 54 tons of CO2 prevention. The Sustainability program was recertified and met the ISO 14001 – 2015 Standards, remaining one of a few public transit systems in the country to do so.
Governing Board
Intercity Transit is governed by a nine member Authority Board who collectively provide financial oversight and policy guidance to staff through an appointed General Manager. The Authority is organized pursuant to RCW 36.57A.050 and is composed of five locally elected officials representing the jurisdictions of Thurston County, Lacey, Olympia, Tumwater, and Yelm, plus three citizen representatives appointed by the Transit Authority; in 2010 the board expanded to nine members following the addition of a non-voting position representing organized labor. Elected officials are appointed by their respective jurisdictions and citizen representatives on the Authority serve staggered three-year terms—Intercity Transit is the only system in Washington State with citizen members serving on its governing board. A 20 member Citizens Advisory Committee was established in April 2000 to provide additional recommendations to the Authority on local issues affecting public transportation.
Table of Organization
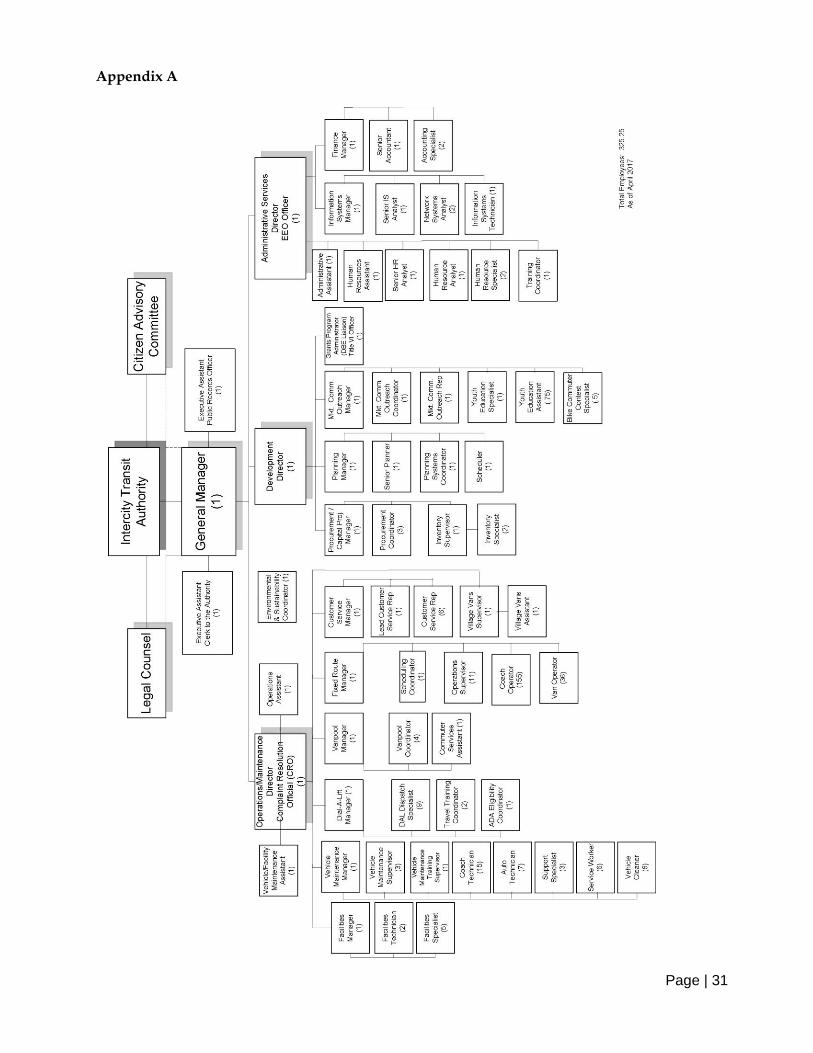
At the end of December 2016, Intercity Transit had 325 full-time equivalent staff positions (see table below for FTE’s and Appendix A for organization chart).
Department
Jan 2014
Jan 2015
Jan 2016
Jan 2017
Executive 3.0 3.0 3.0 3.0
Development – (under Executive mid-2013 - 2016) 17.25 18.75 19.0 19.0 Grants & Sustainability
Planning Procurement/Inventory Marketing & Communications
2.0 4.0 6.0
5.75
2.0 4.0 7.0 5.75
2.0 4.0 7.0 6.0
2.0 4.0 7.0 6.0
Human Resources - Assistants & Analysts 6.0 6.0 7.0 7.0
Finance & Administration 11.0 11.0 10.0 10.0 Accounting, Inventory, Clerical,
*Information Systems to Maintenance mid ’08 back to Finance late-‘10
6.0 5.0
6.0 5.0
5.0 5.0
5.0 5.0
Operations: 229.0 232.0 226.0 235.0 Operators
Customer Service Vanpool staff Dial-A-Lift staff Supervisors and Administrative *Village Vans to Operations in ‘10
185.0 8.0 5.0
11.0 18.0 2.0
188.0 8.0 5.0 11.0 18.0 2.0
181.0 8.0 6.0 11.0 18.0 2.0
191.0 8.0 6.0 12.0 16.0 2.0
Maintenance: (moved under Operations early 2014) 47.0 47.0 49.0 51.0 Coach/Auto Technicians
Facilities Maintenance Other Maintenance
22.0 7.0
18.0
22.0 7.0 18.0
22.0 7.0 18.0
22.0 8.0 21.0
Total Employees 313.75 317.75 314.0 325.0
Page | 7
Section 2: Physical Plant
Intercity Transit owns several facilities including the Olympia Transit Center (OTC), the Lacey Transit Center (LTC), Centennial [Amtrak] Station and the main base facility located at 526 Pattison Street SE in Olympia. All maintenance, administration and dispatch functions are performed from the Pattison Base. In 2005 Intercity Transit purchased adjacent property to the Pattison Base with the intent of expanding the facility to better accommodate agency growth. In 2012 nearby office space was leased to provide necessary workspace relief and in 2016 the expansion project began with a commitment to fund final design and replace existing underground fuel storage tanks. Intercity Transit has received State/Federal funding for elements of the project but continues to seek funding for the remaining estimated amount.
Section 3: Service Characteristics - 2016
During 2016 Intercity Transit provided a variety of transportation services benefiting the residents and visitors of Thurston County (See Appendix for service area district maps):
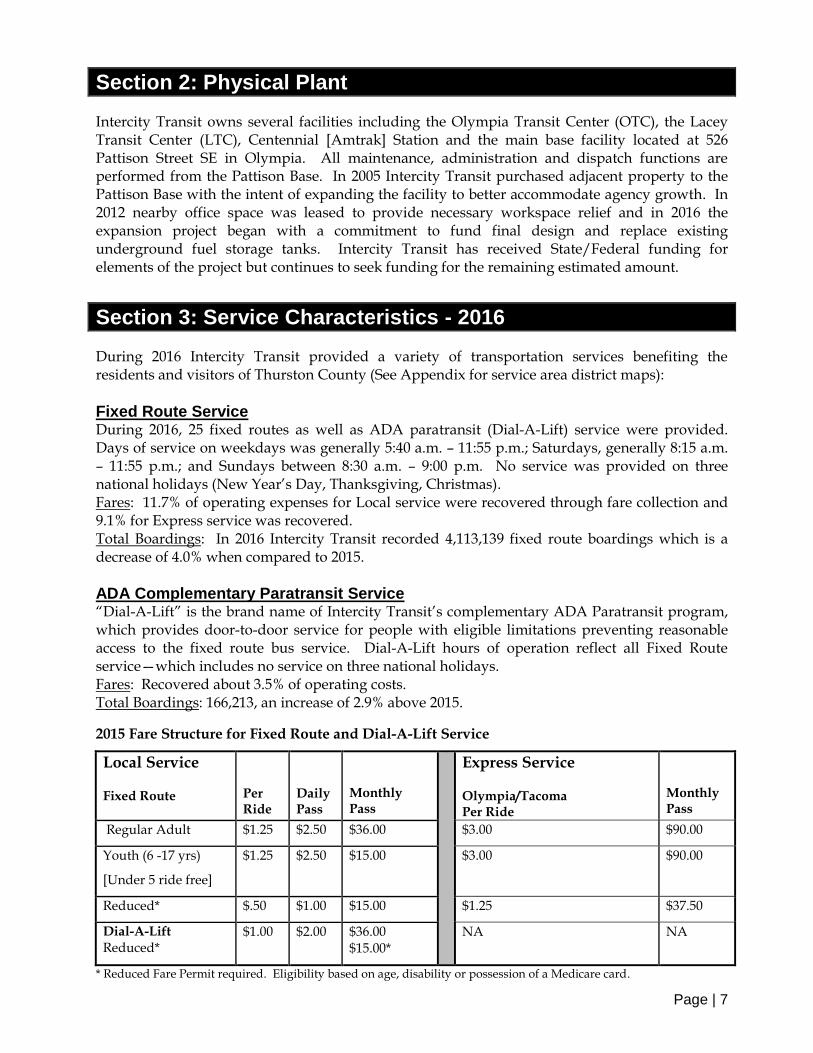
Fixed Route Service During 2016, 25 fixed routes as well as ADA paratransit (Dial-A-Lift) service were provided. Days of service on weekdays was generally 5:40 a.m. – 11:55 p.m.; Saturdays, generally 8:15 a.m. – 11:55 p.m.; and Sundays between 8:30 a.m. – 9:00 p.m. No service was provided on three national holidays (New Year’s Day, Thanksgiving, Christmas). Fares: 11.7% of operating expenses for Local service were recovered through fare collection and 9.1% for Express service was recovered. Total Boardings: In 2016 Intercity Transit recorded 4,113,139 fixed route boardings which is a decrease of 4.0% when compared to 2015.
ADA Complementary Paratransit Service “Dial-A-Lift” is the brand name of Intercity Transit’s complementary ADA Paratransit program, which provides door-to-door service for people with eligible limitations preventing reasonable access to the fixed route bus service. Dial-A-Lift hours of operation reflect all Fixed Route service—which includes no service on three national holidays. Fares: Recovered about 3.5% of operating costs. Total Boardings: 166,213, an increase of 2.9% above 2015.
2015 Fare Structure for Fixed Route and Dial-A-Lift Service
Local Service Fixed Route
Per Ride
Daily Pass
Monthly Pass
Express Service Olympia/Tacoma Per Ride
Monthly Pass
Regular Adult $1.25 $2.50 $36.00 $3.00 $90.00
Youth (6 -17 yrs)
[Under 5 ride free]
$1.25 $2.50 $15.00 $3.00 $90.00
Reduced* $.50 $1.00 $15.00 $1.25 $37.50
Dial-A-Lift
Reduced*
$1.00 $2.00 $36.00 $15.00*
NA NA
* Reduced Fare Permit required. Eligibility based on age, disability or possession of a Medicare card.

Page | 8
Vanpool Services Operation
At the end of 2016 there were 177 Intercity Transit commuter vanpools in operation throughout the Puget Sound region; a decrease of 15 compared to the year prior. In 2016 the vanpools carried an average of 1,300 daily riders.
Intercity Transit staff promote the vanpool program to employers and individuals as well as facilitate group formation and provide defensive driver training. Vanpool groups lease the vehicles on a monthly mileage basis and operate the vehicles independent of other Intercity Transit services; vans and are generally in service weekdays, from 5 a.m. – 6:30 p.m.
Fares: 93.4% of the operating costs were recovered in 2016. Total Boardings: 600,148 trips were recorded in 2016 which was a decrease of 12.4% from 2015. Ridematching: Intercity Transit is a member of the Washington/Oregon Rideshare network that provides a computerized database of individuals interested in carpooling and vanpooling. Rideshare online is a free service to the user that was established in 1997 which allows commuters the ability to make contacts throughout the region either through a toll free call, over the internet or with a local transit system.
Village Vans
In 2002 Intercity Transit began a new grant-funded service to operate four vans intended to help meet work-related transportation challenges for low income families. In 2016 the program provided employment support transportation for 180 individuals totaling 6,523 rides which was a 38% increase compared to 2015. Of the total ridership, 29% were qualified under Temporary Assistance for Needy Families (TANF) and 71% were receiving state or federal assistance for low-income households. The program allows vans to be driven by eligible job seekers participating in the Customized Job Skills Training Program, volunteering a total of 7,326 hours in 2016. During 2016 twelve volunteer drivers secured employment (eight in transportation) as did dozens of passengers. Village Vans is an innovative program that includes representatives from the Departments of Employment Security, Social and Health Services, South Puget Sound Community College, WorkSource Thurston County, Pacific Mountain Workforce Development Council and other local service agencies whose programs are intended to help job seekers or low income families.
Page | 9
Section 4: Service Connections
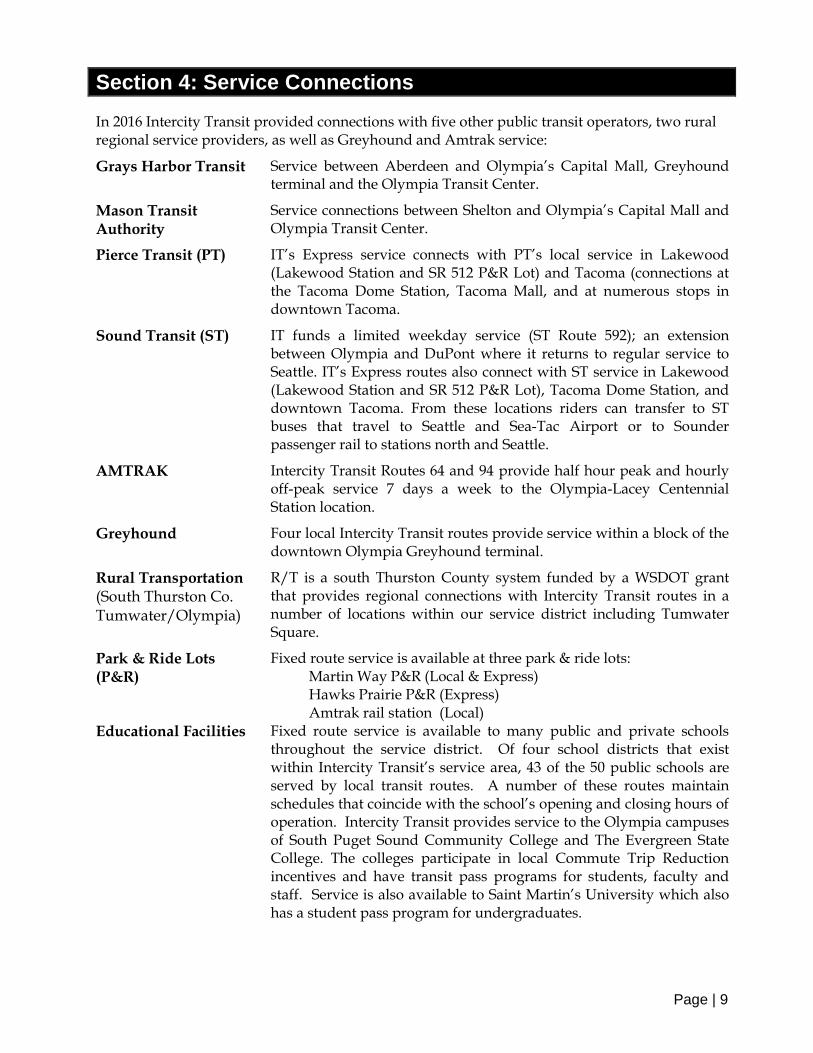
In 2016 Intercity Transit provided connections with five other public transit operators, two rural regional service providers, as well as Greyhound and Amtrak service:
Grays Harbor Transit Service between Aberdeen and Olympia’s Capital Mall, Greyhound terminal and the Olympia Transit Center.
Mason Transit Authority
Service connections between Shelton and Olympia’s Capital Mall and Olympia Transit Center.
Pierce Transit (PT) IT’s Express service connects with PT’s local service in Lakewood (Lakewood Station and SR 512 P&R Lot) and Tacoma (connections at the Tacoma Dome Station, Tacoma Mall, and at numerous stops in downtown Tacoma.
Sound Transit (ST) IT funds a limited weekday service (ST Route 592); an extension between Olympia and DuPont where it returns to regular service to Seattle. IT’s Express routes also connect with ST service in Lakewood (Lakewood Station and SR 512 P&R Lot), Tacoma Dome Station, and downtown Tacoma. From these locations riders can transfer to ST buses that travel to Seattle and Sea-Tac Airport or to Sounder passenger rail to stations north and Seattle.
AMTRAK Intercity Transit Routes 64 and 94 provide half hour peak and hourly off-peak service 7 days a week to the Olympia-Lacey Centennial Station location.
Greyhound Four local Intercity Transit routes provide service within a block of the downtown Olympia Greyhound terminal.
Rural Transportation (South Thurston Co. Tumwater/Olympia)
R/T is a south Thurston County system funded by a WSDOT grant that provides regional connections with Intercity Transit routes in a number of locations within our service district including Tumwater Square.
Park & Ride Lots (P&R)
Fixed route service is available at three park & ride lots: Martin Way P&R (Local & Express) Hawks Prairie P&R (Express) Amtrak rail station (Local)
Educational Facilities Fixed route service is available to many public and private schools throughout the service district. Of four school districts that exist within Intercity Transit’s service area, 43 of the 50 public schools are served by local transit routes. A number of these routes maintain schedules that coincide with the school’s opening and closing hours of operation. Intercity Transit provides service to the Olympia campuses of South Puget Sound Community College and The Evergreen State College. The colleges participate in local Commute Trip Reduction incentives and have transit pass programs for students, faculty and staff. Service is also available to Saint Martin’s University which also has a student pass program for undergraduates.
Page | 10
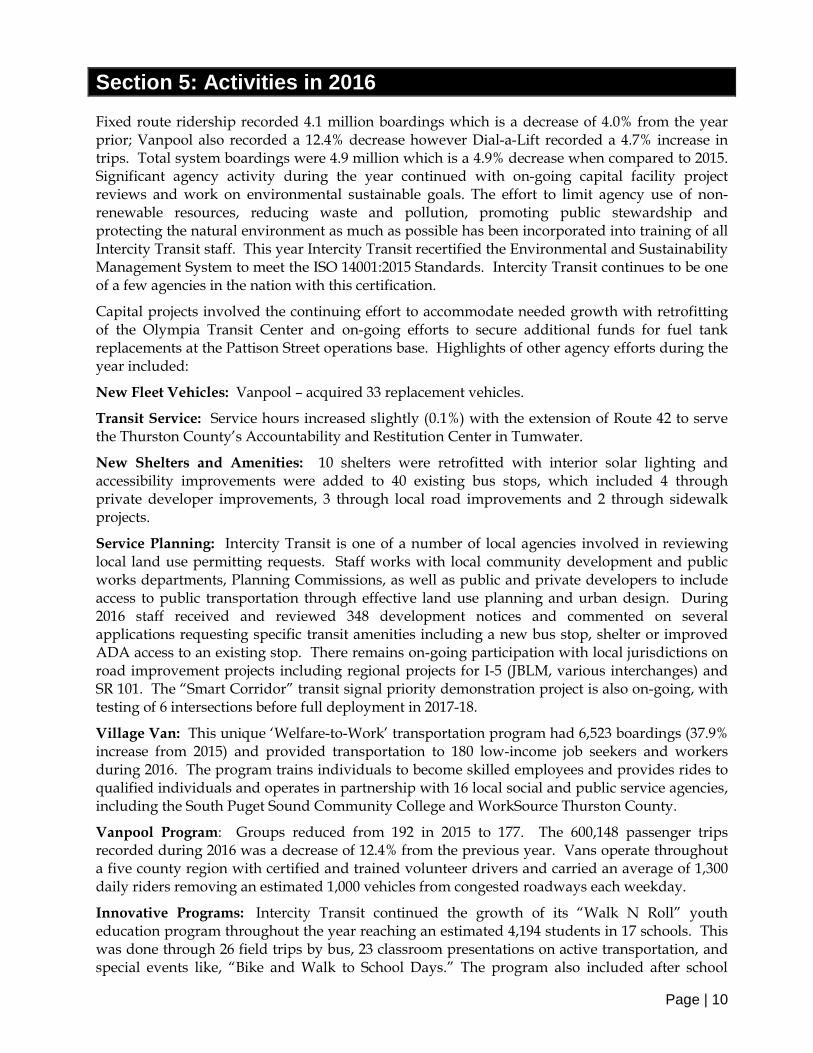
Section 5: Activities in 2016
Fixed route ridership recorded 4.1 million boardings which is a decrease of 4.0% from the year prior; Vanpool also recorded a 12.4% decrease however Dial-a-Lift recorded a 4.7% increase in trips. Total system boardings were 4.9 million which is a 4.9% decrease when compared to 2015. Significant agency activity during the year continued with on-going capital facility project reviews and work on environmental sustainable goals. The effort to limit agency use of non-renewable resources, reducing waste and pollution, promoting public stewardship and protecting the natural environment as much as possible has been incorporated into training of all Intercity Transit staff. This year Intercity Transit recertified the Environmental and Sustainability Management System to meet the ISO 14001:2015 Standards. Intercity Transit continues to be one of a few agencies in the nation with this certification.
Capital projects involved the continuing effort to accommodate needed growth with retrofitting of the Olympia Transit Center and on-going efforts to secure additional funds for fuel tank replacements at the Pattison Street operations base. Highlights of other agency efforts during the year included:
New Fleet Vehicles: Vanpool – acquired 33 replacement vehicles.
Transit Service: Service hours increased slightly (0.1%) with the extension of Route 42 to serve the Thurston County’s Accountability and Restitution Center in Tumwater.
New Shelters and Amenities: 10 shelters were retrofitted with interior solar lighting and accessibility improvements were added to 40 existing bus stops, which included 4 through private developer improvements, 3 through local road improvements and 2 through sidewalk projects.
Service Planning: Intercity Transit is one of a number of local agencies involved in reviewing local land use permitting requests. Staff works with local community development and public works departments, Planning Commissions, as well as public and private developers to include access to public transportation through effective land use planning and urban design. During 2016 staff received and reviewed 348 development notices and commented on several applications requesting specific transit amenities including a new bus stop, shelter or improved ADA access to an existing stop. There remains on-going participation with local jurisdictions on road improvement projects including regional projects for I-5 (JBLM, various interchanges) and SR 101. The “Smart Corridor” transit signal priority demonstration project is also on-going, with testing of 6 intersections before full deployment in 2017-18.
Village Van: This unique ‘Welfare-to-Work’ transportation program had 6,523 boardings (37.9% increase from 2015) and provided transportation to 180 low-income job seekers and workers during 2016. The program trains individuals to become skilled employees and provides rides to qualified individuals and operates in partnership with 16 local social and public service agencies, including the South Puget Sound Community College and WorkSource Thurston County.
Vanpool Program: Groups reduced from 192 in 2015 to 177. The 600,148 passenger trips recorded during 2016 was a decrease of 12.4% from the previous year. Vans operate throughout a five county region with certified and trained volunteer drivers and carried an average of 1,300 daily riders removing an estimated 1,000 vehicles from congested roadways each weekday.
Innovative Programs: Intercity Transit continued the growth of its “Walk N Roll” youth education program throughout the year reaching an estimated 4,194 students in 17 schools. This was done through 26 field trips by bus, 23 classroom presentations on active transportation, and special events like, “Bike and Walk to School Days.” The program also included after school

Page | 11
Earn-A-Bike classes where students received 8 hours of bike maintenance and safe riding instruction. Students completing the class earned a functional bike, helmet, lock and lights. 60 students graduated from the classes in 2016 and 80 bicycles were built with the majority of the work being done by volunteers who contributed a total of 847 hours to working on bikes.
Intercity Transit continues to provide online trip planning for fixed route service and participation in regional smart phone applications for ‘”One Bus Away” arrival information and trip planning. The Travel Training and Bus Buddy program also work with individuals to transition from paratransit service to fixed route, or assist people with becoming comfortable riding a bus.
Section 6: Proposed Action Strategies 2017 - 2022
The Washington State Department of Transportation (WSDOT) requires transit agencies report how they are accomplishing the state’s public transportation objectives as identified in state’s Transportation System Policy Goals (RCW 47.04.280).
1. ECONOMIC VITALITY To promote and develop transportation systems that stimulate, support, and enhance the movement of people and goods to ensure a prosperous economy.
2. PRESERVATION To maintain, preserve and extend the life and utility of prior investments in existing transportation systems and services.
2016 Continued Effort
Provided regular and reliable bus service in and around the cities of Olympia, Tumwater, Lacey and Yelm.
Programmed funds continued for facility repairs at the central base as well as maintenance of all transit centers.
Vanpool program had 33 vehicle replacements bringing the fleet total to 265 vans.
Continued efforts on funding fuel tank replacements and expanding vehicle parking at the Pattison Base facility.
Continued master plan for expansion of the Olympia Transit Center for fixed route service and an interstate private carrier (Greyhound).
2016 Continued Effort
Invested in public transportation which had a significant multiplier effect in creating jobs, personal wealth and tax revenues.
Provided reliable transportation and connections to employers and commercial shopping centers.
As a local employer Intercity Transit provided good paying jobs and encouraged local spending.
Supported local business by purchasing many goods and services from within the community and region.
2017 – 2022 Continuing Effort
Assess the fixed route system for ways to improve on-time-performance and general reliability.
Identify changes to the fixed route system to reduce total travel time between origins and destinations.
Explore expanded service to new commercial and residential developments.

Page | 12
Maintained two WSDOT Regional Mobility Grants for service enhancements of Express bus service on I-5 between Thurston and Pierce Counties; includes weekday service between Tumwater – Lakewood as well as an extension of existing Sound Transit RT 592 (DuPont/Seattle) to Olympia.
2017-2022 Continuing Effort
Use existing resources and eligible grants to maintain the same level of service over the next 3 - 5 years.
Continue to participate in eligible grant programs to replace aging fleet vehicles and maintain adequate depth and spare ratio.
Continue to work on capital facility projects including the expansion and remodel of the Operations Base in Olympia; namely the fuel tank replacement and parking expansion while the rest of the project awaits a funding solution.
Continue effort to expand the downtown Olympia Transit Center as a transportation hub, including accommodating Greyhound service.
Update the fixed route Short (6 yr) and Long Range (20 yr) Service Plan; explore revenue options that result from identified community needs.
3. SAFETY To provide for and improve the safety and security of transportation customers and the transportation system.
2016 Made Progress
Safety continues to be the system’s top priority. An internal Safety Committee meets monthly and confers on major events. The Committee reviews monthly safety reports, maintains ongoing safety records, and makes recommendations to the General Manager on issues involving employee and customer safety.
Maintained an outreach program to local schools for “Bike and Walk to School Days.” Other sponsored programs included classes where students received a recycled bike and learn maintenance and traffic skills as well as PE classes where students learn how to walk and bike to stay healthy and safe.
Provided regular and on-going training of Operations and Maintenance staff as well as other agency support staff.
Participated in local and regional efforts to increase safety and improve security components within the service district and improve coordination between agencies, particularly with local emergency services.
Continued participation in the regional coordination of the Puget Sound Transportation Recovery Plan for major disruptions to vital transportation facilities and links at both the local and regional level. Finalized a staff committee-developed All Hazards Emergency Response Plan.
Responded to numerous customer comments, suggestions and complaints.
Improved several bus stops for accessibility and lighting.

Page | 13
4. MOBILITY To improve the predictable movement of goods and people throughout Washington state, including congestion relief and improved freight mobility.
2016 Made Progress
Intercity Transit staff continues to participate in local and state planning efforts to develop and improve alternatives to single occupant vehicles. The agency also takes an active role with regional long range transportation planning activities intended to relieve congestion and associated environmental impacts.
Provided service integration with four other public transit providers, one rural regional service provider, as well as interstate bus and passenger rail service.
Continued fixed route and Dial-A-Lift (paratransit) services and a commuter Vanpool program as well as a Village Van program for qualified low-income recipients.
Continued fare integration partnerships with public agency employers and colleges that support employees and students’ use of transit. This included on-going work with WSDOT on state employee’s transit ‘STAR Pass’ program. The pass is available to all State employees working in Thurston County. Locally, student pass programs with the South Puget Sound Community College, Evergreen State College and St. Martin’s University continued. Pass agreements with Thurston County, the Thurston Regional Planning Council and City of Olympia were continued.
Intercity Transit staff regularly participates in local and regional meetings and with local, regional, state and tribal staff. Over the past year the agency has begun testing, funded with federal CMAQ funds, to make improvements in local traffic control technologies that will incorporate a ‘transit signal priority’ system in Olympia, Lacey and Tumwater.
Continued two WSDOT Regional Mobility Grants for service enhancements of Express service along the I-5 corridor between Thurston and Pierce Counties.
2017 – 2022 Continuing Effort
Continue to support health and equity in our service area by providing access and mobility for all people.
Continue to work with local jurisdictions to further integrate transit oriented
2017 – 2022 Continuing Effort
The agency will continue to review and develop programs for agency staff intended to improve safety and security.
Continue to work and make improvements with other public agencies and school districts regarding safety and emergency response on both local and regional level.
Provide training to ensure understanding and integration of National Incident Management System, All Hazards Emergency Response Plan, and Continuity of an Operations Plan. Implement priorities in Hazards Mitigation Plan. Continue to acquire and implement modifications to facilities and vehicles to increase safety and security for customers and employees.
Replace aging office equipment and continue to invest in adequate network security protections.
Complete an inter-local project with the City of Tumwater to improve transfer station accessibility, pedestrian safety and bus alignments at Tumwater Square.
Page | 14
development intended to enhance transportation options, improve walkability and connections to transit resulting in enhanced access to jobs and housing.
Continue to work with the other regional transportation providers to maintain and improve existing service connections.
Additional efforts for updating the agency’s Short and Long Range Plans to include significant “community conversation” outreach efforts.
Continue to work with local jurisdictions in partnership to improve public transportation accessibility between residential and commercial areas as well as on-going partnerships for road and safety improvements.
Staff will also continue to work with local jurisdictions, state, and tribal organizations in partnership to improve public transportation in the region for services along state roads and federal interstate.
The agency will continue to integrate improvements in information technology and transportation services. This includes web-based information, fare payment systems, mobile phone applications, on-street displays and other information materials that encourage and promote transportation alternatives.
Identify under-served areas and explore coordination between other contemporary ride sharing services to leverage access to public transportation.
5. ENVIRONMENTAL QUALITY AND HEALTH To enhance Washington’s quality of life through transportation investments that promote energy conservation, enhance healthy communities, and protect the environment.
2016 Made Progress
Provided several million trips that may have otherwise been taken in a single occupant vehicle.
Intercity Transit and Thurston Regional Planning Council cooperatively participate in local CTR efforts including promotional marketing efforts with employers around Thurston County. We continued to provide significant education and outreach program efforts to public schools (over 4,194 students). And staff coordinates annual county-wide bicycle commuting challenge (May of each year).
Intercity Transit continued to use biodiesel fuel of a 5 - 20% blend throughout the fleet. All buses run on ultra-low sulfur diesel. The agency meets all on-site water quality standards including recycling antifreeze, engine oil, office paper, cardboard and printer inks.
In-house Environmental and Sustainability Management Committee continued to review and analyze existing conditions, made recommendations for improving the agency’s sustainability efforts, continued to provide in-house training of agency staff, and recertified the agency to the ISO 14001:2015 Standards.
Agency staff continued to monitor and track Sustainability Commitment status for Environmental & Sustainability Policies and ISO 14001 certification of meeting those standards. Staff continued to coordinate in-house efforts for training, monitoring and improving agency-wide sustainability efforts.
On-going effort to coordinate and implement sustainability practices into a variety of transportation related programs and projects around our service
Page | 15
district and region including on-going participation with Sustainable Thurston County and Thurston Thrives activities
2017 – 2022 Continuing Effort
Continue to provide and promote ride-sharing services that help produce significant environmental benefits.
Agency core staff will continue work on Environmental and Sustainability Management Systems as a certified agency. Continue the audit and reporting process that “analyzes controls and reduces the environmental impact of the agency’s activities, products and services and to operate with greater efficiency and control.”
On-going review and consideration of better fixed route coach replacement technologies that can provide cleaner diesel engine and lower costs replacement parts than the current fleet of hybrid buses.
Intercity Transit will continue to use biodiesel and ultra-low sulfur diesel as well as test synthetic oil for diesel engines, which anticipates a cost savings in total oil consumption and improved vehicle mileage.
Continue growth of the “Walk & Roll” youth education program involving students, parents, teachers and community members to help students confidently and safely bicycle, walk, and ride transit.
Support healthy choices year-round of biking, walking and transit use, including hosting the annual Thurston County Bicycle Commuter Contest and increasing our outreach efforts at employment sites effected by state and local Commute Trip Reduction requirements.
Engage in land use and development decisions that promote higher density and facilitate safe and convenient access to public transportation.
6. STEWARDSHIP To continuously improve the quality, effectiveness, and efficiency of the transportation system.
2016 Continued Effort
Staff participated in local jurisdictional land use reviews, development of community design components (land and roads) and commented on transportation/transit integration and ADA accessibility.
Intercity Transit worked with local jurisdictions and employers to promote the use of alternative transportation modes as well as Transportation Demand Management and Commute Trip Reduction efforts.
Active in local and regional partnerships that regularly review, plan, coordinate and implement improvements to the local transportation network of roads, technology and services.
Transit staff regularly attended community business association meetings to update and provide leadership in efforts to support and improve local and regional transportation network.
Actively participated in a coordination network of human service organizations to improve mobility for those challenged by income, age and/or disabilities.
Actively participated in on-going efforts of the regional Sustainability Plan which include housing and transportation choices.

Page | 16
2017 – 2022 Continuing Effort
Intercity Transit will update a performance measurement reports that provides summaries to the public of the attributes, costs and use of the existing system services.
Staff will continue to work with and participate in community based efforts to improve transportation efficiency in both the technical and service fields.
Staff will actively participate in continuing partnerships that address transportation issues locally and regionally, including updates of local Comprehensive Plans, Joint Base Lewis McChord/I-5 impacts, Inter-change Justification Reports (I-5), and Regional Transportation Plan updates.
Staff will continue to work proactively on a range of transportation planning activities on the local and state level, in particular the projected population growth for Thurston County over the next 20 years.

Page | 17
Section 7: Summary of Proposed Changes 2017 - 2022
In addition to the efforts Intercity Transit will engage in to meet Washington State’s Transportation System Policy Goals, the following table provides a summary of proposed changes for service, facilities and equipment over the next six years:
2017 Preservation/Maintain Expansion
Services (Express) WSDOT grant funded thru 6/30/17
WSDOT Grant funds (Exp 612)
Facilities Bus stop improvements No Change
Equipment Vanpools: 33 DAL: 5
DAL: 7
2018 Preservation/Maintain Expansion
Services Exp WSDOT grant funded thru 6/30/19
No Change
Facilities Bus Stop improvements (Tumwater Sq Transfer Station)
No Change
Equipment Buses: 7 Vanpools: 38
Vanpools: 11
2019 Preservation/Maintain Expansion
Services No Change No Change
Facilities Bus Stop Improvements No Change
Equipment Buses: 10 DAL: 18 Vanpools: 30
Vanpools: 11
2020 Preservation/Maintain Expansion
Services No Change No Change
Facilities Bus Stop Improvements Facility Improvements
No Change
Equipment Vanpools: 55 DAL: 10
Vanpools: 11 DAL: 2
2021 Preservation/Maintain Expansion
Services No Change No Change
Facilities Bus Stop Improvements
No Change
Equipment Vanpools: 49 Village Vans: 2
DAL: 1 Vanpools: 11
2022 Preservation/Maintain Expansion
Services No Change No Change
Facilities Bus Stop Improvements No Change
Equipment Vanpools: 49
Vanpools: 11 DAL: 1

Page | 18
Section 8: Capital Improvement Program 2016 - 2022
VEHICLE PROJECTIONS 2016 2017 2018 2019 2020 2021 2022
Total Revenue Vehicles at Y/E 371 387 398 409 422 433 445
Fixed Routed Coaches 2016 2017 2018 2019 2020 2021 2022
Beg. Yr. # of Vehicles in Fleet 71 71 71 71 71 71 71
Replacement Cycle (Standard 15 Years) 0 0 4 4 17 0 5
Replacement Vehicles - Hybrids 0 0 0 4 17 0 5
Replacement Vehicles Conventional 0 0 4 0 0 0 0
Expansion Vehicles
From Contingency Fleet
End of Yr. Fleet Size 71 71 71 71 71 71 71
Total Actual Coach Purchases 0 0 4 4 17 0 5
Dial-A-Lift Vans 2016 2017 2018 2019 2020 2021 2022
Beg. Yr. # of Vehicles in Fleet 35 35 40 40 40 42 42
Replacement Vehicles 7 10 7
Expansion Vehicles 5 2 1
End of Yr. Fleet Size 35 40 40 40 42 42 43
Total Actual DAL Van Purchases 0 12 0 0 12 0 8
Vanpools 2016 2017 2018 2019 2020 2021 2022
Beg. Yr. # of Vehicles in Fleet 261 261 272 283 294 305 316
Replacement Vehicles 33 38 37 30 55 49 49
Expansion Vehicles 11 11 11 11 11 11
End of Yr. Fleet Size 261 272 283 294 305 316 327
Total Actual Vanpool Purchases 33 20 48 41 66 60 60
Village Vans 2016 2017 2018 2019 2020 2021 2022
Beg. Yr. # of Vehicles in Fleet 3 4 4 4 4 4 4
Replacement Vehicles 1 2
Expansion Vehicles 1
End of Yr. Fleet Size 4 4 4 4 4 4 4
Total Actual V/V Van Purchases 1 0 0 1 0 2 0
2016 2017 2018 2019 2020 2021 2022
Total Vehicles Purchased by Year 34 32 52 46 95 62 73
Vehicle Expenses
Coaches 2016 2017 2018 2019 2020 2021 2022
Vehicle Cost Inflation Rate 3.0% 3.0% 3.0% 3.0% 3.0% 3.0% 3.0%
Coach Unit Cost - Hybrid 753,162 775,757 799,030 823,001 847,691 873,121 899,315
Coach Unit Cost - Conventional 505,196 520,352 535,962 552,041 568,603 585,661 603,230
Current Year Total - Hybrid 0 0 0 3,292,002$ 14,410,741$ -$ 4,496,575$
Current Year Total - Conventional 0 0 2,143,850$ 0 0 0 0
Total Expense 0 0 2,143,850 3,292,002 14,410,741 0 4,496,575
End of Yr. Fleet Size 2016 2017 2018 2019 2020 2021 2022
Battery Unit Cost/Mid Life Rehab 300,000 300,000 300,000 300,000 300,000 300,000
Total Units Purchased 0 0 4 4 17 0 5
Total Expense 0 0 1,200,000 1,200,000 5,100,000 0 1,500,000
Page | 19
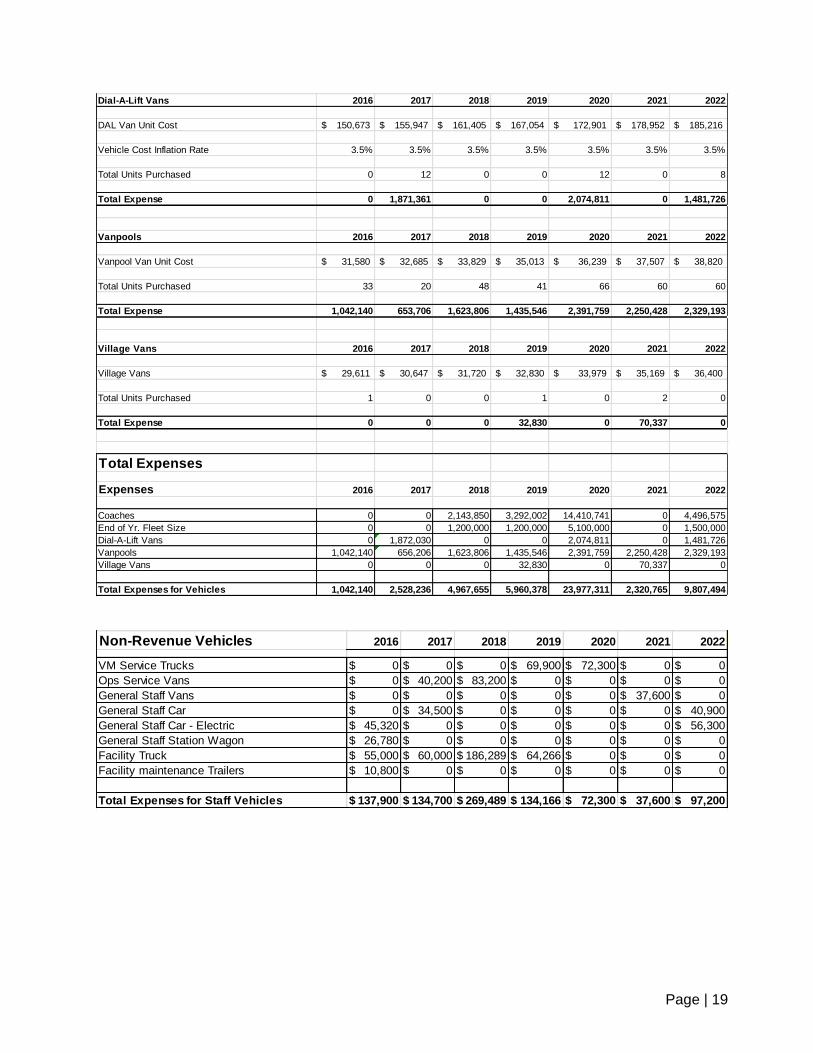
Dial-A-Lift Vans 2016 2017 2018 2019 2020 2021 2022
DAL Van Unit Cost 150,673$ 155,947$ 161,405$ 167,054$ 172,901$ 178,952$ 185,216$
Vehicle Cost Inflation Rate 3.5% 3.5% 3.5% 3.5% 3.5% 3.5% 3.5%
Total Units Purchased 0 12 0 0 12 0 8
Total Expense 0 1,871,361 0 0 2,074,811 0 1,481,726
Vanpools 2016 2017 2018 2019 2020 2021 2022
Vanpool Van Unit Cost 31,580$ 32,685$ 33,829$ 35,013$ 36,239$ 37,507$ 38,820$
Total Units Purchased 33 20 48 41 66 60 60
Total Expense 1,042,140 653,706 1,623,806 1,435,546 2,391,759 2,250,428 2,329,193
Village Vans 2016 2017 2018 2019 2020 2021 2022
Village Vans 29,611$ 30,647$ 31,720$ 32,830$ 33,979$ 35,169$ 36,400$
Total Units Purchased 1 0 0 1 0 2 0
Total Expense 0 0 0 32,830 0 70,337 0
Total Expenses
Expenses 2016 2017 2018 2019 2020 2021 2022
Coaches 0 0 2,143,850 3,292,002 14,410,741 0 4,496,575
End of Yr. Fleet Size 0 0 1,200,000 1,200,000 5,100,000 0 1,500,000
Dial-A-Lift Vans 0 1,872,030 0 0 2,074,811 0 1,481,726
Vanpools 1,042,140 656,206 1,623,806 1,435,546 2,391,759 2,250,428 2,329,193
Village Vans 0 0 0 32,830 0 70,337 0
Total Expenses for Vehicles 1,042,140 2,528,236 4,967,655 5,960,378 23,977,311 2,320,765 9,807,494
Non-Revenue Vehicles 2016 2017 2018 2019 2020 2021 2022
VM Service Trucks 0$ 0$ 0$ 69,900$ 72,300$ 0$ 0$
Ops Service Vans 0$ 40,200$ 83,200$ 0$ 0$ 0$ 0$
General Staff Vans 0$ 0$ 0$ 0$ 0$ 37,600$ 0$
General Staff Car 0$ 34,500$ 0$ 0$ 0$ 0$ 40,900$
General Staff Car - Electric 45,320$ 0$ 0$ 0$ 0$ 0$ 56,300$
General Staff Station Wagon 26,780$ 0$ 0$ 0$ 0$ 0$ 0$
Facility Truck 55,000$ 60,000$ 186,289$ 64,266$ 0$ 0$ 0$
Facility maintenance Trailers 10,800$ 0$ 0$ 0$ 0$ 0$ 0$
Total Expenses for Staff Vehicles 137,900$ 134,700$ 269,489$ 134,166$ 72,300$ 37,600$ 97,200$

Page | 20
OTHER CAPITAL AND FACILITIES-Amended
2016 2017 2018 2019 2020 2021 2022
MIS & Communication EquipmentFleetNet Replacement 500,000 1,500,000
Data Deduplication System (Single Sys/5 Yr) 60,000 60,000
Laptops - Tough Book Type (7/4YR) 10,000 10,000
Personal Computers 30,000 60,000 60,000 60,000 60,000 60,000 60,000
Phone System Replacement 150,000
Plotter (1/5 Yr) 15,000 15,000
Projector Equipment OTC conference room 5,000
Projectors-Normal replacements 5,500 5,500
ID Printer - OTC 12,000
Voice Recorder 15,000
Security Cameras (Lenel) for Buildings 250,000 300,000
Servers - High Performance (8 @ 5 yr) 70,000 70,000
Servers - Standard (10 @ 5 yr cycle) 30,000 30,000 30,000 30,000 30,000 30,000 30,000
Storage Area Network (SAN) (1/5YR) 12,000 12,000 90,000 12,000
Tremble Unit 50,000
Network HardwareEthernet Switches (14/7 YR) 10,000 75,000 10,000 10,000 10,000 10,000 10,000
Amtrak Info Sys Equipment 15,000
Firewalls (7 Yr) 36,000
Network Wiring (10 year cycle) 50,000
OTC new building network equipment 60,000
Wireless access point replacement 5,000 5,000
SoftwareACS Orbital/Radio System Replacement 5,500,000
Analytical Software Used by Development
Adobe Software Upgrades 10,000 10,000
Antivirus Software Upgrades 6,000 6,000
Backup Software 55,000
FleetNet Additional Moduals 15,000
FleetWatch
Microsoft Server Software Upgades/Repl. 130,000
Office Upgrades (130/5yrs) 120,000 120,000
POS system updates - VP in 2014 and OTC in 2018 60,000
Routematch Replacement
SharePoint Maintenance/Upgrades 60,000
TMS Replacement 100,000
VMWare Software (8 Units/5 Yrs) 25,000 25,000
Windows OS replacement (PC Operating Systems) 55,000 35,000
Total $765,500 $5,932,000 $873,000 $1,605,000 $287,500 $557,000 $447,000

Page | 21
Facilities 2016 2017 2018 2019 2020 2021 2022
Air Compressors (2)
Amtrak HVAC Replacement 30,000
Amtrak Barrel Tile Roof Replacement 110,000
Amtrak Carpet 4,000
Amtrak Fire/Security Alarm Replacement 25,000
Amtrak Floor Tile Replacement 30,000
Amtrak Gate Opener 25,000
Amtrak Landscaping (drought tolerant) 25,000
Amtrak Seal Coat/Repairs 36,000
Catwalk Around Heat Recovery Units
Exterior Painting LTC, OTC Amtrak 125,000
Hawks Prairie Seal Coat 32,000
Interior Paint Amtrak 10,000
Interior Painting Pattison (10 yrs) 280,000
Lighting Upgrade - Main Fac
LTC Interior Painting (10 yrs)
LTC Landscaping (drought tolerant) 25,000
LTC Roof Replacement
Martin Way P&R Seal Coat (7 yrs) 30,000
OPS Dispatch Repairs/Upgrads 40,000
OTC Carpet Replacement 10,000
OTC Fire/Security Alarm Replacement
OTC HVAC # 16- 16a Replacement 12,000
OTC HVAC #15 Replacement 15,000
OTC HVAC Replacement 50,000
OTC Interior Painting
OTC New Office Bldg Exterior Painting 50,000
OTC New Office Bldg Interior Painting
OTC Tile Replacement 8,000
Pattison Phase
Pattison Facility Final Design 4,100,000
Pattison Facility Rehabilitation Projects 27,463,203 -
Pattison UST Tank Replacement/Site Enviro Review 8,005,000
Pattison Bus Air Shears / Blowers 100,000
Pattison Concrete Slab Replacement
Pattison Electrical Upgrades 1,500,000
Includes Pattison Generator Engineering
Pattison Fencing/security/gate openers 150,000
Pattison Fire/Security Alarm Replacement
(not part of larger project) 25,000 100,000
Pattison HVAC #1 thru #8a Replacement 125,000
Pattison HVAC #9-9a Replacement 12,000
Pattison HVAC Engineering 20,000 9,000
Pattison Boiler, Controls, HRU's
(not part of larger project) 400,000
Pattison Tire Bay Mezz w/stairs 200,000
Pattison Office Window Replacement 100,000
Replace Roof - Pattison, Both Facilities 412,000
Glass Block and Soffit Replacement
(both Pattison facilities) 400,000
Grout Seal Pattison Bus Lot
Pattison Exterior Painting 200,000
Pattison Additional Fall Protection in bays 75,000
Pattison Auto Bay Lift Replacements 200,000
Pattison Carpet Replacement 75,000
Pattison Chassis Wash Lift Replacement
Pattison ECO Lift (5 Bays) Replacement
Pattison Landscaping (drought tolerant) 30,000
Pattison Rubber Flooring Replacement 30,000
Pattison Server HVAC #17-18 Replacement 40,000
Pattison Trash Compactor 15,000
Pattison Maintenance Lift/Cover Pit 200,000
Replace OTC Roof 210,000
Seal Coat Pattison Parking Lot 18,000
Facilities Total $9,035,000 $5,603,000 $601,000 $29,423,203 $240,000 $95,000 $189,000
Intelligent Transportation Systems Projects 2016 2017 2018 2019 2020 2021 2022
Expansion
Signal Priority Project 150,000 200,000
Replacement
Advanced Communications Systems
Fare boxes/Smartcards 1,500,000
Total - 1,500,000 150,000 - - 200,000 -

Page | 22
Shop Equipment 2016 2017 2018 2019 2020 2021 2022
Replace Two Bus Washers
Hotsy Parts Washer 15,000
Tire Machine 25,000
Spin Balancer 25,000
Bead Blaster 10,000
Articulated Boom Lift 55,000
Total $40,000 $0 $65,000 $25,000 $0 $0 $0
Facilities & Land 2016 2017 2018 2019 2020 2021 2022
Bus Stop Improvements Facilities (2016 = Solar Lights) 45,000 150,000 100,000 100,000 100,000 100,000 100,000
Bus Stop Improvements - Planning 35,000
OTC Expansion 8,492,282
Pattison Street Phase I
Pattison Street Phase II
Pattison Street Phase III
Pattison Street Preliminary Engineering/Construction
Total $8,572,282 $150,000 $100,000 $100,000 $100,000 $100,000 $100,000
Transit Centers & Park and Rides 2016 2017 2018 2019 2020 2021 2022
Tumwater Park and Ride 500,000
Hawkes Prarie Park and Ride 2,500
Yelm Park and Ride 1,500,000
Total 2,500 - - - - - 2,000,000
TOTAL OTHER CAPITAL COSTS $18,415,282 $13,185,000 $1,789,000 $31,153,203 $627,500 $952,000 $2,736,000

Page | 23
Section 9: Operating Revenues 2016 - 2022
WSDOT Report - 2016 General Working
Fund Capital Total
Beginning Cash Balance January 1, 2016 $32,906,113 $9,801,658 $42,707,771
Revenues
Sales Tax 36,811,767 36,811,767
Motor Vehicle Excise Tax -
Farebox 4,643,004 4,643,004
Sales Tax Equalization
Federal Operating Grants 198,467 198,467
State Operating Grants 1,849,043 1,849,043
Other 8,178 8,178
Contribution To Accounts (200,302) 200,302 -
Total Available 76,216,269 $10,001,960 $86,218,229
Operating Expenses
Vanpool/Rideshare P&M 1,644,628 1,644,628
Vanpool/Rideshare System Expansion - -
Fixed Route P&M 21,937,424 21,937,424
Fixed Route System Expansion -
Commuter Bus P&M 2,988,299 2,988,299
Commuter Bus System Expansion
Paratransit ADA P&M 8,621,062 8,621,062
Paratransit ADA System Expansion - -
Rideshare/CTR P&M - -
Amtrak Station P&M 51,571 51,571
Annual Depreciation 5,176,572 5,176,572
Contribution To Accounts -
Total Expenses 40,419,556 - $40,419,556
Add Back Depreciation 5,176,572 5,176,572
Net Cash Available 40,973,285 $40,973,285
Capital
Capital Revenue
Federal Capital Grant - Sec 5307
Federal Capital Grant - Sec 5309 166,078 166,078
State/Local Capital Grants 702,350 702,350
Total Capital Revenue 868,428 - $868,428
Capital Expenses
System P&M
Equipment & Furnishings 351,538 351,538
Replace Coaches - -
Replace Shuttle Vans/Small Coaches -
Replace DAL Vans - -
Replace Vanpool Vans - 1,173,790 1,173,790
Replace Staff Vehicles 54,445 54,445
Facilities 34,567 34,567
System Expansion -
Coach - -
Shuttle Van - Small Coach -
DAL Van -
Vanpool Van 1,173,790
UST 481,627
OTC 6,848
Facilities -
Total Capital Expenses 2,102,815 $2,102,815
Ending Cash Balance December 31, 2016 39,738,898 $10,001,960 $49,740,858

Page | 24
WSDOT Report - 2017 General Working
Fund Capital Total
Beginning Balance January 1, 2017 $39,738,898 $10,001,960 $49,740,858
Revenues
Sales Tax 37,916,120 37,916,120
Motor Vehicle Excise Tax -
Farebox 4,615,907 4,615,907
Sales Tax Equalization
Federal Operating Grants 523,000 523,000
State Operating Grants 760,238 760,238
Other 1,228,962 1,228,962
Contribution To Accounts 116,221 (116,221) -
Total Available $84,899,346 $9,885,739 $94,785,085
Operating Expenses
Vanpool/Rideshare P&M 1,625,519 1,625,519
Vanpool/Rideshare System Expansion 67,503 67,503
Fixed Route P&M 26,324,488 26,324,488
Fixed Route System Expansion -
Commuter Bus P&M 2,953,578 2,953,578
Commuter Bus System Expansion
Paratransit ADA P&M 8,520,894 8,520,894
Paratransit ADA System Expansion - -
Rideshare/CTR P&M - -
Amtrak Station P&M 50,972 50,972
Annual Depreciation 5,331,869 5,331,869
Contribution To Accounts -
Total Expenses $44,874,824 - $44,874,824
Add Back Depreciation 5,331,869 5,331,869
Net Cash Available $45,356,391 $45,356,391
Capital
Capital Revenue
Federal Capital Grant - Sec 5307
Federal Capital Grant - Sec 5309 1,272,118 1,272,118
State Capital Grants 75,000 75,000
Total Capital Revenue $1,347,118 - $1,347,118
Capital Expenses
System P&M
Equipment & Furnishings 5,932,000 5,932,000
Replace Coaches - 1,800,000 1,800,000
Replace Shuttle Vans/Small Coaches -
Replace DAL Vans - 1,092,296 311,893
Replace Vanpool Vans - 656,206 155,947
Replace Staff Vehicles 134,700 134,700
Facilities 5,753,000 5,753,000
Farebox replacement 1,500,000 1,500,000
System Expansion -
Coach - -
Shuttle Van - Small Coach -
DAL Van
Vanpool Van
Facilities -
Total Capital Expenses $16,868,202 $16,868,202
Ending Balance December 31, 2017 $29,835,307 $9,885,739 $39,721,046
Page | 25
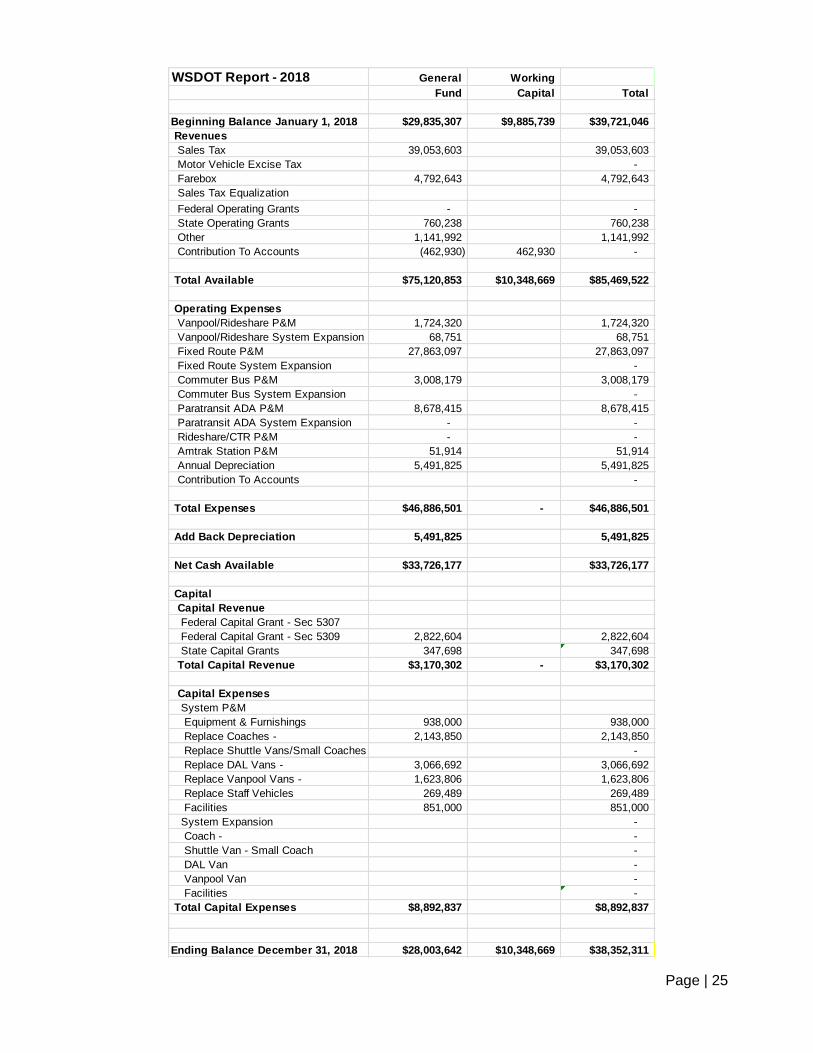
WSDOT Report - 2018 General Working
Fund Capital Total
Beginning Balance January 1, 2018 $29,835,307 $9,885,739 $39,721,046
Revenues
Sales Tax 39,053,603 39,053,603
Motor Vehicle Excise Tax -
Farebox 4,792,643 4,792,643
Sales Tax Equalization
Federal Operating Grants - -
State Operating Grants 760,238 760,238
Other 1,141,992 1,141,992
Contribution To Accounts (462,930) 462,930 -
Total Available $75,120,853 $10,348,669 $85,469,522
Operating Expenses
Vanpool/Rideshare P&M 1,724,320 1,724,320
Vanpool/Rideshare System Expansion 68,751 68,751
Fixed Route P&M 27,863,097 27,863,097
Fixed Route System Expansion -
Commuter Bus P&M 3,008,179 3,008,179
Commuter Bus System Expansion -
Paratransit ADA P&M 8,678,415 8,678,415
Paratransit ADA System Expansion - -
Rideshare/CTR P&M - -
Amtrak Station P&M 51,914 51,914
Annual Depreciation 5,491,825 5,491,825
Contribution To Accounts -
Total Expenses $46,886,501 - $46,886,501
Add Back Depreciation 5,491,825 5,491,825
Net Cash Available $33,726,177 $33,726,177
Capital
Capital Revenue
Federal Capital Grant - Sec 5307
Federal Capital Grant - Sec 5309 2,822,604 2,822,604
State Capital Grants 347,698 347,698
Total Capital Revenue $3,170,302 - $3,170,302
Capital Expenses
System P&M
Equipment & Furnishings 938,000 938,000
Replace Coaches - 2,143,850 2,143,850
Replace Shuttle Vans/Small Coaches -
Replace DAL Vans - 3,066,692 3,066,692
Replace Vanpool Vans - 1,623,806 1,623,806
Replace Staff Vehicles 269,489 269,489
Facilities 851,000 851,000
System Expansion -
Coach - -
Shuttle Van - Small Coach -
DAL Van -
Vanpool Van -
Facilities -
Total Capital Expenses $8,892,837 $8,892,837
Ending Balance December 31, 2018 $28,003,642 $10,348,669 $38,352,311

Page | 26
WSDOT Report - 2019 General Working
Fund Capital Total
Beginning Balance January 1, 2019 $28,003,642 $10,348,669 $38,352,311
Revenues
Sales Tax 40,225,211 40,225,211
Motor Vehicle Excise Tax -
Farebox 4,973,286 4,973,286
Sales Tax Equalization
Federal Operating Grants - -
State Operating Grants 760,238 760,238
Other 1,141,998 1,141,998
Contribution To Accounts (482,128) 482,128 -
Total Available 74,622,247 10,830,797 $85,453,044
Operating Expenses
Vanpool/Rideshare P&M 1,824,737 1,824,737
Vanpool/Rideshare System Expansion 69,965 69,965
Fixed Route P&M 29,482,677 29,482,677
Fixed Route System Expansion -
Commuter Bus P&M 3,061,303 3,061,303
Commuter Bus System Expansion
Paratransit ADA P&M 8,831,674 8,831,674
Paratransit ADA System Expansion - -
Rideshare/CTR P&M - -
Amtrak Station P&M 52,831 52,831
Annual Depreciation 5,656,580 5,656,580
Contribution To Accounts -
Total Expenses $48,979,767 - $48,979,767
Add Back Depreciation 5,656,580 5,656,580
Net Cash Available $31,299,060 $31,299,060
Capital
Capital Revenue
Federal Capital Grant - Sec 5307
Federal Capital Grant - Sec 5309 25,614,482 25,614,482
State Capital Grants 358,117 358,117
Total Capital Revenue $25,972,599 - $25,972,599
Capital Expenses
System P&M
Equipment & Furnishings 1,630,000 1,630,000
Replace Coaches - 5,392,002 5,392,002
Replace Shuttle Vans/Small Coaches -
Replace DAL Vans - -
Replace Vanpool Vans - 1,435,546 1,435,546
Replace Village Vans - 32,830 32,830
Replace Staff Vehicles 134,166 134,166
Facilities 29,523,203 29,523,203
System Expansion -
Coach - -
Shuttle Van - Small Coach -
DAL Van -
Vanpool Van -
Facilities -
Total Capital Expenses $38,147,747 $38,147,747
Ending Balance December 31, 2019 $19,123,912 $10,830,797 $29,954,709
Page | 27
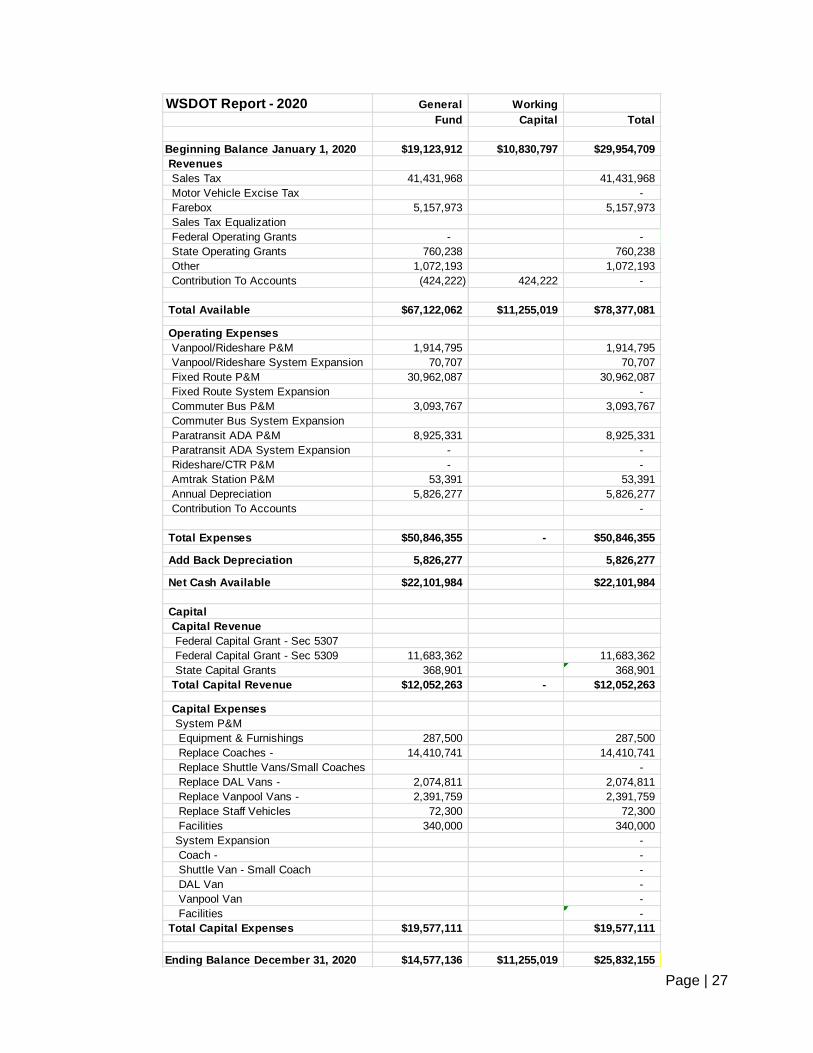
WSDOT Report - 2020 General Working
Fund Capital Total
Beginning Balance January 1, 2020 $19,123,912 $10,830,797 $29,954,709
Revenues
Sales Tax 41,431,968 41,431,968
Motor Vehicle Excise Tax -
Farebox 5,157,973 5,157,973
Sales Tax Equalization
Federal Operating Grants - -
State Operating Grants 760,238 760,238
Other 1,072,193 1,072,193
Contribution To Accounts (424,222) 424,222 -
Total Available $67,122,062 $11,255,019 $78,377,081
Operating Expenses
Vanpool/Rideshare P&M 1,914,795 1,914,795
Vanpool/Rideshare System Expansion 70,707 70,707
Fixed Route P&M 30,962,087 30,962,087
Fixed Route System Expansion -
Commuter Bus P&M 3,093,767 3,093,767
Commuter Bus System Expansion
Paratransit ADA P&M 8,925,331 8,925,331
Paratransit ADA System Expansion - -
Rideshare/CTR P&M - -
Amtrak Station P&M 53,391 53,391
Annual Depreciation 5,826,277 5,826,277
Contribution To Accounts -
Total Expenses $50,846,355 - $50,846,355
Add Back Depreciation 5,826,277 5,826,277
Net Cash Available $22,101,984 $22,101,984
Capital
Capital Revenue
Federal Capital Grant - Sec 5307
Federal Capital Grant - Sec 5309 11,683,362 11,683,362
State Capital Grants 368,901 368,901
Total Capital Revenue $12,052,263 - $12,052,263
Capital Expenses
System P&M
Equipment & Furnishings 287,500 287,500
Replace Coaches - 14,410,741 14,410,741
Replace Shuttle Vans/Small Coaches -
Replace DAL Vans - 2,074,811 2,074,811
Replace Vanpool Vans - 2,391,759 2,391,759
Replace Staff Vehicles 72,300 72,300
Facilities 340,000 340,000
System Expansion -
Coach - -
Shuttle Van - Small Coach -
DAL Van -
Vanpool Van -
Facilities -
Total Capital Expenses $19,577,111 $19,577,111
Ending Balance December 31, 2020 $14,577,136 $11,255,019 $25,832,155
Page | 28
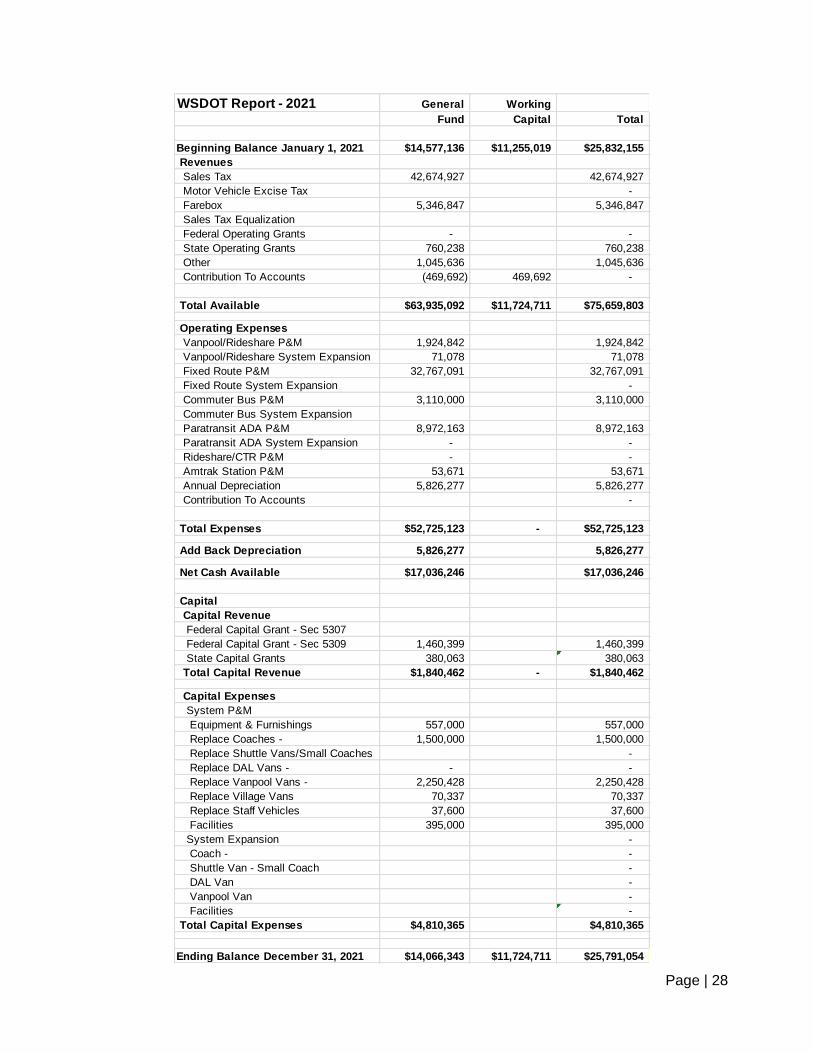
WSDOT Report - 2021 General Working
Fund Capital Total
Beginning Balance January 1, 2021 $14,577,136 $11,255,019 $25,832,155
Revenues
Sales Tax 42,674,927 42,674,927
Motor Vehicle Excise Tax -
Farebox 5,346,847 5,346,847
Sales Tax Equalization
Federal Operating Grants - -
State Operating Grants 760,238 760,238
Other 1,045,636 1,045,636
Contribution To Accounts (469,692) 469,692 -
Total Available $63,935,092 $11,724,711 $75,659,803
Operating Expenses
Vanpool/Rideshare P&M 1,924,842 1,924,842
Vanpool/Rideshare System Expansion 71,078 71,078
Fixed Route P&M 32,767,091 32,767,091
Fixed Route System Expansion -
Commuter Bus P&M 3,110,000 3,110,000
Commuter Bus System Expansion
Paratransit ADA P&M 8,972,163 8,972,163
Paratransit ADA System Expansion - -
Rideshare/CTR P&M - -
Amtrak Station P&M 53,671 53,671
Annual Depreciation 5,826,277 5,826,277
Contribution To Accounts -
Total Expenses $52,725,123 - $52,725,123
Add Back Depreciation 5,826,277 5,826,277
Net Cash Available $17,036,246 $17,036,246
Capital
Capital Revenue
Federal Capital Grant - Sec 5307
Federal Capital Grant - Sec 5309 1,460,399 1,460,399
State Capital Grants 380,063 380,063
Total Capital Revenue $1,840,462 - $1,840,462
Capital Expenses
System P&M
Equipment & Furnishings 557,000 557,000
Replace Coaches - 1,500,000 1,500,000
Replace Shuttle Vans/Small Coaches -
Replace DAL Vans - - -
Replace Vanpool Vans - 2,250,428 2,250,428
Replace Village Vans 70,337 70,337
Replace Staff Vehicles 37,600 37,600
Facilities 395,000 395,000
System Expansion -
Coach - -
Shuttle Van - Small Coach -
DAL Van -
Vanpool Van -
Facilities -
Total Capital Expenses $4,810,365 $4,810,365
Ending Balance December 31, 2021 $14,066,343 $11,724,711 $25,791,054

Page | 29
WSDOT Report - 2022 General Working
Fund Capital Total
Beginning Balance January 1 $14,066,343 $11,724,711 $25,791,054
Revenues
Sales Tax 43,955,175 43,955,175
Motor Vehicle Excise Tax -
Farebox 5,540,052 5,540,052
Sales Tax Equalization
Federal Operating Grants - -
State Operating Grants 760,238 760,238
Other 1,060,406 1,060,406
Contribution To Accounts (496,863) 496,863 -
Total Available 64,885,351 $12,221,574 $77,106,925
Operating Expenses
Vanpool/Rideshare P&M 2,113,598 2,113,598
Vanpool/Rideshare System Expansion 75,269 75,269
Fixed Route P&M 33,846,078 33,846,078
Fixed Route System Expansion -
Commuter Bus P&M 3,293,362 3,293,362
Commuter Bus System Expansion
Paratransit ADA P&M 9,501,152 9,501,152
Paratransit ADA System Expansion - -
Rideshare/CTR P&M - -
Amtrak Station P&M 56,836 56,836
Annual Depreciation 6,001,066 6,001,066
Contribution To Accounts -
Total Expenses $54,887,360 - $54,887,360
Add Back Depreciation 6,001,066 6,001,066
Net Cash Available $15,999,057 $15,999,057
Capital
Capital Revenue
Federal Capital Grant - Sec 5307
Federal Capital Grant - Sec 5309 5,105,119 5,105,119
State Capital Grants 391,615 391,615
Total Capital Revenue $5,496,734 - $5,496,734
Capital Expenses
System P&M
Equipment & Furnishings 447,000 447,000
Replace Coaches - 5,996,575 5,996,575
Replace Shuttle Vans/Small Coaches -
Replace DAL Vans - 1,481,726 1,481,726
Replace Vanpool Vans - 2,329,193 2,329,193
Replace Staff Vehicles 97,200 97,200
Facilities 2,289,000 2,289,000
System Expansion -
Coach - -
Shuttle Van - Small Coach -
DAL Van -
Vanpool Van -
Facilities -
Total Capital Expenses $12,640,694 $12,640,694
Ending Balance December 31 $8,855,097 $12,221,574 $21,076,671
Page | 30
Appendices
Appendix A: Organizational Chart
Appendix B: System Map and Service Boundary Map
Appendix C: Operating Data
Page | 31
Appendix A

Page | 32
Appendix B

Page | 33
Bus Service in 2016 Fixed route service available weekdays on 25 routes, 18 routes operating Saturdays, 15 routes on Sundays. Dial-A-Lift (ADA/paratransit) service available during fixed route service hours. Bus fleet is ADA accessible and all fixed route coaches have two-position bike racks:
Twenty local routes serving the greater Olympia/Lacey/Tumwater/Yelm area. Connections to Grays Harbor Transit and Mason Transit service (in Olympia) and regional connections to Amtrak and Greyhound service are also available.
Five inter-county routes provide Express service between Thurston and Pierce Counties with connections to Pierce Transit local service and Sound Transit Express and commuter service in Lakewood and Tacoma. Grant funded contract with Sound Transit for extension of existing route for limited peak trips between Olympia and DuPont with service to Seattle.
Intercity Transit Service Boundary
Approved April 2002, Implemented September 2002, Updated with City Annexations: 2005 – 2016

Page | 34
Appendix C
Operating Data
2016 Summary of Fixed Route Services
* WSDOT “Regional Mobility Grant:” funded through June 2017.
Headways Revenue Service Hours Revenue Service Miles
Weekday
Route Peak Mid Night Sat Sun Wkdy Sat Sun Wkdy Sat Sun
12-W. Tumwater 30 60 60 60 60 6532 754 641 90,931 10,383 9,007
13-E. Tumwater 15 15 60 60 60 13,419 663 622 150,477 7902 7,193
21-N. Bethel 30 60 60 60 2,603 309 315 33,331 3,943 4,018
41-TESC 15 30 30 30 30 10,257 1,611 1,257 130,838 20,400 15,957
42-Family Court 30 30 1,792 19,584
43-SPSCC/Tumwater 30 30 60 6,874 554 86,528 7,229
44-SPSCC/Cap. Mall 30 30 30 30 60 8,166 1,422 648 102,426 17,888 8,100
45-Conger/Cap. Mall 30 60 60 3,797 607 38,118 5,364
47-Capital Mall/CMC 30 30 60 60 6,959 614 625 62,373 5,523 5,627
48-Capital Mall/TESC 30 30 30 30 7,851 1,422 105,549 19,032
49-Capital Mall 30 612 6,334
60-Lilly/Panorama 30 60 60 60 7,211 905 887 73,062 9,439 9,266
62A-Martin/Meridian 30 30 60 30 60 11,085 1,661 975 135,117 20,553 13,268
62B-Martin/Meadows 30 30 60 30 60 11,968 1,903 967 151,603 24,433 13,608
64-College/Amtrak 30 60 60 60 10,752 1,313 1,234 122,394 14,904 13,964
66-Ruddell 30 30 60 30 30 12,032 2,121 1,921 152,858 27,147 24,273
67-Tri-Lakes 60 60 60 3,435 570 52,224 8,803
68-Carpenter/Yelm Hwy 30 60 60 60 10,176 1,259 1,283 160,102 19,398 19,764
94-Yelm 30/ 60
30/ 60
60/ 75
135 11,354 1,274 695 211,584 26,166 14,375
101-Dash 12/ 15
12/ 15
10 6,050 364 50,366 2,650
411-Nightline 60 60 60 126 126 99 1,734 1,734 1,336
* ST592-Oly/DuPont (Sea)
6 AM/ 6 PM
2,022 50,363
603-Olympia/Tacoma 30 90 6,336 146,227
605-Olympia/Tacoma 30 90 6,357 151,552
* 609-Tumwater/Lakewood
30 90 6,123 173,414
612-Lacey/Tacoma 1 AM/ 1 PM
674 16,282
620-Oly/Tacoma Mall 60/ 90
60/ 90 1,162 1,183 28,906 29,452
System Totals 173,950 20,614 13,964 2,468,283 281,796 195,542
2015 Totals 208,528 2,945,621

Page | 35
2016 Route Service Summary
Performance Standard
Route
Total Boardings
Revenue Hours
Board / Hour
Rating
Comments
Trunk Routes
13-E. Tumwater 330,144 14,704 22.5 Marginal
41-TESC 449,604 13,125 34.3 Satisfactory
44-SPSCC/Cap. Mall 243,355 10,236 23.8 Marginal
48-Capital Mall/TESC 323,965 9,273 34.9 Satisfactory Runs weekday & Saturday.
49-Capital Mall 22,326 612 36.5 Satisfactory Runs Sunday only.
62A-Martin/Meridian 383,483 13,720 28.0 Satisfactory
62B-Martin/Meadows 364,668 14,838 24.6 Marginal
66-Ruddell 332,702 16,074 20.7 Marginal
Secondary Routes
12-W. Tumwater 135,516 7,927 17.1 Satisfactory
21-N. Bethel 76,138 3,227 23.6 Satisfactory
43-Barnes Blvd 168,602 7,428 22.7 Satisfactory Runs weekday & Saturday.
45-Conger/Cap. Mall 49,206 4,404 11.2 Marginal Runs weekday & Saturday.
47-Capital Mall/CMC 186,088 8,198 22.7 Satisfactory
60-Lilly/Panorama 130,235 9,003 14.5 Marginal
64-College/Amtrak 207,939 13,299 15.6 Satisfactory
67-Tri Lake 33,138 4,004 8.3 Unsatisfactory
68-Carpenter/Yelm Hwy 217,882 12,717 17.1 Satisfactory
94-Yelm 193,244 13,322 14.5 Marginal
Specialized & Shuttle Routes
42-Family Court 11,087 1,792 6.2 Unsatisfactory Limited service. Runs only weekdays
during AM/Noon/PM peak.
101-Dash 77,277 6,414 12.0 Satisfactory Productivity: Session 13.0, Non-session 11.5, Saturdays 11.6
411-Nightline 6,744 352 19.2 Satisfactory Operates Fri/Sat/Sun late night during
academic year (under contract).
Express Routes Per Trip
603-Olympia/Tacoma 50,793 6,336 11.7 Marginal Runs Weekdays only.
605-Olympia/Tacoma 66,975 6,357 14.5 Marginal Runs Weekdays only.
609-Tumwater/Lkwd 26,562 6,123 4.9 Unsatisfactory Runs Weekdays only. Grant-funded.
612-Lacey/Tacoma 6,460 674 12.6 Marginal Runs Weekdays only.
620-Oly/Tacoma Mall 19,666 2,345 10.2 Marginal Runs Sat/Sun only.
ST 592-Oly/DuPont (Sea) 19,340 2,022 6.3 Unsatisfactory Runs Weekdays: Grant/ST Operated
EXPRESS TOTALS 189,796 23,875 7.9
Fixed Route Totals 4,133,139 208,528 19.8 Change from 2015: Boardings decreased 4.0%, Hours up 0.1%, Boardings per Hour down 4.3%.
Other Intercity Transit Services
Dial-A-Lift Service 166,213 -- -- 2.9% increase from 2015
Vanpools 600,148 -- -- 12.4% decrease from 2015
System Total 4,899,500 4.9% decrease from 2015’s 5,153,288 Boardings.
Standard Trunk Primary Secondary Rural Commuter Express
Riders per Hour Riders per Trip
Exceeds standard >40 >30 >25 >20 25 or more 25 or more
Satisfactory 25-40 20-30 15-25 12-20 15.0 to 24.9 15.0 to 24.9
Marginal 20-24 15-19 10-14 9-11 10.0 to 14.9 10.0 to 14.9
Unsatisfactory <20 <15 <10 <9 Less than 10 Less than 10

Page | 36
2016 Vehicle Assignment Analysis
Route
High Load*
Interlined Routes
Vehicle Assigned
Comments
Trunk Routes
13-E. Tumwater 57 12,41,45,64,66 Large Bus Runs Mon-Sun.
41-TESC 66 13 Large Bus Runs Mon-Sun.
44-SPSCC/Cap. Mall 65 62A, 62B Large Bus Runs Mon-Sun.
48-Capital Mall/TESC 62 66, 94 Large Bus Runs Mon-Sat.
49-Capital Mall 50 66 Large Bus Runs Sunday.
62A-Martin/Meridian 52 43, 44, 62B Large Bus Runs Mon-Sun.
62B-Martin/Meadows 47 43, 44, 62A Large Bus Runs Mon-Sun.
66-Ruddell Road 46 13, 48, 49 Large Bus Runs Mon-Sun.
Secondary Routes
12-W. Tumwater 51 13, 45, 64 Medium Bus Runs Mon-Sun.
21-N. Bethel 41 47, 60 Small Bus Runs Mon-Sun.
43-SPSCC/Barnes 53 62A, 62B Large Bus Runs Mon-Sat.
45-Conger/Cap. Mall 39 12, 13 Medium Bus Runs Mon-Sat.
47-Capital Mall/CMC 46 21, 68 Medium Bus Runs Mon-Sun.
60-Lilly/Panorama 49 21, 47 Small Bus Runs Mon-Sun.
64-College/Amtrak 43 12, 13 Medium Bus Runs Mon-Sun.
67-Tri Lake 43 None Small Bus Runs Mon-Sat.
68-Carpenter/Yelm Hwy 54 47 Medium Bus Runs Mon-Sun.
94-Yelm 56 48 Large Bus Runs Mon-Sun.
Specialized & Shuttle Routes
42-Family Court 39 None Small Bus Runs weekdays during commute hours and noon period.
101-Dash 38 None Small Bus Weekdays: Runs all year. Saturdays: Runs Apr-Sep.
411-Nightline 61 None Large Bus Runs Fri/Sat/Sun late night during TESC class quarters, by contract.
Express Routes
603-Olympia/Tacoma 54 605 Large Bus Runs weekdays only.
605-Olympia/Tacoma 63 603, 612 Large Bus Runs weekdays only.
609-Tumwater/Lkwd 38 None Large Bus Runs weekdays only.
612-Lacey/Tacoma 38 605 Large Bus Runs weekdays only.
620-Oly/Tacoma Mall 51 None Large Bus Runs weekends only.
* High Load: Based on APC date provides highest passenger load by route during 2015 (not average trip load).
** Recommended Vehicle Assignment: Large Bus: Low Floor 40’ - Seating Capacity: 38 Medium Bus: Low Floor 35’ - Seating Capacity: 32 Small Bus: Low Floor 30’ - Seating Capacity Av: 23


