
U. S. DEPARTMENT OF AGRICULTURE
WILDLIFE SERVICES
U. S. DEPARTMENT
OF TRANSPORTATION FEDERAL AVIATION ADMINISTRATION
2018: The “Year of the Bird” Marking the Centennial of The
Migratory Bird Treaty Act of 1918
Safer Skies for All Who Fly: Aircraft and Birds

Wildlife Strikes to Civil Aircraft in the United States, 1990–2018
Wildlife Strikes to Civil Aircraft in the United States, 1990–2018
i
The U.S. Departments of Transportation and Agriculture prohibit discrimination in all their programs and activities on the basis of race, color, national origin, gender, religion, age, disability, political beliefs, sexual orientation, or marital or family status (not all prohibited bases apply to all programs). Persons with disabilities who require alternative means for communication of program information (Braille, large print, audiotape, etc.) should contact the appropriate agency.
The Federal Aviation Administration produced this report in cooperation with the U. S. Department of Agriculture, Wildlife Services, under an interagency agreement (DTFACT-14-X-00007). The purpose of this agreement is to 1) document wildlife strikes to civil aviation through management of the FAA National Wildlife Strike Database and 2) research, evaluate, and communicate the effectiveness of various habitat management and wildlife control techniques for minimizing wildlife strikes with aircraft at and away from airports. These activities provide a scientific basis for FAA policies, regulatory decisions, and recommendations regarding airport safety and wildlife.
Wildlife Strikes to Civil Aircraft in the United States, 1990–2018
ii
AUTHORS
Richard A. Dolbeer, Science Advisor, Airport Wildlife Hazards Program, U.S. Department of Agriculture, Wildlife Services, 6100 Columbus Ave., Sandusky, OH 44870
Michael J. Begier, National Coordinator, Airport Wildlife Hazards Program, U.S. Department of Agriculture, Wildlife Services, 1400 Independence Ave., SW, Washington, DC 20250
Phyllis R. Miller, Scientific Data Technician, Airport Wildlife Hazards Program, U.S. Department of Agriculture, Wildlife Services, 6100 Columbus Ave., Sandusky, OH 44870
John R. Weller, National Wildlife Biologist, Office of Airport Safety and Standards, Federal Aviation Administration, 800 Independence Ave., SE, Washington, DC 20591 Amy L. Anderson, National Wildlife Biologist, Office of Airport Safety and Standards, Federal Aviation Administration, 800 Independence Ave., SE, Washington, DC 20591

Wildlife Strikes to Civil Aircraft in the United States, 1990–2018
iii
COVER PAGE
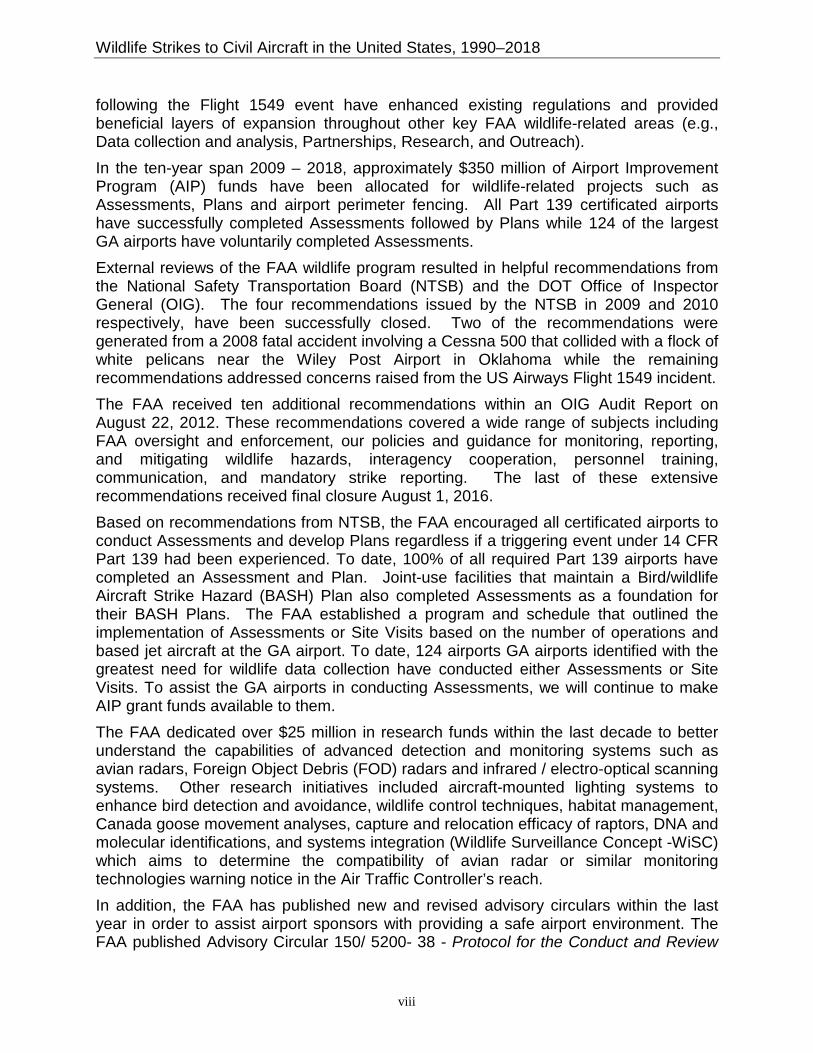
Migratory birds do not recognize geo-political boundaries during their annual cycle of reproduction, foraging, and migration. Thus, successful conservation efforts to protect birds must be carried out at the international level. In 1918, the USA and Great Britain (on behalf of Canada) signed a convention to protect migratory birds in North America, the Migratory Bird Treaty Act (MBTA). This landmark treaty was implemented in an era when many bird species were threatened by the commercial trade in birds and bird feathers. As a notable example, the last passenger pigeon died in 1914 in the Cincinnati, Ohio Zoo. This was a species whose numbers reached into the billions in the mid-19th century and often darkened the skies of Eastern and Midwestern North America during migration. Market hunting and habitat destruction doomed passenger pigeons, Carolina parakeets, and ivory-billed woodpeckers to extinction and brought many other species to the brink of extinction. The MBTA has been hailed by biologists and politicians alike as the most influential legislation ever enacted to protect birds, and it has served as a model for nations worldwide. The MBTA now includes Mexico, Russia and Japan as signatories and protects over 1,000 species of birds that migrate among the five countries. With the MBTA as a foundation for various laws and policies subsequently enacted to protect the environment, there has been a resurgence in populations of most large bird species in North America. This resurgence, while a positive reflection on environment conditions, creates conflicts with aviation safety. The National Wildlife Strike Database provides the scientific foundation for policies and management programs to mitigate the risk of bird strikes in ways compliant with the MBTA and other environmental laws.
The nesting population of bald eagles in the contiguous USA increased from 500 nesting pairs in 1963 to over 17,000 pairs in 2018. The total population of bald eagles in North America is now over 200,000 birds (Rosenberg et al. 2016). In 2018, 21 bald eagle strikes with civil aircraft (9 with damage) were reported. Graph by R. A. Dolbeer with data for 1963-2006 from U.S. Fish and Wildlife Service (2019a) and for 2018 from state wildlife agency websites.
0
3000
6000
9000
12000
15000
18000
1960 1970 1980 1990 2000 2010 2020
Bald eagle nests, contiguous USA
Wildlife Strikes to Civil Aircraft in the United States, 1990–2018
iv
ACKNOWLEDGMENTS
The National Wildlife Strike Database (NWSD) office acknowledges the many people who took the time and effort to report the 214,048 wildlife strikes summarized in this report – pilots, mechanics, control tower and airport operations personnel, airline flight safety officers, airport wildlife biologists, and many others. We recognize Jenny Washburn, Jason Kougher, Mahalah Schank, Jay Garshaw (USDA) for their efforts in entering data over the past year. We acknowledge John Weller and Amy Anderson, National Wildlife Biologists for the Federal Aviation Administration (FAA) along with Michael DiPilato (FAA) for their leadership and technical advice. Heather Marriott (Embry-Riddle Aeronautical University) provided invaluable assistance in the processing of data before public release. Special recognition is given to Sandra Wright, who managed the NWSD from its inception in 1995 until her retirement in 2015. She set a high standard for data quality and consistency so that analyses such as presented in this report could be accomplished. Finally, the NWSD office acknowledges the suggestions and critiques made by various people over the years that have enhanced the usefulness and accuracy of the NWSD and annual reports such as presented here. We particularly acknowledge the advice provided by Roger Nicholson (retired), Boeing Aircraft Company.
Sponsorship and funds for the ongoing maintenance and analysis of the NWSD are provided by the FAA, Office of Airport Safety and Standards, Washington, DC, and the Airport Technology Research and Development Branch, FAA William J. Hughes Technical Center, Atlantic City, NJ.

Wildlife Strikes to Civil Aircraft in the United States, 1990–2018
v
EXECUTIVE SUMMARY – PART 1: WILDLIFE STRIKES TO CIVIL AIRCRAFT IN THE UNITED STATES, 1990–2018
Although birds are critical ecologic, economic, and esthetic components of the environment deserving rigorous international protection, they can at times conflict with human activities such as aviation. Aircraft collisions with birds and other wildlife (wildlife strikes) have become an increasing concern for aviation safety in recent years. Factors that contribute to this increasing threat are increasing populations of large birds and increased air traffic by quieter, turbofan-powered aircraft. Globally, wildlife strikes killed more than 282 people and destroyed over 263 aircraft from 1988 - 2018.
This report presents a summary analysis of data from the National Wildlife Strike Database (NWSD) for the 29-year period 1990 through 2018. A sample of 19 significant wildlife strikes to civil aircraft in the USA during 2018 is also included as Appendix A. Appendix B explains how to report strikes and the role of the Smithsonian Institution Feather Lab in identifying bird and other wildlife species that are struck.
The number of strikes annually reported to the Federal Aviation Administration (FAA) increased 8.7-fold from 1,850 in 1990 to a record 16,020 in 2018. The 2018 total was an increase of 1,356 strikes (9 percent) compared to the 14,664 strikes reported in 2017. For 1990–2018, 214,048 strikes were reported (209,950 in USA and 4,098 strikes by U.S.-registered aircraft in foreign countries). In 2018, birds were involved in 94.7 percent of the reported strikes, bats in 3.2 percent, terrestrial mammals in 1.8 percent, and reptiles in 0.3 percent.
Although the number of reported strikes has dramatically increased, the number of reported damaging strikes has stabilized since 2000. Whereas the number of reported strikes in USA increased 169 percent from 5,872 in 2000 to 15,799 in 2018, the number of damaging strikes declined 8 percent from 741 to 684. The decline in damaging strikes has been most pronounced for commercial aircraft in the airport environment (at <1,500 feet above ground level [AGL]). Damaging strikes have not declined for general aviation (GA) aircraft.
In 2018, 69 percent and <1 percent of the 16,020 strike reports were filed using the electronic and paper versions, respectively, of FAA Form 5200-7, Bird/Other Wildlife Strike Report. Eight percent of the reports were submitted via the Air Traffic Organization Mandatory Occurrence Reporting system.
The number of USA airports with strikes reported increased from 335 in 1990 to a record 714 in 2018. The 714 airports with strikes reported were comprised of 423 airports certificated for passenger service under 14 CFR Part 139 and 291 GA aviation airports. From 1990 - 2018, strikes have been reported from 2,047 USA airports.
Fifty-three percent of bird strikes occurred between July and October; 29 percent of deer strikes occurred in October - November. Terrestrial mammals are more likely to be struck at night (63 percent) whereas birds are struck more often during the day (63

Wildlife Strikes to Civil Aircraft in the United States, 1990–2018
vi
percent). Birds, terrestrial mammals, and bats are all much more likely to be struck during the arrival phase of flight (62, 64, and 84 percent of strikes, respectively) compared to departure (36, 33 and 14 percent, respectively).
For commercial and GA aircraft, 71 and 72 percent of bird strikes, respectively, occurred at or below 500 feet AGL. Above 500 feet AGL, the number of strikes declined by 34 percent for each 1,000-foot gain in height for commercial aircraft, and by 44 percent for GA aircraft. Strikes occurring above 500 feet were more likely to cause damage than strikes at or below 500 feet. The record height for a reported bird strike was 31,300 feet.
From 1990 to 2018, 576 species of birds, 46 species of terrestrial mammals, 34 species of bats, and 20 species of reptiles were identified as struck by aircraft. Waterfowl, gulls, and raptors are the species groups of birds with the most damaging strikes; Artiodactyls (mainly deer) and carnivores (mainly coyotes) are the terrestrial mammals with the most damaging strikes. Although the percentage of wildlife strikes with reported damage has averaged 8 percent for the 29-year period, this number has declined from 20 percent in 1990 to 4 percent in 2018.
A negative effect-on-flight was reported in 6 percent and 18 percent of the bird and terrestrial mammal strike reports, respectively, 1990-2018. Precautionary/emergency landing after striking wildlife was the most commonly reported negative effect (6,612 incidents), including 262 incidents in which the pilot jettisoned fuel (60 incidents, mean of 14,373 gallons), made an overweight landing (106 incidents), or burned fuel in circling pattern (96 incidents). Aborted take-off was the second most commonly reported negative effect (2,531 incidents). These negative incidents included 556 aborted take-offs at >100 knots. Similar to the trend shown for the percentage of strikes causing damage, the percentage of strikes with a reported negative effect-on-flight has declined from a high of 12 percent in 1996 to 4 percent in 2014-2018. For commercial aircraft, the number of high-speed (>100 knots) aborted take-offs has declined from a high of 25 in 2000 to 6-9 in 2015-2018.
For the 20 species of birds most frequently identified as struck by civil aircraft in 2018, there was a strong correlation (R2 = 0.96) between mean body mass and the likelihood of a strike causing damage to aircraft. For every 100 gram increase in body mass, there was a 1.15 percent increase in the likelihood of damage. Thus, body mass is a good predictor of relative hazard level among bird species.
Seventy strikes resulted in a destroyed aircraft from 1990-2018 (none in 2018); 45 (64 percent) of these occurred at GA airports. The annual cost of wildlife strikes to the USA civil aviation industry in 2018 was projected to be a minimum of 95,950 hours of aircraft downtime and $92 million in direct and other monetary losses. Actual losses are likely 2 or more times higher.
This analysis of 29 years of strike data documents the progress being made in reducing damaging strikes for commercial aircraft which primarily use Part 139-certificated

Wildlife Strikes to Civil Aircraft in the United States, 1990–2018
vii
airports. Management actions to mitigate the risk have been implemented at many airports since the 1990s; these efforts are likely responsible for the general stabilization or decline in reported strikes with damage and a negative effect-on-flight at Part 139-certificated airports from 2000-2018 in spite of continued increases in populations of many large bird species. However, much work remains to be done to reduce wildlife strikes. Management actions at airports should be prioritized based on the hazard level of species observed in the aircraft operating area.
---------------------------------------------------------------------------------------------------------------------
To address strikes outside the airport environment, the general public and aviation community must first widen its view of wildlife management to minimize hazardous wildlife attractants within 5 miles of airports. Second, the aviation community needs to broaden the view of wildlife strike risks from a ground-based wildlife management problem to an airspace management problem that also encompasses Air Traffic Control, flight crews, and aircraft manufacturers. Long-term goals include the integration of avian radar and bird migration forecasting into airspace management and the development of aircraft lighting systems to enhance detection and avoidance by birds. Finally, there continues to be a need for increased and more detailed strike reporting. When reports are filed, it is important that relevant information be provided whenever possible regarding species identification, number of wildlife struck, time and height of strike, phase of flight, and damage to aircraft components. A problem that is not well defined cannot be properly managed.
EXECUTIVE SUMMARY– PART 2: FAA ACTIVITIES FOR MITIGATING WILDLIFE STRIKES
In 2018, the FAA continued a multifaceted approach for mitigating wildlife strikes. This included publishing new guidance, continuing a robust research program, making improvements to the NWSD and outreach, and providing Airport Improvement Program (AIP) funding to airports to conduct Wildlife Hazard Assessments (Assessments) and develop Wildlife Hazard Management Plans (Plans). The emergency forced landing of US Airways Flight 1549 Airbus 320 into the Hudson River on January 15, 2009 demonstrated to the world the severity of aircraft collisions with birds and other wildlife. Migratory Canada geese were ingested into both engines at 3:27:11 p.m. at an altitude of 2,818 feet above ground level (AGL) and 4.5 miles north-northwest of the approach end of runway 22 at La Guardia International Airport (LGA). Three minutes 49 seconds later the aircraft successfully ditched into the Hudson River with 150 passengers and 5 crew; there were no fatalities. Landmark events such as this necessitate outside scrutiny and comprehensive internal evaluations to insure optimal guidance, compliance and risk reduction moving forward. Since the FAA’s first Advisory Circular (AC) (AC 150 / 5200-1 Bird Hazards to Aviation, Bird Hazard Research) published March 1, 1965, these types of evaluations have allowed the FAA wildlife program to systematically improve its oversight to reduce risks within the safest aerospace system in the world. The results from reviews conducted
Wildlife Strikes to Civil Aircraft in the United States, 1990–2018
viii
following the Flight 1549 event have enhanced existing regulations and provided beneficial layers of expansion throughout other key FAA wildlife-related areas (e.g., Data collection and analysis, Partnerships, Research, and Outreach). In the ten-year span 2009 – 2018, approximately $350 million of Airport Improvement Program (AIP) funds have been allocated for wildlife-related projects such as Assessments, Plans and airport perimeter fencing. All Part 139 certificated airports have successfully completed Assessments followed by Plans while 124 of the largest GA airports have voluntarily completed Assessments. External reviews of the FAA wildlife program resulted in helpful recommendations from the National Safety Transportation Board (NTSB) and the DOT Office of Inspector General (OIG). The four recommendations issued by the NTSB in 2009 and 2010 respectively, have been successfully closed. Two of the recommendations were generated from a 2008 fatal accident involving a Cessna 500 that collided with a flock of white pelicans near the Wiley Post Airport in Oklahoma while the remaining recommendations addressed concerns raised from the US Airways Flight 1549 incident. The FAA received ten additional recommendations within an OIG Audit Report on August 22, 2012. These recommendations covered a wide range of subjects including FAA oversight and enforcement, our policies and guidance for monitoring, reporting, and mitigating wildlife hazards, interagency cooperation, personnel training, communication, and mandatory strike reporting. The last of these extensive recommendations received final closure August 1, 2016. Based on recommendations from NTSB, the FAA encouraged all certificated airports to conduct Assessments and develop Plans regardless if a triggering event under 14 CFR Part 139 had been experienced. To date, 100% of all required Part 139 airports have completed an Assessment and Plan. Joint-use facilities that maintain a Bird/wildlife Aircraft Strike Hazard (BASH) Plan also completed Assessments as a foundation for their BASH Plans. The FAA established a program and schedule that outlined the implementation of Assessments or Site Visits based on the number of operations and based jet aircraft at the GA airport. To date, 124 airports GA airports identified with the greatest need for wildlife data collection have conducted either Assessments or Site Visits. To assist the GA airports in conducting Assessments, we will continue to make AIP grant funds available to them. The FAA dedicated over $25 million in research funds within the last decade to better understand the capabilities of advanced detection and monitoring systems such as avian radars, Foreign Object Debris (FOD) radars and infrared / electro-optical scanning systems. Other research initiatives included aircraft-mounted lighting systems to enhance bird detection and avoidance, wildlife control techniques, habitat management, Canada goose movement analyses, capture and relocation efficacy of raptors, DNA and molecular identifications, and systems integration (Wildlife Surveillance Concept -WiSC) which aims to determine the compatibility of avian radar or similar monitoring technologies warning notice in the Air Traffic Controller’s reach. In addition, the FAA has published new and revised advisory circulars within the last year in order to assist airport sponsors with providing a safe airport environment. The FAA published Advisory Circular 150/ 5200- 38 - Protocol for the Conduct and Review

Wildlife Strikes to Civil Aircraft in the United States, 1990–2018
ix
of Wildlife Hazard Site Visits, Wildlife Hazard Assessments, and Wildlife Hazard Management Plans on August 20, 2018. This new AC defines the minimum acceptable standards for the conduct and preparation of Site Visits, Assessments and Plans. AC 150/5200-38 also clarifies the NEPA (National Environmental Policy Act) process for projects included in an airport’s Plan and provides protocol for the approval (or partial approval) of Plans with regard to NEPA and other environmental laws. The AC gives Airports and Biologists checklists for Assessments and Plans and provides Airport Certification Safety Inspectors guidelines/ templates to review those documents. AC 150/5200-36B Qualifications for Wildlife Biologist Conducting Wildlife Hazard Assessments and Training Curriculums for Airport Personnel Involved in Controlling Wildlife Hazards on Airports was last updated January 24, 2019. This latest version provides for an alternative field experience option of Continual Monitoring to aid Qualified Airport Wildlife Biologists (QAWB) candidates in an era where all certificated airports have finished their initial Assessments and Plans. The FAA has conducted years of outreach and education regarding the importance of reporting wildlife strikes to the National Wildlife Strike Database (NWSD). The NWSD is a very important tool for developing airport specific wildlife hazard management plans as well as for the evaluation of trends in bird migration and species of wildlife struck on a national level so time and funding can be spent efficiently on wildlife hazard mitigation research for the U.S. The Sandy Wright / Richard Dolbeer Excellence in Strike Reporting award was initiated in 2014 to recognize those airports that have exhibited a noteworthy strike-reporting program. The idea is to recognize the Top 5 reporting programs in both the Certificated and GA airport categories each year. In 2017, the Part 139 certificated airport winner was Portland International Airport (PDX) and the General Aviation representative was Henderson Field, Midway Atoll (MDY). For their commitment to the identification and documentation of wildlife / aircraft strike information, the FAA proudly recognizes the superior strike reporting programs at Seattle / Tacoma International Airport (SEA) and Page Field (FMY) as the winners of the 2018 Sandy Wright / Richard Dolbeer Excellence in Strike Reporting award. The bar remains high; and these airports, as well as each of the finalists, well deserve the recognition. Congratulations. This annual strike report contains the results of these, and many other, evaluations using the data from the NWSD. The 16,020 documented strikes in 2018 equates to roughly 44 wildlife strikes documented every day, only about 4 percent are damaging. In 2018, there were 697 damaging strikes; this averages about two damaging strikes per day or about 1 per 35,000 of the estimated 70,000 daily aircraft over US airspace. Overall, 82 percent of strikes occur at or below 1,500 feet Above Ground Level (AGL). This altitude falls within the 5-mile separation distance recommended for wildlife attractants, meaning that on-ground wildlife mitigation activities out to 5 miles can have a positive effect on risk reduction for 82 percent of all wildlife strikes. Strikes are rare events that occur every day. Although it is impossible to eliminate all strikes at all times between aircraft and animals, comprehensive assessment, planning and management techniques have successfully mitigated damaging strikes on or near
Wildlife Strikes to Civil Aircraft in the United States, 1990–2018
x
airports. Combined with systematic evaluation and adaptation of techniques, safety can be increased one less strike at a time.
TABLE OF CONTENTS
ACKNOWLEDGMENTS iv
EXECUTIVE SUMMARY v
LIST OF TABLES xi
LIST OF FIGURES xiii
LIST OF APPENDICES xv
PART 1: WILDLIFE STRIKES TO CIVIL AIRCRAFT IN THE UNITED STATES, 1990–2018
1
INTRODUCTION 1
RESULTS 4
CONCLUSIONS 14
PART 2: FAA ACTIVITIES FOR MITIGATING WILDLIFE STRIKES 17
LITERATURE CITED 25
TABLES 32
FIGURES 81
APPENDIX A. SELECTED SIGNIFICANT WILDLIFE STRIKES TO U.S. CIVIL AIRCRAFT, 2018
96
APPENDIX B. REPORTING A STRIKE AND IDENTIFYING SPECIES OF WILDLIFE STRUCK
103
Wildlife Strikes to Civil Aircraft in the United States, 1990–2018
xi
LIST OF TABLES
Table 1. Number of reported wildlife strikes to civil aircraft in USA and to U.S.-registered civil aircraft in foreign countries, 1990–2018.
32
Table 2. Number of reported wildlife strikes to civil aircraft in USA by wildlife group, 1990–2018.
33
Table 3. Number and rate of reported wildlife strikes and strikes with damage for commercial air carrier aircraft, USA, 1990–2018 (see Figure 3).
34
Table 4. Number and rate of reported wildlife strikes and strikes with damage for general aviation aircraft, USA, 1990–2018 (see Figure 3).
35
Table 5. Methods of reporting and source of information for reported wildlife strikes to civil aircraft, USA, 2018 only and 1990–2018.
36
Table 6. Person filing report of wildlife strike to civil aircraft, USA, 2018 only and 1990–2018.
37
Table 7. Number of reported wildlife strikes to civil aircraft by type of operator, USA, 2018 only and 1990–2018.
38
Table 8. Number of Part 139-certificated airports and general aviation (GA) airports with reported wildlife strikes and number of strikes reported for these airports, civil aircraft, USA, 1990–2018 (see Figure 6).
39
Table 9. Reported time of occurrence of wildlife strikes with civil aircraft, USA, 1990–2018.
40
Table 10. Reported phase of flight at time of occurrence of wildlife strikes with civil aircraft, USA, 1990–2018.
41
Table 11. Number of reported bird strikes to commercial aircraft by height above ground level (AGL), USA, 1990–2018. See Figure 9 for graphic analysis of strike data from 501 to 18,500 feet AGL.
42
Table 12. Number of reported bird strikes to general aviation aircraft by height above ground level (AGL), USA, 1990–2018. See Figure 9 for graphic analysis of strike data from 501 to 12,500 feet AGL.
43
Table 13. Civil aircraft components reported as being struck and damaged by wildlife, USA, 1990–2018.
44
Table 14. Number of civil aircraft with reported damage resulting from wildlife strikes, USA, 1990–2018. See Tables 1-4 and Figures 2-4, 11, and 16 for trends in damaging strikes, 1990–2018.
45
Table 15. Reported effect-on-flight of wildlife strikes to civil aircraft, USA, 1990–2018. See Figure 11 for trend in strikes with a negative effect-on-flight, 1990-2018.
46
Wildlife Strikes to Civil Aircraft in the United States, 1990–2018
xii
Table 16. Number of reported incidents where pilot made a precautionary or emergency landing after striking a bird or other wildlife during departure in which fuel was jettisoned or burned (circling pattern) to lighten aircraft weight or in which an overweight (greater than maximum landing weight) landing was made (no fuel jettison or burn), civil aircraft, USA, 1990–2018. See Figure 12 for trend in incidents, 1990–2018.
47
Table 17. Indicated airspeed (nautical miles/hour [knots]) at time pilot aborted take-off after striking or observing wildlife on runway, civil aircraft, USA, 1990–2018. See Figure 13 for trend in aborted take-offs at >100 knots caused by wildlife, 1990–2018.
48
Table 18. Total reported strikes, strikes causing damage, strikes having a negative effect-on-flight (NEOF), strikes involving >1 animal, and reported aircraft downtime and costs by identified wildlife species, civil aircraft, USA, 1990–2018.
49
Table 19. Number of reported strikes, strikes with damage, and strikes involving multiple animals for the five most commonly struck bird groups and three most commonly struck terrestrial mammal groups, civil aircraft, USA, 1990–2018.
73
Table 20. The 33 species of birds identified most frequently as struck by civil aircraft in USA, 1990–2018 and 2018 only. See Figure 15 for relation between mean body mass and percent of strikes causing damage for top 20 species, 1990-2018.
74
Table 21. Number of strikes to civil aircraft causing human fatality or injury and number of injuries and fatalities by wildlife species, USA, 1990–2018.
75
Table 22. Number of civil aircraft lost (destroyed or damaged beyond repair) after striking wildlife by wildlife species and aircraft mass category, USA, 1990–2018. See Figure 16 for number of lost aircraft by year, 1990–2018.
76
Table 23. Number of reported wildlife strikes indicating damage, a negative effect-on-flight (NEOF), aircraft downtime, repair costs, and other costs; and the mean losses per report in hours of downtime and inflation-adjusted U.S. dollars, civil aircraft, USA, 1990–2018.
77
Table 24. Minimum projected annual losses in aircraft downtime (hours) and in repair and other costs (inflation-adjusted U.S. dollars) from wildlife strikes with civil aircraft, USA, 1990–2018. Losses are projected from mean reported losses per incident (Table 23).
78
Wildlife Strikes to Civil Aircraft in the United States, 1990–2018
xiii
LIST OF FIGURES
Figure 1. Number of reported wildlife strikes with civil aircraft, USA, 1990–2018. The 209,950 strikes involved birds (202,472), terrestrial mammals (4,350), bats (2,725), and reptiles (403). An additional 4,098 strikes were reported for U.S.-registered aircraft in foreign countries (see Tables 1, 2, and 18).
81
Figure 2. Number of reported wildlife strikes causing damage to civil aircraft, USA, 1990–2018. The 16,221 damaging strikes involved birds (15,057), terrestrial mammals (1,141), bats (20), and reptiles (3). An additional 391 damage strikes were reported for U.S.-registered aircraft in foreign countries (see Tables 1, 2 and 18).
81
Figure 3. The strike rate (number of reported strikes and damaging strikes per 100,000 aircraft movements) for commercial (air carrier, commuter, and air taxi service) and general aviation aircraft, USA, 2000–2018. Strikes involving U.S.-registered aircraft in foreign countries are excluded. R2 values greater than 0.21 and 0.33 indicate significant trends at the 0.05 and 0.01 levels of probability, respectively (Steel and Torrie 1960; see Tables 3 and 4 for complete data, 1990-2018).
82
Figure 4. Number of damaging strikes with commercial (top graph) and general aviation (bottom graph) aircraft occurring at < and >1500 feet above ground level (AGL) for all wildlife species, USA, 2000–2018. Strikes with unknown height AGL are included with strikes at <1500 feet AGL. Strikes involving U.S.-registered aircraft in foreign countries are excluded. R2 values greater than 0.21 and 0.33 indicate significant trends at the 0.05 and 0.01 levels of probability, respectively (Steel and Torrie 1960).
83
Figure 5. The mean body mass of birds reported as struck by civil aircraft in USA has declined by 60 percent from 2000 to 2018. This indicates that airports, pilots, and commercial aviation in general, are doing a better job of documenting all wildlife that are struck, many of which are small species that rarely cause damage. Means were calculated from all strikes in which the bird was identified to species. See Figure 14 for number of identified bird species struck each year.
84
Wildlife Strikes to Civil Aircraft in the United States, 1990–2018
xiv
Figure 6. Number of Part 139-certificated airports and general aviation (GA) airports in USA with reported wildlife strikes and number of foreign airports at which strikes were reported for U.S.-registered civil aircraft, 1990–2018. Strikes were reported from 2,047 USA airports (521 Part 139-certificated, 1,526 GA) and 312 foreign airports in 109 countries, 1990-2018 (Table 8).
85
Figure 7. Percentage of reported bird (top graph) and bat (bottom graph) strikes with civil aircraft by month, USA, 1990–2018. In addition, 403 strikes with reptiles were reported of which 42 percent occurred in May – June. Strikes reported for U.S.-registered aircraft in foreign countries were excluded.
86
Figure 8. Percentage of reported deer (top graph) and coyote (bottom graph) strikes with civil aircraft by month, USA, 1990–2018. One deer and 1 coyote strike reported for U.S.-registered aircraft in foreign countries were excluded. Deer (1,082 white-tailed, 80 mule, 20 unidentified to species) and coyotes are the most commonly struck terrestrial mammals (Table 18). Biondi et al. (2011) provide a more detailed analysis of deer strikes with civil aircraft in the USA.
87
Figure 9. Number of reported bird strikes with commercial (top graph) and general aviation (GA) aircraft (bottom graph) in USA by 1,000-foot height intervals above ground level from 501—1,500 feet (interval 1) to 17,501—18,500 feet (interval 18) for commercial aircraft and to 11,501-12,500 feet (interval 12) for GA aircraft, 1990-2018. These graphs exclude strikes at <500 feet. Above 500 feet, the number of reported strikes declined consistently by 34 percent and 44 percent for each 1,000 foot gain in height for commercial and GA aircraft, respectively. The exponential equations explained 98 to 99 percent of the variation in number of strikes by 1,000-foot intervals from 501 to 18,500 feet for commercial aircraft and 501 to 12,500 feet for GA aircraft. See Tables 11 and 12 for sample sizes.
88
Figure 10. Percentages of total strikes and total damaging strikes occurring at 500 feet or less and above 500 feet for commercial (top graph) and general aviation (bottom graph) aircraft in USA, 1990-2018. See Tables 11 and 12 for sample sizes.
89
Figure 11. Percentage of reported strikes that indicated damage to the civil aircraft (top graph) or a negative effect-on-flight (bottom graph), USA, 1990–2018. See Tables 1, 14, and 15 for sample sizes and classifications of damage and negative effects-on-flight.
90
Wildlife Strikes to Civil Aircraft in the United States, 1990–2018
xv
Figure 12. Number of reported incidents where pilot made an emergency or precautionary landing after striking wildlife during departure in which fuel was jettisoned or burned (circling pattern) to lighten aircraft weight or in which an overweight (greater than maximum landing weight) landing was made (no fuel jettison or burn), USA civil aircraft, 1990–2018. See Table 16 for details on aircraft involved and amount of fuel jettisoned.
91
Figure 13. Number of reported incidents in which pilot made a high-speed aborted take-off (>100 knots) after striking or observing wildlife during take-off run, USA civil aircraft, 1990–2018. See Table 17 for classification of aborted take-offs by indicated airspeed.
92
Figure 14. Number of identified bird species struck by civil aircraft each year (top graph) and the percentage of reported bird strikes in which the bird was identified to species (bottom graph), USA, 1990–2018. From 1990 through 2018, 576 different species of birds have been identified. See Tables 1 and 18 for sample sizes and list of species.
93
Figure 15. Relation between mean body mass (Dunning 2008) and likelihood of a strike causing damage to aircraft for the 20 species of birds most frequently identified as struck by civil aircraft in USA, 1990-2018 (Table 20). The linear regression equation explained 96 percent of the variation in the likelihood of damage among the 20 species. For every 100 gram increase in body mass, there was a 1.15 percent increase in the likelihood of damage.
94
Figure 16. Number of civil aircraft destroyed or damaged beyond repair after striking wildlife, USA, 1990–2018. From 1990 - 2018, 70 aircraft have been lost (45 with maximum take-off mass <2,250 kg; 17, 2,251-5,700 kg; 6, 5,701-27,000 kg; 2, >27,000 kg). See Table 22 for wildlife species and types of aircraft and airports associated with these events.
95
LIST OF APPENDICES
Appendix A. Selected Significant Wildlife Strikes to U.S. Civil Aircraft, 2018 96
Appendix B. Reporting a Strike and Identifying Species of Wildlife Struck 103

Wildlife Strikes to Civil Aircraft in the United States, 1990–2018
xvi
This page intentionally left blank

Wildlife Strikes to Civil Aircraft in the United States, 1990–2018
xvii
This page intentionally left blank

Wildlife Strikes to Civil Aircraft in the United States, 1990–2018
1
PART 1: WILDLIFE STRIKES TO CIVIL AIRCRAFT IN THE UNITED STATES, 1990–2018
INTRODUCTION
The National Geographic Society and the National Audubon Society joined forces with more than 100 other organizations and millions of people around the world in 2018 to celebrate the “Year of the Bird” (National Audubon Society 2018). This celebration marked the centennial of the Migratory Bird Treaty Act (MBTA). This International treaty, originally signed by Great Britain (for Canada) and the USA in 1918, now includes Mexico, Russia, and Japan as signatories, and protects over 1,000 species of birds that migrate among the five countries (U.S. Fish and Wildlife Service 2019b). The MBTA has been hailed by biologists and politicians alike as the most influential legislation ever enacted to protect birds, and it has served as a model for nations worldwide.
Although birds are critical ecologic, economic, and esthetic components of the environment deserving rigorous international protection, they can at times conflict with human activities such as aviation. Aircraft collisions with birds and other wildlife (wildlife strikes) have become an increasing concern for aviation safety in recent years (Bogaisky 2019).
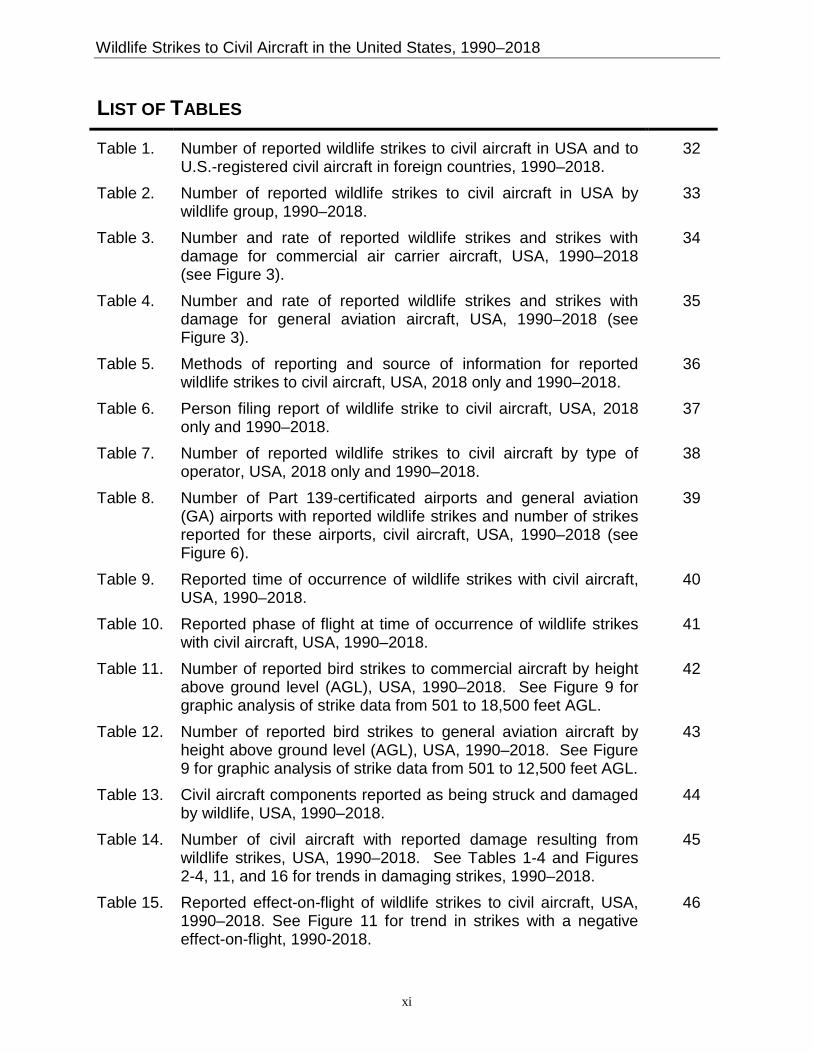
The reasons for the increasing concern are complex. A major factor is that due to the MBTA, other environmental initiatives, and land-use changes, populations of most large bird species in North America have increased markedly in the last few decades and adapted to living in urban environments, including airports. Dolbeer (2019) examined the estimated population trends and numbers for the 20 species of birds in North America with mean body masses >4 lbs and at least 20 strikes with civil aircraft from 1990-2018. Of these 20 species, 16 indicated population increases of greater than 10 percent, 3 were unchanged, and only 1 species showed a decline of greater than 10 percent. The net gain in numbers for the 20 species was an estimated 28 million birds (2.3 fold increase). As specific examples, the resident (non-migratory) Canada goose (mean body mass = 9 lbs) population in North America increased from about 1 million to over 4 million from 1990 to 2018 (Dolbeer et al. 2014, U.S. Fish and Wildlife Service 2018). During the
Resident (generally non-migratory) geese are primarily the Atlantic Flyway Resident, Mississippi Flyway Giant, Hi-Line, and Western Prairie/Great Plains Populations. In 2018, 62 strikes were reported for Canada geese, (mean body mass = 9 lbs) compared to peak numbers of 84-87 in 1998-2000.
0
1
2
3
4
5
1970 1975 1980 1985 1990 1995 2000 2005 2010 2015 2020
x 1
mill
ion
North American population of resident Canada geese, 1970 - 2018
Graph by R. A. Dolbeer based on data from U.S. Fish and Wildlife Service (2018)
Wildlife Strikes to Civil Aircraft in the United States, 1990–2018
2
same time period, the North American snow goose (mean body mass = 6 lbs) population increased from about 4 million to 15 million birds (U.S. Fish and Wildlife Service 2018).
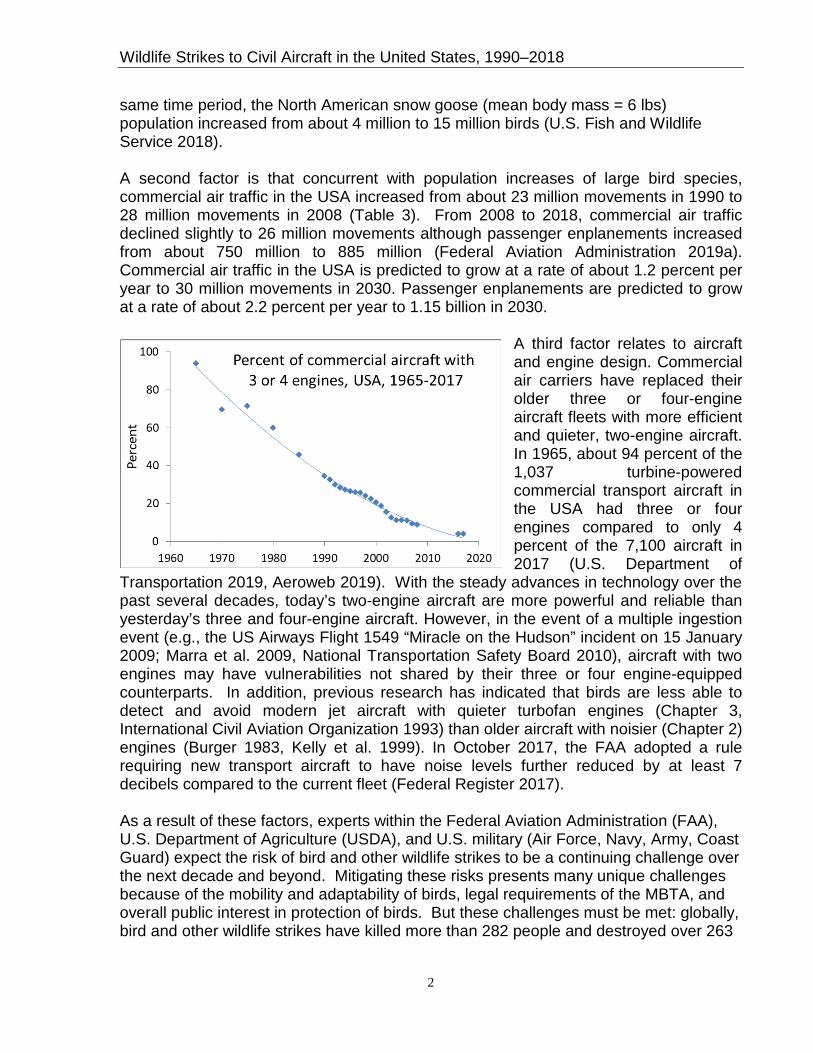
A second factor is that concurrent with population increases of large bird species, commercial air traffic in the USA increased from about 23 million movements in 1990 to 28 million movements in 2008 (Table 3). From 2008 to 2018, commercial air traffic declined slightly to 26 million movements although passenger enplanements increased from about 750 million to 885 million (Federal Aviation Administration 2019a). Commercial air traffic in the USA is predicted to grow at a rate of about 1.2 percent per year to 30 million movements in 2030. Passenger enplanements are predicted to grow at a rate of about 2.2 percent per year to 1.15 billion in 2030.
A third factor relates to aircraft and engine design. Commercial air carriers have replaced their older three or four-engine aircraft fleets with more efficient and quieter, two-engine aircraft. In 1965, about 94 percent of the 1,037 turbine-powered commercial transport aircraft in the USA had three or four engines compared to only 4 percent of the 7,100 aircraft in 2017 (U.S. Department of
Transportation 2019, Aeroweb 2019). With the steady advances in technology over the past several decades, today’s two-engine aircraft are more powerful and reliable than yesterday’s three and four-engine aircraft. However, in the event of a multiple ingestion event (e.g., the US Airways Flight 1549 “Miracle on the Hudson” incident on 15 January 2009; Marra et al. 2009, National Transportation Safety Board 2010), aircraft with two engines may have vulnerabilities not shared by their three or four engine-equipped counterparts. In addition, previous research has indicated that birds are less able to detect and avoid modern jet aircraft with quieter turbofan engines (Chapter 3, International Civil Aviation Organization 1993) than older aircraft with noisier (Chapter 2) engines (Burger 1983, Kelly et al. 1999). In October 2017, the FAA adopted a rule requiring new transport aircraft to have noise levels further reduced by at least 7 decibels compared to the current fleet (Federal Register 2017).
As a result of these factors, experts within the Federal Aviation Administration (FAA), U.S. Department of Agriculture (USDA), and U.S. military (Air Force, Navy, Army, Coast Guard) expect the risk of bird and other wildlife strikes to be a continuing challenge over the next decade and beyond. Mitigating these risks presents many unique challenges because of the mobility and adaptability of birds, legal requirements of the MBTA, and overall public interest in protection of birds. But these challenges must be met: globally, bird and other wildlife strikes have killed more than 282 people and destroyed over 263
Wildlife Strikes to Civil Aircraft in the United States, 1990–2018
3
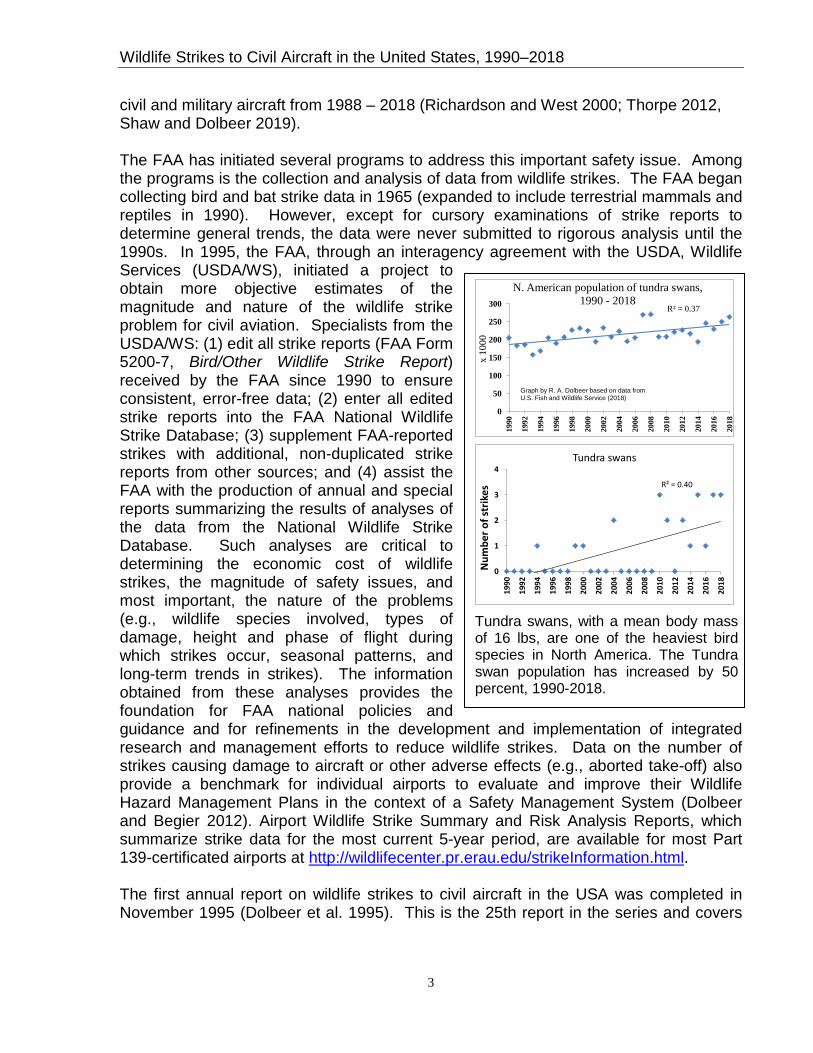
civil and military aircraft from 1988 – 2018 (Richardson and West 2000; Thorpe 2012, Shaw and Dolbeer 2019). The FAA has initiated several programs to address this important safety issue. Among the programs is the collection and analysis of data from wildlife strikes. The FAA began collecting bird and bat strike data in 1965 (expanded to include terrestrial mammals and reptiles in 1990). However, except for cursory examinations of strike reports to determine general trends, the data were never submitted to rigorous analysis until the 1990s. In 1995, the FAA, through an interagency agreement with the USDA, Wildlife Services (USDA/WS), initiated a project to obtain more objective estimates of the magnitude and nature of the wildlife strike problem for civil aviation. Specialists from the USDA/WS: (1) edit all strike reports (FAA Form 5200-7, Bird/Other Wildlife Strike Report) received by the FAA since 1990 to ensure consistent, error-free data; (2) enter all edited strike reports into the FAA National Wildlife Strike Database; (3) supplement FAA-reported strikes with additional, non-duplicated strike reports from other sources; and (4) assist the FAA with the production of annual and special reports summarizing the results of analyses of the data from the National Wildlife Strike Database. Such analyses are critical to determining the economic cost of wildlife strikes, the magnitude of safety issues, and most important, the nature of the problems (e.g., wildlife species involved, types of damage, height and phase of flight during which strikes occur, seasonal patterns, and long-term trends in strikes). The information obtained from these analyses provides the foundation for FAA national policies and guidance and for refinements in the development and implementation of integrated research and management efforts to reduce wildlife strikes. Data on the number of strikes causing damage to aircraft or other adverse effects (e.g., aborted take-off) also provide a benchmark for individual airports to evaluate and improve their Wildlife Hazard Management Plans in the context of a Safety Management System (Dolbeer and Begier 2012). Airport Wildlife Strike Summary and Risk Analysis Reports, which summarize strike data for the most current 5-year period, are available for most Part 139-certificated airports at http://wildlifecenter.pr.erau.edu/strikeInformation.html. The first annual report on wildlife strikes to civil aircraft in the USA was completed in November 1995 (Dolbeer et al. 1995). This is the 25th report in the series and covers
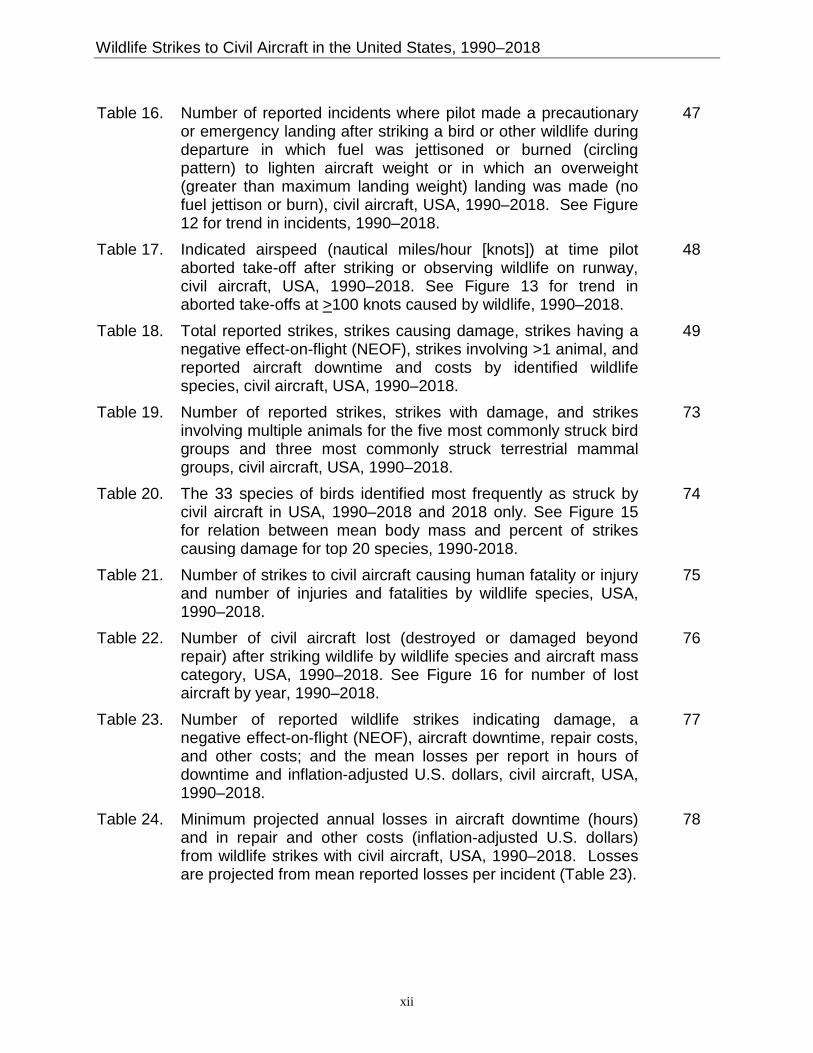
Tundra swans, with a mean body mass of 16 lbs, are one of the heaviest bird species in North America. The Tundra swan population has increased by 50 percent, 1990-2018.
R² = 0.37
0
50
100
150
200
250
300
1990
1992
1994
1996
1998
2000
2002
2004
2006
2008
2010
2012
2014
2016
2018
x 10
00
N. American population of tundra swans, 1990 - 2018
Graph by R. A. Dolbeer based on data from U.S. Fish and Wildlife Service (2018)
R² = 0.40
0
1
2
3
4
1990
1992
1994
1996
1998
2000
2002
2004
2006
2008
2010
2012
2014
2016
2018
Num
ber o
f str
ikes
Tundra swans
Wildlife Strikes to Civil Aircraft in the United States, 1990–2018
4
the 29-year period, 1990–2018. Current and historic annual reports are accessible as PDF files at: http://www.faa.gov/airports/airport_safety/wildlife/
To supplement the statistical summary of data presented in tables and graphs, a sample of 19 significant wildlife strikes to civil aircraft in the USA during 2018 is presented in Appendix A. These recent strike examples demonstrate the widespread and diverse nature of the problem. A more extensive list of significant strike events, 1990–2018, is available at http://www.faa.gov/airports/airport_safety/wildlife/.
Appendix B explains how to report strikes and the role of the Smithsonian Institution Feather Lab in identifying bird and other wildlife species that are struck.
RESULTS
NUMBER OF REPORTED STRIKES AND STRIKES WITH DAMAGE
The number of strikes annually reported to the FAA has increased 8.7-fold from 1,850 in 1990 to a record 16,020 in 2018. The 2018 total was an increase of 1,356 strikes (9 percent) compared to the 14,664 strikes reported in 2017 (Table 1, Figure 1). For the 29-year period (1990–2018), 214,048 strikes were reported of which 209,950 (98 percent) occurred in the USA1. In 2018, birds were involved in 94.7 percent of the reported strikes in the USA, bats in 3.2 percent, terrestrial mammals in 1.8 percent, and reptiles in 0.3 percent (Table 2).
Although the number of reported strikes has steadily increased in the USA, it is important to note that the overall number of reported damaging strikes has not increased since 2000 (Table 2, Figure 2). Whereas the number of reported strikes increased 169 percent from 5,872 in 2000 to 15,799 in 2018, the number of damaging strikes declined 8 percent from 741 to 684. The 684 damaging strikes reported in 2018 was an increase of 5 percent from 649 in 2017. This stabilization of damaging strikes since 2000 has occurred in the commercial aviation sector and not the general aviation sector. While the commercial and general 1 The database contains strikes involving U.S.- or foreign-registered aircraft in the USA and U.S.-registered aircraft in foreign countries.
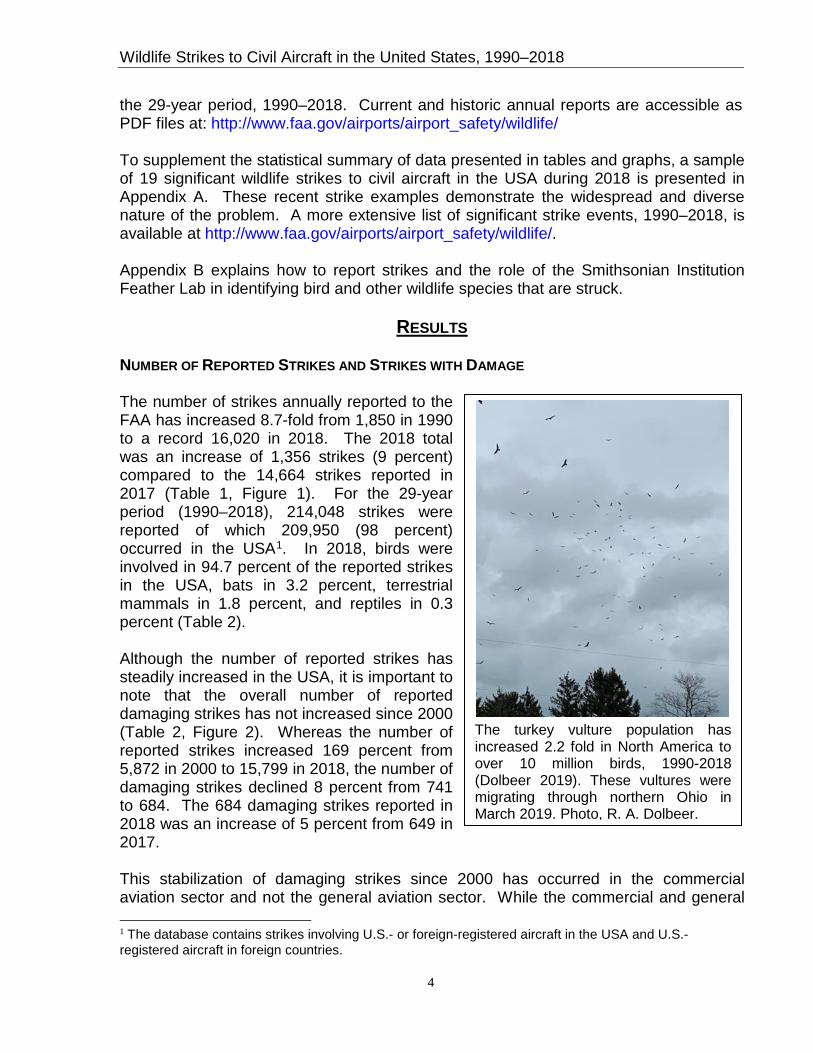
The turkey vulture population has increased 2.2 fold in North America to over 10 million birds, 1990-2018 (Dolbeer 2019). These vultures were migrating through northern Ohio in March 2019. Photo, R. A. Dolbeer.
Wildlife Strikes to Civil Aircraft in the United States, 1990–2018
5
aviation sectors showed increases of 238 percent and 304 percent, respectively, in the rate (per 100,000 movements) of reported strikes from 2000 to 2018, there was no change in the damage strike rate for commercial aircraft (Tables 3, 4, Figure 3). However, there has been a 32 percent increase in the damage strike rate for general aviation aircraft (Table 4, Figure 3).
Furthermore, the overall stabilization in damaging strikes for commercial aircraft since 2000 can be attributed to a slight decline in damaging strikes in the airport environment (strikes occurring on departure or arrival at <1,500 feet above ground level [AGL]). Damaging strikes at >1,500 feet AGL have not shown a pattern of decline (Figure 4). This decline in damaging strikes for commercial aviation in the airport environment has occurred in spite of an increase in populations of hazardous wildlife species (Dolbeer and Eschenfelder 2003, Dolbeer 2019) and, as noted above, a major increase in reported strikes. These data demonstrate progress in wildlife hazard management programs at airports certificated for passenger traffic under 14 CFR-Part 139 regulations (Dolbeer 2011). The data also demonstrate the lack of progress in mitigating the risk of strikes outside the airport environment at certificated airports.
For GA aircraft, there has not been a decline in damaging strikes in the airport environment (at <1,500 feet AGL), and there has been an increase in damaging strikes at >1,500 feet AGL (Figure 4).
The 169 percent increase in the number of strikes reported in USA from 2000 to 2018, concurrent with the stabilization in damaging strikes, indicates that airports, pilots, and commercial aviation in general, are doing a better job of documenting all wildlife that are struck, many of which are small species that rarely cause damage. This premise is supported by the fact that the mean mass of birds reported as struck has declined 60 percent from 0.76 kg to 0.30 kg, 2000-2018 (Figure 5).
METHODS OF REPORTING STRIKES
In 2018, 69 percent and <1 percent of the 16,020 strike reports were filed using the electronic and paper versions, respectively, of FAA Form 5200-7, Bird/Other Wildlife Strike Report (Table 5). Twenty percent of reports came from multiple sources (i.e., more than one type of report was filed for same strike). Strike reports submitted to the FAA via the Air Traffic Organization (ATO) Mandatory
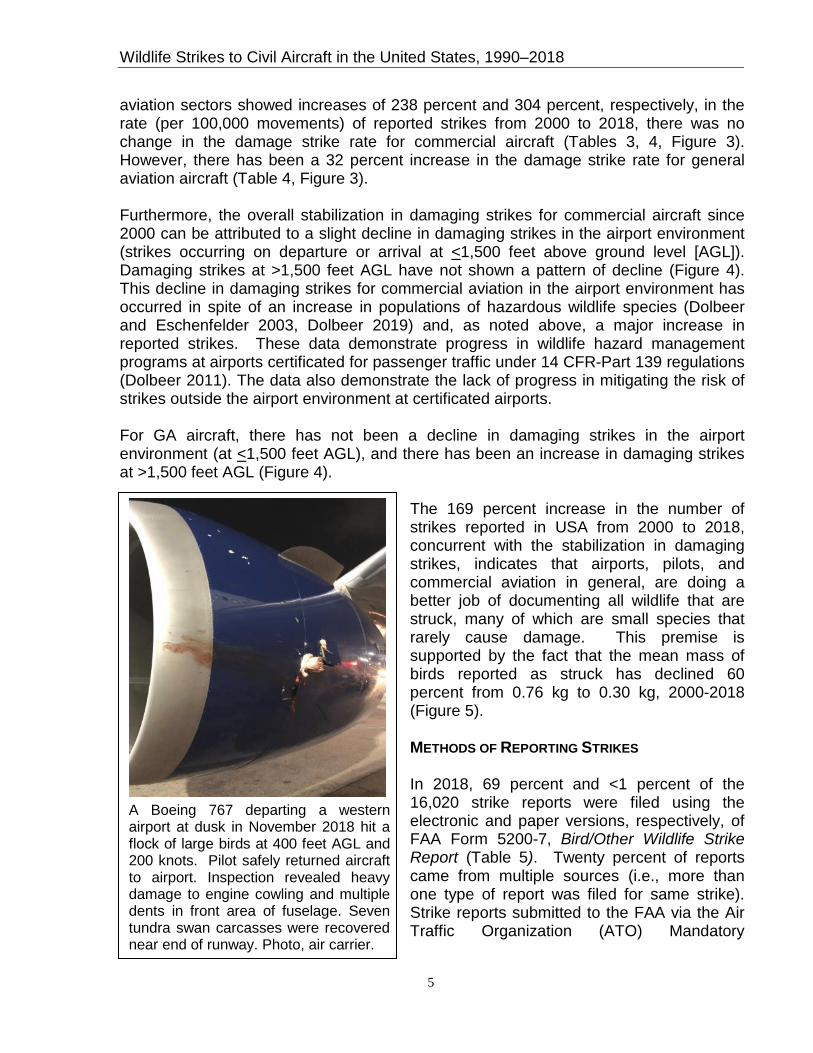
A Boeing 767 departing a western airport at dusk in November 2018 hit a flock of large birds at 400 feet AGL and 200 knots. Pilot safely returned aircraft to airport. Inspection revealed heavy damage to engine cowling and multiple dents in front area of fuselage. Seven tundra swan carcasses were recovered near end of runway. Photo, air carrier.
Wildlife Strikes to Civil Aircraft in the United States, 1990–2018
6
Occurrence Reporting system comprised 8 percent of reports. Under FAA Order JO 7210.632, (effective 30 Jan 2012), ATO personnel are required to report all bird strikes of which they become aware.
SOURCE OF REPORTS
In 2018, airport operations personnel filed 65 percent of the strike reports (including “Carcass Found” reports), followed by pilots (15 percent), air transport operations personnel (13 percent), Air Traffic Control personnel (5 percent), and other (2 percent, Table 6). In 2018, about 85 percent of the reported strikes involved commercial aircraft; the remainder involved business, private, and government aircraft (Table 7).
The number of USA airports with strikes reported has increased steadily from 335 in 1990 to a record 714 in 2018 (Table 8, Figure 6). The 714 airports with strikes reported in 2018 were comprised of 423 airports certificated for passenger service under 14 CFR Part 139 and 291 general aviation airports. From 1990 - 2018, 184,603 strikes have been reported from 2,047 USA airports. In addition, 4,098 strikes involving USA-registered civil aircraft were reported at 312 foreign airports in 109 countries, 1990 – 2018 (221 strikes at 91 foreign airports in 52 countries in 2018).
TIMING OF OCCURRENCE AND PHASE OF FLIGHT OF STRIKES
From 1990 – 2018, most bird strikes (53 percent) occurred between July and October (Figure 7) which is when birds are migrating and populations are at their annual peak in North America following the nesting season. Sixty-three percent of bird strikes occurred during the day and 29 percent at night (Table 9). Almost twice as many strikes (62 percent of total) occurred during the arrival (descent, approach, or landing roll) phase of flight compared to 35 percent during departure (take-off run and climb, Table 10).
Similar to the pattern shown with birds, most terrestrial mammal strikes occurred between July and November; with 29 percent of deer strikes concentrated in October-November and 40 percent of coyote strikes in August-October (Figure 8). Most terrestrial mammal strikes (63 percent) occurred at night (Table 9). As with birds, about twice as many strikes (64 percent of total) occurred during the arrival (final approach or
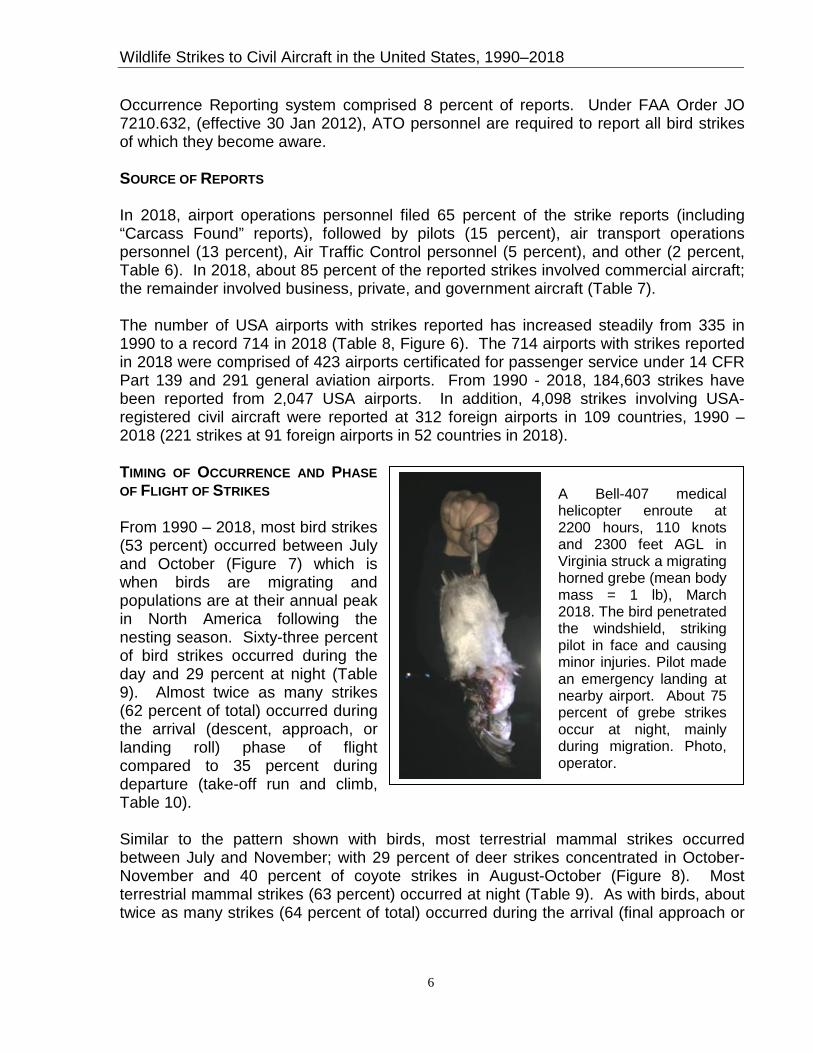
A Bell-407 medical helicopter enroute at 2200 hours, 110 knots and 2300 feet AGL in Virginia struck a migrating horned grebe (mean body mass = 1 lb), March 2018. The bird penetrated the windshield, striking pilot in face and causing minor injuries. Pilot made an emergency landing at nearby airport. About 75 percent of grebe strikes occur at night, mainly during migration. Photo, operator.
Wildlife Strikes to Civil Aircraft in the United States, 1990–2018
7
landing roll) phase of flight compared to 33 percent during take-off run and initial climb (Table 10).
For bats, 76 percent of strikes occurred at dusk, dawn or night (Table 9). The difference in numbers of strikes during arrival compared to departure phase of flight was even greater for bats compared to birds and terrestrial mammals. Eighty-four percent of reported bat strikes occurred during arrival compared to only 13 percent during departure (Table 10).
HEIGHT ABOVE GROUND LEVEL (AGL) OF STRIKES
Bird strikes with commercial aircraft- From 1990 – 2018, about 41 percent of bird strikes with commercial aircraft occurred when the aircraft was at 0 feet AGL, 71 percent occurred at 500 feet or less AGL, and 92 percent occurred at or below 3,500 feet AGL (Table 11). About 1 percent of bird strikes occurred above 9,500 feet AGL. Above 500 feet AGL, the number of reported strikes declined consistently by 34 percent for each 1,000-foot gain in height (Figure 9). The record height for a reported bird strike involving a commercial aircraft in USA was 31,300 feet AGL.
Strikes occurring above 500 feet AGL had a greater probability of causing damage to the aircraft compared to strikes at 500 feet or less. Although only 29 percent of the reported strikes were above 500 feet AGL, these strikes represented 45 percent of the damaging strikes (Table 11, Figure 10).
Bird strikes with general aviation (GA) aircraft- From 1990 – 2018, about 36 percent of the bird strikes with GA aircraft occurred when the aircraft was at 0 feet AGL, 72
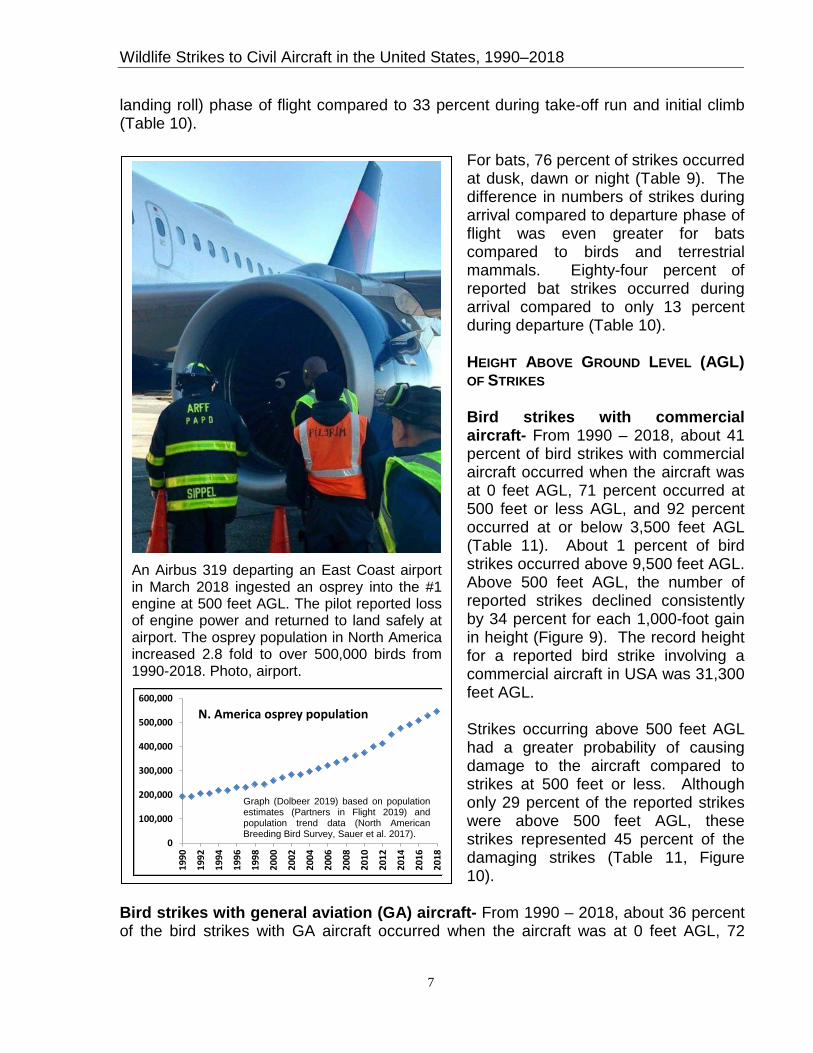
An Airbus 319 departing an East Coast airport in March 2018 ingested an osprey into the #1 engine at 500 feet AGL. The pilot reported loss of engine power and returned to land safely at airport. The osprey population in North America increased 2.8 fold to over 500,000 birds from 1990-2018. Photo, airport.
0
100,000
200,000
300,000
400,000
500,000
600,000
1990
1992
1994
1996
1998
2000
2002
2004
2006
2008
2010
2012
2014
2016
2018
N. America osprey population
Graph (Dolbeer 2019) based on populationestimates (Partners in Flight 2019) andpopulation trend data (North AmericanBreeding Bird Survey, Sauer et al. 2017).

Wildlife Strikes to Civil Aircraft in the United States, 1990–2018
8
percent occurred at 500 feet or less AGL, and 97 percent occurred at or below 3,500 feet AGL (Table 12). About 1 percent of bird strikes occurred above 8,500 feet AGL. Above 500 feet AGL, the number of reported strikes declined consistently by 44 percent for each 1,000-foot gain in height (Figure 9). The record height for a reported bird strike involving a GA aircraft in USA was 24,000 feet AGL.
Strikes occurring above 500 feet AGL had an even greater probability of causing damage to GA aircraft compared to strikes at 500 feet or less than was shown above for commercial aircraft. Although only 28 percent of the reported strikes were above 500 feet AGL, these strikes represented 51 percent of the damaging strikes (Table 12, Figure 10).
Terrestrial mammal strikes- As expected, terrestrial mammal strikes predominately occurred at 0 feet AGL; however, 9 percent of the reported strikes occurred when the aircraft was in the air immediately after lift-off or before touch down (e.g., when an aircraft struck a deer with the landing gear, Table 10).
AIRCRAFT COMPONENTS DAMAGED
The aircraft components most commonly reported as struck by birds from 1990 – 2018 were the nose/radome, windshield, wing/rotor, engine, and fuselage (Table 13). Aircraft engines were the component most frequently reported as being damaged by bird strikes (27 percent of all damaged components). There were 19,497 strike events in which a total of 20,408 engines were reported as struck (18,615 events with one engine struck, 860 with two engines struck, 15 with three engines struck, and 7 with four engines struck). In 4,769 damaging bird-strike events involving engines, a total of
4,925 engines was damaged (4,616 events with one engine damaged, 151 with two engines damaged, 1 with three engines damaged, and 1 with four engines damaged).
Aircraft components most commonly reported as struck by terrestrial mammals were the landing gear, “other”, propeller, and wing/rotor. Aircraft components most commonly reported as damaged were the landing gear, wing/rotor, propeller, and “other” (Table 13). “Other” components reported as struck include critical sensors such as Pitot tubes (685), antenna (communication, radar, global position, 235), temperature gauges (22) and Angle of Attack vanes (122).
Ospreys, if left undisturbed, will use taxiways and runways as feeding sites for fish caught in nearby waters. This osprey was feeding at a southern USA airport. Photo, Airport.
Wildlife Strikes to Civil Aircraft in the United States, 1990–2018
9
REPORTED DAMAGE
For the 206,529 strike reports involving birds from 1990–2018, 15,444 (7 percent) indicated damage to the aircraft (Table 14). When classified by level of damage, 7,637 (4 percent) indicated the aircraft suffered minor damage; 4,167 (2 percent) indicated the aircraft suffered an uncertain level of damage; 3,601 (2 percent) reported substantial damage; and 39 reports (less than 1 percent) indicated the aircraft was destroyed as a result of the bird strike (Table 14).
For the 4,363 terrestrial mammal strikes reported, 1,142 (26 percent) indicated damage to the aircraft. When classified by level of damage; 562 (13 percent) indicated the aircraft suffered minor damage; 425 (10 percent) indicated the aircraft suffered substantial damage; 124 (3 percent) reported an uncertain level of damage; and 31 (1
percent) indicated the aircraft was destroyed as a result of the strike (Table 14). Not surprisingly, a much higher percentage of terrestrial mammal strikes (26 percent) resulted in aircraft damage than did bird strikes (7 percent). Deer (1,182 strikes, of which 977 caused damage; Table 18) were involved in 27 percent of the strikes and 86 percent of the damaging strikes involving terrestrial mammals.
Although the percentage of wildlife strikes (all species) with reported damage has averaged 8 percent for the 28-year period (Table 14), this number has declined from 20 percent in 1990 to 4 percent in 2018 (Figure 11).
REPORTED NEGATIVE EFFECT-ON-FLIGHT
A negative effect-on-flight was reported in 6 percent and 18 percent of the bird and terrestrial mammal strike reports, respectively, (Table 15). Precautionary/ emergency landing after striking wildlife was the most commonly reported negative effect (6,612 incidents, 3 percent of strike reports). These precautionary landings included 262 incidents in which the pilot jettisoned
fuel (60) or burned fuel in a circling pattern (96) to lighten aircraft weight or in which an overweight landing was made (106, Table 16, Figure 12). In the 60 reported incidents in
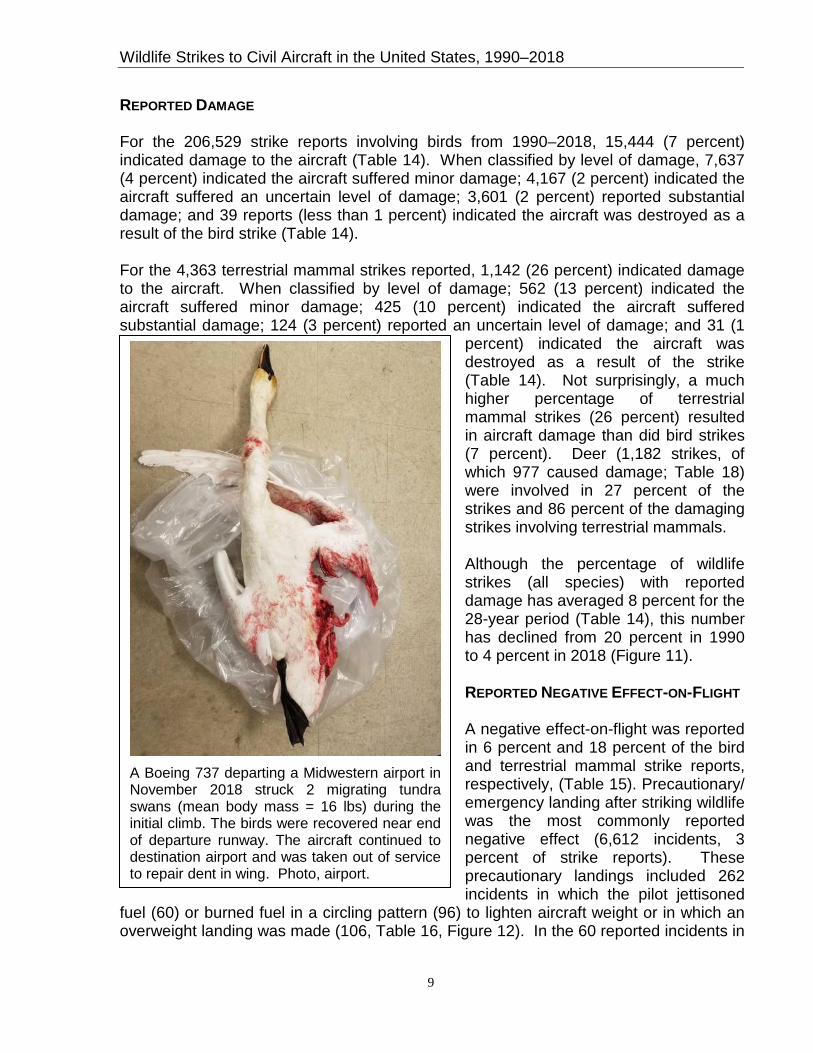
A Boeing 737 departing a Midwestern airport in November 2018 struck 2 migrating tundra swans (mean body mass = 16 lbs) during the initial climb. The birds were recovered near end of departure runway. The aircraft continued to destination airport and was taken out of service to repair dent in wing. Photo, airport.
Wildlife Strikes to Civil Aircraft in the United States, 1990–2018
10
which fuel was jettisoned, an average of 94,358 pounds (13,876 gallons) of fuel was dumped per incident (range 44 – 39,706 gallons).
Aborted take-off after striking wildlife was the second most commonly reported negative effect (2,531 incidents, 1 percent of strike reports, Table 15). These negative incidents included 556 aborted take-offs in which the pilot initiated the abort at an aircraft speed of 100 knots (115 miles per hour) or greater (Table 17). For commercial aircraft, the number of high-speed aborted take-offs has declined from a high of 25 in 2000 to a low of 6-9 in 2015-2018 (Figure 13). For general aviation aircraft, the number of high-speed aborted take-offs has averaged about 4 per year (5 in 2018).
Similar to the trend shown for the percent of strikes causing damage, the percentage of wildlife strikes (all species) with a reported negative effect-on-flight has declined from a high of 12 percent in 1996 to 4 percent in 2014-2018 (Figure 11).
WILDLIFE SPECIES INVOLVED IN STRIKES
Table 18 shows the number of reported strikes, strikes causing damage, strikes having a negative effect-on-flight, strikes involving >1 animal, the reported aircraft down time, and the reported costs by identified wildlife species, 1990 - 2018. This information can be useful in comparing the relative hazard level of bird and other wildlife species encountered during Wildlife Hazard Assessments at airports and in the development of priorities for Wildlife Hazard Management Plans (see also Dolbeer and Wright 2009 and DeVault et al, 2011).
Birds- Of the 206,529 reported bird strikes, 92,218 (45 percent) identified the bird to exact species and an additional 21,652 strikes (10 percent) identified the bird at least to species group (e.g., gull, hawk, duck). Species identification has improved from less than 20 percent in the early 1990s to around 60 percent in 2017-2018 (Figure 14). In all, 576 species of birds have been identified as struck by aircraft, and 291 of these species were reported as causing damage, 1990–2018. In 2018, 379 bird species were identified as struck by civil aircraft (Figure 14). Doves/pigeons (14 percent), raptors (13 percent), gulls (10 percent), shorebirds (9 percent), and waterfowl (5 percent) were the most frequently struck bird groups (Table 19). Doves/pigeons,
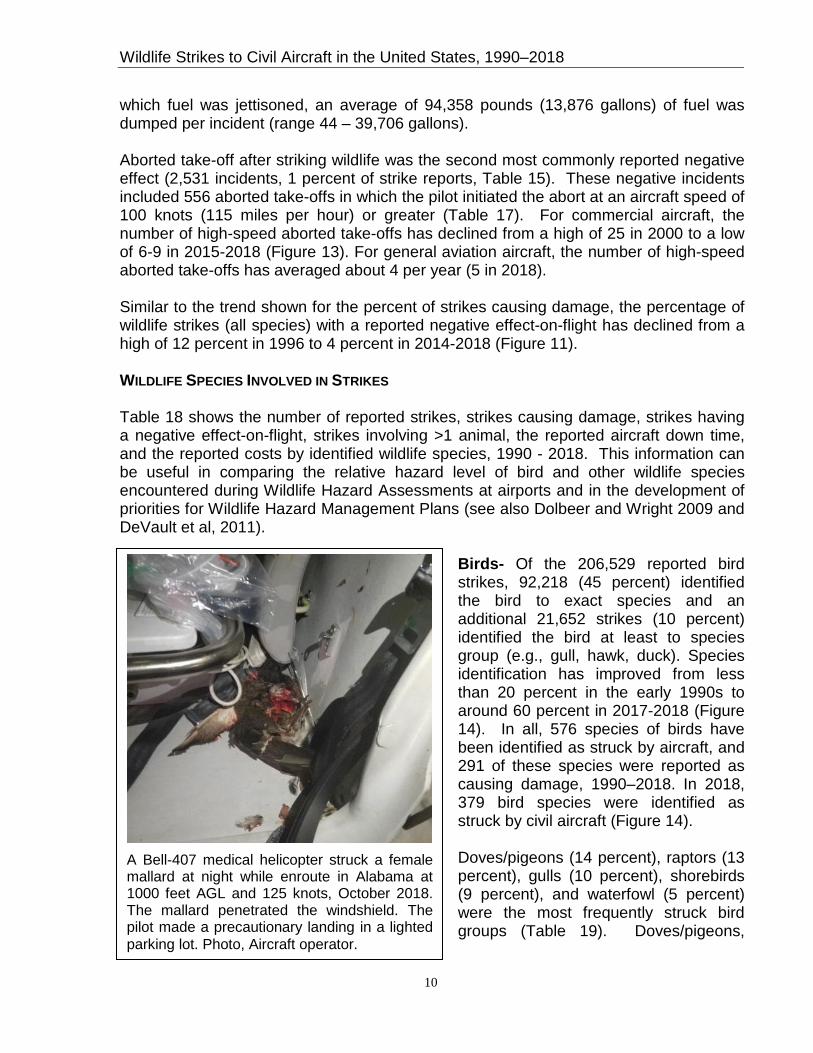
A Bell-407 medical helicopter struck a female mallard at night while enroute in Alabama at 1000 feet AGL and 125 knots, October 2018. The mallard penetrated the windshield. The pilot made a precautionary landing in a lighted parking lot. Photo, Aircraft operator.

Wildlife Strikes to Civil Aircraft in the United States, 1990–2018
11
raptors, and gulls each were involved in over 2 times more strikes than waterfowl. Waterfowl, however, were involved in 4.1 times more damaging strikes than doves/pigeons and 1.3 to 1.5 times more damaging strikes than gulls or raptors. Waterfowl comprised 28 percent of all damaging strikes in which the bird type was identified, 1990–2018. Doves/pigeons and gulls were responsible for the greatest number of bird strikes (2,693 and 2,346, respectively) that involved multiple birds.
Table 20 lists the 33 species of birds identified most frequently as struck by civil aircraft for 1990–2018 and for 2018 only. Mourning doves, American kestrels, killdeer, barn swallows, and horned larks were the 5 most frequently identified species struck by civil aircraft overall from 1990–2018 and in 2018 only. Canada geese, the 12th most frequently identified species struck overall from 1990–2018, declined to the 24th most
frequently struck species in 2018 in spite of the fact that the overall population in North America has increased over 2 fold, 1990–2018 (U.S. Fish and Wildlife Service 2018). This decline is likely related to the integrated management programs implemented in the past decade at many airports to dissuade feeding and nesting by Canada geese (Dolbeer et al. 2014, Rutledge et al. 2015).
For the 20 species of birds most frequently identified as struck by civil aircraft in 2018, there was a strong correlation (R2 = 0.96) between mean body mass and the likelihood of a strike causing damage to aircraft (Figure 15). For every 100 gram increase in body mass, there was a 1.15 percent increase in the likelihood of damage. Thus, body mass is a good predictor of relative hazard level among bird species, as noted previously by Dolbeer et al. (2000) and DeVault et al (2011).
Terrestrial mammals, bats, and reptiles- The most frequently struck terrestrial mammals were Carnivores and Artiodactyls (39 and 28 percent, respectively, Tables 18, 19). Coyotes were the most frequently struck Carnivore, and deer were the most frequently struck Artiodactyl. Artiodactyls were responsible for 90 percent of mammal strikes that resulted in damage and 70 percent of mammal strikes that involved multiple animals. In all, 46, 34 and 20 identified species of terrestrial mammals, bats, and reptiles, respectively, were reported struck; 25, 6 and 2 identified species of these respective wildlife taxa caused damage to aircraft (Table 18).
A large bird penetrated windshield of a Cirrus SR20 enroute in Florida at 1500 feet AGL and 125 knots in March 2018. The uninjured pilot made emergency landing at nearby airport. Smithsonian Feather Lab identified bird as black vulture. DNA analysis also detected raccoon in remains (from vulture digestive tract). Aircraft downtime was 700 hours. Photo, aircraft owner.
Wildlife Strikes to Civil Aircraft in the United States, 1990–2018
12
HUMAN FATALITIES AND INJURIES DUE TO WILDLIFE STRIKES
For the 29-year period, reports were received of 14 wildlife strikes that resulted in 33 human fatalities (Table 20). Six of these strikes resulting in 8 fatalities involved unidentified species of birds. Red-tailed hawks (8 fatalities), American white pelicans (5), bald eagles (4), snow geese (3), Canada geese (2), and white-tailed deer, brown-pelicans, and turkey vultures (1 each) were responsible for the other 25 fatalities. Reports were received of 244 strikes that resulted in 319 human injuries (Table 21). Waterfowl (ducks and geese; 57 strikes, 65 humans injured), vultures (36 strikes, 45 injuries), and deer (21 strikes, 30 injuries) caused 114 (58 percent) of the 196 strikes resulting in injuries in which the species or species group was identified. Waterfowl caused 65 (25 percent) of the 255 injuries in which the species or species group was identified.
AIRCRAFT DESTROYED DUE TO WILDLIFE STRIKES
For the 29-year period, reports were received of 70 aircraft destroyed or damaged beyond repair due to wildlife strikes (range of 0 to 6 per year, Tables 14, 22, Figure 16). No aircraft were lost to wildlife strikes in 2018. The majority (45; 64 percent) were small (<2,250 kg maximum take-off mass) general aviation (GA) aircraft. Terrestrial mammals (primarily white-tailed deer) were responsible for 31 (44 percent) of the incidents.
Geese (6 incidents) and vultures (4 incidents) were responsible for 42 percent of the 24 incidents involving birds in which the species or species group was identified.
Forty-one (59 percent) of the 70 wildlife strikes resulting in a destroyed aircraft occurred at GA airports, 17 occurred en route, 7 occurred at USA airports certificated for
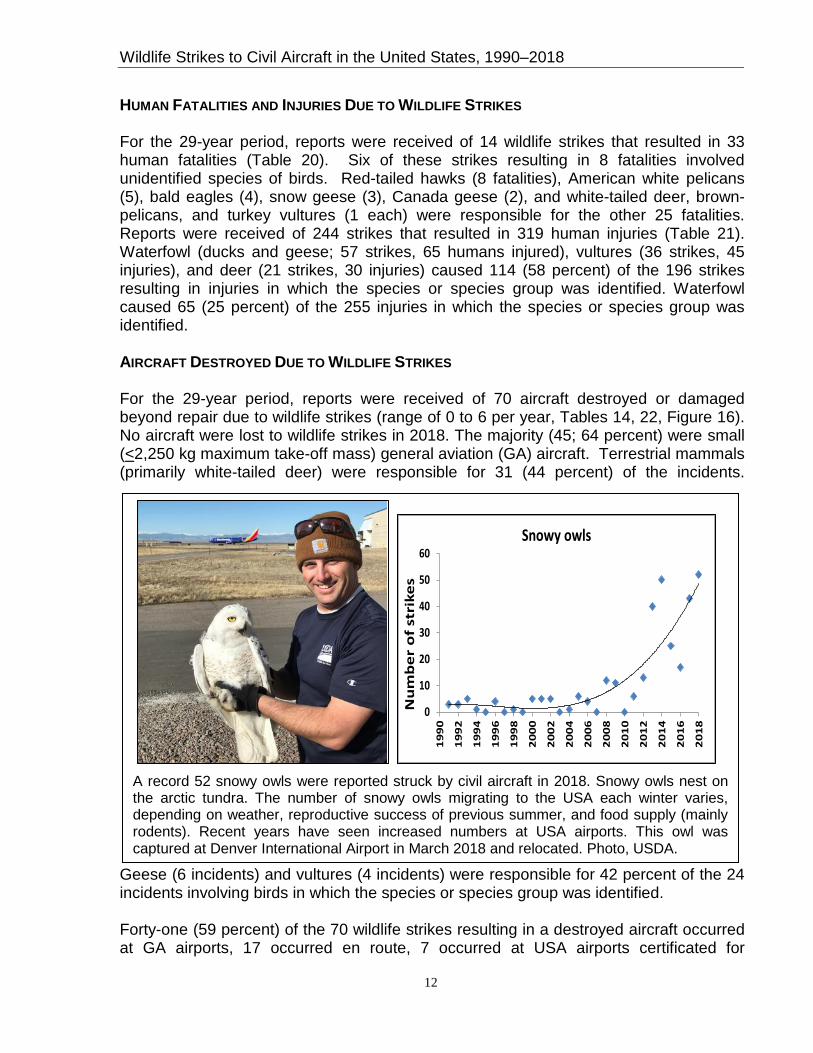
A record 52 snowy owls were reported struck by civil aircraft in 2018. Snowy owls nest on the arctic tundra. The number of snowy owls migrating to the USA each winter varies, depending on weather, reproductive success of previous summer, and food supply (mainly rodents). Recent years have seen increased numbers at USA airports. This owl was captured at Denver International Airport in March 2018 and relocated. Photo, USDA.
0
10
20
30
40
50
60
19
90
19
92
19
94
19
96
19
98
20
00
20
02
20
04
20
06
20
08
20
10
20
12
20
14
20
16
20
18
Nu
mb
er
of
stri
kes
Snowy owls
Wildlife Strikes to Civil Aircraft in the United States, 1990–2018
13
passenger service under 14 CFR Part 139, and 3 occurred in miscellaneous situations (taking off from river, herding cattle, and aerial application of pesticides). Two occurred at a foreign airport (Table 22). GA airports, often located in rural areas with inadequate fencing to exclude large mammals, face unique challenges in mitigating wildlife risks to aviation (DeVault et al. 2008; Dolbeer et al. 2008).
ECONOMIC LOSSES DUE TO WILDLIFE STRIKES
Of the 28,847 reports from 1990 – 2018 indicating the strike had an adverse effect on the aircraft and/or flight, 10,762 provided an estimate of the aircraft downtime (1,084,440 hours, mean = 100.8 hours/incident, Tables 18, 23, 24). Regarding monetary losses, 4,534 reports provided an estimate of direct aircraft repair costs ($719.0 million, mean = $158,573/incident), and 3,683 reports gave an estimate of other monetary losses ($92.2 million, mean = $25,036/incident)2. Other monetary losses include such expenses as lost revenue, the cost of putting passengers in hotels, re-scheduling aircraft, and flight cancellations.
Analysis of 14 groups of strike reports from 3 Part 139 airports certificated for passenger service and 3 airlines for the years 1991-2004 indicated that 11 to 21 percent of all strikes were reported to the FAA (Cleary et al. 2005, Wright and Dolbeer 2005). An independent analysis of strike data for a certificated airport in Hawaii in the 1990s indicated a similar reporting rate (Linnell et al. 1999). Strike reporting for general aviation (GA) aircraft at GA airports was estimated at less than 5 percent in the 1990s and early 2000s (Dolbeer et al. 2008, Dolbeer 2009). More recent analyses estimated that strike reporting for all civil aircraft combined (commercial and general aviation) at Part 139 airports had improved to 39 percent in 2004-2008 and to 47 percent in 2009-2013 (Dolbeer 2009, 2015). Strike reporting for commercial aircraft only at Part 139 airports was an estimated 79 percent in 2004-2008 and 91 percent in 2009-2013; reporting of strikes with damage was estimated at 78 percent and 93 percent for these respective time periods. In
addition to the underreporting of strikes, only 37 percent of the 28,847 reports from 1990–2018 indicating an adverse effect provided estimates of aircraft downtime. For the 16,612 reports indicating damage, 27 percent provided estimates of repair (direct) costs, 2 Costs from years prior to 2018 are inflation-adjusted to 2018 U.S. dollars.
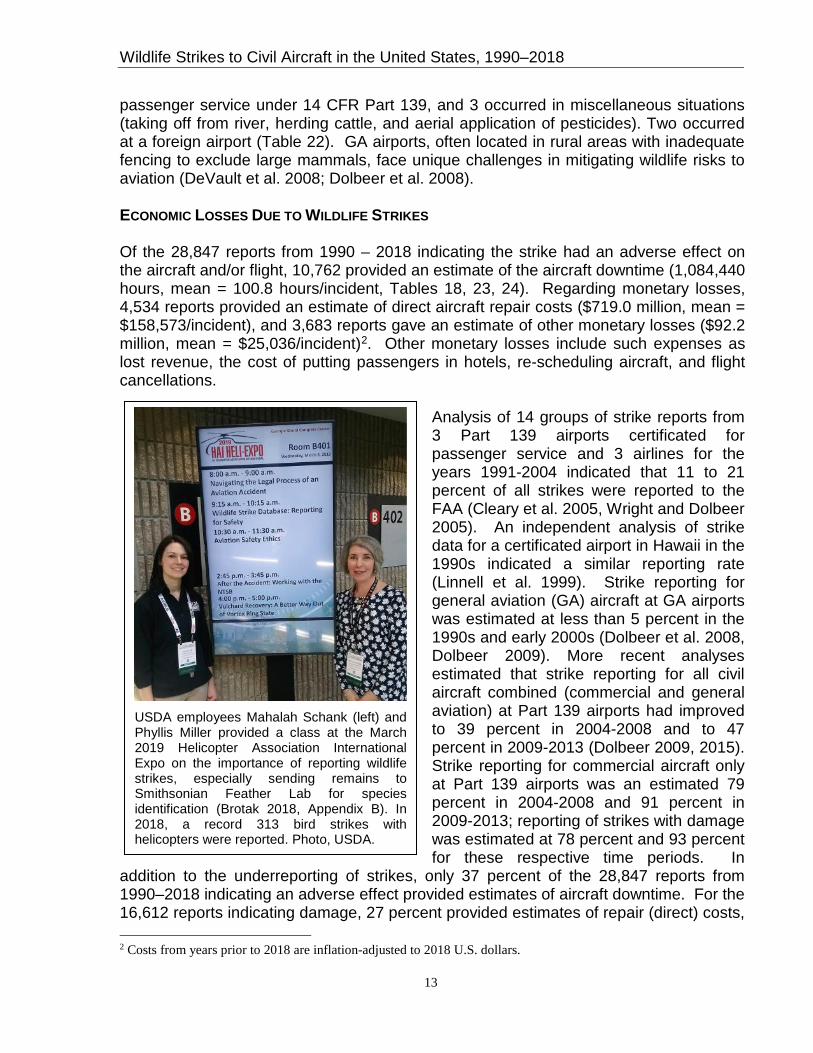
USDA employees Mahalah Schank (left) and Phyllis Miller provided a class at the March 2019 Helicopter Association International Expo on the importance of reporting wildlife strikes, especially sending remains to Smithsonian Feather Lab for species identification (Brotak 2018, Appendix B). In 2018, a record 313 bird strikes with helicopters were reported. Photo, USDA.
Wildlife Strikes to Civil Aircraft in the United States, 1990–2018
14
and 22 percent provided estimates of other (indirect) costs (these respective percentages were 28 and 39 for 2018 only, Tables 23, 24). Furthermore, some reports providing cost estimates were filed before aircraft damage and downtime had been fully assessed. As a result, the information on the number of strikes and associated costs compiled (summarized by species of wildlife struck in Table 18) is believed to significantly underestimate the economic magnitude of the problem.
Assuming (1) all 28,847 reported wildlife strikes that had an adverse effect on the aircraft and/or flight engendered similar amounts of downtime and/or monetary losses and (2) that these reports are all of the damaging strikes that occurred, then at a minimum, wildlife strikes annually cost the USA civil aviation industry, on average, 108,495 hours of aircraft downtime and $187 million in monetary losses ($154 million in direct costs and $33 million in other costs), 1990–2018 (Table 24). For 2018 only, the minimum estimates would be 95,950 hours of downtime and $92 million in direct and indirect costs. For reasons outlined above, we project that actual costs are likely 2 or more times higher than these minimum estimates.
CONCLUSIONS
The analysis of 29 years of strike data reveals the magnitude and nature of wildlife strikes with civil aircraft in the USA, and documents that progress is being made in mitigating the risk. Although wildlife strikes continue to pose an economic and safety
risk for civil aviation in the USA, management actions to mitigate these risks have been implemented at many airports, especially beginning in 2000 when the FAA’s manual Wildlife Hazard Management at Airports was initially available to airports nationwide (Cleary and Dolbeer 2005). These efforts are likely responsible for the stabilization in
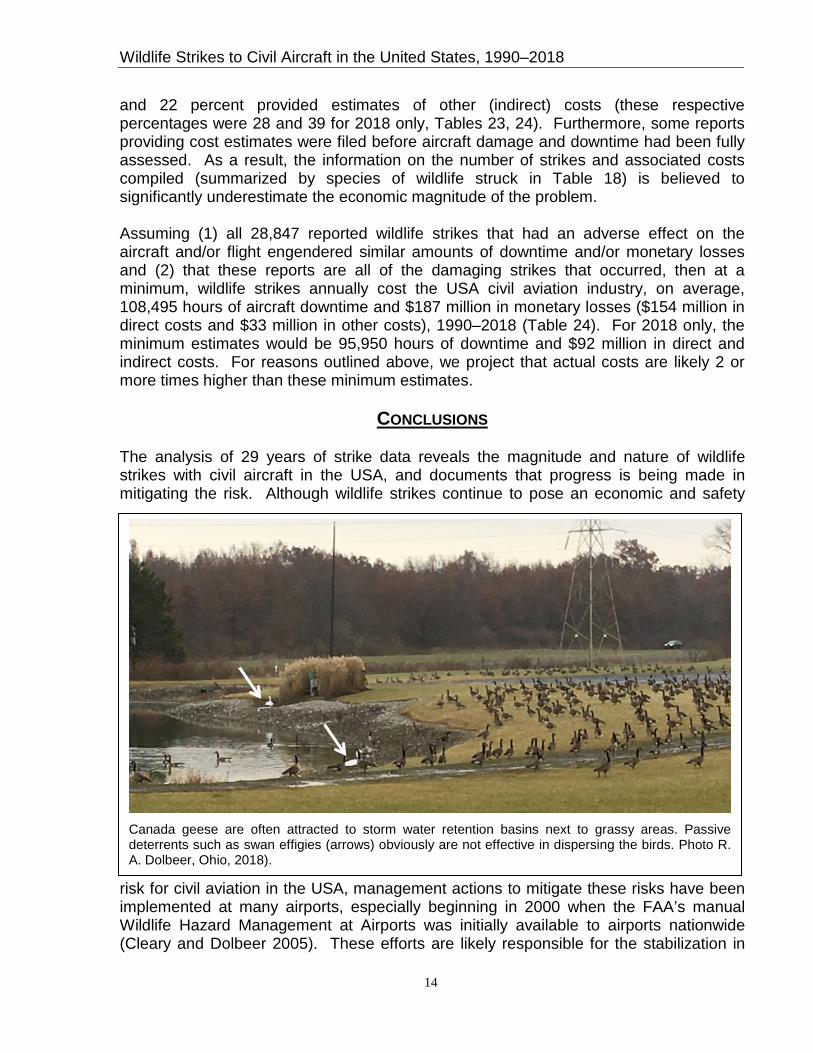
Canada geese are often attracted to storm water retention basins next to grassy areas. Passive deterrents such as swan effigies (arrows) obviously are not effective in dispersing the birds. Photo R. A. Dolbeer, Ohio, 2018).

Wildlife Strikes to Civil Aircraft in the United States, 1990–2018
15
reported strikes with damage and negative effects-on-flight from 2000-2018 for commercial aircraft (Table 1, Figures 2, 3, 4, 9, 11) in the airport environment (<1500 feet AGL) in spite of continued increases in populations of many large bird species. Examples of the work done to mitigate the risk of strikes at airports are documented in Wenning et al. 2004, DeFusco et al. 2005, Dolbeer 2006a, Human Wildlife Conflicts Journal 2009, Human-Wildlife Interactions Journal 2011, Dolbeer 2011, DeVault et al. 2013, Dolbeer et al. 2014, Rutledge et al. 2015, and Washburn 2019. As another measure of the increase in wildlife management activities, USDA Wildlife Services biologists provided assistance at 872 civil and military airports nationwide in 2018 to mitigate wildlife risks to aviation compared to only 42 airports in 1991 and 193 in 1998 (Begier et al. 2019). However, much work remains to be done to reduce wildlife strikes.
To address the problem in the airport environment, airport managers first need to assess the wildlife hazards on their airports with the help of qualified airport biologists (FAA Advisory Circular 150/5200-36B, Qualifications for Wildlife Biologist Conducting Wildlife Hazard Assessments and Training Curriculums for Airport Personnel Involved in Controlling Wildlife Hazards on Airports). They then must take appropriate actions, under the guidance of these biologists, to minimize risks posed by wildlife. Management actions should be prioritized based on the hazard level of species (Table 18, Figure 14) observed in the aircraft operating area. The manual Wildlife Hazard Management at Airports (Cleary and Dolbeer 2005), available online in English, Spanish, and French at http://wildlife.faa.gov, provides guidance for conducting wildlife hazard assessments and in developing and implementing wildlife hazard management plans.
Management efforts to reduce the risks of bird strikes have primarily focused on airports since various historical analyses of bird strike data for civil aviation have indicated the majority of strikes occur in this environment (during take-off and landing at <1,500 feet AGL (see Tables 11, 12). However, the successful mitigation efforts at Part 139-certificated airports that have stabilized or reduced damaging strikes for commercial aviation in recent years have done little to reduce strikes outside the airport environment such as occurred with US Airways Flight 1549 in 2009 (Dolbeer 2011).
Agricultural crops such as corn and soybeans often attract large flocks of blackbirds (left), geese (right), and other bird species (Linz et al. 2017) and should not be grown next to airports. Photos, R. A. Dolbeer, Ohio, Oct 2018.
Wildlife Strikes to Civil Aircraft in the United States, 1990–2018
16
To mitigate the risk for strikes beyond the airport fence, the general public and aviation community must first widen its view of wildlife management to consider habitats and land uses within 5 miles (or sometimes greater distances) of airports (Pfeiffer et al. 2018). For example, wetlands, dredge-spoil containment areas, municipal solid waste landfills, and wildlife refuges typically attract hazardous wildlife. Such land uses, as discussed in FAA Advisory Circular 150/5200-33B, Hazardous Wildlife Attractants on or Near Airports, are often incompatible with aviation safety and should either be prohibited near airports or designed and operated in a manner that minimize the attraction of hazardous wildlife (e.g., Washburn et al. 2010).
Second, the aviation community needs to broaden the view of wildlife strike risks from a ground-based wildlife management problem solely dealt with by airports to an airspace management problem that also encompasses Air Traffic Control, flight crews, and aircraft manufacturers. Long-term goals include the integration of avian radar and bird migration forecasting into airspace management for civil aviation (Nohara et al. 2011, Gerringer et al. 2016). The further development of aircraft lighting systems to enhance detection and avoidance by birds (Blackwell et al. 2012, DeVault et al. 2015, Dolbeer and Barnes 2017, Fedy 2018) is also needed as part of an integrated program.
Finally, there continues to be a need for increased and more detailed strike reporting, especially for general aviation aircraft. When reports are filed, relevant information should be provided whenever possible regarding species identification, number of wildlife struck, time and height of strike, phase of flight, and damage to aircraft components (Dolbeer 2015, see Appendix B: Reporting a Strike and Identifying Species of Wildlife Struck). A problem that is not well defined cannot be properly managed.
Wildlife Strikes to Civil Aircraft in the United States, 1990–2018
17
PART 2: FAA ACTIVITIES FOR MITIGATING WILDLIFE STRIKES In 2018, the FAA continued a multifaceted approach for mitigating wildlife strikes. This included publishing new guidance, continuing a robust research program, making improvements to the NWSD and outreach, incorporating new technology to increase and simplify strike reporting, and providing Airport Improvement Program (AIP) funding to airports to conduct Wildlife Hazard Assessments (Assessments) and develop Wildlife Hazard Management Plans (Plans). The emergency forced landing of US Airways Flight 1549 Airbus 320 into the Hudson River on January 15, 2009 demonstrated to the world the severity of aircraft collisions with birds and other wildlife. Migratory Canada geese were ingested into both engines at 3:27.11 p.m. at an altitude of 2,818 feet above ground level (AGL) and 4.5 miles north-northwest of the approach end of runway 22 at La Guardia International Airport (LGA). Three minutes 49 seconds later the aircraft successfully ditched into the Hudson River with 150 passengers and 5 crew; there were no fatalities. Landmark events such as this necessitate outside scrutiny and comprehensive internal evaluations to insure optimal guidance, compliance and risk reduction moving forward. Since the first Advisory Circular 150 / 5200-1 Bird Hazards to Aviation, Bird Hazard Research published March 1, 1965, these types of evaluations have allowed the Federal Aviation Administration (FAA) wildlife program to systematically improve its oversight to reduce risks within the safest aerospace system in the world. The results from reviews conducted post-1549 have enhanced existing regulations and provided beneficial layers of expansion throughout other key FAA wildlife-related areas (e.g., Data collection and analysis, Partnerships, Research, and Outreach). In the 10-year span 2009 – 2018, approximately $350 million of Airport Improvement Program (AIP) funds have been allocated for wildlife-related projects such as Wildlife Hazard Assessments (Assessments), Wildlife Hazard Management Plans (Plans) and perimeter fencing. All Part 139 certificated airports have successfully completed Assessments followed by Plans while 124 of the largest general aviation (GA) airports have voluntarily completed Assessments. External reviews of the FAA wildlife program resulted in helpful recommendations from the National Safety Transportation Board (NTSB) and the DOT Office of Inspector General (OIG). The four recommendations issued by the NTSB in 2009 and 2010 respectively, have been successfully closed. Two of the recommendations were generated from a 2008 fatal accident involving a Cessna 500 that collided with a flock of white pelicans near the Wiley Post Airport in Oklahoma while the remaining recommendations addressed concerns raised from the US Airways Flight 1549 incident. Ten additional recommendations were submitted on August 22, 2012 to the FAA within the OIG Audit Report: “FAA Has Not Effectively Implemented Its Wildlife Hazard Mitigation Program.” These recommendations covered a wide range of subjects including FAA oversight and enforcement, our policies and guidance for monitoring, reporting, and mitigating wildlife hazards, interagency cooperation, personnel training,
Wildlife Strikes to Civil Aircraft in the United States, 1990–2018
18
communication, and mandatory strike reporting. The last of these extensive recommendations received final closure August 1, 2016.
FAA Guidance Title 14 Code of Federal Regulations, part 139.337, Wildlife Hazard Management, is supported by non-regulatory guidance such as Advisory Circulars (ACs) and CertAlerts. Advisory Circular 150/ 5200- 38 - Protocol for the Conduct and Review of Wildlife Hazard Site Visits, Wildlife Hazard Assessments, and Wildlife Hazard Management Plans was published August 20, 2018. This new AC defines the minimum acceptable standards for the conduct and preparation of Site Visits, Assessments and Plans. AC 150/5200-38 also clarifies the NEPA process for projects included in an airport’s WHMP and provides protocol for the approval (or partial approval) of Plans with regard to NEPA and other environmental laws. The AC gives Airports and Biologists checklists for Assessments and Plans and provides Airport Certification Safety Inspectors guidelines/ templates to review those documents. AC 150/5200-36B Qualifications for Wildlife Biologist Conducting Wildlife Hazard Assessments and Training Curriculums for Airport Personnel Involved in Controlling Wildlife Hazards on Airports was last updated January 24, 2019. This latest version provides for an alternative field experience option of Continual Monitoring to aid Qualified Airport Wildlife Biologists (QAWB) candidates in an era where all certificated airports have finished their initial Assessments and Plans. CertAlerts contain timely information, updates, notices of regulatory changes, and helpful news to airport operators. The recent wildlife-related CertAlert 16-03 Recommended Wildlife Exclusion Fencing (August 2016) contains airfield exclusion methods for deer and other large mammals.
Wildlife Hazard Assessments and Wildlife Hazard Management Plans The FAA encouraged all certificated airports to conduct Assessments and develop Plans regardless if a triggering event under 14 CFR Part 139 had been experienced. To date, 100% of all required Part 139 airports have completed an Assessment and Plan. Joint-use facilities that maintain a Bird/ wildlife Aircraft Strike Hazard (BASH) Plan also completed Assessments as a foundation for their BASH Plans. Wildlife Hazard Assessments are critical because they will allow an airport to: Identify trends in wildlife use of the airport (habitat preferences, seasonal
composition and abundance of wildlife species, geography of strikes, seasonality of strikes, time and phase of flight of strikes, etc.)
Prevent future strikes through operational changes, habitat (attractant) modifications, customized harassment, and/ or species removal
Evaluate the overall risk level of wildlife strikes and the efficacy of the airport’s wildlife hazard mitigation program (e.g., determine redundancy of species specific hazards, monitor reduction of onsite damaging strikes, monitor wildlife program communication and response efficiency, and improve overall program through annual review).

Wildlife Strikes to Civil Aircraft in the United States, 1990–2018
19
An Assessment provides fundamental wildlife and habitat information for an effective, airport-specific Plan. The Plan outlines a plan of action to minimize the risk to aviation safety, airport structures or equipment, or human health posed by populations of hazardous wildlife on and around an airport. To be effective, Plans must not only be fully implemented but routinely evaluated and modified to address an airport’s changing environment, hazards and capabilities. The FAA supports completion of Assessments and Plans by providing financial assistance from the AIP. The FAA established a program and schedule that outlined the implementation of Assessments or Site Visits based on the number of operations and based jet aircraft at the GA airport. To date, 124 airports (91%) of the 136 GA airports identified with the greatest need for wildlife data collection have conducted either Assessments or Site Visits. To assist the GA airports in conducting Assessments, we will continue to make AIP grant funds available to them. Strike Reporting Wildlife strikes continue to capture media attention. While impacted pilots and airports are reporting strikes, they might not know the critical role their reports play in understanding wildlife issues and developing wildlife policies. The FAA developed an educational video to provide guidance to pilots and airport operators on the role of wildlife strike reporting in preventing aviation accidents caused by birds and other animals. The video — titled the 2015 Wildlife Hazard Management and Strike Reporting Update — is the second offering in the FAA’s Office of Airports ongoing web-based series, http://www.faa.gov/airports/safety-video-series/. The video highlights the benefits of the collection of wildlife strike data since the FAA began compiling reports submitted by airports, pilots, controllers, and other parties in its NWSD. The FAA has continued to update and improve the existing NWSD website (http://wildlife.faa.gov) to make it more user-friendly and to allow more advanced data mining. Search fields enable users to find data on specific airports, airlines, aircraft and engine types, as well as damage incurred, date of strike, species struck, and state without having to download the entire database. Similarly, the FAA has continued modifications to provide in-depth wildlife guidance at http://www.faa.gov/airports/airport_safety/wildlife. This guidance includes Advisory Circulars and CertAlerts, FAA NWSD analysis reports, the manual Wildlife Hazard Management at Airports, Airport Cooperative Research Program (ACRP) wildlife reports, hazardous wildlife mitigation and habitat attractants, Bird Hazard Mitigation Systems (e.g., AHAS and BAM), Frequently Asked Questions and Answers on Wildlife Strikes, and more. The FAA also developed software to make strike reporting easier. Now, anyone who needs to report a wildlife strike can do so via the new web site or their mobile devices at http://www.faa.gov/mobile. When airline and airport employees report a wildlife strike, the information is automatically sent to the FAA’s wildlife strike database.
Wildlife Strikes to Civil Aircraft in the United States, 1990–2018
20
“Excellence in Strike Reporting” Award 2014 was the inaugural year for the Sandy Wright / Richard Dolbeer Excellence in Strike Reporting award. The award honors the incomparable dedication of Dr. Richard Dolbeer and Sandy Wright; each being exceptional in the management of the National Wildlife Strike Database (NWSD) since the FAA first contracted the USDA in 1995 to oversee the collection, quality control, analysis and summation of strike reports. The Sandy Wright / Richard Dolbeer Excellence in Strike Reporting award recognizes those airports that have exhibited a noteworthy strike reporting program. The number of USA airports with strikes reported increased from 335 in 1990 to a record 714 in 2018. The 714 airports with strikes reported were comprised of 423 airports certificated for passenger service under 14 CFR Part 139 and 291 GA aviation airports. From 1990 - 2018, strikes have been reported from 2,047 USA airports. The idea was to recognize the Top 5 reporting programs in both the Certificated and GA airport categories. The criteria for determining which airports will make the initial cuts are objective and include both quantity and quality of strike data (*keep in mind though that an airport will not win based solely on number of strikes reported). The criteria include but are not limited to:
1. Number of reports filed and completeness of reports 3. Percentage of reports identified to species 4. Percentage of reports filed on-line 5. Timeliness of reports being submitted 6. Remains collected when available or necessary 7. Consistency filing reports
Further evaluation of the finalist strike reporting programs may include: 1. Modification of filed reports online when new information is discovered 2. Airport follows up with airline or engine manufacturer for missing information 3. Airport has someone on “Notification” list to receive notice when strikes are filed for their airport In 2017, the Part 139 certificated airport winner was Portland International Airport (PDX) and the General Aviation representative was Henderson Field, Midway Atoll (MDY). For their commitment to the identification and documentation of wildlife / aircraft strike information, the FAA proudly recognizes the superior strike reporting programs at Seattle / Tacoma International Airport (SEA) and Page Field (FMY) as the winners of the 2018 Sandy Wright / Richard Dolbeer Excellence in Strike Reporting award. The bar

Wildlife Strikes to Civil Aircraft in the United States, 1990–2018
21
remains high; and these airports, as well as each of the finalists, well deserve the recognition. Congratulations.
AWARD WINNERS
PART 139 AIRPORTS GA AIRPORTS
2014 DALLAS / FORT WORTH - DFW MORRISTOWN - MMU
2015 LAGUARDIA - LGA VAN NUYS - VNY
2016 MINNEAPOLIS / ST. PAUL - MSP CENTENNIAL - APA
2017 PORTLAND - PDX HENDERSON FIELD (MIDWAY ATOLL) - MDY
2018 SEATTLE / TACOMA - SEA PAGE FIELD - FMY
Airport Cooperative Research Program (ACRP) Reports The FAA assisted with the development of two new Airport Cooperative Research Program (ACRP) reports to aid airports with the mitigation of wildlife hazards. The reports (ACRP Synthesis 92: Airport Waste Management and Recycling Practices and ACRP Research Report 174 Guidebook and Primer) were published in 2018. Other recent reports published were ACRP Report 122 Innovative Airport Responses to Threatened / Endangered Species (2015), ACRP Report 125 Balancing Airport Stormwater and Bird Hazard Management (2015) and ACRP Report 145 Applying an SMS Approach to Wildlife Hazard Management (2015). These, and other wildlife / aviation reports are available from the Transportation Research Board of the National Academies (TRB) at http://www.trb.org/Publications/Publications.aspx.
Wildlife Hazard Mitigation Research
FAA research funds dedicated over $25 million within the last decade to better understand the capabilities of advanced detection and monitoring systems such as avian radars, Foreign Object Debris (FOD) radars and infrared / electro-optical scanning systems. Other research initiatives included wildlife control techniques, avian visual acuity and aircraft lighting, habitat management, Canada goose movement analyses, capture and relocation efficacy of raptors, DNA and molecular identifications, and systems integration (Wildlife Surveillance Concept -WiSC) which aims to determine the compatibility of avian radar or similar monitoring technologies warning notice in the Air Traffic Controller’s reach. The research efforts designed to improve wildlife management techniques and practices on and near airports include: Alternative habitat management strategies to reduce attraction to airports of
hazardous wildlife species

Wildlife Strikes to Civil Aircraft in the United States, 1990–2018
22
Techniques for restricting access of hazardous wildlife species to attractive features like storm water ponds
Technologies for harassing and deterring hazardous species Movement patterns of red-tailed hawks following translocation from an airport Evaluation of translocation as a management tool for American kestrels at
airports Aircraft-mounted lighting systems to enhance bird detection and avoidance of
aircraft Landscape-level analysis of land cover and birdstrike rate across airports
Bird Strike Committee USA The FAA participates in the Bird Strike Committee-USA as part of its continued public outreach and education effort to increase awareness within the aviation community about wildlife hazards. A Memorandum of Understanding between the FAA and the BSC USA was signed May 2012 to formalize this cooperative relationship. The BSC USA Steering Committee is comprised of 25 diverse, subject-matter experts representing Pilots, Airlines, Airframe and Engine Manufacturers, Wildlife Biologists, Airport Managers, Department of Defense personnel, ATC Personnel, Certification Inspectors, Research, Private Sector and Government Personnel. The BSC USA website http://www.birdstrike.org/ provides many useful resources, links and a quarterly newsletter to the industry and public.
Commercial Aviation Safety Team (CAST) In 2010, the FAA, USDA and the Air Transport Association (now Airlines for America) requested that the Commercial Aviation Safety Team (CAST) formally charter a Joint Safety Analysis Team or similar effort to review the wildlife strike/ aviation problem. CAST determined that the Joint Implementation Measurement and Data Analysis Team (JIMDAT) group would track wildlife strikes and provide periodic monitoring reports to CAST concerning wildlife strikes. During a February 2013 CAST meeting, CAST fully approved JIMDAT “Option 2” Birdstrike monitoring proposal. This included reporting fatality risk values at appropriate intervals and trending egregious events to provide confidence. Egregious event categories to monitor are: A/C Controllability, Fire, Multiple Systems Damaged, High Risk RTO, Loss of/Unreliable Cockpit Data, Cockpit Intrusion (Risk of Pilot Incapacitation), and Encountered Many Large Birds. Event categories were chosen by a SME panel as safety significant event precursors.
Performance Metrics Starting in 2013 the FAA adopted the following performance metrics that will measure program efficacy under a voluntary strike reporting environment where the absolute number of bird strikes is not known. These three performance metrics allow the FAA to monitor multiple factors that affect strike reporting and overall strike reporting trends and
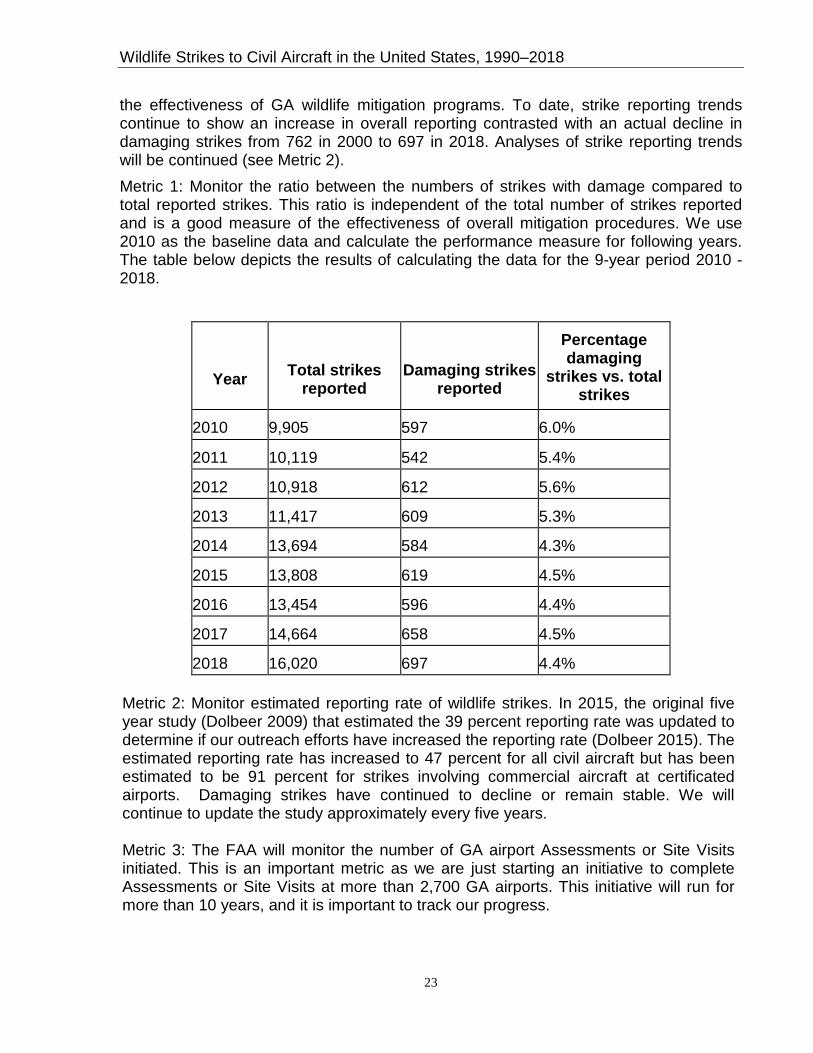
Wildlife Strikes to Civil Aircraft in the United States, 1990–2018
23
the effectiveness of GA wildlife mitigation programs. To date, strike reporting trends continue to show an increase in overall reporting contrasted with an actual decline in damaging strikes from 762 in 2000 to 697 in 2018. Analyses of strike reporting trends will be continued (see Metric 2). Metric 1: Monitor the ratio between the numbers of strikes with damage compared to total reported strikes. This ratio is independent of the total number of strikes reported and is a good measure of the effectiveness of overall mitigation procedures. We use 2010 as the baseline data and calculate the performance measure for following years. The table below depicts the results of calculating the data for the 9-year period 2010 - 2018.
Year
Total strikes
reported
Damaging strikes
reported
Percentage damaging
strikes vs. total strikes
2010 9,905 597 6.0%
2011 10,119 542 5.4%
2012 10,918 612 5.6%
2013 11,417 609 5.3%
2014 13,694 584 4.3%
2015 13,808 619 4.5%
2016 13,454 596 4.4%
2017 14,664 658 4.5%
2018 16,020 697 4.4%
Metric 2: Monitor estimated reporting rate of wildlife strikes. In 2015, the original five year study (Dolbeer 2009) that estimated the 39 percent reporting rate was updated to determine if our outreach efforts have increased the reporting rate (Dolbeer 2015). The estimated reporting rate has increased to 47 percent for all civil aircraft but has been estimated to be 91 percent for strikes involving commercial aircraft at certificated airports. Damaging strikes have continued to decline or remain stable. We will continue to update the study approximately every five years.
Metric 3: The FAA will monitor the number of GA airport Assessments or Site Visits initiated. This is an important metric as we are just starting an initiative to complete Assessments or Site Visits at more than 2,700 GA airports. This initiative will run for more than 10 years, and it is important to track our progress.

Wildlife Strikes to Civil Aircraft in the United States, 1990–2018
24
The 16,020 documented strikes in 2018 equates to roughly 44 wildlife strikes every day, of which only about 4% are damaging. In 2018, there were 697 damaging strikes; this averages about 2 damaging strikes per day or about 1 per 35,000 of the estimated 70,000 daily aircraft movements over US airspace. Overall, 82% of strikes occur at or below 1,500 feet AGL. This altitude falls within the 5-mile separation distance around airports recommended for wildlife attractants, meaning that on-ground wildlife mitigation activities out to 5 miles can have a positive effect on risk reduction for 82% of all wildlife strikes. Wildlife strikes are rare events that occur every day. Although it is impossible to eliminate all strikes at all times, comprehensive assessment, planning and management techniques have successfully mitigated damaging strikes on or near airports. Combined with systematic evaluation and adaptation of techniques, safety can be increased one less strike at a time.
Wildlife Strikes to Civil Aircraft in the United States, 1990–2018
25
LITERATURE CITED
Aeroweb. 2019. Forecast International’s Aerospace Portal. U.S. Commercial Aircraft Fleet 2017. http://www.fi-aeroweb.com/US-Commercial-Aircraft-Fleet.html
Begier, M. J., R. A. Dolbeer, and J. E. Washburn. 2019. Protecting the flying public and minimizing economic losses within the aviation industry: assistance provided by USDA-APHIS-Wildlife Services to reduce wildlife hazards to aviation, fiscal year 2018. Special report, U.S. Department of Agriculture, Animal and Plant Health Inspection Service, Wildlife Services. Washington, D.C., USA. 22 pages.
Biondi, K. M., J. L. Belant, J. A. Martin, T. L. DeVault, and G. Wang. 2011. White-tailed deer incidents with U.S. civil aircraft. Wildlife Society Bulletin 35(3):303–309.
Blackwell, B. F., T. L. DeVault ,T. W. Seamans, S. L. Lima, P. Baumhardt, and E. Fernández-Juricic. 2012. Exploiting avian vision with aircraft lighting to reduce bird strikes. Journal of Applied Ecology 49(4):758-766.
Bogaisky, J. 2019. Blood in the sky: 10 years after the miracle on the Hudson, bird strikes remain an unsolved danger for aviation. Forbes Media. January 14, 2019. https://www.forbes.com/sites/jeremybogaisky/2019/01/14/blood-in-the-sky-10-years-after-the-miracle-on-the-hudson-bird-strikes-remain-an-unsolved-danger-for-aviation/#1722771c7e2d.
Brotak, E. 2018. FAA: 665 helicopter bird strikes over the last 3 years. Vertical magazine. October-November: 48.
Burger, J. 1983. Jet aircraft noise and bird strikes: why more birds are being hit. Environmental Pollution (Series A) 30:143–152.
Cleary, E. C., and R. A. Dolbeer. 2005. Wildlife hazard management at airports, a manual for airport operators. Second edition. Federal Aviation Administration, Office of Airport Safety and Standards, Washington, D.C., USA. 348 pages. (http://wildlife.faa.gov).
Cleary, E. C., R. A. Dolbeer, and S. E. Wright. 2005. Wildlife strikes to civil aircraft in the United States, 1990-2004. U.S. Department of Transportation, Federal Aviation Administration, Office of Airport Safety and Standards, Serial Report No. 11. Washington, D.C., USA. 56 pages.
DeFusco, R. P., M. J. Hovan, J. T. Harper, and K. A. Heppard. 2005. North American Bird Strike Advisory System, Strategic Plan. Institute for Information Technology Applications, U.S. Air Force Academy, Colorado Springs, Colorado, USA. 31 pages.
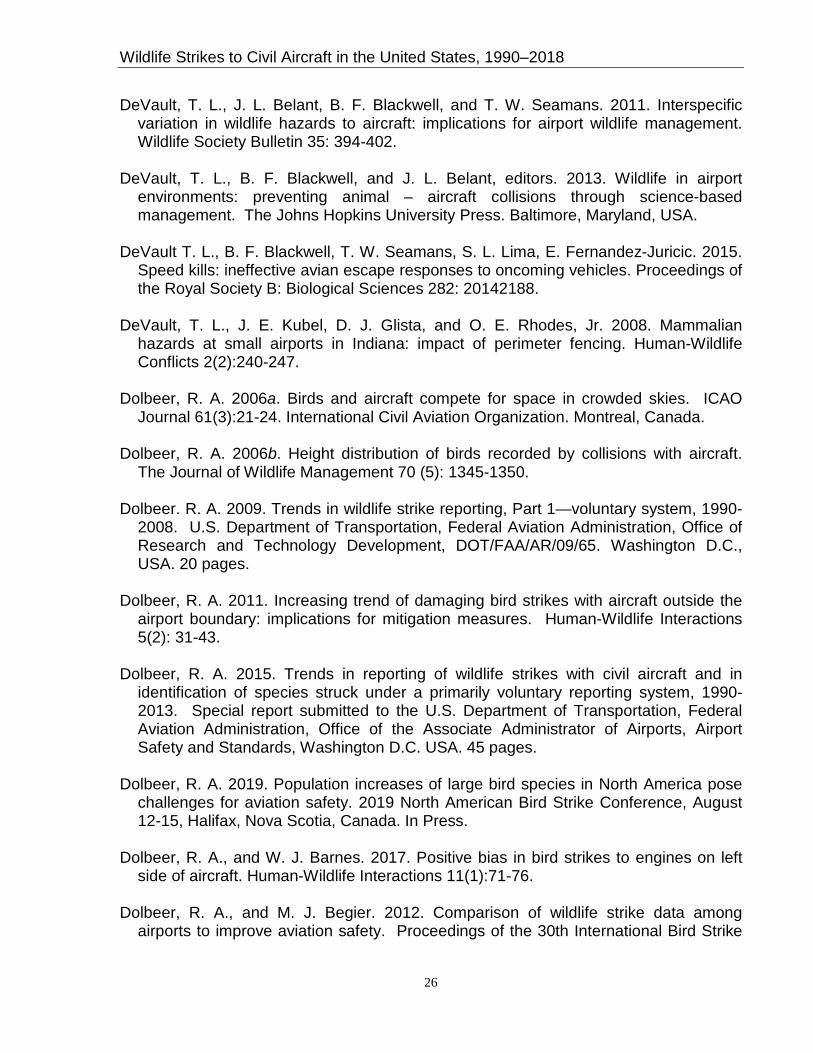
Wildlife Strikes to Civil Aircraft in the United States, 1990–2018
26
DeVault, T. L., J. L. Belant, B. F. Blackwell, and T. W. Seamans. 2011. Interspecific variation in wildlife hazards to aircraft: implications for airport wildlife management. Wildlife Society Bulletin 35: 394-402.
DeVault, T. L., B. F. Blackwell, and J. L. Belant, editors. 2013. Wildlife in airport environments: preventing animal – aircraft collisions through science-based management. The Johns Hopkins University Press. Baltimore, Maryland, USA.
DeVault T. L., B. F. Blackwell, T. W. Seamans, S. L. Lima, E. Fernandez-Juricic. 2015. Speed kills: ineffective avian escape responses to oncoming vehicles. Proceedings of the Royal Society B: Biological Sciences 282: 20142188.
DeVault, T. L., J. E. Kubel, D. J. Glista, and O. E. Rhodes, Jr. 2008. Mammalian hazards at small airports in Indiana: impact of perimeter fencing. Human-Wildlife Conflicts 2(2):240-247.
Dolbeer, R. A. 2006a. Birds and aircraft compete for space in crowded skies. ICAO Journal 61(3):21-24. International Civil Aviation Organization. Montreal, Canada.
Dolbeer, R. A. 2006b. Height distribution of birds recorded by collisions with aircraft. The Journal of Wildlife Management 70 (5): 1345-1350.
Dolbeer. R. A. 2009. Trends in wildlife strike reporting, Part 1—voluntary system, 1990-2008. U.S. Department of Transportation, Federal Aviation Administration, Office of Research and Technology Development, DOT/FAA/AR/09/65. Washington D.C., USA. 20 pages.
Dolbeer, R. A. 2011. Increasing trend of damaging bird strikes with aircraft outside the airport boundary: implications for mitigation measures. Human-Wildlife Interactions 5(2): 31-43.
Dolbeer, R. A. 2015. Trends in reporting of wildlife strikes with civil aircraft and in identification of species struck under a primarily voluntary reporting system, 1990-2013. Special report submitted to the U.S. Department of Transportation, Federal Aviation Administration, Office of the Associate Administrator of Airports, Airport Safety and Standards, Washington D.C. USA. 45 pages.
Dolbeer, R. A. 2019. Population increases of large bird species in North America pose challenges for aviation safety. 2019 North American Bird Strike Conference, August 12-15, Halifax, Nova Scotia, Canada. In Press.
Dolbeer, R. A., and W. J. Barnes. 2017. Positive bias in bird strikes to engines on left side of aircraft. Human-Wildlife Interactions 11(1):71-76.
Dolbeer, R. A., and M. J. Begier. 2012. Comparison of wildlife strike data among airports to improve aviation safety. Proceedings of the 30th International Bird Strike
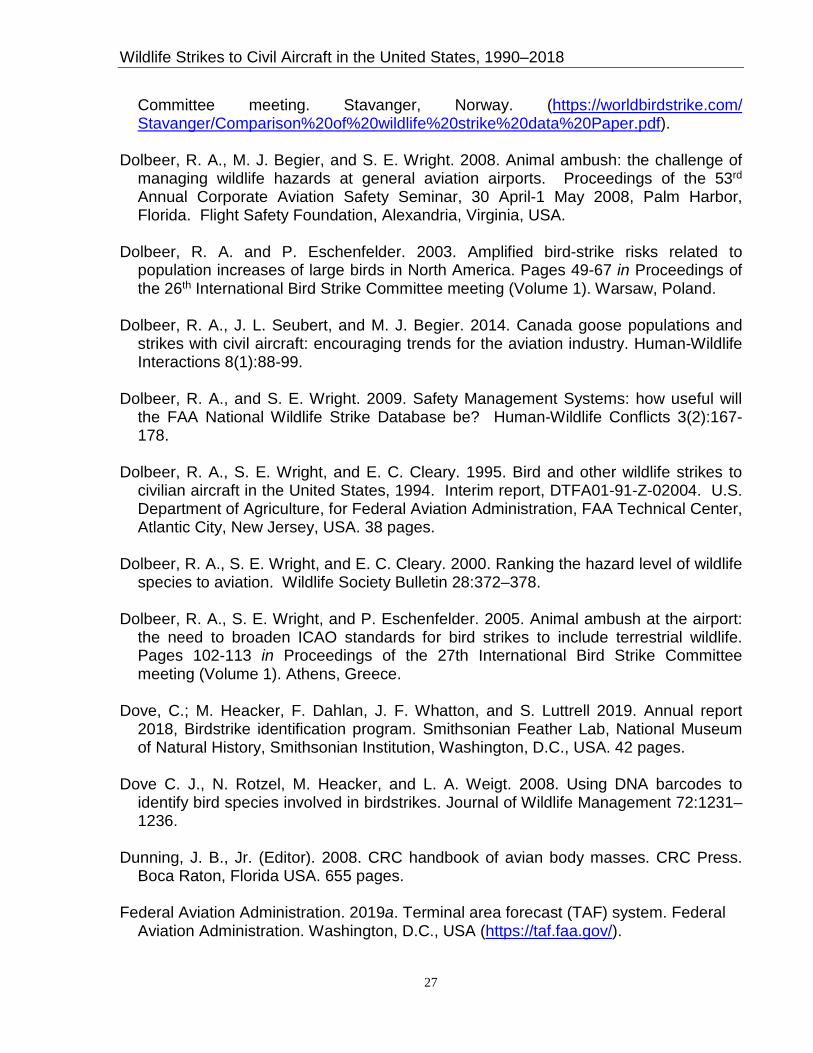
Wildlife Strikes to Civil Aircraft in the United States, 1990–2018
27
Committee meeting. Stavanger, Norway. (https://worldbirdstrike.com/ Stavanger/Comparison%20of%20wildlife%20strike%20data%20Paper.pdf).
Dolbeer, R. A., M. J. Begier, and S. E. Wright. 2008. Animal ambush: the challenge of managing wildlife hazards at general aviation airports. Proceedings of the 53rd Annual Corporate Aviation Safety Seminar, 30 April-1 May 2008, Palm Harbor, Florida. Flight Safety Foundation, Alexandria, Virginia, USA.
Dolbeer, R. A. and P. Eschenfelder. 2003. Amplified bird-strike risks related to population increases of large birds in North America. Pages 49-67 in Proceedings of the 26th International Bird Strike Committee meeting (Volume 1). Warsaw, Poland.
Dolbeer, R. A., J. L. Seubert, and M. J. Begier. 2014. Canada goose populations and strikes with civil aircraft: encouraging trends for the aviation industry. Human-Wildlife Interactions 8(1):88-99.
Dolbeer, R. A., and S. E. Wright. 2009. Safety Management Systems: how useful will the FAA National Wildlife Strike Database be? Human-Wildlife Conflicts 3(2):167-178.
Dolbeer, R. A., S. E. Wright, and E. C. Cleary. 1995. Bird and other wildlife strikes to civilian aircraft in the United States, 1994. Interim report, DTFA01-91-Z-02004. U.S. Department of Agriculture, for Federal Aviation Administration, FAA Technical Center, Atlantic City, New Jersey, USA. 38 pages.
Dolbeer, R. A., S. E. Wright, and E. C. Cleary. 2000. Ranking the hazard level of wildlife species to aviation. Wildlife Society Bulletin 28:372–378.
Dolbeer, R. A., S. E. Wright, and P. Eschenfelder. 2005. Animal ambush at the airport: the need to broaden ICAO standards for bird strikes to include terrestrial wildlife. Pages 102-113 in Proceedings of the 27th International Bird Strike Committee meeting (Volume 1). Athens, Greece.
Dove, C.; M. Heacker, F. Dahlan, J. F. Whatton, and S. Luttrell 2019. Annual report 2018, Birdstrike identification program. Smithsonian Feather Lab, National Museum of Natural History, Smithsonian Institution, Washington, D.C., USA. 42 pages.
Dove C. J., N. Rotzel, M. Heacker, and L. A. Weigt. 2008. Using DNA barcodes to identify bird species involved in birdstrikes. Journal of Wildlife Management 72:1231–1236.
Dunning, J. B., Jr. (Editor). 2008. CRC handbook of avian body masses. CRC Press. Boca Raton, Florida USA. 655 pages.
Federal Aviation Administration. 2019a. Terminal area forecast (TAF) system. Federal Aviation Administration. Washington, D.C., USA (https://taf.faa.gov/).
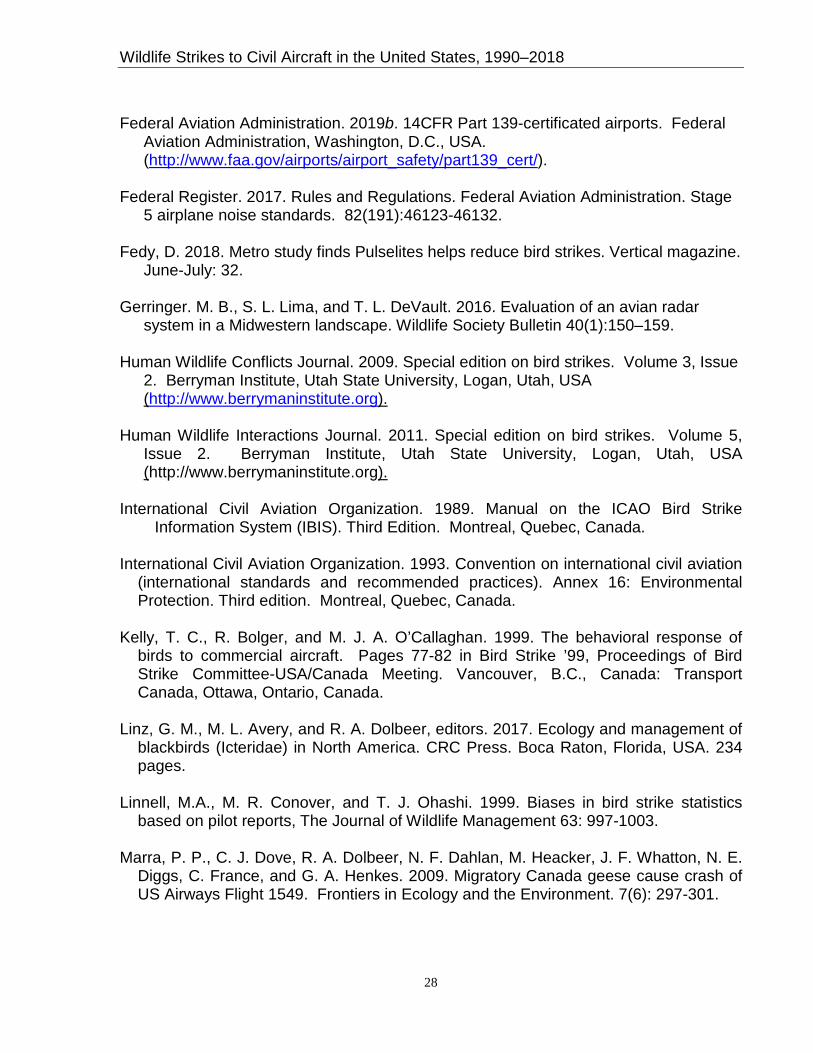
Wildlife Strikes to Civil Aircraft in the United States, 1990–2018
28
Federal Aviation Administration. 2019b. 14CFR Part 139-certificated airports. Federal Aviation Administration, Washington, D.C., USA. (http://www.faa.gov/airports/airport_safety/part139_cert/).
Federal Register. 2017. Rules and Regulations. Federal Aviation Administration. Stage 5 airplane noise standards. 82(191):46123-46132.
Fedy, D. 2018. Metro study finds Pulselites helps reduce bird strikes. Vertical magazine. June-July: 32.
Gerringer. M. B., S. L. Lima, and T. L. DeVault. 2016. Evaluation of an avian radar system in a Midwestern landscape. Wildlife Society Bulletin 40(1):150–159.
Human Wildlife Conflicts Journal. 2009. Special edition on bird strikes. Volume 3, Issue 2. Berryman Institute, Utah State University, Logan, Utah, USA (http://www.berrymaninstitute.org).
Human Wildlife Interactions Journal. 2011. Special edition on bird strikes. Volume 5, Issue 2. Berryman Institute, Utah State University, Logan, Utah, USA (http://www.berrymaninstitute.org).
International Civil Aviation Organization. 1989. Manual on the ICAO Bird Strike Information System (IBIS). Third Edition. Montreal, Quebec, Canada.
International Civil Aviation Organization. 1993. Convention on international civil aviation (international standards and recommended practices). Annex 16: Environmental Protection. Third edition. Montreal, Quebec, Canada.
Kelly, T. C., R. Bolger, and M. J. A. O’Callaghan. 1999. The behavioral response of birds to commercial aircraft. Pages 77-82 in Bird Strike ’99, Proceedings of Bird Strike Committee-USA/Canada Meeting. Vancouver, B.C., Canada: Transport Canada, Ottawa, Ontario, Canada.
Linz, G. M., M. L. Avery, and R. A. Dolbeer, editors. 2017. Ecology and management of blackbirds (Icteridae) in North America. CRC Press. Boca Raton, Florida, USA. 234 pages.
Linnell, M.A., M. R. Conover, and T. J. Ohashi. 1999. Biases in bird strike statistics based on pilot reports, The Journal of Wildlife Management 63: 997-1003.
Marra, P. P., C. J. Dove, R. A. Dolbeer, N. F. Dahlan, M. Heacker, J. F. Whatton, N. E. Diggs, C. France, and G. A. Henkes. 2009. Migratory Canada geese cause crash of US Airways Flight 1549. Frontiers in Ecology and the Environment. 7(6): 297-301.
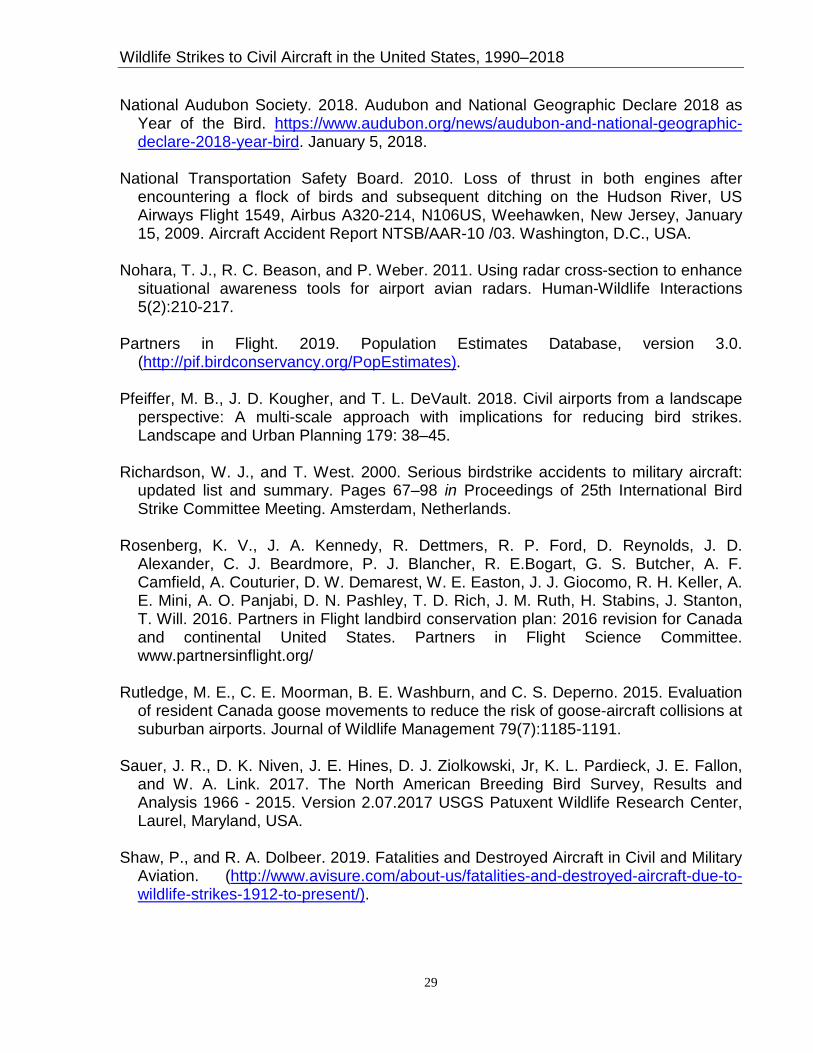
Wildlife Strikes to Civil Aircraft in the United States, 1990–2018
29
National Audubon Society. 2018. Audubon and National Geographic Declare 2018 as Year of the Bird. https://www.audubon.org/news/audubon-and-national-geographic-declare-2018-year-bird. January 5, 2018.
National Transportation Safety Board. 2010. Loss of thrust in both engines after encountering a flock of birds and subsequent ditching on the Hudson River, US Airways Flight 1549, Airbus A320-214, N106US, Weehawken, New Jersey, January 15, 2009. Aircraft Accident Report NTSB/AAR-10 /03. Washington, D.C., USA.
Nohara, T. J., R. C. Beason, and P. Weber. 2011. Using radar cross-section to enhance situational awareness tools for airport avian radars. Human-Wildlife Interactions 5(2):210-217.
Partners in Flight. 2019. Population Estimates Database, version 3.0. (http://pif.birdconservancy.org/PopEstimates).
Pfeiffer, M. B., J. D. Kougher, and T. L. DeVault. 2018. Civil airports from a landscape perspective: A multi-scale approach with implications for reducing bird strikes. Landscape and Urban Planning 179: 38–45.
Richardson, W. J., and T. West. 2000. Serious birdstrike accidents to military aircraft: updated list and summary. Pages 67–98 in Proceedings of 25th International Bird Strike Committee Meeting. Amsterdam, Netherlands.
Rosenberg, K. V., J. A. Kennedy, R. Dettmers, R. P. Ford, D. Reynolds, J. D. Alexander, C. J. Beardmore, P. J. Blancher, R. E.Bogart, G. S. Butcher, A. F. Camfield, A. Couturier, D. W. Demarest, W. E. Easton, J. J. Giocomo, R. H. Keller, A. E. Mini, A. O. Panjabi, D. N. Pashley, T. D. Rich, J. M. Ruth, H. Stabins, J. Stanton, T. Will. 2016. Partners in Flight landbird conservation plan: 2016 revision for Canada and continental United States. Partners in Flight Science Committee. www.partnersinflight.org/
Rutledge, M. E., C. E. Moorman, B. E. Washburn, and C. S. Deperno. 2015. Evaluation of resident Canada goose movements to reduce the risk of goose-aircraft collisions at suburban airports. Journal of Wildlife Management 79(7):1185-1191.
Sauer, J. R., D. K. Niven, J. E. Hines, D. J. Ziolkowski, Jr, K. L. Pardieck, J. E. Fallon, and W. A. Link. 2017. The North American Breeding Bird Survey, Results and Analysis 1966 - 2015. Version 2.07.2017 USGS Patuxent Wildlife Research Center, Laurel, Maryland, USA.
Shaw, P., and R. A. Dolbeer. 2019. Fatalities and Destroyed Aircraft in Civil and Military Aviation. (http://www.avisure.com/about-us/fatalities-and-destroyed-aircraft-due-to-wildlife-strikes-1912-to-present/).
Wildlife Strikes to Civil Aircraft in the United States, 1990–2018
30
Steele, R. G. D., and J. H. Torrie. 1960. Principles and procedures of statistics. McGraw-Hill Book Company, New York, New York, USA.
Thorpe, J. 2012. 100 years of fatalities and destroyed civil aircraft due to bird strikes + Addenda 1-3. Proceedings of the 30th International Bird Strike Committee Meeting. Stavanger, Norway. (https://worldbirdstrike.com/Stavanger/100% 20years%20of%20fatalities%20and%20destroyed%20civil%20aircfaft%20due%20to%20bird%20strikes%20Paper.pdf).
U.S. Department of Transportation. 2019. Bureau of Transportation Statistics. National Transportation Statistics. Table 1-13: Active U.S. air carrier and general aviation fleet by type of aircraft. (https://www.bts.gov/browse-statistical-products-and-data/national-transportation-statistics/national-transportation-8).
U.S. Fish and Wildlife Service. 2018. Waterfowl population status, 2018. U.S. Department of the Interior, Washington, D.C., USA. 76 pages.
U.S. Fish and Wildlife Service. 2019a. Nesting population of bald eagles in lower 48 states, 1963-2006. (https://www.fws.gov/midwest/eagle/population/chtofprs.html).
U.S. Fish and Wildlife Service. 2019b. Migratory Bird Treaty Act. (https://www.fws.gov/birds/policies-and-regulations/laws-legislations/migratory-bird-treaty-act.php).
Washburn, J. 2019. 10 Years after the Miracle on the Hudson: improvements in wildlife strike management. Wildlife Professional 13(1): 34-38.
Washburn, B. E., J. R. Weller, M. J. Begier, R. A. Dolbeer, E. C. Cleary, E. A. LeBoeuf, L. C. Francoeur, and C. A. Nadareski. 2010. Evaluation of the North Shore Marine Transfer Station and its compatibility with respect to bird strikes and safe air operations at LaGuardia Airport. Report for the Secretary of Transportation, U.S. Department Of Transportation, Washington, D.C., USA. August 2010.
---------------------------------------------------------------------------------------------------------------------
Wenning, K. M., M. J. Begier, and R. A. Dolbeer. 2004. Wildlife hazard management at airports: fifteen years of growth and progress for Wildlife Services. Pages 295-301 in Proceedings of 21st Vertebrate Pest Conference, University of California, Davis, California, USA.
Wright, S. E. and R. A. Dolbeer. 2005. Percentage of wildlife strikes reported and species identified under a voluntary system. in Proceedings of Bird Strike Committee USA/Canada meeting, Vancouver, B.C., Canada.

Wildlife Strikes to Civil Aircraft in the United States, 1990–2018
31
This page intentionally left blank
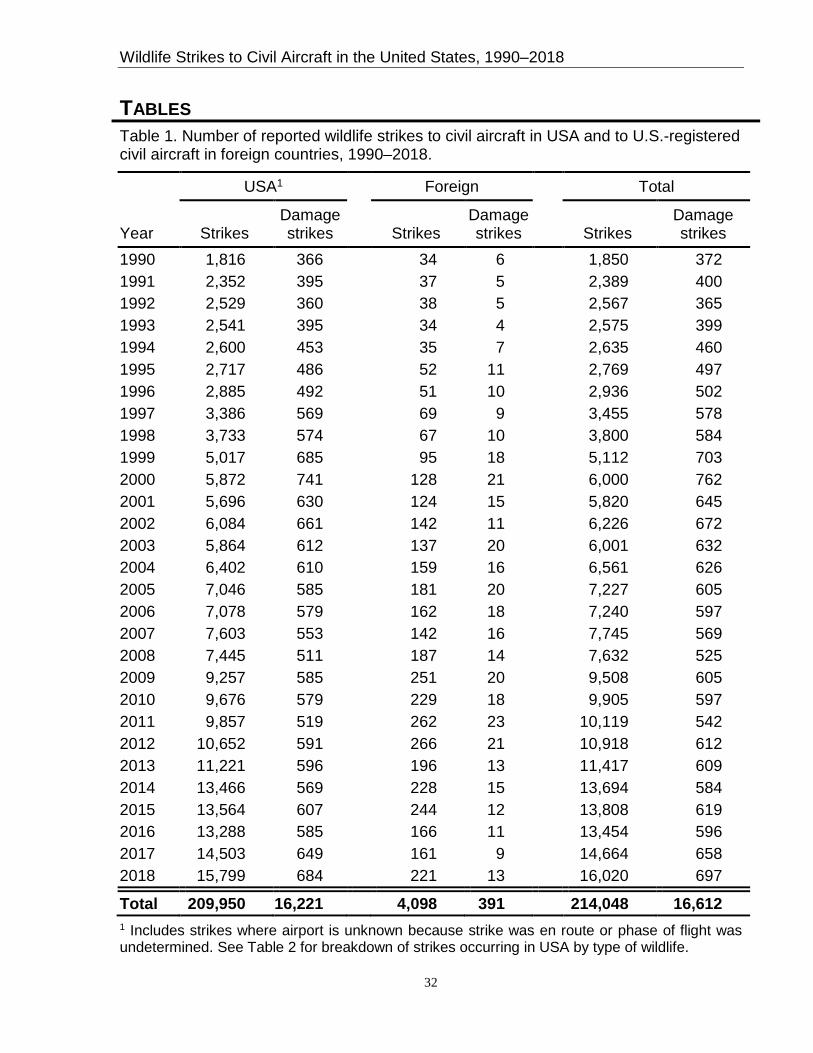
Wildlife Strikes to Civil Aircraft in the United States, 1990–2018
32
TABLES Table 1. Number of reported wildlife strikes to civil aircraft in USA and to U.S.-registered civil aircraft in foreign countries, 1990–2018.
USA1 Foreign Total
Year Strikes Damage strikes Strikes
Damage strikes Strikes
Damage strikes
1990 1,816 366 34 6 1,850 372 1991 2,352 395 37 5 2,389 400 1992 2,529 360 38 5 2,567 365 1993 2,541 395 34 4 2,575 399 1994 2,600 453 35 7 2,635 460 1995 2,717 486 52 11 2,769 497 1996 2,885 492 51 10 2,936 502 1997 3,386 569 69 9 3,455 578 1998 3,733 574 67 10 3,800 584 1999 5,017 685 95 18 5,112 703 2000 5,872 741 128 21 6,000 762 2001 5,696 630 124 15 5,820 645 2002 6,084 661 142 11 6,226 672 2003 5,864 612 137 20 6,001 632 2004 6,402 610 159 16 6,561 626 2005 7,046 585 181 20 7,227 605 2006 7,078 579 162 18 7,240 597 2007 7,603 553 142 16 7,745 569 2008 7,445 511 187 14 7,632 525 2009 9,257 585 251 20 9,508 605 2010 9,676 579 229 18 9,905 597 2011 9,857 519 262 23 10,119 542 2012 10,652 591 266 21 10,918 612 2013 11,221 596 196 13 11,417 609 2014 13,466 569 228 15 13,694 584 2015 13,564 607 244 12 13,808 619 2016 13,288 585 166 11 13,454 596 2017 14,503 649 161 9 14,664 658 2018 15,799 684 221 13 16,020 697
Total 209,950 16,221 4,098 391 214,048 16,612 1 Includes strikes where airport is unknown because strike was en route or phase of flight was undetermined. See Table 2 for breakdown of strikes occurring in USA by type of wildlife.
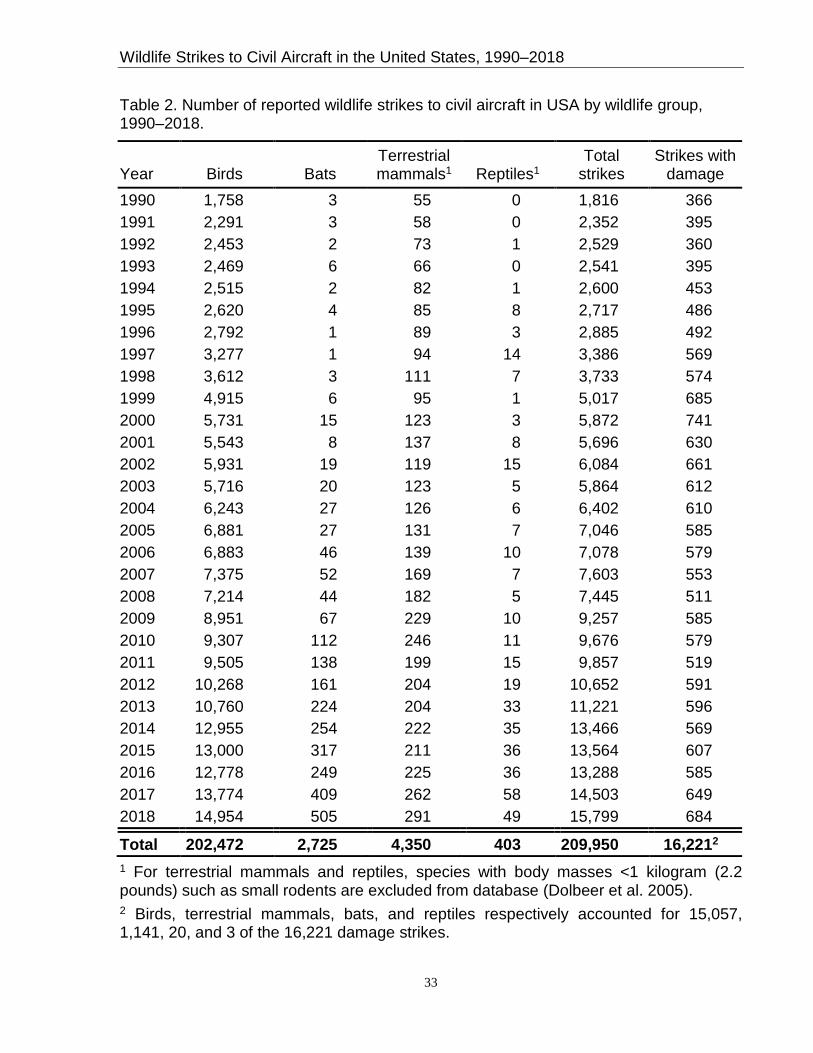
Wildlife Strikes to Civil Aircraft in the United States, 1990–2018
33
Table 2. Number of reported wildlife strikes to civil aircraft in USA by wildlife group, 1990–2018.
Year Birds Bats Terrestrial mammals1 Reptiles1
Total strikes
Strikes with damage
1990 1,758 3 55 0 1,816 366 1991 2,291 3 58 0 2,352 395 1992 2,453 2 73 1 2,529 360 1993 2,469 6 66 0 2,541 395 1994 2,515 2 82 1 2,600 453 1995 2,620 4 85 8 2,717 486 1996 2,792 1 89 3 2,885 492 1997 3,277 1 94 14 3,386 569 1998 3,612 3 111 7 3,733 574 1999 4,915 6 95 1 5,017 685 2000 5,731 15 123 3 5,872 741 2001 5,543 8 137 8 5,696 630 2002 5,931 19 119 15 6,084 661 2003 5,716 20 123 5 5,864 612 2004 6,243 27 126 6 6,402 610 2005 6,881 27 131 7 7,046 585 2006 6,883 46 139 10 7,078 579 2007 7,375 52 169 7 7,603 553 2008 7,214 44 182 5 7,445 511 2009 8,951 67 229 10 9,257 585 2010 9,307 112 246 11 9,676 579 2011 9,505 138 199 15 9,857 519 2012 10,268 161 204 19 10,652 591 2013 10,760 224 204 33 11,221 596 2014 12,955 254 222 35 13,466 569 2015 13,000 317 211 36 13,564 607 2016 12,778 249 225 36 13,288 585 2017 13,774 409 262 58 14,503 649 2018 14,954 505 291 49 15,799 684
Total 202,472 2,725 4,350 403 209,950 16,2212
1 For terrestrial mammals and reptiles, species with body masses <1 kilogram (2.2 pounds) such as small rodents are excluded from database (Dolbeer et al. 2005). 2 Birds, terrestrial mammals, bats, and reptiles respectively accounted for 15,057, 1,141, 20, and 3 of the 16,221 damage strikes.
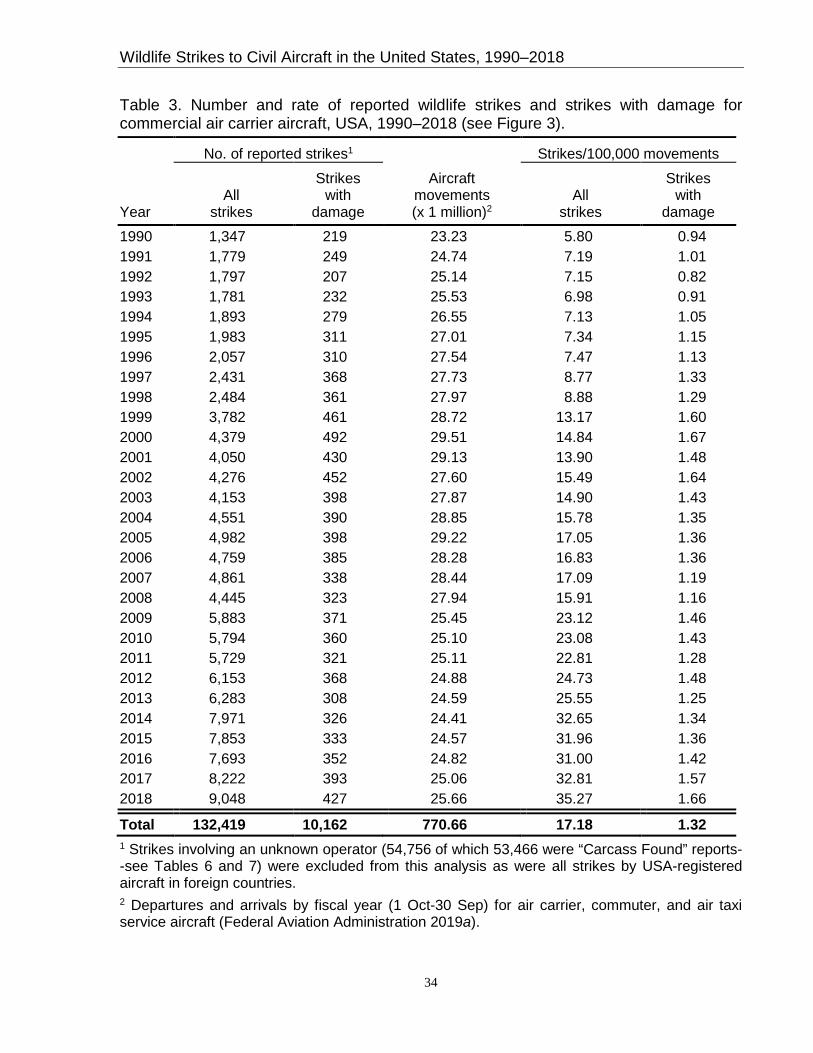
Wildlife Strikes to Civil Aircraft in the United States, 1990–2018
34
Table 3. Number and rate of reported wildlife strikes and strikes with damage for commercial air carrier aircraft, USA, 1990–2018 (see Figure 3).
No. of reported strikes1 Strikes/100,000 movements
Year All
strikes
Strikes with
damage
Aircraft movements (x 1 million)2
All strikes
Strikes with
damage 1990 1,347 219 23.23 5.80 0.94 1991 1,779 249 24.74 7.19 1.01 1992 1,797 207 25.14 7.15 0.82 1993 1,781 232 25.53 6.98 0.91 1994 1,893 279 26.55 7.13 1.05 1995 1,983 311 27.01 7.34 1.15 1996 2,057 310 27.54 7.47 1.13 1997 2,431 368 27.73 8.77 1.33 1998 2,484 361 27.97 8.88 1.29 1999 3,782 461 28.72 13.17 1.60 2000 4,379 492 29.51 14.84 1.67 2001 4,050 430 29.13 13.90 1.48 2002 4,276 452 27.60 15.49 1.64 2003 4,153 398 27.87 14.90 1.43 2004 4,551 390 28.85 15.78 1.35 2005 4,982 398 29.22 17.05 1.36 2006 4,759 385 28.28 16.83 1.36 2007 4,861 338 28.44 17.09 1.19 2008 4,445 323 27.94 15.91 1.16 2009 5,883 371 25.45 23.12 1.46 2010 5,794 360 25.10 23.08 1.43 2011 5,729 321 25.11 22.81 1.28 2012 6,153 368 24.88 24.73 1.48 2013 6,283 308 24.59 25.55 1.25 2014 7,971 326 24.41 32.65 1.34 2015 7,853 333 24.57 31.96 1.36 2016 7,693 352 24.82 31.00 1.42 2017 8,222 393 25.06 32.81 1.57 2018 9,048 427 25.66 35.27 1.66
Total 132,419 10,162 770.66 17.18 1.32 1 Strikes involving an unknown operator (54,756 of which 53,466 were “Carcass Found” reports--see Tables 6 and 7) were excluded from this analysis as were all strikes by USA-registered aircraft in foreign countries. 2 Departures and arrivals by fiscal year (1 Oct-30 Sep) for air carrier, commuter, and air taxi service aircraft (Federal Aviation Administration 2019a).

Wildlife Strikes to Civil Aircraft in the United States, 1990–2018
35
Table 4. Number and rate of reported wildlife strikes and strikes with damage for general aviation aircraft, USA, 1990–2018 (see Figure 3).
No. of reported strikes1 Strikes/100,000 movements
Year All
strikes
Strikes with
damage
Aircraft movements (x 1 million)2
All strikes
Strikes with
damage 1990 334 134 77.33 0.43 0.17 1991 406 131 83.29 0.49 0.16 1992 432 142 82.10 0.53 0.17 1993 447 159 80.17 0.56 0.20 1994 475 172 78.98 0.60 0.22 1995 481 171 77.00 0.62 0.22 1996 505 179 78.73 0.64 0.23 1997 505 189 79.71 0.63 0.24 1998 566 204 84.00 0.67 0.24 1999 620 212 85.18 0.73 0.25 2000 673 246 86.91 0.77 0.28 2001 695 194 85.73 0.81 0.23 2002 783 209 85.67 0.91 0.24 2003 683 208 83.30 0.82 0.25 2004 695 217 82.54 0.84 0.26 2005 667 186 81.07 0.82 0.23 2006 686 194 80.09 0.86 0.24 2007 670 212 80.13 0.84 0.26 2008 627 186 77.94 0.80 0.24 2009 861 214 73.53 1.17 0.29 2010 845 216 71.16 1.19 0.30 2011 918 198 69.84 1.31 0.28 2012 1,029 223 69.52 1.48 0.32 2013 1,107 287 68.76 1.61 0.42 2014 1,339 241 68.14 1.97 0.35 2015 1,407 273 68.25 2.06 0.40 2016 1,385 230 67.54 2.05 0.34 2017 1,336 242 67.38 1.98 0.36 2018 1,598 252 68.39 2.34 0.37
Total 22,775 5,921 2242.40 1.02 0.26 1 Strikes involving an unknown operator (54,756 of which 53,466 were “Carcass Found” reports--see Tables 6 and 7) were excluded from this analysis as were all strikes by USA-registered aircraft in foreign countries. 2 Itinerant and local departures and arrivals by fiscal year (1 Oct-30 Sep) for general aviation aircraft (Federal Aviation Administration 2019a).
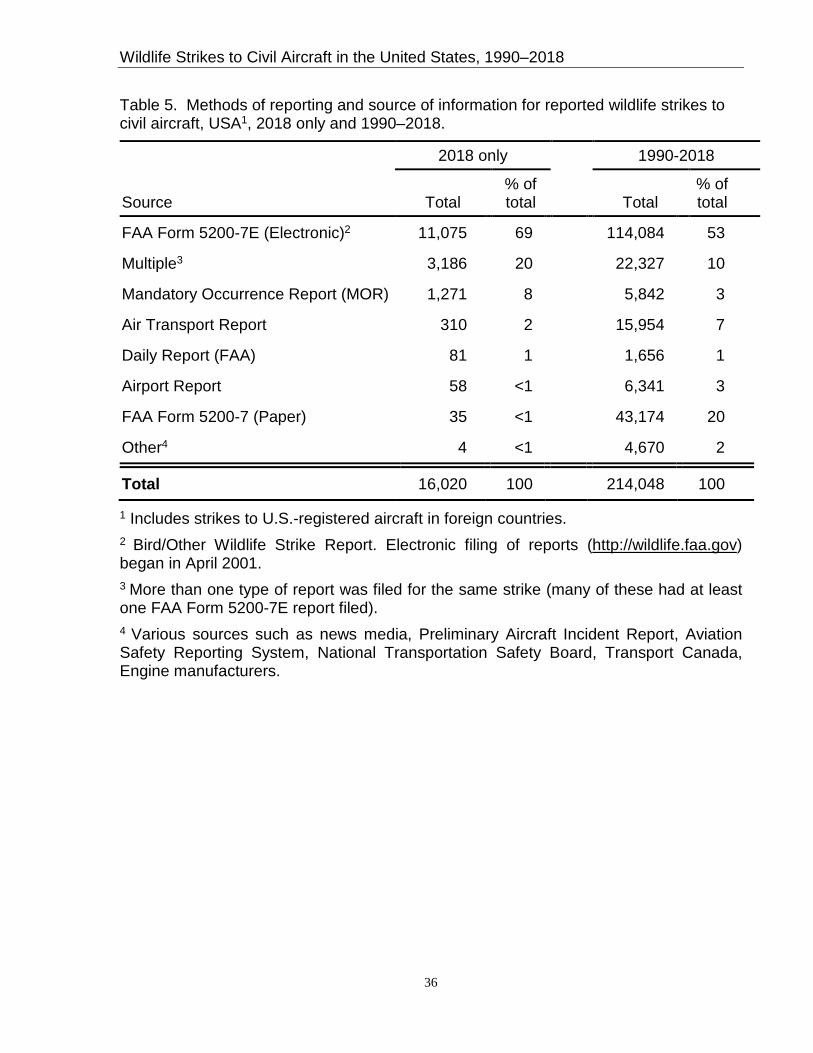
Wildlife Strikes to Civil Aircraft in the United States, 1990–2018
36
Table 5. Methods of reporting and source of information for reported wildlife strikes to civil aircraft, USA1, 2018 only and 1990–2018.
2018 only 1990-2018
Source Total % of total
Total
% of total
FAA Form 5200-7E (Electronic)2 11,075 69 114,084 53
Multiple3 3,186 20 22,327 10
Mandatory Occurrence Report (MOR) 1,271 8 5,842 3
Air Transport Report 310 2 15,954 7
Daily Report (FAA) 81 1 1,656 1
Airport Report 58 <1 6,341 3
FAA Form 5200-7 (Paper) 35 <1 43,174 20
Other4 4 <1 4,670 2
Total 16,020 100 214,048 100
1 Includes strikes to U.S.-registered aircraft in foreign countries. 2 Bird/Other Wildlife Strike Report. Electronic filing of reports (http://wildlife.faa.gov) began in April 2001. 3 More than one type of report was filed for the same strike (many of these had at least one FAA Form 5200-7E report filed). 4 Various sources such as news media, Preliminary Aircraft Incident Report, Aviation Safety Reporting System, National Transportation Safety Board, Transport Canada, Engine manufacturers.

Wildlife Strikes to Civil Aircraft in the United States, 1990–2018
37
Table 6. Person filing report of wildlife strike to civil aircraft, USA1, 2018 only and 1990–2018.
2018 only 1990-2018
Person filing report Total % of total
Total
% of total
Airport Operations 10,404 65 95,223 49
Other reports2 5,309 51 41,757 44
Carcass found3 5.095 49 53,466 56
Pilot 2,374 15 40,009 21
Tower 2,081 13 22,241 12
Air Transport Operations 777 5 30,744 16
Other 383 2 4,532 2
Total known 16,019 100 192,749 100
Unknown 1 21,299
Total 16,020 214,048 1 Includes strikes to U.S.-registered aircraft in foreign countries. 2 Airport personnel observed strike or reported a strike that had been communicated to them by pilot, tower, or airline. 3 Airport personnel found fresh wildlife remains within 250 feet of a runway centerline or elsewhere on or near airport that appeared to have been struck by aircraft, but no strike was observed or reported by pilot, tower, or airline (FAA Advisory Circular 150/5200-32B).
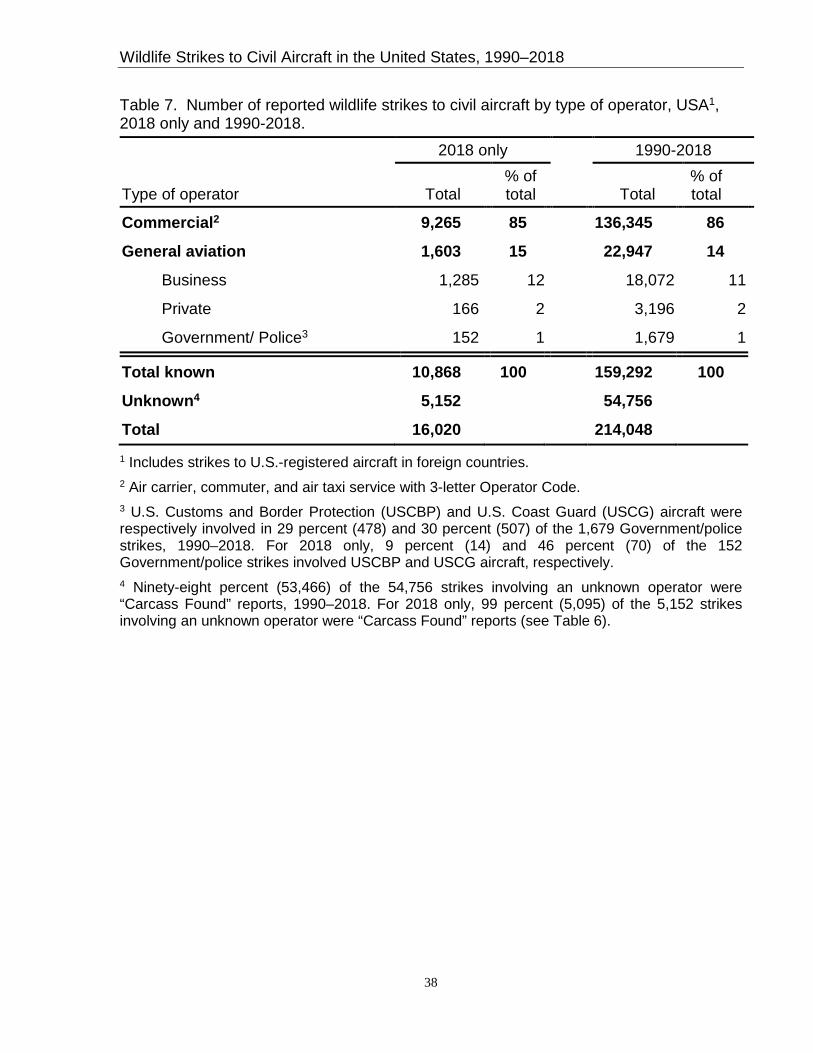
Wildlife Strikes to Civil Aircraft in the United States, 1990–2018
38
Table 7. Number of reported wildlife strikes to civil aircraft by type of operator, USA1, 2018 only and 1990-2018. 2018 only 1990-2018
Type of operator Total % of total
Total
% of total
Commercial2 9,265 85 136,345 86
General aviation 1,603 15 22,947 14
Business 1,285 12 18,072 11
Private 166 2 3,196 2
Government/ Police3 152 1 1,679 1
Total known 10,868 100 159,292 100
Unknown4 5,152 54,756
Total 16,020 214,048 1 Includes strikes to U.S.-registered aircraft in foreign countries. 2 Air carrier, commuter, and air taxi service with 3-letter Operator Code. 3 U.S. Customs and Border Protection (USCBP) and U.S. Coast Guard (USCG) aircraft were respectively involved in 29 percent (478) and 30 percent (507) of the 1,679 Government/police strikes, 1990–2018. For 2018 only, 9 percent (14) and 46 percent (70) of the 152 Government/police strikes involved USCBP and USCG aircraft, respectively. 4 Ninety-eight percent (53,466) of the 54,756 strikes involving an unknown operator were “Carcass Found” reports, 1990–2018. For 2018 only, 99 percent (5,095) of the 5,152 strikes involving an unknown operator were “Carcass Found” reports (see Table 6).

Wildlife Strikes to Civil Aircraft in the United States, 1990–2018
39
Table 8. Number of Part 139-certificated airports1 and general aviation (GA) airports with reported wildlife strikes and number of strikes reported for these airports, civil aircraft, USA, 1990–2018 (see Figure 6)2.
Part 139 airports GA airports All USA airports
Year Airports Strikes Airports Strikes Airports Strikes
1990 236 1,508 99 163 335 1,671 1991 260 1,989 96 198 356 2,187 1992 255 2,173 107 227 362 2,400 1993 257 2,221 100 218 357 2,439 1994 264 2,220 111 247 375 2,467 1995 261 2,326 120 210 381 2,536 1996 259 2,495 109 194 368 2,689 1997 285 2,908 123 201 408 3,109 1998 292 3,216 145 269 437 3,485 1999 305 3,805 145 257 450 4,062 2000 312 4,465 153 279 465 4,744 2001 317 4,432 151 294 468 4,726 2002 309 4,773 153 307 462 5,080 2003 306 4,650 154 331 460 4,981 2004 307 5,209 177 323 484 5,532 2005 322 5,498 174 330 496 5,828 2006 322 5,922 144 272 466 6,194 2007 327 6,562 164 328 491 6,890 2008 333 6,627 161 308 494 6,935 2009 363 8,012 236 454 599 8,466 2010 375 8,299 216 462 591 8,761 2011 366 8,452 229 498 595 8,950 2012 384 8,919 255 576 639 9,495 2013 381 9,138 272 617 653 9,755 2014 397 11,027 278 698 675 11,725 2015 404 11,117 266 693 670 11,810 2016 404 10,885 260 783 664 11,668 2017 420 11,638 278 822 698 12,460 2018 423 12,699 291 859 714 13,558 Total 521 173,185 1,526 11,418 2,047 184,603 1 There were 526 airports in USA certificated for passenger service under CFR Part 139 regulations in April 2019 (FAA 2019b). 2 In addition, 4,098 strikes involving USA-registered aircraft were reported from 312 foreign airports in 109 countries. Furthermore, 3,821 strikes (3,806 bird and 15 bat strikes) were reported in which aircraft was en route (Table 10). An additional 17,428 strikes were reported in which either evidence of strike was discovered on aircraft after landing but phase of flight where strike occurred could not be determined or an airport was not named on reporting form.

Wildlife Strikes to Civil Aircraft in the United States, 1990–2018
40
Table 9. Reported time of occurrence of wildlife strikes with civil aircraft, USA1, 1990–20182.
Birds Terrestrial mammals
Bats
Time of day 29-year
total
% of total
known 29-year
total
% of total
known
29-year
total
% of total
known
Dawn 4,571 4 90 4 23 2
Day 80,310 63 593 26 225 24
Dusk 5,548 4 168 7 47 5
Night 37,784 29 1,420 63 652 69
Total known 128,213 100 2,271 100 947 100
Unknown3 78,316 2,092 1,806
Total 206,529 4,363 2,753
1 Includes strikes to U.S.-registered aircraft in foreign countries. 2 In addition, 403 strikes with reptiles were reported from 1990–2018: time not reported (326), day (60), night (12), dusk (3), and dawn (2). 3 Of the 82,540 strike reports with “Unknown” time of day (all species), 53,466 (65 percent) were “Carcass Found” reports (Table 6).
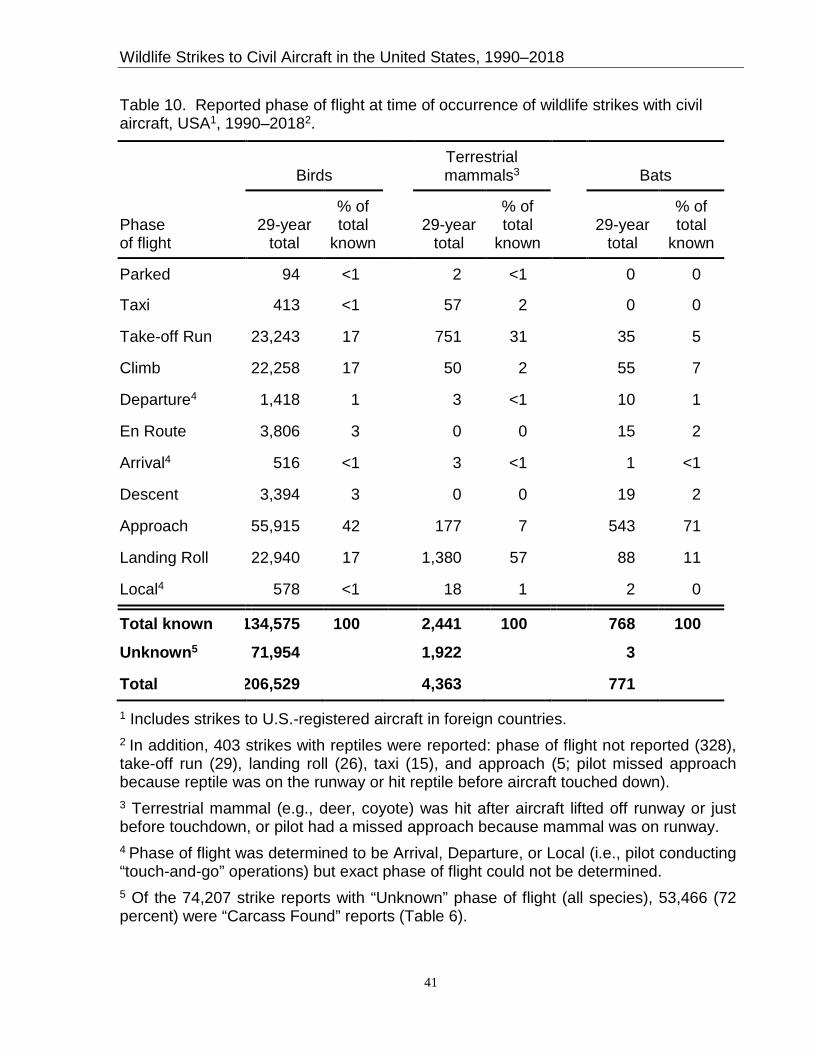
Wildlife Strikes to Civil Aircraft in the United States, 1990–2018
41
Table 10. Reported phase of flight at time of occurrence of wildlife strikes with civil aircraft, USA1, 1990–20182.
Birds Terrestrial mammals3
Bats
Phase of flight
29-year total
% of total
known 29-year
total
% of total
known
29-year
total
% of total
known
Parked 94 <1 2 <1 0 0
Taxi 413 <1 57 2 0 0
Take-off Run 23,243 17 751 31 35 5
Climb 22,258 17 50 2 55 7
Departure4 1,418 1 3 <1 10 1
En Route 3,806 3 0 0 15 2
Arrival4 516 <1 3 <1 1 <1
Descent 3,394 3 0 0 19 2
Approach 55,915 42 177 7 543 71
Landing Roll 22,940 17 1,380 57 88 11
Local4 578 <1 18 1 2 0
Total known 134,575 100 2,441 100 768 100
Unknown5 71,954 1,922 3
Total 206,529 4,363 771
1 Includes strikes to U.S.-registered aircraft in foreign countries. 2 In addition, 403 strikes with reptiles were reported: phase of flight not reported (328), take-off run (29), landing roll (26), taxi (15), and approach (5; pilot missed approach because reptile was on the runway or hit reptile before aircraft touched down). 3 Terrestrial mammal (e.g., deer, coyote) was hit after aircraft lifted off runway or just before touchdown, or pilot had a missed approach because mammal was on runway. 4 Phase of flight was determined to be Arrival, Departure, or Local (i.e., pilot conducting “touch-and-go” operations) but exact phase of flight could not be determined. 5 Of the 74,207 strike reports with “Unknown” phase of flight (all species), 53,466 (72 percent) were “Carcass Found” reports (Table 6).
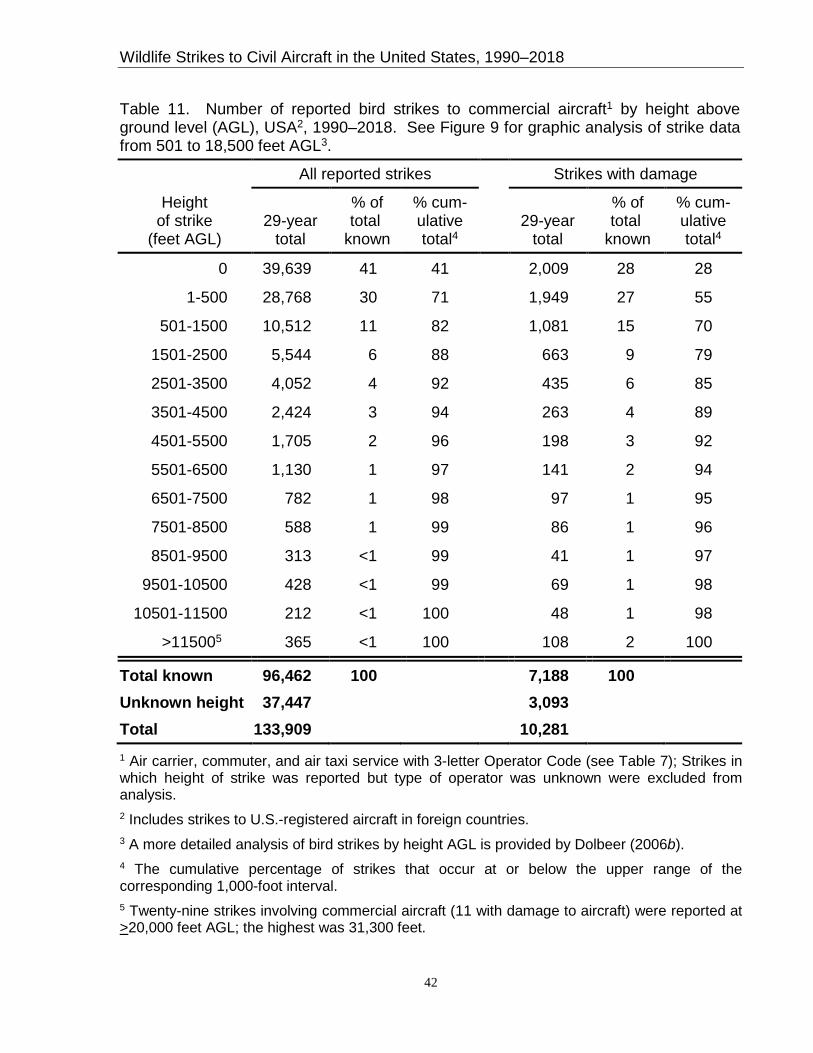
Wildlife Strikes to Civil Aircraft in the United States, 1990–2018
42
Table 11. Number of reported bird strikes to commercial aircraft1 by height above ground level (AGL), USA2, 1990–2018. See Figure 9 for graphic analysis of strike data from 501 to 18,500 feet AGL3.
All reported strikes Strikes with damage
Height of strike
(feet AGL) 29-year
total
% of total
known
% cum- ulative total4
29-year
total
% of total
known
% cum- ulative total4
0 39,639 41 41 2,009 28 28
1-500 28,768 30 71 1,949 27 55
501-1500 10,512 11 82 1,081 15 70
1501-2500 5,544 6 88 663 9 79
2501-3500 4,052 4 92 435 6 85
3501-4500 2,424 3 94 263 4 89
4501-5500 1,705 2 96 198 3 92
5501-6500 1,130 1 97 141 2 94
6501-7500 782 1 98 97 1 95
7501-8500 588 1 99 86 1 96
8501-9500 313 <1 99 41 1 97
9501-10500 428 <1 99 69 1 98
10501-11500 212 <1 100 48 1 98
>115005 365 <1 100 108 2 100
Total known 96,462 100 7,188 100 Unknown height 37,447 3,093 Total 133,909 10,281 1 Air carrier, commuter, and air taxi service with 3-letter Operator Code (see Table 7); Strikes in which height of strike was reported but type of operator was unknown were excluded from analysis. 2 Includes strikes to U.S.-registered aircraft in foreign countries. 3 A more detailed analysis of bird strikes by height AGL is provided by Dolbeer (2006b). 4 The cumulative percentage of strikes that occur at or below the upper range of the corresponding 1,000-foot interval. 5 Twenty-nine strikes involving commercial aircraft (11 with damage to aircraft) were reported at >20,000 feet AGL; the highest was 31,300 feet.
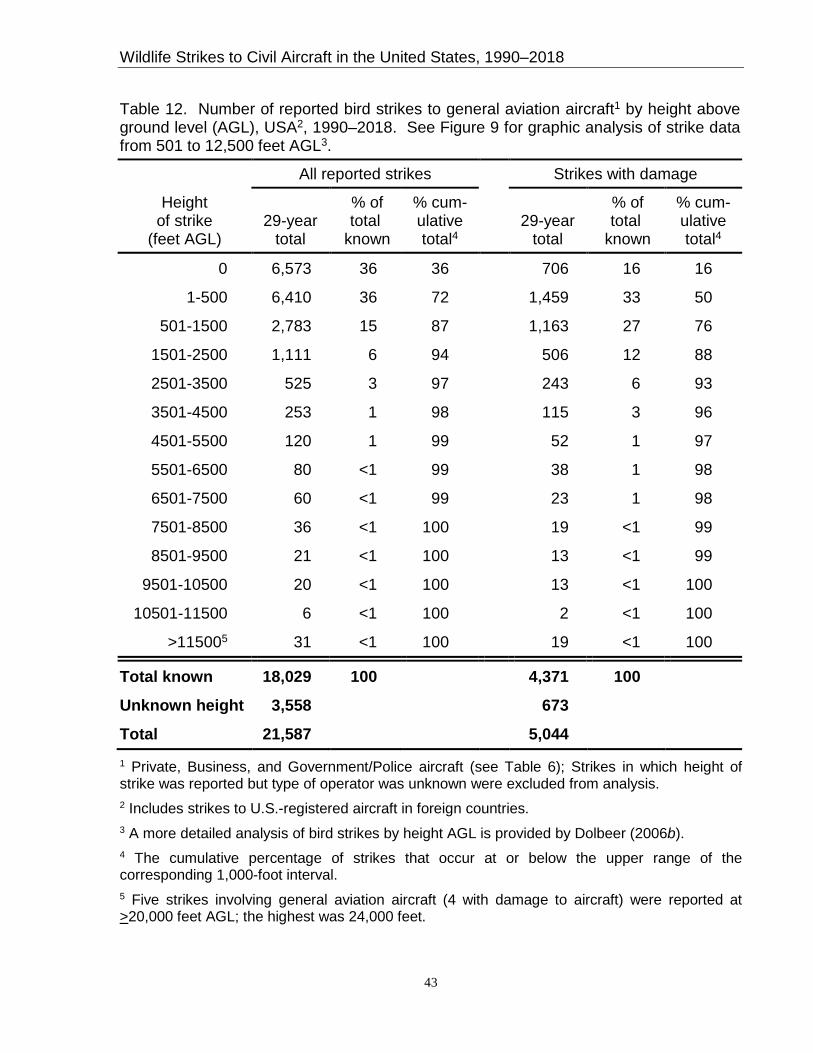
Wildlife Strikes to Civil Aircraft in the United States, 1990–2018
43
Table 12. Number of reported bird strikes to general aviation aircraft1 by height above ground level (AGL), USA2, 1990–2018. See Figure 9 for graphic analysis of strike data from 501 to 12,500 feet AGL3.
All reported strikes Strikes with damage
Height of strike
(feet AGL) 29-year
total
% of total
known
% cum- ulative total4
29-year
total
% of total
known
% cum- ulative total4
0 6,573 36 36 706 16 16
1-500 6,410 36 72 1,459 33 50
501-1500 2,783 15 87 1,163 27 76
1501-2500 1,111 6 94 506 12 88
2501-3500 525 3 97 243 6 93
3501-4500 253 1 98 115 3 96
4501-5500 120 1 99 52 1 97
5501-6500 80 <1 99 38 1 98
6501-7500 60 <1 99 23 1 98
7501-8500 36 <1 100 19 <1 99
8501-9500 21 <1 100 13 <1 99
9501-10500 20 <1 100 13 <1 100
10501-11500 6 <1 100 2 <1 100
>115005 31 <1 100 19 <1 100
Total known 18,029 100 4,371 100
Unknown height 3,558 673
Total 21,587 5,044 1 Private, Business, and Government/Police aircraft (see Table 6); Strikes in which height of strike was reported but type of operator was unknown were excluded from analysis. 2 Includes strikes to U.S.-registered aircraft in foreign countries. 3 A more detailed analysis of bird strikes by height AGL is provided by Dolbeer (2006b). 4 The cumulative percentage of strikes that occur at or below the upper range of the corresponding 1,000-foot interval. 5 Five strikes involving general aviation aircraft (4 with damage to aircraft) were reported at >20,000 feet AGL; the highest was 24,000 feet.
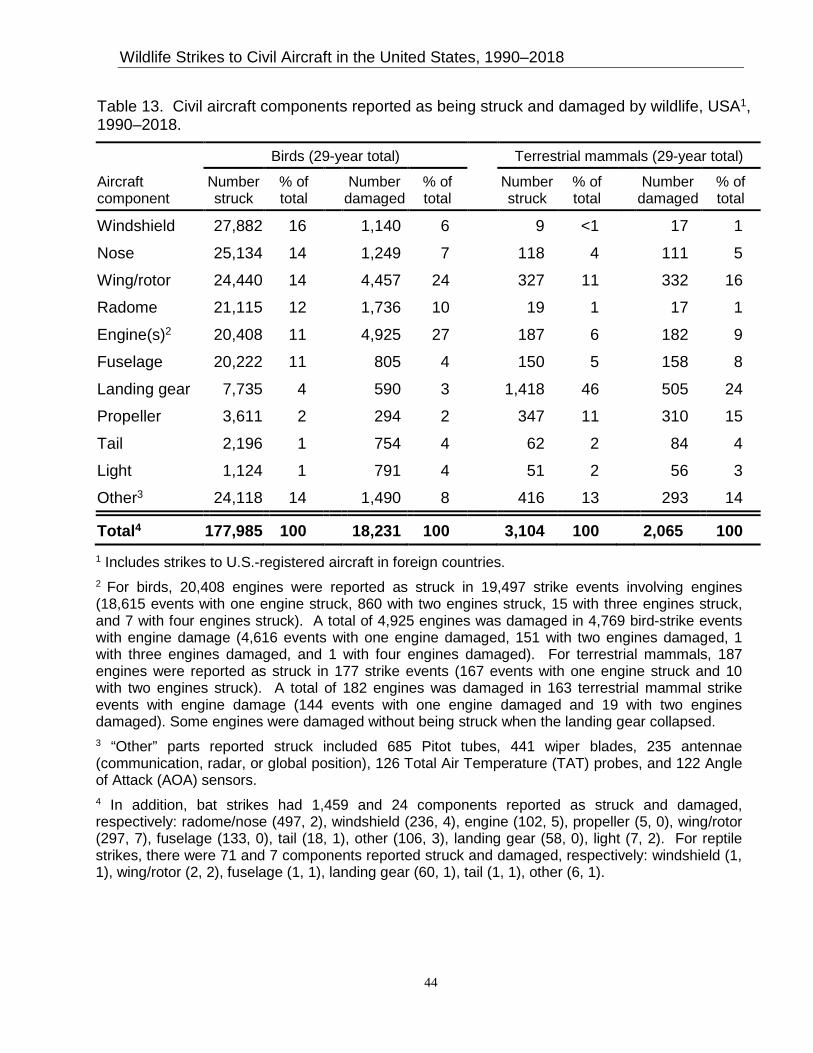
Wildlife Strikes to Civil Aircraft in the United States, 1990–2018
44
Table 13. Civil aircraft components reported as being struck and damaged by wildlife, USA1, 1990–2018.
Birds (29-year total) Terrestrial mammals (29-year total)
Aircraft component
Number struck
% of total
Number damaged
% of total
Number struck
% of total
Number damaged
% of total
Windshield 27,882 16 1,140 6 9 <1 17 1
Nose 25,134 14 1,249 7 118 4 111 5 Wing/rotor 24,440 14 4,457 24 327 11 332 16 Radome 21,115 12 1,736 10 19 1 17 1
Engine(s)2 20,408 11 4,925 27 187 6 182 9 Fuselage 20,222 11 805 4 150 5 158 8
Landing gear 7,735 4 590 3 1,418 46 505 24 Propeller 3,611 2 294 2 347 11 310 15
Tail 2,196 1 754 4 62 2 84 4 Light 1,124 1 791 4 51 2 56 3 Other3 24,118 14 1,490 8 416 13 293 14
Total4 177,985 100 18,231 100 3,104 100 2,065 100 1 Includes strikes to U.S.-registered aircraft in foreign countries. 2 For birds, 20,408 engines were reported as struck in 19,497 strike events involving engines (18,615 events with one engine struck, 860 with two engines struck, 15 with three engines struck, and 7 with four engines struck). A total of 4,925 engines was damaged in 4,769 bird-strike events with engine damage (4,616 events with one engine damaged, 151 with two engines damaged, 1 with three engines damaged, and 1 with four engines damaged). For terrestrial mammals, 187 engines were reported as struck in 177 strike events (167 events with one engine struck and 10 with two engines struck). A total of 182 engines was damaged in 163 terrestrial mammal strike events with engine damage (144 events with one engine damaged and 19 with two engines damaged). Some engines were damaged without being struck when the landing gear collapsed. 3 “Other” parts reported struck included 685 Pitot tubes, 441 wiper blades, 235 antennae (communication, radar, or global position), 126 Total Air Temperature (TAT) probes, and 122 Angle of Attack (AOA) sensors. 4 In addition, bat strikes had 1,459 and 24 components reported as struck and damaged, respectively: radome/nose (497, 2), windshield (236, 4), engine (102, 5), propeller (5, 0), wing/rotor (297, 7), fuselage (133, 0), tail (18, 1), other (106, 3), landing gear (58, 0), light (7, 2). For reptile strikes, there were 71 and 7 components reported struck and damaged, respectively: windshield (1, 1), wing/rotor (2, 2), fuselage (1, 1), landing gear (60, 1), tail (1, 1), other (6, 1).

Wildlife Strikes to Civil Aircraft in the United States, 1990–2018
45
Table 14. Number of civil aircraft with reported damage resulting from wildlife strikes, USA1, 1990–2018. See Tables 1 - 4 and Figures 2 – 4, 11, and 16 for trends in damaging strikes, 1990–2018.
Reported strikes
Birds Terrestrial mammals Total (all species)2
Damage category3
29-year total
% of total4
29-year total
% of total4
29-year total
% of total4
None 127,144 62 1,131 26 129,563 61
Unknown 63,941 31 2,090 48 67,873 32
Damage 15,444 7 1,142 26 16,612 8
Minor 7,637 4 562 13 8,210 4
Uncertain 4,167 2 124 3 4,301 2
Substantial 3,601 2 425 10 4,031 2
Destroyed 39 <1 31 1 70 <1
Total 206,529 100 4,363 100 214,048 100
1 Includes strikes to U.S.-registered aircraft in foreign countries. 2 Included in totals are 2,753 and 403 strikes involving bats and reptiles, respectively. For bats, 1,224 reports indicated no damage, 1,506 failed to indicate if damage occurred, and 23 indicated damage (9 minor, 10 uncertain level, 4 substantial [caused by megabats at foreign airports]). For reptiles, 64 reports indicated no damage, 336 failed to indicate if damage occurred, and 3 indicated damage (2 minor, 1 substantial). 3 The damage codes and descriptions are from the International Civil Aviation Organization (1989): Minor = the aircraft can be rendered airworthy by simple repairs or replacements and an extensive inspection is not necessary; Uncertain = the aircraft was damaged, but details as to the extent of the damage are lacking; Substantial = the aircraft incurs damage or structural failure that adversely affects the structure strength, performance, or flight characteristics of the aircraft and that would normally require major repair or replacement of the affected component (specifically excluded are bent fairings or cowlings; small dents or puncture holes in the skin; damage to wing tips, antenna, tires, or brakes; and engine blade damage not requiring blade replacement); Destroyed = the damage sustained makes it inadvisable to restore the aircraft to an airworthy condition. 4 The percentage of strikes causing damage is calculated using the total strikes reported as the divisor, including the 63,941 reports that did not indicate if damage occurred or not (Unknown). “Carcass found” reports (see Table 6) comprised 53,466 (84 percent) of these 63,941 reports. If the Unknown reports are excluded from the calculations, then 11, 50, and 11 percent of the strikes caused damage for birds, terrestrial mammals, and all species, respectively.
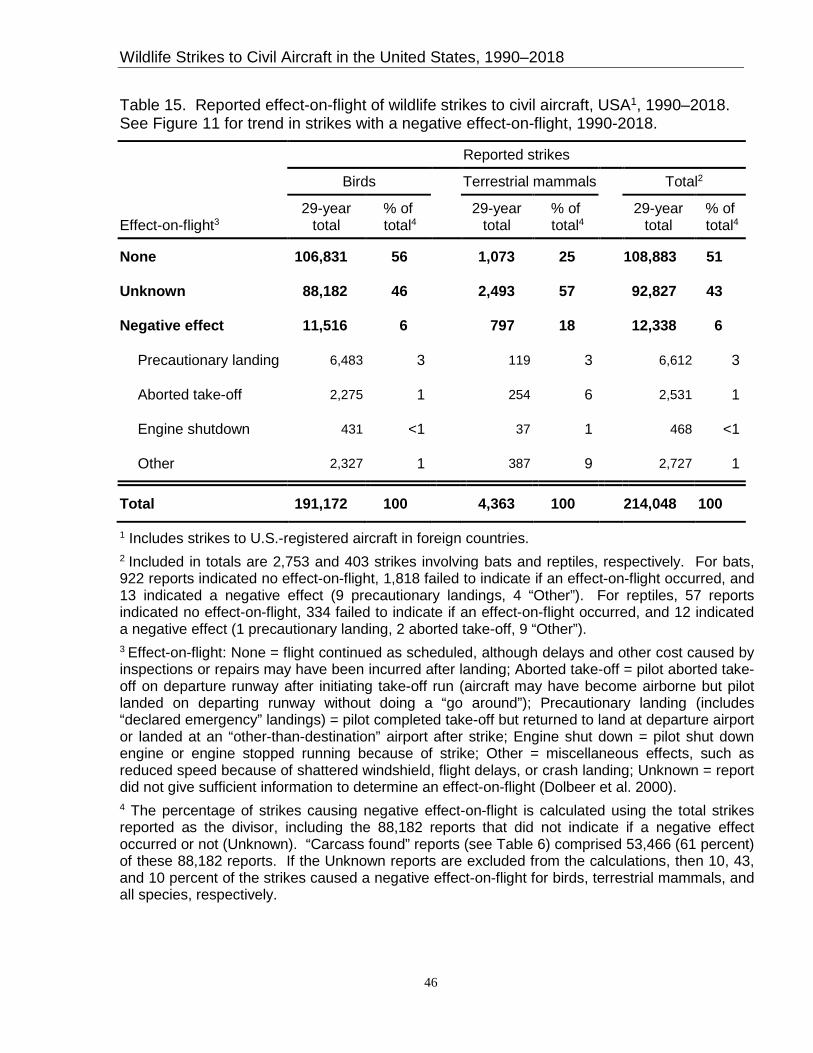
Wildlife Strikes to Civil Aircraft in the United States, 1990–2018
46
Table 15. Reported effect-on-flight of wildlife strikes to civil aircraft, USA1, 1990–2018. See Figure 11 for trend in strikes with a negative effect-on-flight, 1990-2018.
Reported strikes
Birds Terrestrial mammals Total2
Effect-on-flight3 29-year
total % of total4
29-year total
% of total4
29-year total
% of total4
None 106,831 56 1,073 25 108,883 51
Unknown 88,182 46 2,493 57 92,827 43
Negative effect 11,516 6 797 18 12,338 6
Precautionary landing 6,483 3 119 3 6,612 3
Aborted take-off 2,275 1 254 6 2,531 1
Engine shutdown 431 <1 37 1 468 <1
Other 2,327 1 387 9 2,727 1
Total 191,172 100 4,363 100 214,048 100
1 Includes strikes to U.S.-registered aircraft in foreign countries. 2 Included in totals are 2,753 and 403 strikes involving bats and reptiles, respectively. For bats, 922 reports indicated no effect-on-flight, 1,818 failed to indicate if an effect-on-flight occurred, and 13 indicated a negative effect (9 precautionary landings, 4 “Other”). For reptiles, 57 reports indicated no effect-on-flight, 334 failed to indicate if an effect-on-flight occurred, and 12 indicated a negative effect (1 precautionary landing, 2 aborted take-off, 9 “Other”). 3 Effect-on-flight: None = flight continued as scheduled, although delays and other cost caused by inspections or repairs may have been incurred after landing; Aborted take-off = pilot aborted take-off on departure runway after initiating take-off run (aircraft may have become airborne but pilot landed on departing runway without doing a “go around”); Precautionary landing (includes “declared emergency” landings) = pilot completed take-off but returned to land at departure airport or landed at an “other-than-destination” airport after strike; Engine shut down = pilot shut down engine or engine stopped running because of strike; Other = miscellaneous effects, such as reduced speed because of shattered windshield, flight delays, or crash landing; Unknown = report did not give sufficient information to determine an effect-on-flight (Dolbeer et al. 2000). 4 The percentage of strikes causing negative effect-on-flight is calculated using the total strikes reported as the divisor, including the 88,182 reports that did not indicate if a negative effect occurred or not (Unknown). “Carcass found” reports (see Table 6) comprised 53,466 (61 percent) of these 88,182 reports. If the Unknown reports are excluded from the calculations, then 10, 43, and 10 percent of the strikes caused a negative effect-on-flight for birds, terrestrial mammals, and all species, respectively.
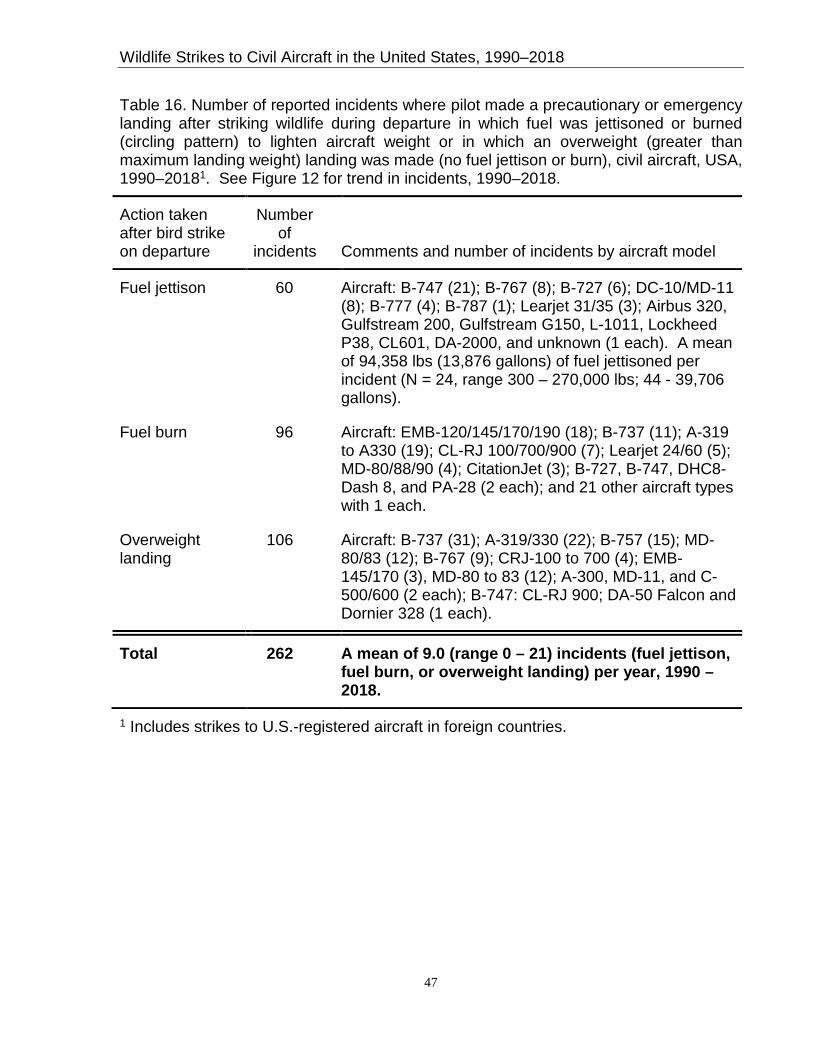
Wildlife Strikes to Civil Aircraft in the United States, 1990–2018
47
Table 16. Number of reported incidents where pilot made a precautionary or emergency landing after striking wildlife during departure in which fuel was jettisoned or burned (circling pattern) to lighten aircraft weight or in which an overweight (greater than maximum landing weight) landing was made (no fuel jettison or burn), civil aircraft, USA, 1990–20181. See Figure 12 for trend in incidents, 1990–2018.
Action taken after bird strike on departure
Number of
incidents Comments and number of incidents by aircraft model
Fuel jettison 60 Aircraft: B-747 (21); B-767 (8); B-727 (6); DC-10/MD-11 (8); B-777 (4); B-787 (1); Learjet 31/35 (3); Airbus 320, Gulfstream 200, Gulfstream G150, L-1011, Lockheed P38, CL601, DA-2000, and unknown (1 each). A mean of 94,358 lbs (13,876 gallons) of fuel jettisoned per incident (N = 24, range 300 – 270,000 lbs; 44 - 39,706 gallons).
Fuel burn 96 Aircraft: EMB-120/145/170/190 (18); B-737 (11); A-319 to A330 (19); CL-RJ 100/700/900 (7); Learjet 24/60 (5); MD-80/88/90 (4); CitationJet (3); B-727, B-747, DHC8-Dash 8, and PA-28 (2 each); and 21 other aircraft types with 1 each.
Overweight landing
106 Aircraft: B-737 (31); A-319/330 (22); B-757 (15); MD-80/83 (12); B-767 (9); CRJ-100 to 700 (4); EMB-145/170 (3), MD-80 to 83 (12); A-300, MD-11, and C-500/600 (2 each); B-747: CL-RJ 900; DA-50 Falcon and Dornier 328 (1 each).
Total 262 A mean of 9.0 (range 0 – 21) incidents (fuel jettison, fuel burn, or overweight landing) per year, 1990 – 2018.
1 Includes strikes to U.S.-registered aircraft in foreign countries.
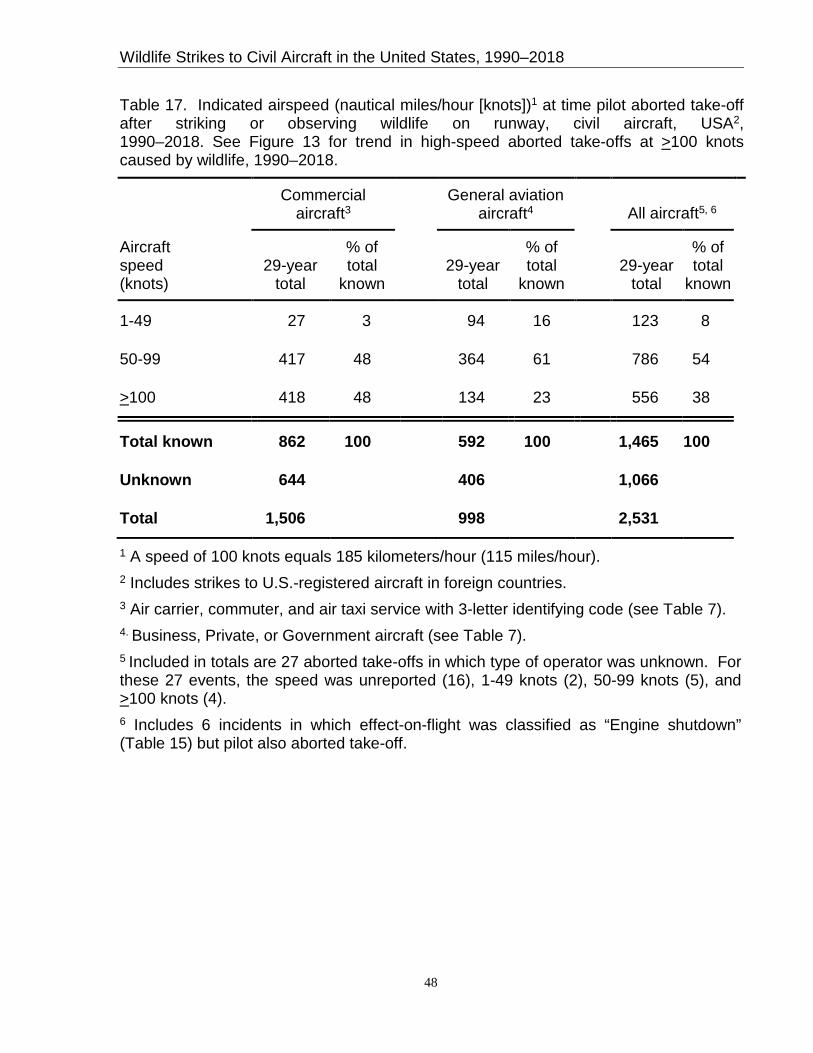
Wildlife Strikes to Civil Aircraft in the United States, 1990–2018
48
Table 17. Indicated airspeed (nautical miles/hour [knots])1 at time pilot aborted take-off after striking or observing wildlife on runway, civil aircraft, USA2, 1990–2018. See Figure 13 for trend in high-speed aborted take-offs at >100 knots caused by wildlife, 1990–2018.
Commercial aircraft3
General aviation aircraft4 All aircraft5, 6
Aircraft speed (knots)
29-year total
% of total
known 29-year
total
% of total
known 29-year
total
% of total
known
1-49 27 3 94 16 123 8
50-99 417 48 364 61 786 54
>100 418 48 134 23 556 38
Total known 862 100 592 100 1,465 100
Unknown 644 406 1,066
Total 1,506 998 2,531
1 A speed of 100 knots equals 185 kilometers/hour (115 miles/hour). 2 Includes strikes to U.S.-registered aircraft in foreign countries. 3 Air carrier, commuter, and air taxi service with 3-letter identifying code (see Table 7). 4. Business, Private, or Government aircraft (see Table 7). 5 Included in totals are 27 aborted take-offs in which type of operator was unknown. For these 27 events, the speed was unreported (16), 1-49 knots (2), 50-99 knots (5), and >100 knots (4). 6 Includes 6 incidents in which effect-on-flight was classified as “Engine shutdown” (Table 15) but pilot also aborted take-off.
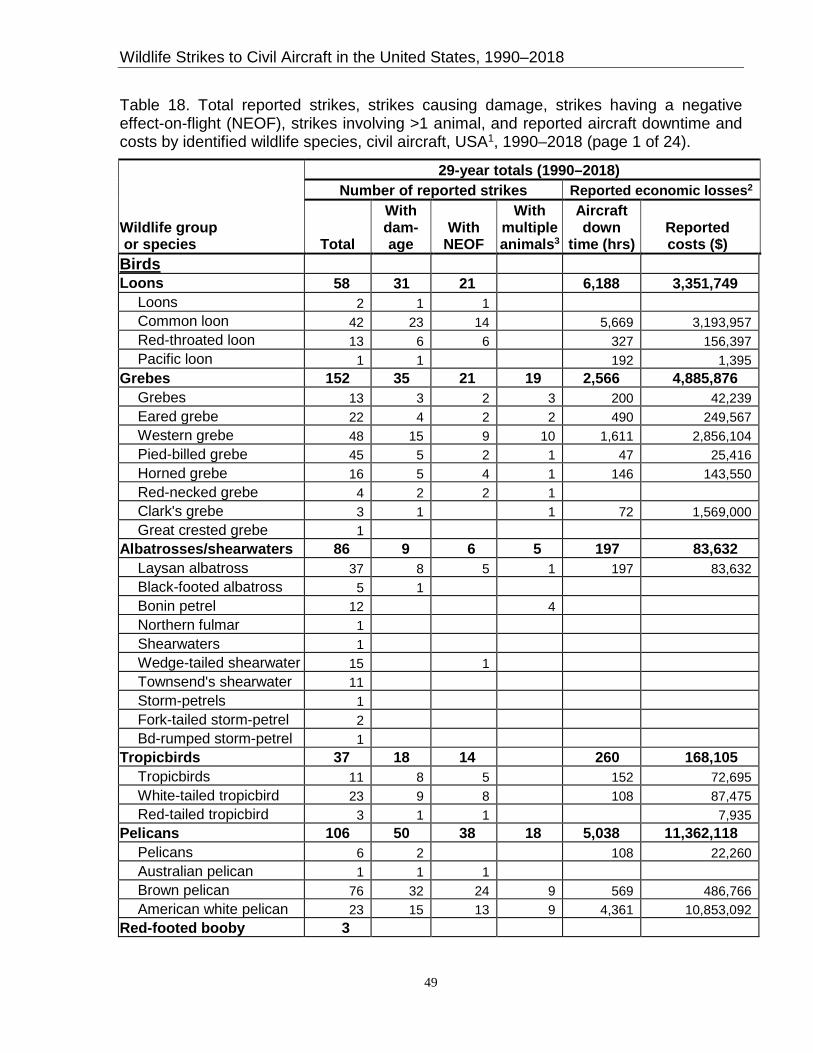
Wildlife Strikes to Civil Aircraft in the United States, 1990–2018
49
Table 18. Total reported strikes, strikes causing damage, strikes having a negative effect-on-flight (NEOF), strikes involving >1 animal, and reported aircraft downtime and costs by identified wildlife species, civil aircraft, USA1, 1990–2018 (page 1 of 24).
29-year totals (1990–2018) Number of reported strikes Reported economic losses2
Wildlife group or species Total
With dam- age
With NEOF
With multiple animals3
Aircraft down
time (hrs) Reported costs ($)
Birds Loons 58 31 21 6,188 3,351,749
Loons 2 1 1 Common loon 42 23 14 5,669 3,193,957 Red-throated loon 13 6 6 327 156,397 Pacific loon 1 1 192 1,395
Grebes 152 35 21 19 2,566 4,885,876 Grebes 13 3 2 3 200 42,239 Eared grebe 22 4 2 2 490 249,567 Western grebe 48 15 9 10 1,611 2,856,104 Pied-billed grebe 45 5 2 1 47 25,416 Horned grebe 16 5 4 1 146 143,550 Red-necked grebe 4 2 2 1 Clark's grebe 3 1 1 72 1,569,000 Great crested grebe 1
Albatrosses/shearwaters 86 9 6 5 197 83,632 Laysan albatross 37 8 5 1 197 83,632 Black-footed albatross 5 1 Bonin petrel 12 4 Northern fulmar 1 Shearwaters 1 Wedge-tailed shearwater 15 1 Townsend's shearwater 11 Storm-petrels 1 Fork-tailed storm-petrel 2 Bd-rumped storm-petrel 1
Tropicbirds 37 18 14 260 168,105 Tropicbirds 11 8 5 152 72,695 White-tailed tropicbird 23 9 8 108 87,475 Red-tailed tropicbird 3 1 1 7,935
Pelicans 106 50 38 18 5,038 11,362,118 Pelicans 6 2 108 22,260 Australian pelican 1 1 1 Brown pelican 76 32 24 9 569 486,766 American white pelican 23 15 13 9 4,361 10,853,092
Red-footed booby 3

Wildlife Strikes to Civil Aircraft in the United States, 1990–2018
50
Table 18. Continued (page 2 of 24) 29-year totals (1990–2018) Number of reported strikes Reported economic losses2
Wildlife group or species Total
With dam- age
With NEOF
With multiple animals3
Aircraft down
time (hrs) Reported costs ($)
Cormorants 177 58 43 29 3,343 6,474,690 Cormorants 5 2 1 1 12 15,900 Great cormorant 2 1 2 Dbl-crested cormorant 167 54 41 26 3,307 6,458,790 Pelagic cormorant 2 Brandt's cormorant 1 1 1 24
Anhinga 45 22 14 6 254 1,010,512 Frigatebirds 21 8 5 89 36,040
Great frigatebird 13 4 3 69 29,578 Magnificent frigatebird 8 4 2 20 6,462
Herons, egrets, bitterns 1,993 223 234 243 9,491 18,343,078 Herons, egrets, bitterns 6 1 Herons 57 12 10 2 99 4,434 Gray heron 1 1 1 Great blue heron 462 87 70 8 4,126 8,778,461 Blk-crowned night-heron 104 9 4 5 111 389,669 Little blue heron 17 1 2 318 Green heron 32 2 2 1 Yw-crowned night-heron 65 10 7 5 186 827,876 Tricolored heron 6 2 Purple heron 2 1 36 American bittern 13 4 2 1 647 56,221 Yellow bittern 162 2 14 Least bittern 3 Egrets 359 35 56 91 3,624 4,709,577 Cattle egret 543 42 62 102 386 982,132 Great egret 119 14 10 12 177 2,544,310 Intermediate egret 1 Snowy egret 41 5 3 2 99 50,080
Storks 22 7 4 4 39 23,402 White stork 1 1 Wood stork 21 6 4 4 39 23,402
Ibises, spoonbills 62 16 16 11 1,990 1,182,032 Ibises 7 1 1 Glossy ibis 4 1 1 1 2,186 White ibis 25 3 6 2 134 62,513 White-faced ibis 21 11 6 7 1,844 1,104,625 Roseate spoonbill 5 1 2 12 12,708
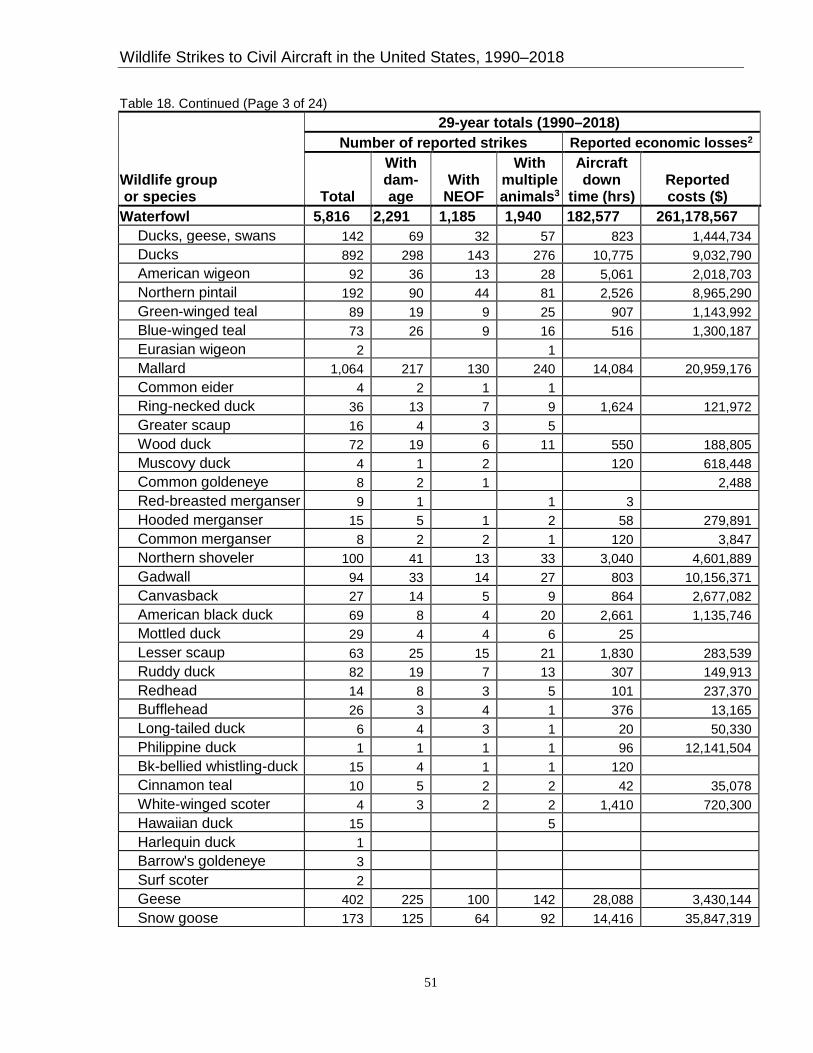
Wildlife Strikes to Civil Aircraft in the United States, 1990–2018
51
Table 18. Continued (Page 3 of 24) 29-year totals (1990–2018) Number of reported strikes Reported economic losses2
Wildlife group or species Total
With dam- age
With NEOF
With multiple animals3
Aircraft down
time (hrs) Reported costs ($)
Waterfowl 5,816 2,291 1,185 1,940 182,577 261,178,567 Ducks, geese, swans 142 69 32 57 823 1,444,734 Ducks 892 298 143 276 10,775 9,032,790 American wigeon 92 36 13 28 5,061 2,018,703 Northern pintail 192 90 44 81 2,526 8,965,290 Green-winged teal 89 19 9 25 907 1,143,992 Blue-winged teal 73 26 9 16 516 1,300,187 Eurasian wigeon 2 1 Mallard 1,064 217 130 240 14,084 20,959,176 Common eider 4 2 1 1 Ring-necked duck 36 13 7 9 1,624 121,972 Greater scaup 16 4 3 5 Wood duck 72 19 6 11 550 188,805 Muscovy duck 4 1 2 120 618,448 Common goldeneye 8 2 1 2,488 Red-breasted merganser 9 1 1 3 Hooded merganser 15 5 1 2 58 279,891 Common merganser 8 2 2 1 120 3,847 Northern shoveler 100 41 13 33 3,040 4,601,889 Gadwall 94 33 14 27 803 10,156,371 Canvasback 27 14 5 9 864 2,677,082 American black duck 69 8 4 20 2,661 1,135,746 Mottled duck 29 4 4 6 25 Lesser scaup 63 25 15 21 1,830 283,539 Ruddy duck 82 19 7 13 307 149,913 Redhead 14 8 3 5 101 237,370 Bufflehead 26 3 4 1 376 13,165 Long-tailed duck 6 4 3 1 20 50,330 Philippine duck 1 1 1 1 96 12,141,504 Bk-bellied whistling-duck 15 4 1 1 120 Cinnamon teal 10 5 2 2 42 35,078 White-winged scoter 4 3 2 2 1,410 720,300 Hawaiian duck 15 5 Harlequin duck 1 Barrow's goldeneye 3 Surf scoter 2 Geese 402 225 100 142 28,088 3,430,144 Snow goose 173 125 64 92 14,416 35,847,319
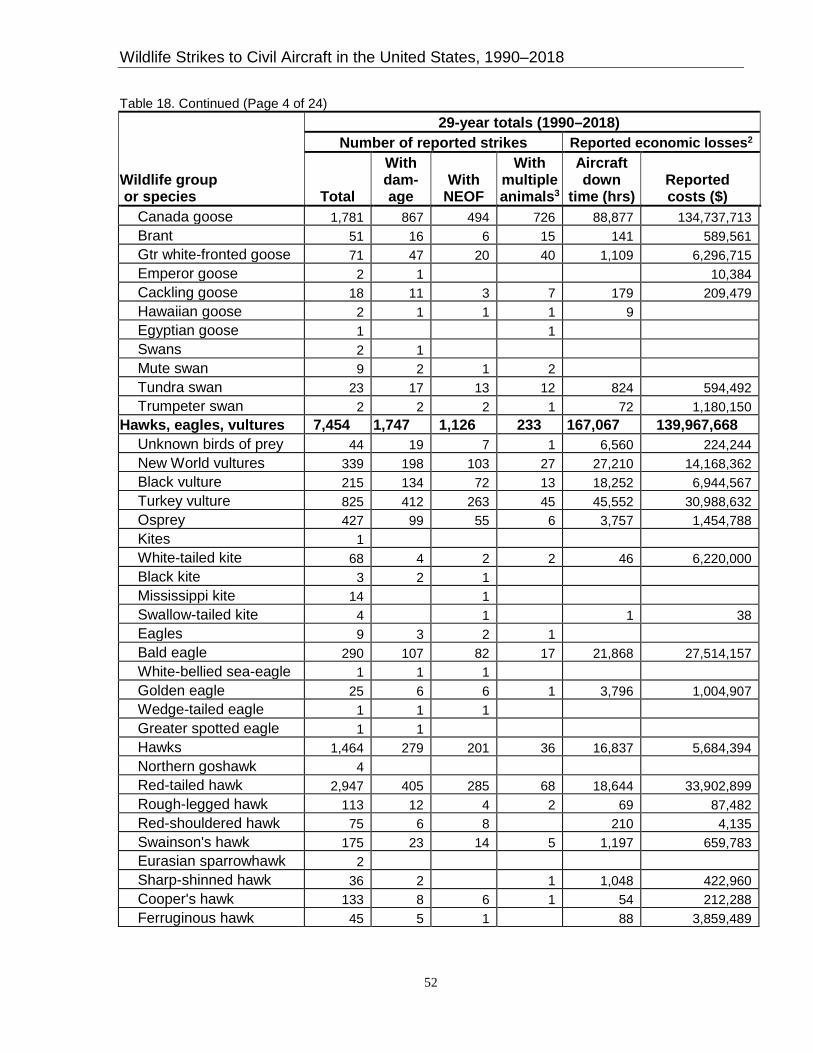
Wildlife Strikes to Civil Aircraft in the United States, 1990–2018
52
Table 18. Continued (Page 4 of 24) 29-year totals (1990–2018) Number of reported strikes Reported economic losses2
Wildlife group or species Total
With dam- age
With NEOF
With multiple animals3
Aircraft down
time (hrs) Reported costs ($)
Canada goose 1,781 867 494 726 88,877 134,737,713 Brant 51 16 6 15 141 589,561 Gtr white-fronted goose 71 47 20 40 1,109 6,296,715 Emperor goose 2 1 10,384 Cackling goose 18 11 3 7 179 209,479 Hawaiian goose 2 1 1 1 9 Egyptian goose 1 1 Swans 2 1 Mute swan 9 2 1 2 Tundra swan 23 17 13 12 824 594,492 Trumpeter swan 2 2 2 1 72 1,180,150
Hawks, eagles, vultures 7,454 1,747 1,126 233 167,067 139,967,668 Unknown birds of prey 44 19 7 1 6,560 224,244 New World vultures 339 198 103 27 27,210 14,168,362 Black vulture 215 134 72 13 18,252 6,944,567 Turkey vulture 825 412 263 45 45,552 30,988,632 Osprey 427 99 55 6 3,757 1,454,788 Kites 1 White-tailed kite 68 4 2 2 46 6,220,000 Black kite 3 2 1 Mississippi kite 14 1 Swallow-tailed kite 4 1 1 38 Eagles 9 3 2 1 Bald eagle 290 107 82 17 21,868 27,514,157 White-bellied sea-eagle 1 1 1 Golden eagle 25 6 6 1 3,796 1,004,907 Wedge-tailed eagle 1 1 1 Greater spotted eagle 1 1 Hawks 1,464 279 201 36 16,837 5,684,394 Northern goshawk 4 Red-tailed hawk 2,947 405 285 68 18,644 33,902,899 Rough-legged hawk 113 12 4 2 69 87,482 Red-shouldered hawk 75 6 8 210 4,135 Swainson's hawk 175 23 14 5 1,197 659,783 Eurasian sparrowhawk 2 Sharp-shinned hawk 36 2 1 1,048 422,960 Cooper's hawk 133 8 6 1 54 212,288 Ferruginous hawk 45 5 1 88 3,859,489

Wildlife Strikes to Civil Aircraft in the United States, 1990–2018
53
Table 18. Continued (Page 5 of 24) 29-year totals (1990–2018) Number of reported strikes Reported economic losses2
Wildlife group or species Total
With dam- age
With NEOF
With multiple animals3
Aircraft down
time (hrs) Reported costs ($)
Broad-winged hawk 31 12 4 3 1,607 166,820 Harris's hawk 5 Hawaiian hawk 3 2 3 2 White-tailed hawk 3 Eurasian buzzard 4 1 26 Northern harrier 144 3 2 3 3 291,723 Old World vultures 2 1 1 Lappet-faced vulture 1 1 1 240 6,156,000
Falcons and Caracaras 6,845 80 141 298 2,312 3,862,194 Falcons and Caracaras 57 5 6 2 178 107,747 Falcons, kestrels 6 1 1 1 13 523 Peregrine falcon 433 27 21 20 343 922,016 Gyrfalcon 2 Merlin 130 2 4 6 28 548,335 Prairie falcon 30 1 3 2 6,336 American kestrel 6,155 37 102 266 1,709 2,277,237 Eurasian kestrel 7 1 1 Caracaras 1 Crested caracara 23 6 3 1 41 Yellow-headed caracara 1
Gallinaceous birds 340 72 57 65 3,560 7,236,211 Grouse 2 1 Greater sage-grouse 41 12 6 15 556 517,231 Sharp-tailed grouse 19 1 2 3 24 800 Ruffed grouse 3 Spruce grouse 1 Ptarmigans 3 1 1 2 18 72,850 Willow ptarmigan 6 3 1 4 207 142,341 Rock ptarmigan 1 1 Quails, pheasants 1 1 18,601 New World quail 9 3 2 Northern bobwhite 16 3 3 2 93 8,446 Scaled quail 5 Gambel's quail 1 1 Ring-necked pheasant 95 18 13 6 883 110,552 Red-legged partridge 1 Gray partridge 32 4 5 13 44 5,748,459 Chukar 4 1 1
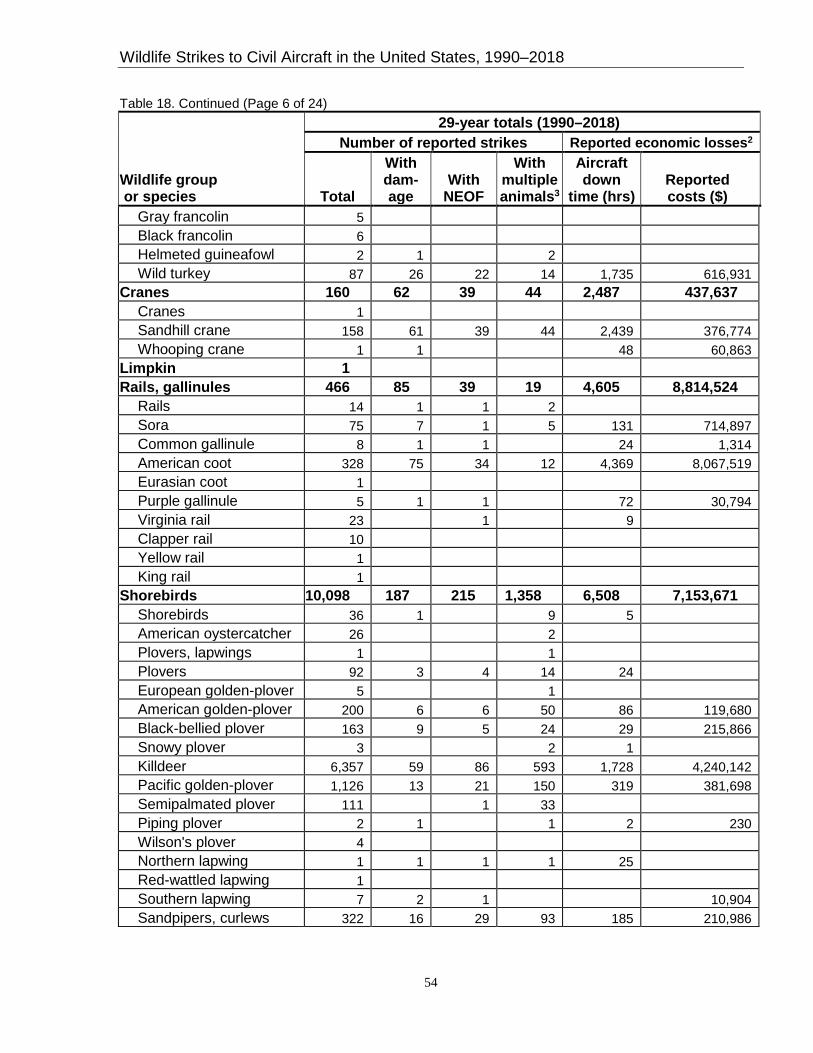
Wildlife Strikes to Civil Aircraft in the United States, 1990–2018
54
Table 18. Continued (Page 6 of 24) 29-year totals (1990–2018) Number of reported strikes Reported economic losses2
Wildlife group or species Total
With dam- age
With NEOF
With multiple animals3
Aircraft down
time (hrs) Reported costs ($)
Gray francolin 5 Black francolin 6 Helmeted guineafowl 2 1 2 Wild turkey 87 26 22 14 1,735 616,931
Cranes 160 62 39 44 2,487 437,637 Cranes 1 Sandhill crane 158 61 39 44 2,439 376,774 Whooping crane 1 1 48 60,863
Limpkin 1 Rails, gallinules 466 85 39 19 4,605 8,814,524
Rails 14 1 1 2 Sora 75 7 1 5 131 714,897 Common gallinule 8 1 1 24 1,314 American coot 328 75 34 12 4,369 8,067,519 Eurasian coot 1 Purple gallinule 5 1 1 72 30,794 Virginia rail 23 1 9 Clapper rail 10 Yellow rail 1 King rail 1
Shorebirds 10,098 187 215 1,358 6,508 7,153,671 Shorebirds 36 1 9 5 American oystercatcher 26 2 Plovers, lapwings 1 1 Plovers 92 3 4 14 24 European golden-plover 5 1 American golden-plover 200 6 6 50 86 119,680 Black-bellied plover 163 9 5 24 29 215,866 Snowy plover 3 2 1 Killdeer 6,357 59 86 593 1,728 4,240,142 Pacific golden-plover 1,126 13 21 150 319 381,698 Semipalmated plover 111 1 33 Piping plover 2 1 1 2 230 Wilson's plover 4 Northern lapwing 1 1 1 1 25 Red-wattled lapwing 1 Southern lapwing 7 2 1 10,904 Sandpipers, curlews 322 16 29 93 185 210,986

Wildlife Strikes to Civil Aircraft in the United States, 1990–2018
55
Table 18. Continued (Page 7 of 24) 29-year totals (1990–2018) Number of reported strikes Reported economic losses2
Wildlife group or species Total
With dam- age
With NEOF
With multiple animals3
Aircraft down
time (hrs) Reported costs ($)
Upland sandpiper 307 8 8 32 19 3,155 Spotted sandpiper 39 2 2 7 1 Willet 7 2 Common snipe 9 American woodcock 130 5 3 7 572 52,270 Dunlin 104 9 8 36 666 338,442 Baird's sandpiper 41 1 4 18 96,369 Western sandpiper 192 7 8 109 1,517 184,160 Pectoral sandpiper 46 4 3 12 22 172,252 Sanderling 39 1 4 10 6 Buff-breasted sandpiper 55 1 10 Surfbird 1 1 1 5,784 Ruddy turnstone 30 4 Bar-tailed godwit 1 Least sandpiper 194 2 5 47 8 6,144 Semipalmated sandpiper 111 1 2 42 1 10,530 Lesser yellowlegs 19 3 4 2 Short-billed dowitcher 16 3 4 6 10,930 Hudsonian godwit 6 1 1 2 96 35,383 Solitary sandpiper 12 1 2 Greater yellowlegs 16 5 1 2 120 63,793 Long-billed dowitcher 12 4 1 Red knot 4 1 White-rumped sandpiper 11 1 Black turnstone 1 Marbled godwit 4 1 1 1 48 174,319 Wilson's snipe 142 7 4 9 40 18,716 Rock sandpiper 2 2 South American snipe 1 Stilt sandpiper 1 Purple sandpiper 1 Wood sandpiper 1 Eurasian curlew 1 Whimbrel 20 2 1 4 360 55,800 Long-billed curlew 8 1 1 1 504 732,360 Red-necked phalarope 13 3 2 4 60 Wilson's phalarope 19 6 5 12 37 13,758 Red phalarope 1
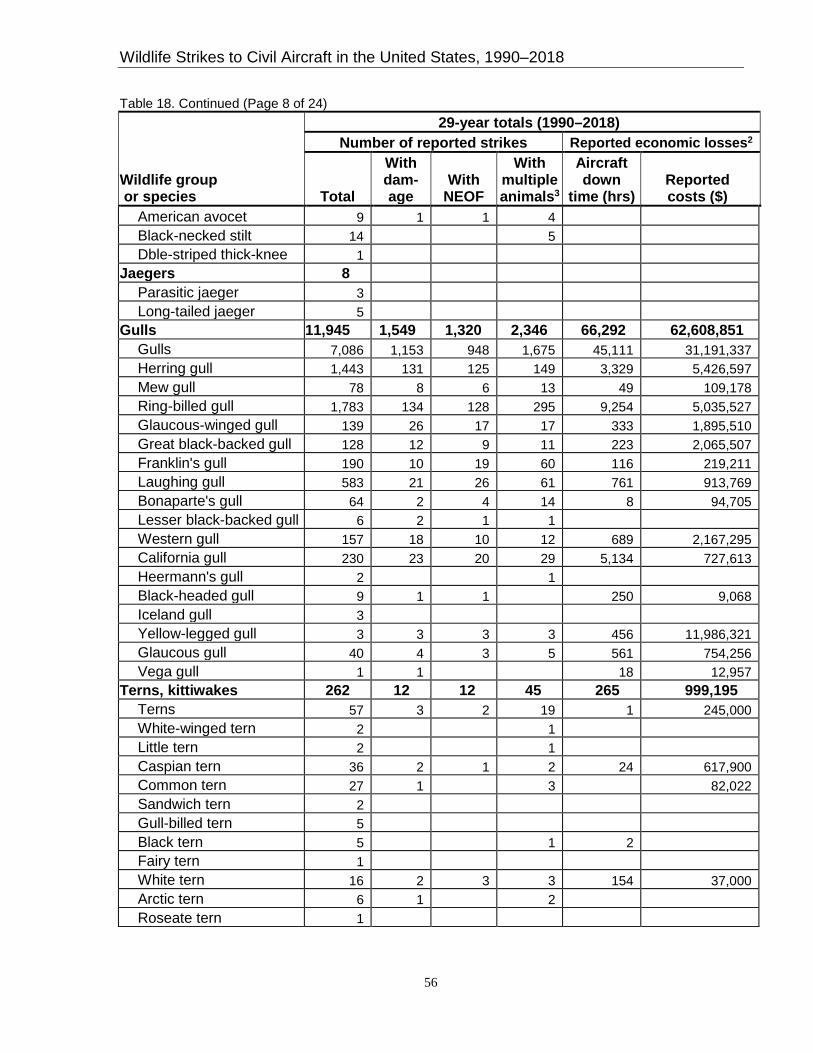
Wildlife Strikes to Civil Aircraft in the United States, 1990–2018
56
Table 18. Continued (Page 8 of 24) 29-year totals (1990–2018) Number of reported strikes Reported economic losses2
Wildlife group or species Total
With dam- age
With NEOF
With multiple animals3
Aircraft down
time (hrs) Reported costs ($)
American avocet 9 1 1 4 Black-necked stilt 14 5 Dble-striped thick-knee 1
Jaegers 8 Parasitic jaeger 3 Long-tailed jaeger 5
Gulls 11,945 1,549 1,320 2,346 66,292 62,608,851 Gulls 7,086 1,153 948 1,675 45,111 31,191,337 Herring gull 1,443 131 125 149 3,329 5,426,597 Mew gull 78 8 6 13 49 109,178 Ring-billed gull 1,783 134 128 295 9,254 5,035,527 Glaucous-winged gull 139 26 17 17 333 1,895,510 Great black-backed gull 128 12 9 11 223 2,065,507 Franklin's gull 190 10 19 60 116 219,211 Laughing gull 583 21 26 61 761 913,769 Bonaparte's gull 64 2 4 14 8 94,705 Lesser black-backed gull 6 2 1 1 Western gull 157 18 10 12 689 2,167,295 California gull 230 23 20 29 5,134 727,613 Heermann's gull 2 1 Black-headed gull 9 1 1 250 9,068 Iceland gull 3 Yellow-legged gull 3 3 3 3 456 11,986,321 Glaucous gull 40 4 3 5 561 754,256 Vega gull 1 1 18 12,957
Terns, kittiwakes 262 12 12 45 265 999,195 Terns 57 3 2 19 1 245,000 White-winged tern 2 1 Little tern 2 1 Caspian tern 36 2 1 2 24 617,900 Common tern 27 1 3 82,022 Sandwich tern 2 Gull-billed tern 5 Black tern 5 1 2 Fairy tern 1 White tern 16 2 3 3 154 37,000 Arctic tern 6 1 2 Roseate tern 1
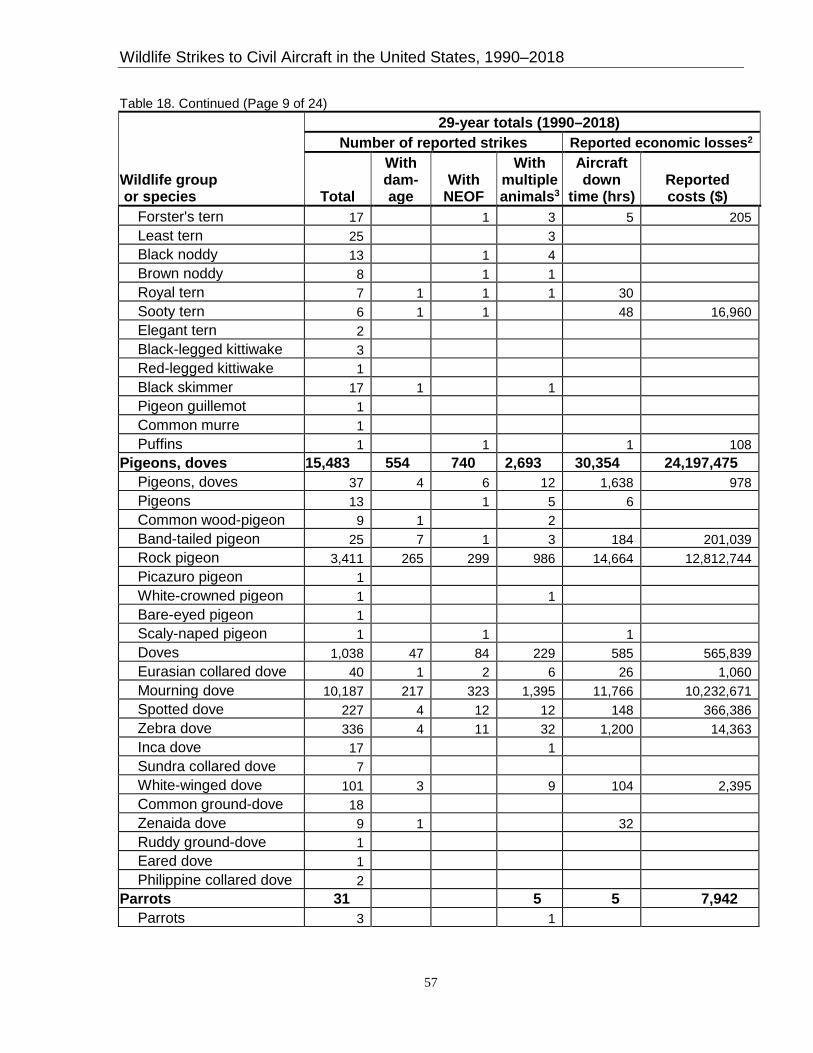
Wildlife Strikes to Civil Aircraft in the United States, 1990–2018
57
Table 18. Continued (Page 9 of 24) 29-year totals (1990–2018) Number of reported strikes Reported economic losses2
Wildlife group or species Total
With dam- age
With NEOF
With multiple animals3
Aircraft down
time (hrs) Reported costs ($)
Forster's tern 17 1 3 5 205 Least tern 25 3 Black noddy 13 1 4 Brown noddy 8 1 1 Royal tern 7 1 1 1 30 Sooty tern 6 1 1 48 16,960 Elegant tern 2 Black-legged kittiwake 3 Red-legged kittiwake 1 Black skimmer 17 1 1 Pigeon guillemot 1 Common murre 1 Puffins 1 1 1 108
Pigeons, doves 15,483 554 740 2,693 30,354 24,197,475 Pigeons, doves 37 4 6 12 1,638 978 Pigeons 13 1 5 6 Common wood-pigeon 9 1 2 Band-tailed pigeon 25 7 1 3 184 201,039 Rock pigeon 3,411 265 299 986 14,664 12,812,744 Picazuro pigeon 1 White-crowned pigeon 1 1 Bare-eyed pigeon 1 Scaly-naped pigeon 1 1 1 Doves 1,038 47 84 229 585 565,839 Eurasian collared dove 40 1 2 6 26 1,060 Mourning dove 10,187 217 323 1,395 11,766 10,232,671 Spotted dove 227 4 12 12 148 366,386 Zebra dove 336 4 11 32 1,200 14,363 Inca dove 17 1 Sundra collared dove 7 White-winged dove 101 3 9 104 2,395 Common ground-dove 18 Zenaida dove 9 1 32 Ruddy ground-dove 1 Eared dove 1 Philippine collared dove 2
Parrots 31 5 5 7,942 Parrots 3 1

Wildlife Strikes to Civil Aircraft in the United States, 1990–2018
58
Table 18. Continued (Page 10 of 24) 29-year totals (1990–2018) Number of reported strikes Reported economic losses2
Wildlife group or species Total
With dam- age
With NEOF
With multiple animals3
Aircraft down
time (hrs) Reported costs ($)
Budgerigar 17 1 Monk parakeet 4 1 Olive-throated parakeet 1 1 Nanday parakeet 3 5 7,942 Red-masked parakeet 2 Yw-chevroned parakeet 1 1
Cuckoos 105 15 4 9 754 456,202 Cuckoos 26 5 1 3 685 387,332 Yellow-billed cuckoo 65 9 3 6 50 68,870 Common cuckoo 1 Black-billed cuckoo 10 1 19 Philippine drongo-cuckoo 1 Greater roadrunner 2
Owls 3,421 174 109 42 3,687 10,284,475 Owls 354 34 22 6 1,484 532,516 Barn owl 1,475 52 35 21 488 3,240,327 Snowy owl 312 24 16 2 899 2,049,363 Little owl 1 Short-eared owl 614 13 15 5 137 1,591,302 Long-eared owl 19 3 1 24 54,650 Northern saw-whet owl 8 2 96 Burrowing owl 294 4 4 6 9 855 Barred owl 33 1 1 173 Northern pygmy-owl 1 Great gray owl 2 Eastern screech-owl 5 2 24 13,529 Western screech-owl 3 Great horned owl 299 39 15 2 526 2,801,760 Northern hawk owl 1
Nightjars 904 6 4 45 83 205 Nightjars 21 Eastern whip-poor-will 14 2 Common poorwill 13 1 Lesser nighthawk 23 2 12 Chuck-will's-widow 18 1 1 1 Common nighthawk 799 5 3 39 70 205 Common pauraque 13 1 Nacunda nighthawk 2

Wildlife Strikes to Civil Aircraft in the United States, 1990–2018
59
Table 18. Continued (Page 11 of 24) 29-year totals (1990–2018) Number of reported strikes Reported economic losses2
Wildlife group or species Total
With dam- age
With NEOF
With multiple animals3
Aircraft down
time (hrs) Reported costs ($)
Antillean nighthawk 1 Swifts 1,101 13 17 83 1,309 140,029
Swifts 21 1 1 Black swift 5 1 Chimney swift 936 8 14 78 1,254 41,829 Common swift 16 1 1 Vaux's swift 57 24 White-throated swift 66 3 3 2 31 98,200
Hummingbirds 94 3 2 Hummingbirds 5 Ruby-thrtd hummingbird 53 1 Rufous hummingbird 17 1 Anna's hummingbird 12 1 2 Bk-chinned hummingbird 3 Allen's hummingbird 1 Calliope hummingbird 2 Brd-tailed hummingbird 1
Belted kingfisher 14 Woodpeckers 294 25 8 12 643 289,525
Woodpeckers 14 1 1 1 Northern flicker 146 11 1 2 320 129,463 Yellow-bellied sapsucker 106 10 2 10 239 132,802 Hairy woodpecker 3 Red-naped sapsucker 5 2 2 19,260 Downy woodpecker 9 1 1 Red-bellied woodpecker 7 10 Red-breasted sapsucker 2 Red-headed woodpecker 1 Ladder-bkd woodpecker 1 1 1 72 8,000
Unidentified passiformes 1,049 34 23 74 265 197,420 Old world flycatchers 4
Spotted flycatcher 1 Blue-and-white swallow 2 Black redstart 1
Tyrant flycatchers 976 9 8 64 20 20,129 Tyrant flycatchers 38 6 1 856 Eastern wood-pewee 20 4 Gray kingbird 10
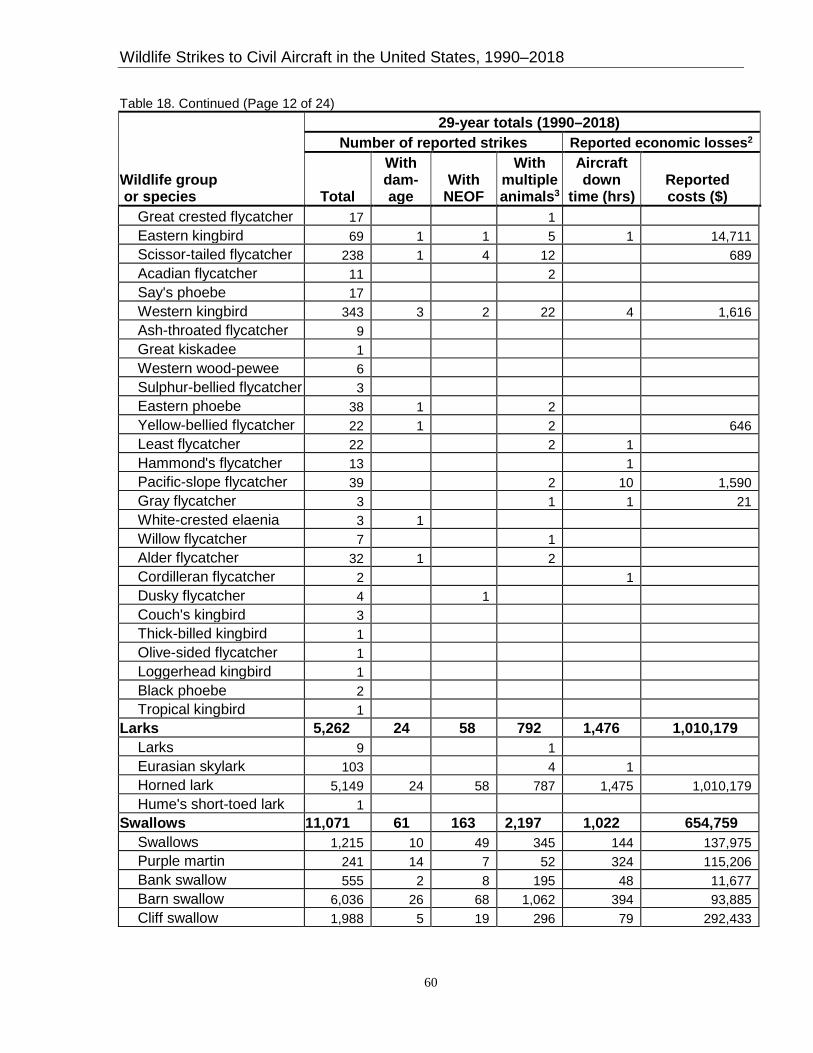
Wildlife Strikes to Civil Aircraft in the United States, 1990–2018
60
Table 18. Continued (Page 12 of 24) 29-year totals (1990–2018) Number of reported strikes Reported economic losses2
Wildlife group or species Total
With dam- age
With NEOF
With multiple animals3
Aircraft down
time (hrs) Reported costs ($)
Great crested flycatcher 17 1 Eastern kingbird 69 1 1 5 1 14,711 Scissor-tailed flycatcher 238 1 4 12 689 Acadian flycatcher 11 2 Say's phoebe 17 Western kingbird 343 3 2 22 4 1,616 Ash-throated flycatcher 9 Great kiskadee 1 Western wood-pewee 6 Sulphur-bellied flycatcher 3 Eastern phoebe 38 1 2 Yellow-bellied flycatcher 22 1 2 646 Least flycatcher 22 2 1 Hammond's flycatcher 13 1 Pacific-slope flycatcher 39 2 10 1,590 Gray flycatcher 3 1 1 21 White-crested elaenia 3 1 Willow flycatcher 7 1 Alder flycatcher 32 1 2 Cordilleran flycatcher 2 1 Dusky flycatcher 4 1 Couch's kingbird 3 Thick-billed kingbird 1 Olive-sided flycatcher 1 Loggerhead kingbird 1 Black phoebe 2 Tropical kingbird 1
Larks 5,262 24 58 792 1,476 1,010,179 Larks 9 1 Eurasian skylark 103 4 1 Horned lark 5,149 24 58 787 1,475 1,010,179 Hume's short-toed lark 1
Swallows 11,071 61 163 2,197 1,022 654,759 Swallows 1,215 10 49 345 144 137,975 Purple martin 241 14 7 52 324 115,206 Bank swallow 555 2 8 195 48 11,677 Barn swallow 6,036 26 68 1,062 394 93,885 Cliff swallow 1,988 5 19 296 79 292,433
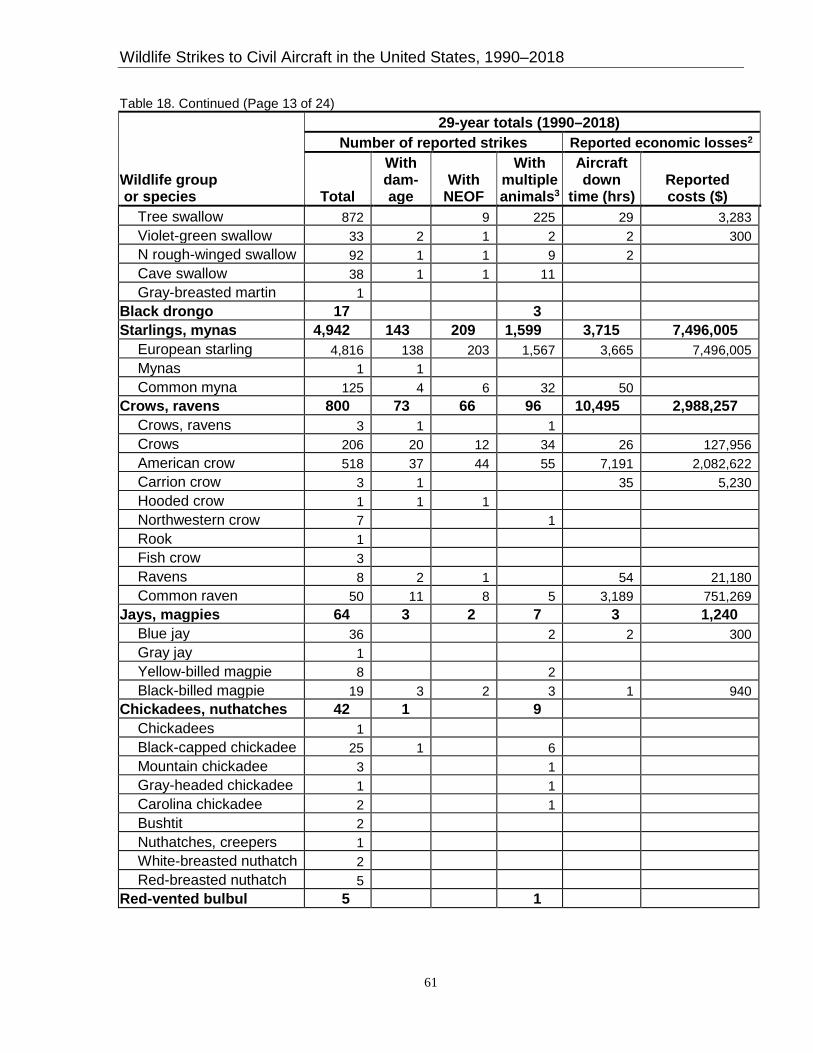
Wildlife Strikes to Civil Aircraft in the United States, 1990–2018
61
Table 18. Continued (Page 13 of 24) 29-year totals (1990–2018) Number of reported strikes Reported economic losses2
Wildlife group or species Total
With dam- age
With NEOF
With multiple animals3
Aircraft down
time (hrs) Reported costs ($)
Tree swallow 872 9 225 29 3,283 Violet-green swallow 33 2 1 2 2 300 N rough-winged swallow 92 1 1 9 2 Cave swallow 38 1 1 11 Gray-breasted martin 1
Black drongo 17 3 Starlings, mynas 4,942 143 209 1,599 3,715 7,496,005
European starling 4,816 138 203 1,567 3,665 7,496,005 Mynas 1 1 Common myna 125 4 6 32 50
Crows, ravens 800 73 66 96 10,495 2,988,257 Crows, ravens 3 1 1 Crows 206 20 12 34 26 127,956 American crow 518 37 44 55 7,191 2,082,622 Carrion crow 3 1 35 5,230 Hooded crow 1 1 1 Northwestern crow 7 1 Rook 1 Fish crow 3 Ravens 8 2 1 54 21,180 Common raven 50 11 8 5 3,189 751,269
Jays, magpies 64 3 2 7 3 1,240 Blue jay 36 2 2 300 Gray jay 1 Yellow-billed magpie 8 2 Black-billed magpie 19 3 2 3 1 940
Chickadees, nuthatches 42 1 9 Chickadees 1 Black-capped chickadee 25 1 6 Mountain chickadee 3 1 Gray-headed chickadee 1 1 Carolina chickadee 2 1 Bushtit 2 Nuthatches, creepers 1 White-breasted nuthatch 2 Red-breasted nuthatch 5
Red-vented bulbul 5 1

Wildlife Strikes to Civil Aircraft in the United States, 1990–2018
62
Table 18. Continued (Page 14 of 24) 29-year totals (1990–2018) Number of reported strikes Reported economic losses2
Wildlife group or species Total
With dam- age
With NEOF
With multiple animals3
Aircraft down
time (hrs) Reported costs ($)
Wrens 197 3 5 16 36 33,066 Wrens 60 1 3 9 1 Marsh wren 35 1 2 2 32 32,528 House wren 53 1 3 1 538 Carolina wren 12 1 Rock wren 2 Cactus wren 5 Winter wren 17 2 Bewick's wren 2 Sedge wren 9 1 Pacific wren 2
Mimics 428 8 4 25 246 2,238,769 Thrashers 1 Brown thrasher 27 2 1 1 175 2,228,231 Sage thrasher 5 Curve-billed thrasher 2 Long-billed thrasher 7 3 Mockingbirds 7 1 Northern mockingbird 131 2 2 3 1 Tropical mockingbird 1 Gray catbird 247 4 1 17 70 10,538
Thrushes 2,359 161 65 167 5,522 7,875,458 Thrushes 52 3 1 2 7 33,838 Western bluebird 10 1 1 1 21 1,218 Swainson's thrush 322 21 5 27 405 2,795,765 Redwing 2 American robin 1,439 106 44 95 4,169 4,853,864 Song thrush 1 1 Hermit thrush 259 8 4 14 743 36,106 Eastern bluebird 17 2 Gray-cheeked thrush 44 2 3 2 Varied thrush 72 13 2 7 48 37,076 Wood thrush 58 4 2 8 72 117,591 Mountain bluebird 35 5 Veery 44 4 4 2 55 Townsend's solitaire 2 1 Bicknell's thrush 2

Wildlife Strikes to Civil Aircraft in the United States, 1990–2018
63
Table 18. Continued (Page 15 of 24) 29-year totals (1990–2018) Number of reported strikes Reported economic losses2
Wildlife group or species Total
With dam- age
With NEOF
With multiple animals3
Aircraft down
time (hrs) Reported costs ($)
Wrentits, gnatcatchers 50 2 3 2 Garden warbler 1 Wrentit 1 Blue-gray gnatcatcher 48 2 3 2
Kinglets 215 2 12 13 318 Golden-crowned kinglet 54 3 Ruby-crowned kinglet 161 2 9 13 318
Pipits 237 1 3 39 28 Meadow pipit 1 American pipit 227 1 3 39 28 Sprague's pipit 8 Olive-backed pipit 1
Waxwings 346 9 7 72 332 372,974 Bohemian waxwing 3 2 Cedar waxwing 343 9 7 70 332 372,974
Shrikes 46 2 1 Northern shrike 3 Loggerhead shrike 43 2 1
Vireos 301 8 4 18 98 36,020 Vireos 4 White-eyed vireo 9 1 2 11 Blue-headed vireo 23 2 2 5 Yellow-throated vireo 4 Warbling vireo 41 1 1 7 9,020 Red-eyed vireo 208 5 4 14 84 26,989 Cassin's vireo 3 Philadelphia vireo 8 Bell's vireo 1
Japanese white-eye 3 New World wood-warblers 1,913 15 22 134 534 445,271
N World wood-warblers 90 1 8 1,989 Canada warbler 24 2 2 109 Yellow-breasted chat 31 1 1 1 Pine warbler 27 2 Black-and-white warbler 49 1 2 Northern parula 35 3 24 2,232 Ovenbird 118 2 1 8 17 2,871 Wilson's warbler 114 3 4 6,091
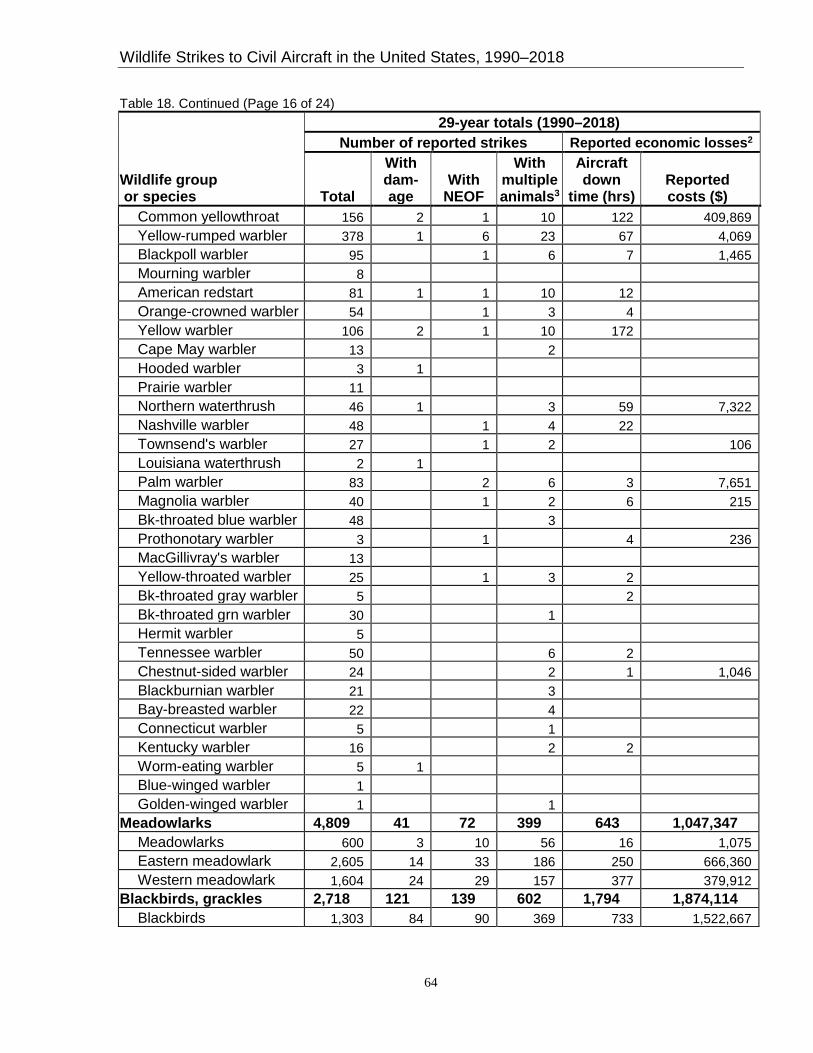
Wildlife Strikes to Civil Aircraft in the United States, 1990–2018
64
Table 18. Continued (Page 16 of 24) 29-year totals (1990–2018) Number of reported strikes Reported economic losses2
Wildlife group or species Total
With dam- age
With NEOF
With multiple animals3
Aircraft down
time (hrs) Reported costs ($)
Common yellowthroat 156 2 1 10 122 409,869 Yellow-rumped warbler 378 1 6 23 67 4,069 Blackpoll warbler 95 1 6 7 1,465 Mourning warbler 8 American redstart 81 1 1 10 12 Orange-crowned warbler 54 1 3 4 Yellow warbler 106 2 1 10 172 Cape May warbler 13 2 Hooded warbler 3 1 Prairie warbler 11 Northern waterthrush 46 1 3 59 7,322 Nashville warbler 48 1 4 22 Townsend's warbler 27 1 2 106 Louisiana waterthrush 2 1 Palm warbler 83 2 6 3 7,651 Magnolia warbler 40 1 2 6 215 Bk-throated blue warbler 48 3 Prothonotary warbler 3 1 4 236 MacGillivray's warbler 13 Yellow-throated warbler 25 1 3 2 Bk-throated gray warbler 5 2 Bk-throated grn warbler 30 1 Hermit warbler 5 Tennessee warbler 50 6 2 Chestnut-sided warbler 24 2 1 1,046 Blackburnian warbler 21 3 Bay-breasted warbler 22 4 Connecticut warbler 5 1 Kentucky warbler 16 2 2 Worm-eating warbler 5 1 Blue-winged warbler 1 Golden-winged warbler 1 1
Meadowlarks 4,809 41 72 399 643 1,047,347 Meadowlarks 600 3 10 56 16 1,075 Eastern meadowlark 2,605 14 33 186 250 666,360 Western meadowlark 1,604 24 29 157 377 379,912
Blackbirds, grackles 2,718 121 139 602 1,794 1,874,114 Blackbirds 1,303 84 90 369 733 1,522,667
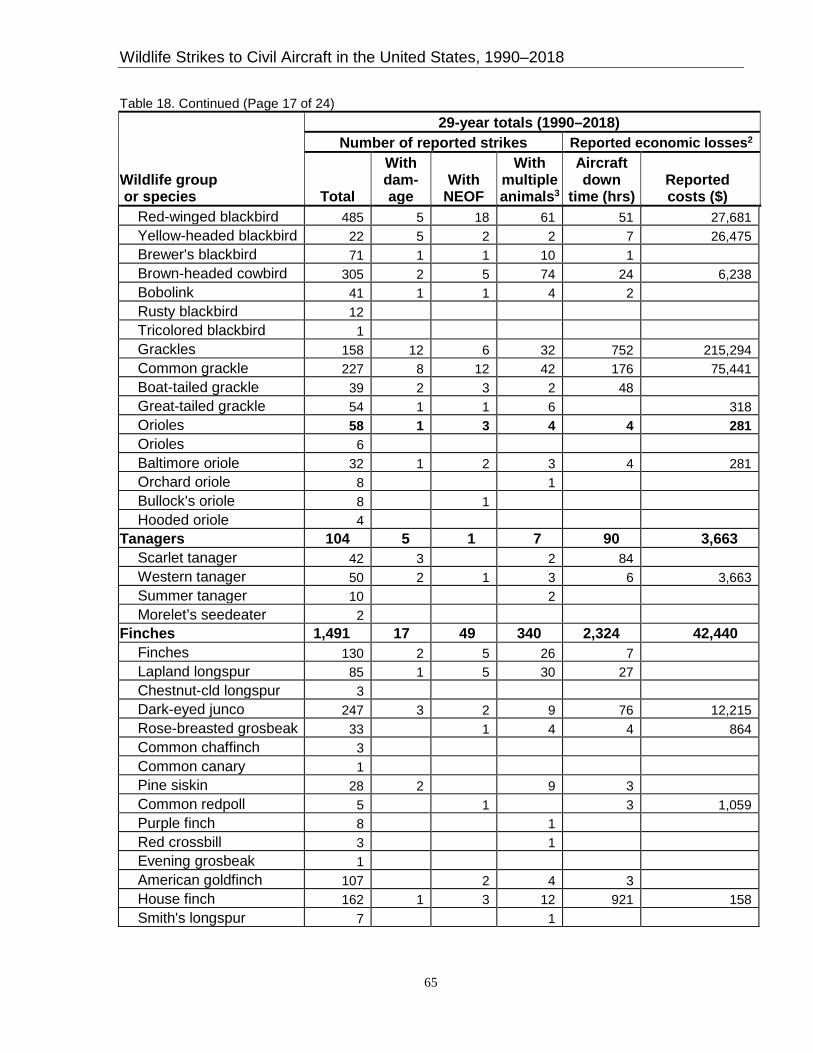
Wildlife Strikes to Civil Aircraft in the United States, 1990–2018
65
Table 18. Continued (Page 17 of 24) 29-year totals (1990–2018) Number of reported strikes Reported economic losses2
Wildlife group or species Total
With dam- age
With NEOF
With multiple animals3
Aircraft down
time (hrs) Reported costs ($)
Red-winged blackbird 485 5 18 61 51 27,681 Yellow-headed blackbird 22 5 2 2 7 26,475 Brewer's blackbird 71 1 1 10 1 Brown-headed cowbird 305 2 5 74 24 6,238 Bobolink 41 1 1 4 2 Rusty blackbird 12 Tricolored blackbird 1 Grackles 158 12 6 32 752 215,294 Common grackle 227 8 12 42 176 75,441 Boat-tailed grackle 39 2 3 2 48 Great-tailed grackle 54 1 1 6 318 Orioles 58 1 3 4 4 281 Orioles 6 Baltimore oriole 32 1 2 3 4 281 Orchard oriole 8 1 Bullock's oriole 8 1 Hooded oriole 4
Tanagers 104 5 1 7 90 3,663 Scarlet tanager 42 3 2 84 Western tanager 50 2 1 3 6 3,663 Summer tanager 10 2 Morelet’s seedeater 2
Finches 1,491 17 49 340 2,324 42,440 Finches 130 2 5 26 7 Lapland longspur 85 1 5 30 27 Chestnut-cld longspur 3 Dark-eyed junco 247 3 2 9 76 12,215 Rose-breasted grosbeak 33 1 4 4 864 Common chaffinch 3 Common canary 1 Pine siskin 28 2 9 3 Common redpoll 5 1 3 1,059 Purple finch 8 1 Red crossbill 3 1 Evening grosbeak 1 American goldfinch 107 2 4 3 House finch 162 1 3 12 921 158 Smith's longspur 7 1

Wildlife Strikes to Civil Aircraft in the United States, 1990–2018
66
Table 18. Continued (Page 18 of 24) 29-year totals (1990–2018) Number of reported strikes Reported economic losses2
Wildlife group or species Total
With dam- age
With NEOF
With multiple animals3
Aircraft down
time (hrs) Reported costs ($)
Dickcissel 29 1 4 1,183 White-winged crossbill 3 1 Red avadavat 8 3 McCown's longspur 3 Lesser goldfinch 8 Black-headed grosbeak 17 1 Cassin's finch 1 Pine grosbeak 1 Gray-crowned rosy-finch 1 Blue grosbeak 9 1 Hoary redpoll 2 1 Red-crested cardinal 6 1 1 Northern cardinal 14 Snow bunting 352 4 26 207 159 26,097 Indigo bunting 50 3 4 1,118 864 Lazuli bunting 6 Lark bunting 149 1 20 2 McKay's bunting 1 1 1 Painted bunting 7 Black-faced bunting 1 1
Sparrows 6,060 89 148 947 1,536 1,169,570 Sparrows 3,595 54 127 803 711 94,927 Harris's sparrow 8 1 Swamp sparrow 120 1 5 245 4,721 Savannah sparrow 830 8 6 44 34 22,385 Fox sparrow 79 3 3 5 26 62,502 White-throated sparrow 333 6 3 33 64 41,934 Gldn-crowned sparrow 27 1 6 157 Field sparrow 65 5 1 Lark sparrow 30 1 1 2 15,900 White-crowned sparrow 117 7 3 6 408 811,635 Grasshopper sparrow 113 2 1 4 9 34,749 Vesper sparrow 69 1 5 Chipping sparrow 126 1 8 6 339 Lincoln's sparrow 113 2 3 3 4 17,232 Song sparrow 334 3 19 20 62,590 Bell's sparrow 7 1 American tree sparrow 36 2 269

Wildlife Strikes to Civil Aircraft in the United States, 1990–2018
67
Table 18. Continued (Page 19 of 24) 29-year totals (1990–2018) Number of reported strikes Reported economic losses2
Wildlife group or species Total
With dam- age
With NEOF
With multiple animals3
Aircraft down
time (hrs) Reported costs ($)
Nelson's sparrow 6 1 230 Black-throated sparrow 3 Brewer's sparrow 23 1 1 LeConte's sparrow 6 Cassin's sparrow 4 Clay-colored sparrow 14 Baird's sparrow 1 Olive sparrow 1
Towhees 49 1 1 9 15,387 Eastern towhee 32 1 1 9 15,387 Green-tailed towhee 7 California towhee 2 Spotted towhee 8
Waxbills, mannikins 306 2 3 88 22 10,361 Waxbills, mannikins 3 Common waxbill 9 1 3 African silverbill 1 Munias 122 13 Scaly-breasted munia 102 1 1 42 19 7,161 Chestnut munia 64 1 1 26 3 3,200 White-throated munia 5 4
House sparrow 344 4 3 31 33 2,297 Total known birds 113,870 8,183 6,495 17,323 532,224 602,090,930 Total unknown birds 92,659 7,261 5,021 8,746 226,393 139,931,853
Unknown bird - ?size 13,011 702 751 652 13,315 5,174,567 Unknown bird - large 3,217 1,210 589 325 52,366 54,286,821 Unknown bird - medium 36,368 4,240 2,214 2,847 108,981 59,523,363 Unknown bird - small 40,063 1,109 1,467 4,922 51,731 20,947,102
Total birds 206,529 5,444 11,516 26,069 758,617 742,022,783
Flying mammals (bats) Bats (mega or micro) 1 1 9,962 Megabats (fruit bats) 15 3 2 4 99 4,596,298
Megabats (unk species) 12 2 2 4 99 4,596,298 Flying fox 1 Little red flying fox 1 Indian flying fox 1 1
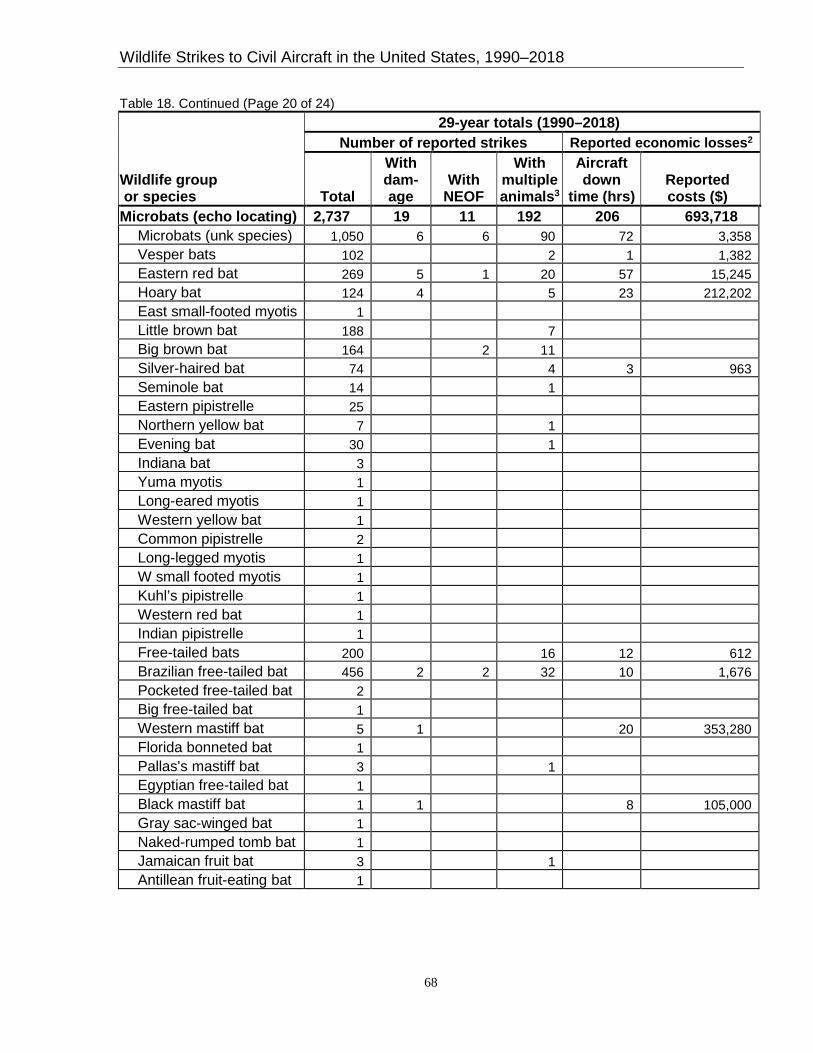
Wildlife Strikes to Civil Aircraft in the United States, 1990–2018
68
Table 18. Continued (Page 20 of 24) 29-year totals (1990–2018) Number of reported strikes Reported economic losses2
Wildlife group or species Total
With dam- age
With NEOF
With multiple animals3
Aircraft down
time (hrs) Reported costs ($)
Microbats (echo locating) 2,737 19 11 192 206 693,718 Microbats (unk species) 1,050 6 6 90 72 3,358 Vesper bats 102 2 1 1,382 Eastern red bat 269 5 1 20 57 15,245 Hoary bat 124 4 5 23 212,202 East small-footed myotis 1 Little brown bat 188 7 Big brown bat 164 2 11 Silver-haired bat 74 4 3 963 Seminole bat 14 1 Eastern pipistrelle 25 Northern yellow bat 7 1 Evening bat 30 1 Indiana bat 3 Yuma myotis 1 Long-eared myotis 1 Western yellow bat 1 Common pipistrelle 2 Long-legged myotis 1 W small footed myotis 1 Kuhl’s pipistrelle 1 Western red bat 1 Indian pipistrelle 1 Free-tailed bats 200 16 12 612 Brazilian free-tailed bat 456 2 2 32 10 1,676 Pocketed free-tailed bat 2 Big free-tailed bat 1 Western mastiff bat 5 1 20 353,280 Florida bonneted bat 1 Pallas's mastiff bat 3 1 Egyptian free-tailed bat 1 Black mastiff bat 1 1 8 105,000 Gray sac-winged bat 1 Naked-rumped tomb bat 1 Jamaican fruit bat 3 1 Antillean fruit-eating bat 1

Wildlife Strikes to Civil Aircraft in the United States, 1990–2018
69
Table 18. Continued (Page 21 of 24) 29-year totals (1990–2018) Number of reported strikes Reported economic losses2
Wildlife group or species Total
With dam- age
With NEOF
With multiple animals3
Aircraft down
time (hrs) Reported costs ($)
Total Megabats 15 3 2 4 99 4,596,298 Total Microbats 2,737 19 11 192 206 693,718 Unknown bats 1 1 9,962 Total bats 2,753 23 13 196 305 5,299,978
Terrestrial mammals Marsupials (V. opossum) 292 1 4 Xenarthyras (armadillo) 44 1 4 11 1,328 Lagomorphs 747 10 12 9 37 132,136
Lagomorphs 10 1 Hares 7 1 1 Black-tailed jackrabbit 403 5 4 2 12 35,104 White-tailed jackrabbit 61 1 1 2 17 Antelope jackrabbit 1 Snowshoe hare 1 Rabbits 96 2 5 1 Eastern cottontail 125 3 4 6 97,032 Desert cottontail 43
Rodents 329 3 10 5 6 7,512 North American beaver 4 Prairie dogs 6 Black-tailed prairie dog 59 1 2 White-tailed prairie dog 5 Gunnison's prairie dog 17 1 3 Woodchuck 171 3 8 6 7,512 Yellow-bellied marmot 1 Squirrels 10 Fox squirrel 1 Muskrat 36 N American porcupine 17 Coypu (nutria) 2
Carnivores 1,688 91 186 24 19,894 4,521,080 Canids 4 1 1 Coyote 615 56 120 8 16,793 3,991,401 Domestic dog 49 16 25 1 559 406,335 Foxes 40 4 5 10 1,093 Red fox 235 6 22 1 364 61,840 Common gray fox 10 2 2 5 545
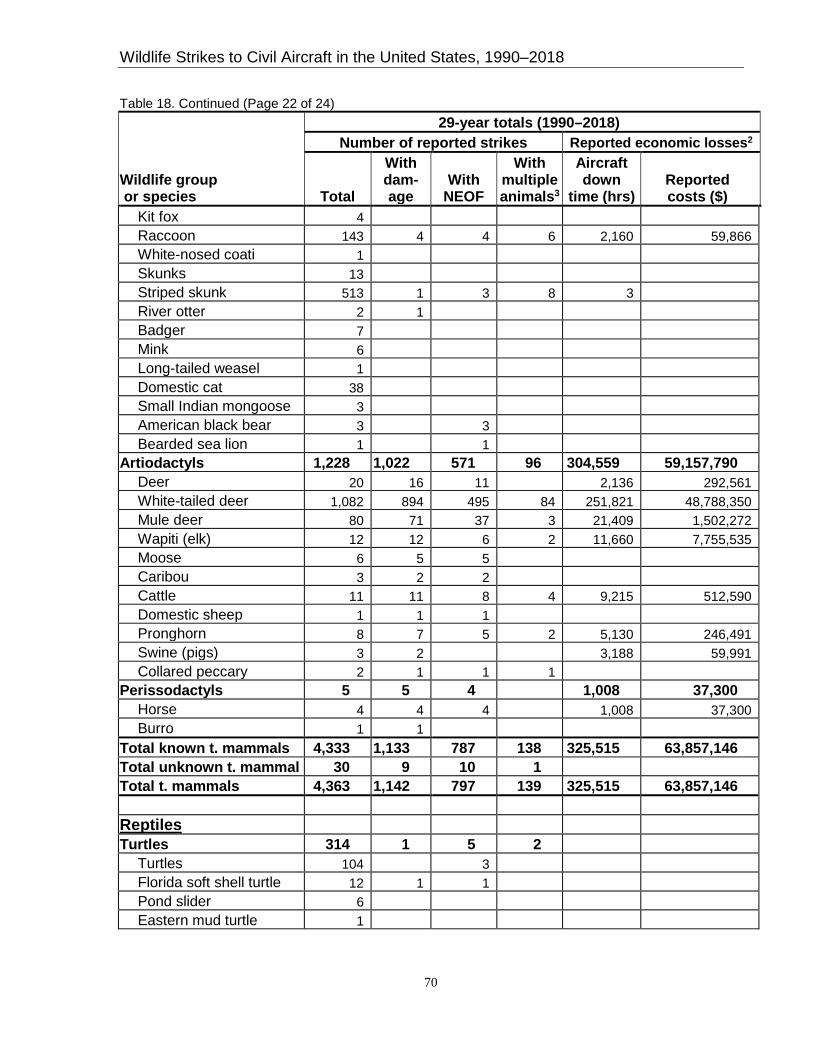
Wildlife Strikes to Civil Aircraft in the United States, 1990–2018
70
Table 18. Continued (Page 22 of 24) 29-year totals (1990–2018) Number of reported strikes Reported economic losses2
Wildlife group or species Total
With dam- age
With NEOF
With multiple animals3
Aircraft down
time (hrs) Reported costs ($)
Kit fox 4 Raccoon 143 4 4 6 2,160 59,866 White-nosed coati 1 Skunks 13 Striped skunk 513 1 3 8 3 River otter 2 1 Badger 7 Mink 6 Long-tailed weasel 1 Domestic cat 38 Small Indian mongoose 3 American black bear 3 3 Bearded sea lion 1 1
Artiodactyls 1,228 1,022 571 96 304,559 59,157,790 Deer 20 16 11 2,136 292,561 White-tailed deer 1,082 894 495 84 251,821 48,788,350 Mule deer 80 71 37 3 21,409 1,502,272 Wapiti (elk) 12 12 6 2 11,660 7,755,535 Moose 6 5 5 Caribou 3 2 2 Cattle 11 11 8 4 9,215 512,590 Domestic sheep 1 1 1 Pronghorn 8 7 5 2 5,130 246,491 Swine (pigs) 3 2 3,188 59,991 Collared peccary 2 1 1 1
Perissodactyls 5 5 4 1,008 37,300 Horse 4 4 4 1,008 37,300 Burro 1 1
Total known t. mammals 4,333 1,133 787 138 325,515 63,857,146 Total unknown t. mammal 30 9 10 1 Total t. mammals 4,363 1,142 797 139 325,515 63,857,146
Reptiles Turtles 314 1 5 2
Turtles 104 3 Florida soft shell turtle 12 1 1 Pond slider 6 Eastern mud turtle 1
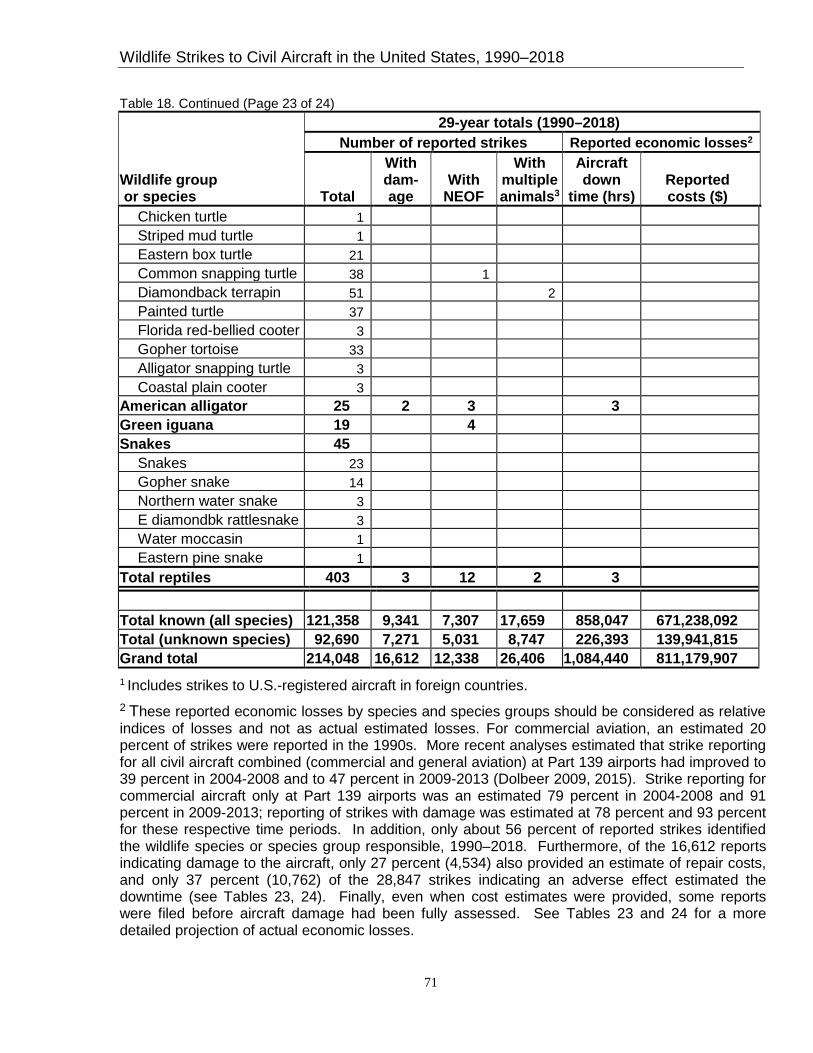
Wildlife Strikes to Civil Aircraft in the United States, 1990–2018
71
Table 18. Continued (Page 23 of 24) 29-year totals (1990–2018) Number of reported strikes Reported economic losses2
Wildlife group or species Total
With dam- age
With NEOF
With multiple animals3
Aircraft down
time (hrs) Reported costs ($)
Chicken turtle 1 Striped mud turtle 1 Eastern box turtle 21 Common snapping turtle 38 1 Diamondback terrapin 51 2 Painted turtle 37 Florida red-bellied cooter 3 Gopher tortoise 33 Alligator snapping turtle 3 Coastal plain cooter 3
American alligator 25 2 3 3 Green iguana 19 4 Snakes 45
Snakes 23 Gopher snake 14 Northern water snake 3 E diamondbk rattlesnake 3 Water moccasin 1 Eastern pine snake 1
Total reptiles 403 3 12 2 3
Total known (all species) 121,358 9,341 7,307 17,659 858,047 671,238,092 Total (unknown species) 92,690 7,271 5,031 8,747 226,393 139,941,815 Grand total 214,048 16,612 12,338 26,406 1,084,440 811,179,907 1 Includes strikes to U.S.-registered aircraft in foreign countries. 2 These reported economic losses by species and species groups should be considered as relative indices of losses and not as actual estimated losses. For commercial aviation, an estimated 20 percent of strikes were reported in the 1990s. More recent analyses estimated that strike reporting for all civil aircraft combined (commercial and general aviation) at Part 139 airports had improved to 39 percent in 2004-2008 and to 47 percent in 2009-2013 (Dolbeer 2009, 2015). Strike reporting for commercial aircraft only at Part 139 airports was an estimated 79 percent in 2004-2008 and 91 percent in 2009-2013; reporting of strikes with damage was estimated at 78 percent and 93 percent for these respective time periods. In addition, only about 56 percent of reported strikes identified the wildlife species or species group responsible, 1990–2018. Furthermore, of the 16,612 reports indicating damage to the aircraft, only 27 percent (4,534) also provided an estimate of repair costs, and only 37 percent (10,762) of the 28,847 strikes indicating an adverse effect estimated the downtime (see Tables 23, 24). Finally, even when cost estimates were provided, some reports were filed before aircraft damage had been fully assessed. See Tables 23 and 24 for a more detailed projection of actual economic losses.

Wildlife Strikes to Civil Aircraft in the United States, 1990–2018
72
Table 18. Continued (Page 24 of 24) 3 More than 1 animal was struck by the aircraft. 4 Of the 206,529 reported bird strikes, 92,218 (45 percent) identified the bird to exact species (a total of 576 species of birds of which 291 caused damage) and an additional 21,652 strikes (10 percent) identified the bird at least to species group (e.g., gull, hawk, duck). Exact species identification has improved from less than 20 percent in the early 1990s to about 60 percent in 2016 - 2018 (Figure 7). 5 Of the 2,753 reported bat strikes, 1,387 (50 percent) identified the bat to exact species (34 species total of which 6 caused damage) and 1,365 (50 percent) identified the bat to species group (13 megabats [old world fruit bats] and 1,352 microbats [echo-locating bats]) of which 1,050 were microbats of unknown species, 200 were free-tailed bats and 102 were vesper bats. One bat strike was classified as unknown bat (either megabat or microbat). 6 Of the 4,363 reported terrestrial mammal strikes, 4,127 (95 percent) identified the mammal to exact species (a total of 46 species of which 25 caused damage), 206 (5 percent) identified the mammal at least to species group, and 30 (<1 percent) were unknown species group. 7 All of the 403 reported reptile strikes were identified to species group and 276 (68 percent) were identified to exact species (20 species total of which 2 caused damage). 8 Reported costs of $811,179,907 include $718,971,370 in direct repair costs and $92,208,537 in other costs.
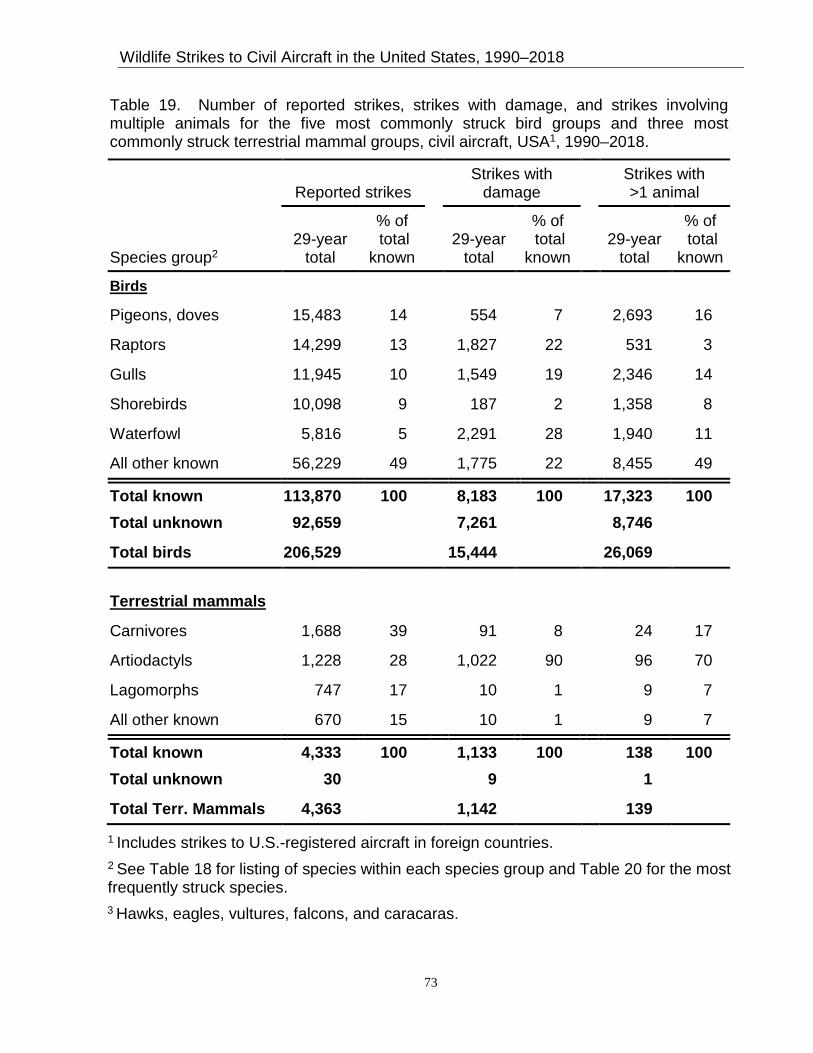
Wildlife Strikes to Civil Aircraft in the United States, 1990–2018
73
Table 19. Number of reported strikes, strikes with damage, and strikes involving multiple animals for the five most commonly struck bird groups and three most commonly struck terrestrial mammal groups, civil aircraft, USA1, 1990–2018.
Reported strikes Strikes with
damage Strikes with >1 animal
Species group2 29-year
total
% of total
known 29-year
total
% of total
known 29-year
total
% of total
known
Birds
Pigeons, doves 15,483 14 554 7 2,693 16
Raptors 14,299 13 1,827 22 531 3
Gulls 11,945 10 1,549 19 2,346 14
Shorebirds 10,098 9 187 2 1,358 8
Waterfowl 5,816 5 2,291 28 1,940 11
All other known 56,229 49 1,775 22 8,455 49
Total known 113,870 100 8,183 100 17,323 100 Total unknown 92,659 7,261 8,746
Total birds 206,529 15,444 26,069 Terrestrial mammals
Carnivores 1,688 39 91 8 24 17
Artiodactyls 1,228 28 1,022 90 96 70
Lagomorphs 747 17 10 1 9 7
All other known 670 15 10 1 9 7
Total known 4,333 100 1,133 100 138 100 Total unknown 30 9 1
Total Terr. Mammals 4,363 1,142 139 1 Includes strikes to U.S.-registered aircraft in foreign countries. 2 See Table 18 for listing of species within each species group and Table 20 for the most frequently struck species. 3 Hawks, eagles, vultures, falcons, and caracaras.

Wildlife Strikes to Civil Aircraft in the United States, 1990–2018
74
Table 20. The 33 species of birds identified most frequently as struck by civil aircraft in USA, 1990–2018 and 2018 only. See Figure 15 for relation between mean body mass of species and percent of strikes causing damage for top 20 species, 1990-2018.
Strikes (1990–2018)1 Strikes (2018 only)1
Rank Bird species Num- ber
% with damage
Bird species
Num- ber
% with damage
1 Mourning dove 10,187 2.1 Mourning dove 928 1.0 2 Killdeer 6,357 0.9 Barn swallow 729 0.3 3 American kestrel 6,155 0.6 Killdeer 633 0.5 4 Barn swallow 6,036 0.4 American kestrel 523 0.2 5 Horned lark 5,149 0.5 Horned lark 512 0.4 6 European starling 4,816 2.9 Eastern meadowlark 339 0.6 7 Rock pigeon 3,411 7.8 European starling 274 1.1 8 Red-tailed hawk 2,947 13.7 Red-tailed hawk 252 14.7 9 Eastern meadowlark 2,605 0.5 Cliff swallow 238 0.0 10 Cliff swallow 1,988 0.3 Western meadowlark 188 1.6 11 Ring-billed gull 1,783 7.5 Rock pigeon 183 3.3 12 Canada goose 1,781 48.7 American robin 160 6.9 13 W meadowlark 1,604 1.5 Savannah sparrow 155 0.6 14 Barn owl 1,475 3.5 Chimney swift 149 0.0 15 Herring gull 1,443 9.1 Barn owl 136 2.9 16 American robin 1,439 7.4 Common nighthawk 109 0.9 17 P golden-plover 1,126 1.2 Herring gull 86 4.7 18 Mallard 1,064 20.4 Tree swallow 77 0.0 19 Chimney swift 936 0.9 Y-rumped warbler 76 0.0 20 Tree swallow 872 0.0 Turkey vulture 67 46.3 21 Savannah sparrow 830 1.0 Swainson's thrush 67 6.0 22 Turkey vulture 825 49.9 Ring-billed gull 65 4.6 23 Common nighthawk 799 0.6 Laughing gull 63 0.0 24 Short-eared owl 614 2.1 Canada goose 62 33.9 25 Laughing gull 583 3.6 R-winged blackbird 62 0.0 26 Bank swallow 555 0.4 Cattle egret 61 3.3 27 Cattle egret 543 7.7 Mallard 61 8.2 28 American crow 518 7.1 Wh-throated sparrow 59 1.7 29 R-winged blackbird 485 1.0 Pacific golden-plover 53 0.0 30 Great blue heron 462 18.8 Snowy owl 52 7.7 31 Peregrine falcon 433 6.2 Red-eyed vireo 49 0.0 32 Osprey 427 23.2 Short-eared owl 48 0.0 33 Y-rumped warbler 378 0.3 Bank swallow 48 0.0
1 Actual number struck was higher for each species because only 45 percent and 59 percent of the bird strike reports from 1990–2018 and in 2018, respectively, identified the bird to species. For example, there were 7,086 gull strikes reported from 1990-2018 in which the species of gull was not determined (Table 18).

Wildlife Strikes to Civil Aircraft in the United States, 1990–2018
75
Table 21. Number of strikes to civil aircraft causing human fatality or injury and number of injuries and fatalities by wildlife species, USA1, 1990–2018.
Strikes causing fatalities Strikes causing injuries
Species of wildlife
No. of strikes
No. of humans
Species of wildlife
No. of strikes
No. of humans
Unknown bird 6 8 Unknown bird 48 64 Red-tailed hawk 1 8 White-tailed deer 20 28 Amer. white pelican 1 5 Turkey vulture 18 22 Bald eagle 1 4 Ducks 17 20 Snow goose 1 3 Canada goose 15 18 Canada goose 1 2 Black vulture 9 14 White-tailed deer 1 1 Red-tailed hawk 8 10 Brown pelican 1 1 New World vultures 9 9 Turkey vulture 1 1 Gulls 8 9 Total fatalities 14 33 Ring-billed gull 3 9
Mallard 6 7 Bald eagle 4 7 Geese 6 6 D-crested cormorant 4 5 Snow goose 5 5 Hawks 3 5 American kestrel 1 5 American coot 5 5 Anhinga 3 4 Lesser scaup 4 4 Golden eagle 2 4 Eurasian kestrel 1 4 Spotted dove 1 4 Cattle 2 3 Western grebe 2 3 Gr white-fronted goose 2 3 Osprey 3 3 Herring gull 3 3 Rock pigeon 3 3 28 species with <2 injuries 29 33
Total injuries 244 319
1 Includes strikes to U.S.-registered aircraft in foreign countries.
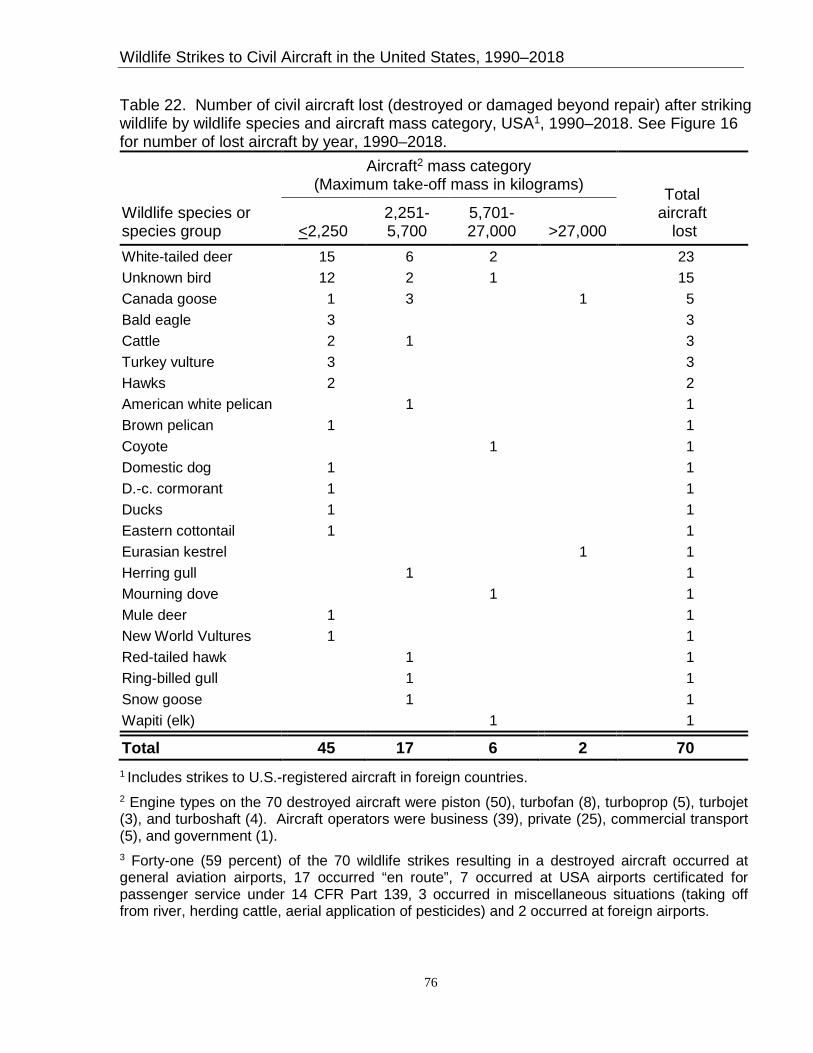
Wildlife Strikes to Civil Aircraft in the United States, 1990–2018
76
Table 22. Number of civil aircraft lost (destroyed or damaged beyond repair) after striking wildlife by wildlife species and aircraft mass category, USA1, 1990–2018. See Figure 16 for number of lost aircraft by year, 1990–2018.
Wildlife species or species group
Aircraft2 mass category (Maximum take-off mass in kilograms) Total
aircraft lost <2,250
2,251- 5,700
5,701- 27,000 >27,000
White-tailed deer 15 6 2 23 Unknown bird 12 2 1 15 Canada goose 1 3 1 5 Bald eagle 3 3 Cattle 2 1 3 Turkey vulture 3 3 Hawks 2 2 American white pelican 1 1 Brown pelican 1 1 Coyote 1 1 Domestic dog 1 1 D.-c. cormorant 1 1 Ducks 1 1 Eastern cottontail 1 1 Eurasian kestrel 1 1 Herring gull 1 1 Mourning dove 1 1 Mule deer 1 1 New World Vultures 1 1 Red-tailed hawk 1 1 Ring-billed gull 1 1 Snow goose 1 1 Wapiti (elk) 1 1
Total 45 17 6 2 70 1 Includes strikes to U.S.-registered aircraft in foreign countries. 2 Engine types on the 70 destroyed aircraft were piston (50), turbofan (8), turboprop (5), turbojet (3), and turboshaft (4). Aircraft operators were business (39), private (25), commercial transport (5), and government (1). 3 Forty-one (59 percent) of the 70 wildlife strikes resulting in a destroyed aircraft occurred at general aviation airports, 17 occurred “en route”, 7 occurred at USA airports certificated for passenger service under 14 CFR Part 139, 3 occurred in miscellaneous situations (taking off from river, herding cattle, aerial application of pesticides) and 2 occurred at foreign airports.
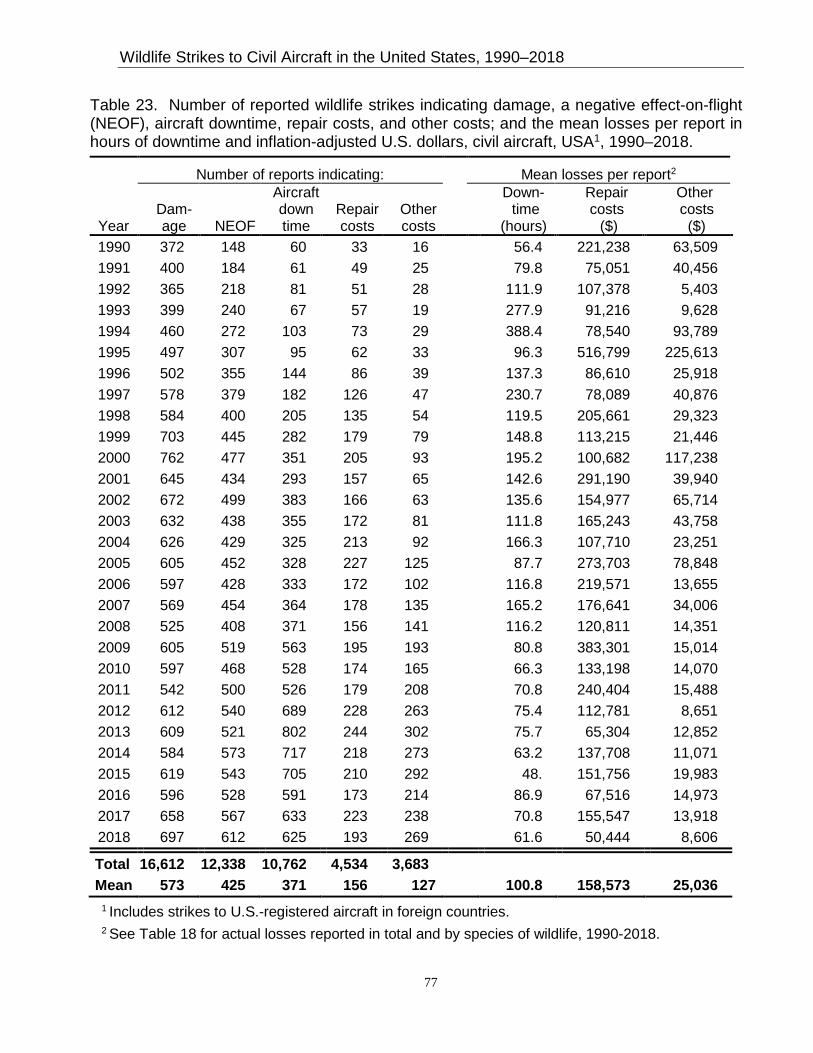
Wildlife Strikes to Civil Aircraft in the United States, 1990–2018
77
Table 23. Number of reported wildlife strikes indicating damage, a negative effect-on-flight (NEOF), aircraft downtime, repair costs, and other costs; and the mean losses per report in hours of downtime and inflation-adjusted U.S. dollars, civil aircraft, USA1, 1990–2018.
Number of reports indicating: Mean losses per report2
Year Dam-age NEOF
Aircraft down time
Repair costs
Other costs
Down- time
(hours)
Repair costs ($)
Other costs ($)
1990 372 148 60 33 16 56.4 221,238 63,509 1991 400 184 61 49 25 79.8 75,051 40,456 1992 365 218 81 51 28 111.9 107,378 5,403 1993 399 240 67 57 19 277.9 91,216 9,628 1994 460 272 103 73 29 388.4 78,540 93,789 1995 497 307 95 62 33 96.3 516,799 225,613 1996 502 355 144 86 39 137.3 86,610 25,918 1997 578 379 182 126 47 230.7 78,089 40,876 1998 584 400 205 135 54 119.5 205,661 29,323 1999 703 445 282 179 79 148.8 113,215 21,446 2000 762 477 351 205 93 195.2 100,682 117,238 2001 645 434 293 157 65 142.6 291,190 39,940 2002 672 499 383 166 63 135.6 154,977 65,714 2003 632 438 355 172 81 111.8 165,243 43,758 2004 626 429 325 213 92 166.3 107,710 23,251 2005 605 452 328 227 125 87.7 273,703 78,848 2006 597 428 333 172 102 116.8 219,571 13,655 2007 569 454 364 178 135 165.2 176,641 34,006 2008 525 408 371 156 141 116.2 120,811 14,351 2009 605 519 563 195 193 80.8 383,301 15,014 2010 597 468 528 174 165 66.3 133,198 14,070 2011 542 500 526 179 208 70.8 240,404 15,488 2012 612 540 689 228 263 75.4 112,781 8,651 2013 609 521 802 244 302 75.7 65,304 12,852 2014 584 573 717 218 273 63.2 137,708 11,071 2015 619 543 705 210 292 48. 151,756 19,983 2016 596 528 591 173 214 86.9 67,516 14,973 2017 658 567 633 223 238 70.8 155,547 13,918 2018 697 612 625 193 269 61.6 50,444 8,606
Total 16,612 12,338 10,762 4,534 3,683 Mean 573 425 371 156 127 100.8 158,573 25,036
1 Includes strikes to U.S.-registered aircraft in foreign countries. 2 See Table 18 for actual losses reported in total and by species of wildlife, 1990-2018.

Wildlife Strikes to Civil Aircraft in the United States, 1990–2018
78
Table 24. Minimum projected annual losses in aircraft downtime (hours) and in repair and other costs (inflation-adjusted U.S. dollars) from wildlife strikes with civil aircraft, USA1, 1990–2018. Losses are projected from mean reported losses per incident (Table 23). (Page 1 of 2).
Minimum projected losses2, 3
Year
No. of adverse
incidents4
Down- time
(hours)
Repair costs
(x $1 million)
Other costs
(x $1 million)
Total costs
(x $1 million) 1990 427 24,061 94 27 122 1991 484 38,601 36 20 56 1992 493 55,179 53 3 56 1993 509 141,456 46 5 51 1994 582 226,070 46 55 100 1995 656 63,149 339 148 487 1996 684 93,891 59 18 77 1997 783 180,606 61 32 93 1998 806 96,319 166 24 189 1999 979 145,649 111 21 132 2000 1,112 217,046 112 130 242 2001 977 139,314 284 39 324 2002 1,105 149,841 171 73 244 2003 998 111,602 165 44 209 2004 950 158,029 102 22 124 2005 975 85,550 267 77 344 2006 940 109,794 206 13 219 2007 979 161,772 173 33 206 2008 905 105,126 109 13 122 2009 1,186 95,857 455 18 472 2010 1,129 74,843 150 16 166 2011 1,147 81,178 276 18 294 2012 1,333 100,567 150 12 162 2013 1,447 109,550 95 19 113 2014 1,458 92,205 201 16 217 2015 1,453 69,683 221 29 250 2016 1,350 117,290 91 20 111 2017 1,443 102,129 224 20 245 2018 1,557 95,950 79 13 92
Total 28,847 3,146,358 4,465 962 5,427 Mean 995 108,495 154 33 187

Wildlife Strikes to Civil Aircraft in the United States, 1990–2018
79
Table 24. Continued (Page 2 of 2) 1 Includes strikes to U.S.-registered aircraft in foreign countries. 2 Minimum values are based on the assumption that all 28,847 reported strikes (mean of 995/year) indicating an adverse effect (see footnote 3) incurred similar amounts of damage and/or downtime and that these reports are all of the adverse-effect strikes that occurred, 1990–2018. 3 Analyses of strike data from 1991-2004 indicated that 11 to 21 percent of strikes were reported for air carrier aircraft at Part 139 airports certificated for passenger traffic (Linnell et al. 1999, Cleary et al. 2005, Wright and Dolbeer 2005). Strike reporting for general aviation (GA) aircraft at GA airports was estimated at less than 5 percent in the 1990s and early 2000s (Dolbeer et al. 2008, Dolbeer 2009). More recent analyses estimated that strike reporting for all civil aircraft combined (commercial and general aviation) at Part 139 airports had improved to 39 percent in 2004-2008 and to 47 percent in 2009-2013 (Dolbeer 2009, 2015). Strike reporting for commercial aircraft only at Part 139 airports was an estimated 79 percent in 2004-2008 and 91 percent in 2009-2013; reporting of strikes with damage was estimated at 78 percent and 93 percent for these respective time periods. For these reasons, we project that actual costs are likely 2 or more times higher than these minimum estimates. 4 Number of reports indicating one or more of the following: damage, negative effect on flight (EOF), downtime, repair costs, other costs.

Wildlife Strikes to Civil Aircraft in the United States, 1990–2018
80
This page intentionally left blank

Wildlife Strikes to Civil Aircraft in the United States, 1990–2018
81
Figures
Figure 1. Number of reported wildlife strikes with civil aircraft, USA, 1990–2018. The 209,950 strikes involved birds (202,472), terrestrial mammals (4,350), bats (2,725), and reptiles (403). An additional 4,098 strikes were reported for U.S.-registered aircraft in foreign countries (see Tables 1, 2, and 18).
Figure 2. Number of reported wildlife strikes causing damage to civil aircraft, USA, 1990–2018. The 16,221 damaging strikes involved birds (15,057), terrestrial mammals (1,141), bats (20), and reptiles (3). An additional 391 damage strikes were reported for U.S.-registered aircraft in foreign countries (see Tables 1, 2 and 18).
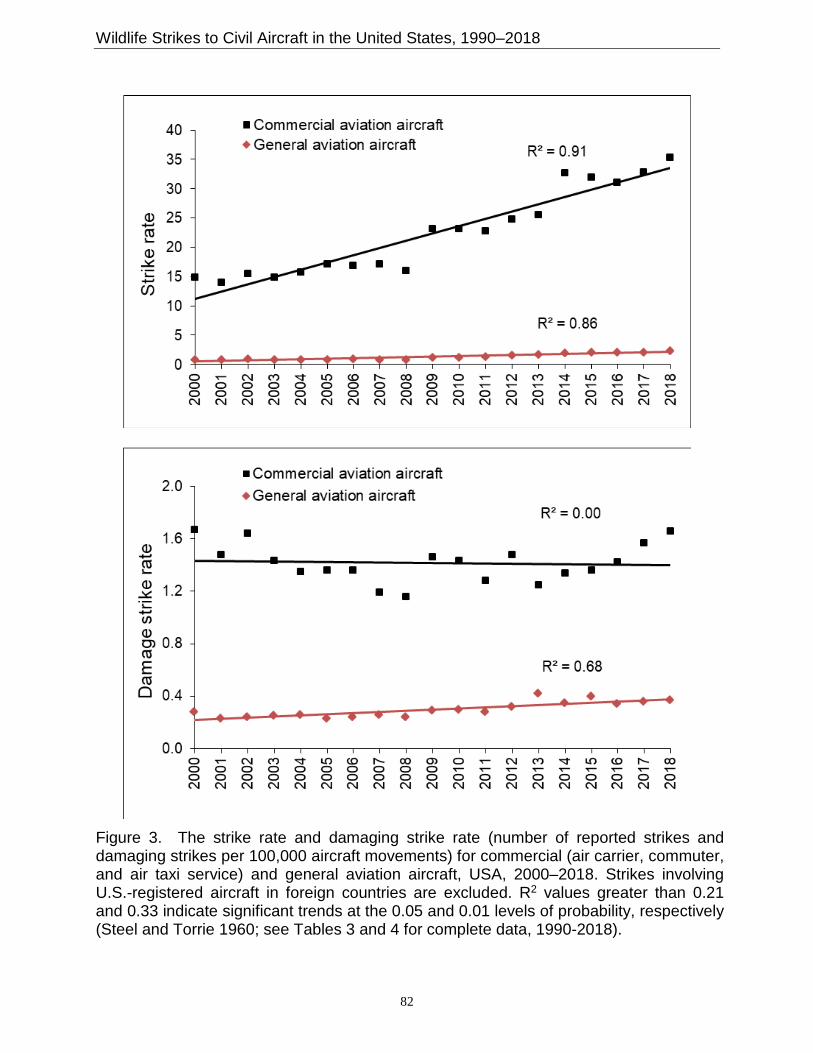
Wildlife Strikes to Civil Aircraft in the United States, 1990–2018
82
Figure 3. The strike rate and damaging strike rate (number of reported strikes and damaging strikes per 100,000 aircraft movements) for commercial (air carrier, commuter, and air taxi service) and general aviation aircraft, USA, 2000–2018. Strikes involving U.S.-registered aircraft in foreign countries are excluded. R2 values greater than 0.21 and 0.33 indicate significant trends at the 0.05 and 0.01 levels of probability, respectively (Steel and Torrie 1960; see Tables 3 and 4 for complete data, 1990-2018).
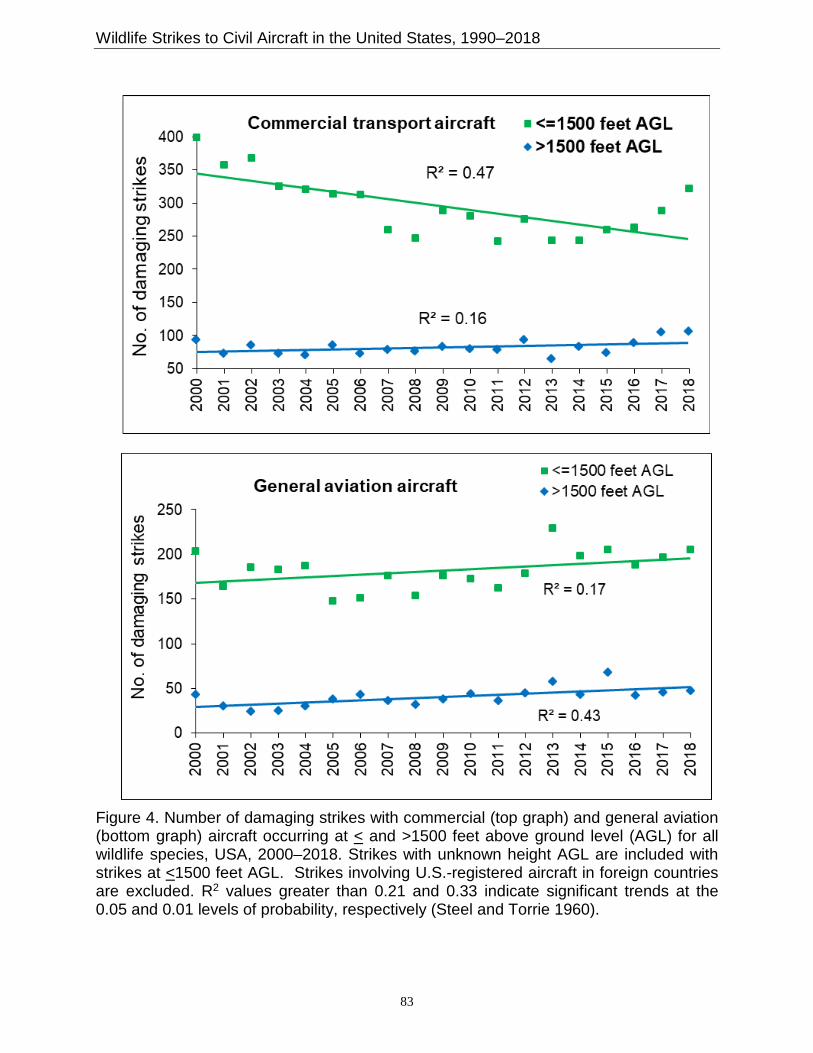
Wildlife Strikes to Civil Aircraft in the United States, 1990–2018
83
Figure 4. Number of damaging strikes with commercial (top graph) and general aviation (bottom graph) aircraft occurring at < and >1500 feet above ground level (AGL) for all wildlife species, USA, 2000–2018. Strikes with unknown height AGL are included with strikes at <1500 feet AGL. Strikes involving U.S.-registered aircraft in foreign countries are excluded. R2 values greater than 0.21 and 0.33 indicate significant trends at the 0.05 and 0.01 levels of probability, respectively (Steel and Torrie 1960).
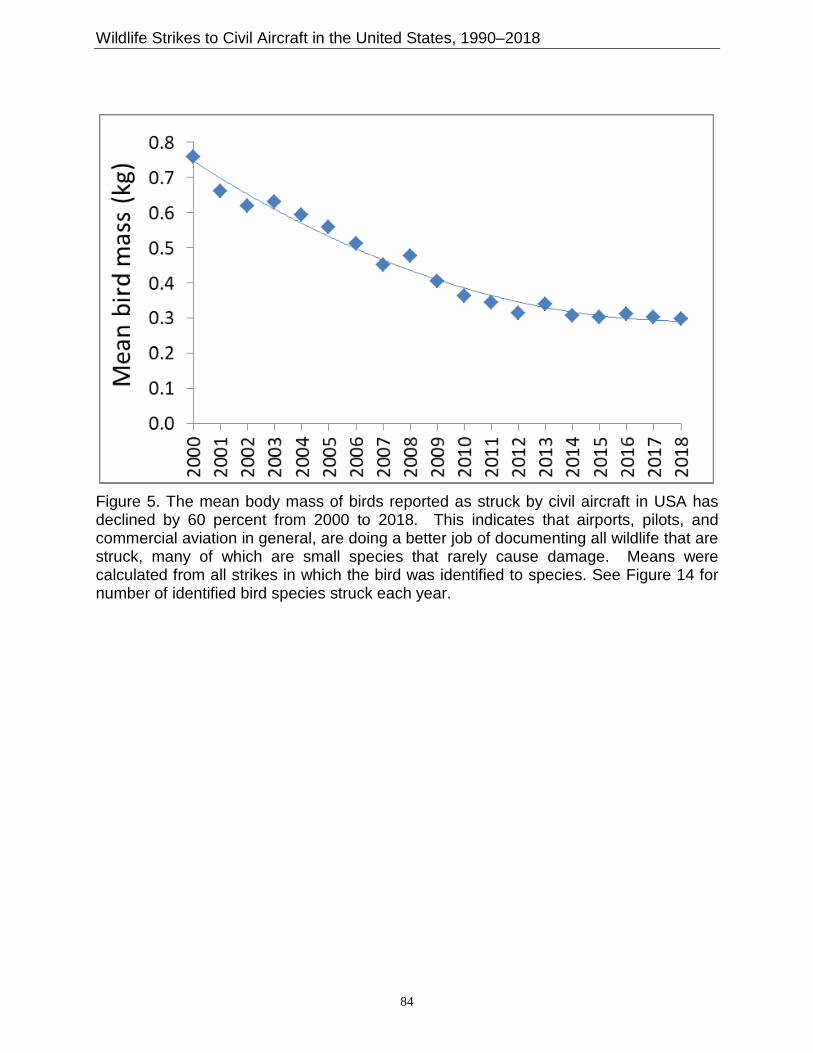
Wildlife Strikes to Civil Aircraft in the United States, 1990–2018
84
Figure 5. The mean body mass of birds reported as struck by civil aircraft in USA has declined by 60 percent from 2000 to 2018. This indicates that airports, pilots, and commercial aviation in general, are doing a better job of documenting all wildlife that are struck, many of which are small species that rarely cause damage. Means were calculated from all strikes in which the bird was identified to species. See Figure 14 for number of identified bird species struck each year.
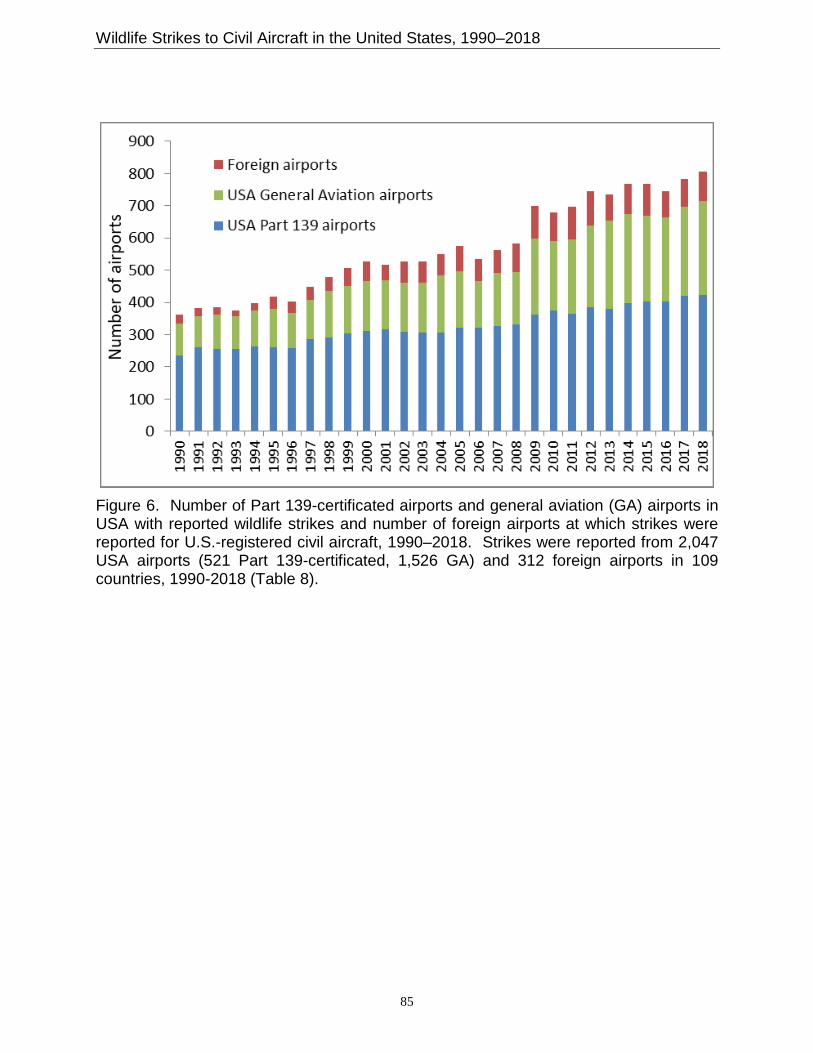
Wildlife Strikes to Civil Aircraft in the United States, 1990–2018
85
Figure 6. Number of Part 139-certificated airports and general aviation (GA) airports in USA with reported wildlife strikes and number of foreign airports at which strikes were reported for U.S.-registered civil aircraft, 1990–2018. Strikes were reported from 2,047 USA airports (521 Part 139-certificated, 1,526 GA) and 312 foreign airports in 109 countries, 1990-2018 (Table 8).

Wildlife Strikes to Civil Aircraft in the United States, 1990–2018
86
Figure 7. Percentage of reported bird (top graph) and bat (bottom graph) strikes with civil aircraft by month, USA, 1990–2018. In addition, 403 strikes with reptiles were reported of which 42 percent occurred in May – June. Strikes reported for U.S.-registered aircraft in foreign countries were excluded.
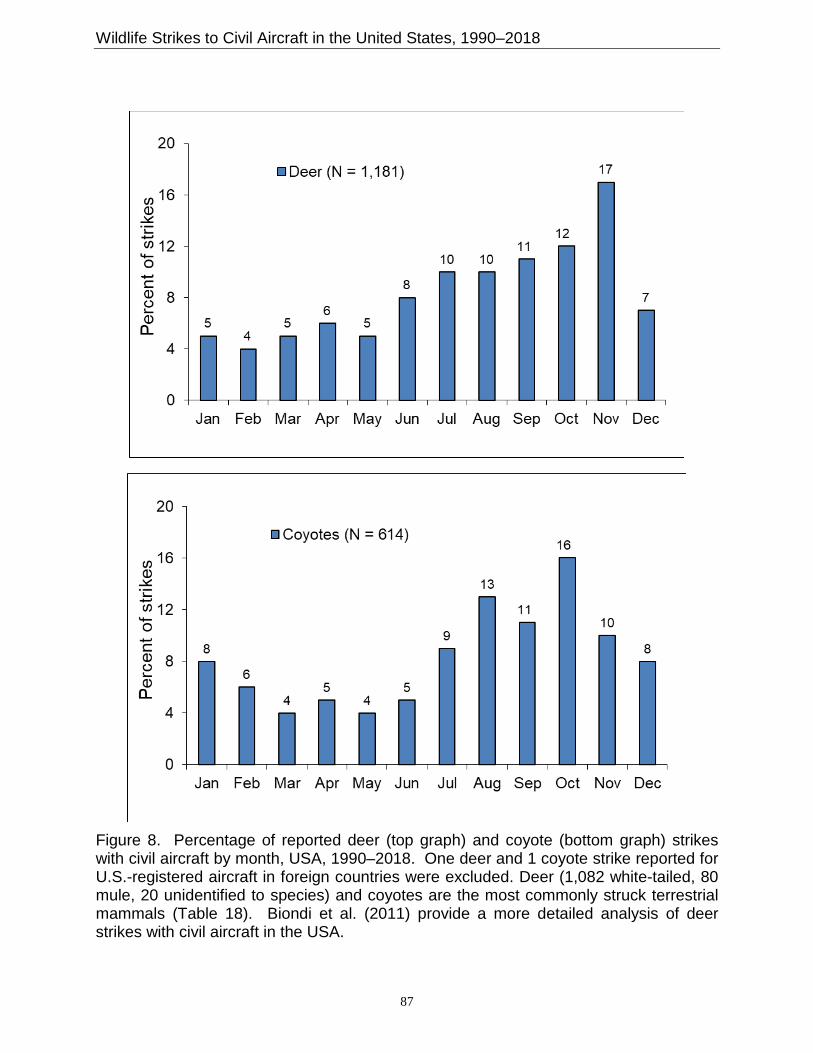
Wildlife Strikes to Civil Aircraft in the United States, 1990–2018
87
Figure 8. Percentage of reported deer (top graph) and coyote (bottom graph) strikes with civil aircraft by month, USA, 1990–2018. One deer and 1 coyote strike reported for U.S.-registered aircraft in foreign countries were excluded. Deer (1,082 white-tailed, 80 mule, 20 unidentified to species) and coyotes are the most commonly struck terrestrial mammals (Table 18). Biondi et al. (2011) provide a more detailed analysis of deer strikes with civil aircraft in the USA.
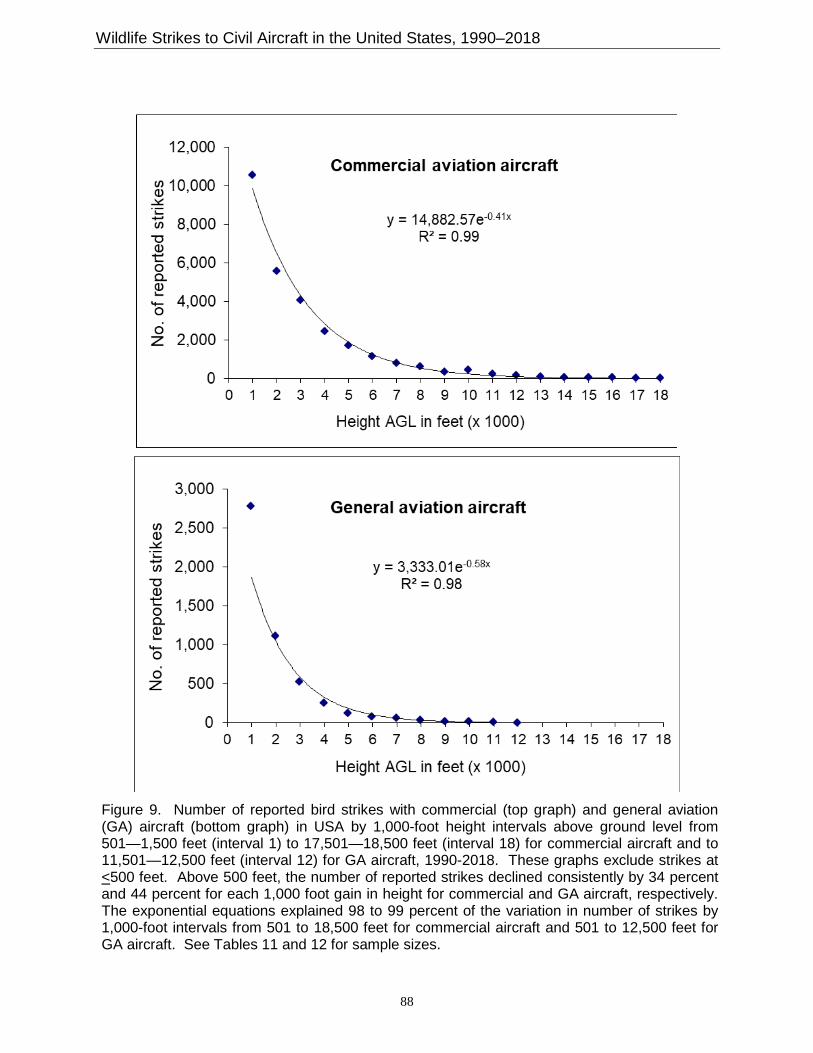
Wildlife Strikes to Civil Aircraft in the United States, 1990–2018
88
Figure 9. Number of reported bird strikes with commercial (top graph) and general aviation (GA) aircraft (bottom graph) in USA by 1,000-foot height intervals above ground level from 501—1,500 feet (interval 1) to 17,501—18,500 feet (interval 18) for commercial aircraft and to 11,501—12,500 feet (interval 12) for GA aircraft, 1990-2018. These graphs exclude strikes at <500 feet. Above 500 feet, the number of reported strikes declined consistently by 34 percent and 44 percent for each 1,000 foot gain in height for commercial and GA aircraft, respectively. The exponential equations explained 98 to 99 percent of the variation in number of strikes by 1,000-foot intervals from 501 to 18,500 feet for commercial aircraft and 501 to 12,500 feet for GA aircraft. See Tables 11 and 12 for sample sizes.
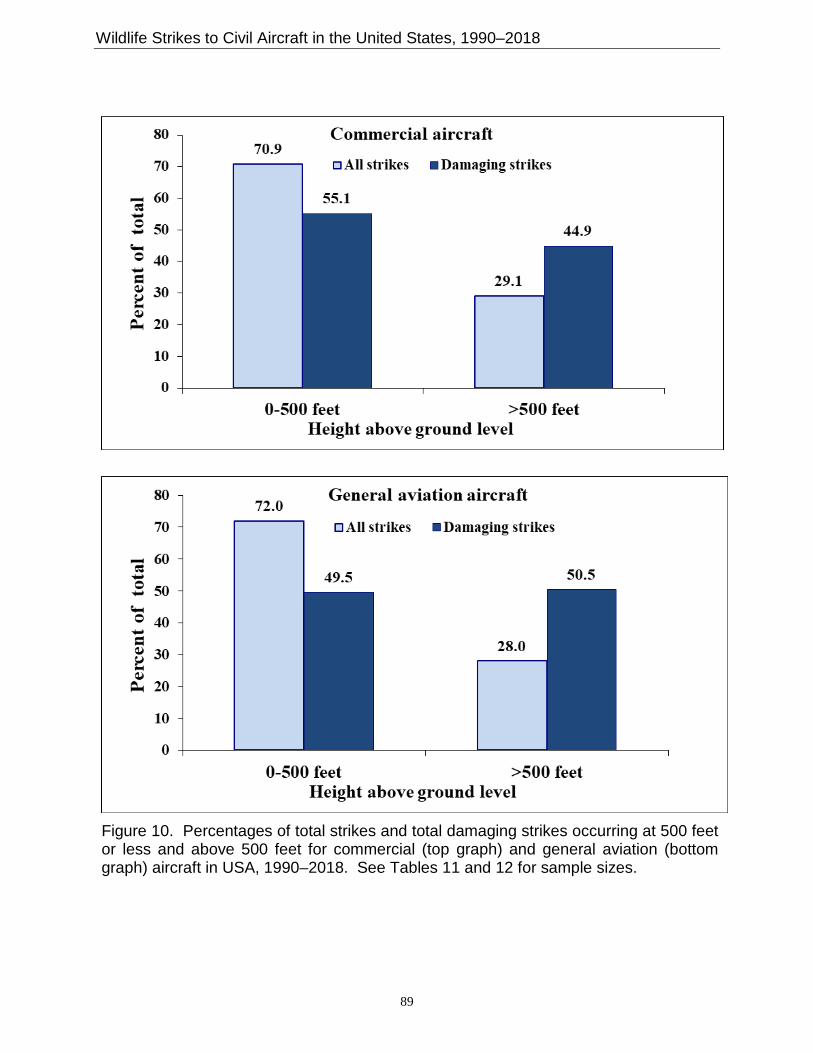
Wildlife Strikes to Civil Aircraft in the United States, 1990–2018
89
Figure 10. Percentages of total strikes and total damaging strikes occurring at 500 feet or less and above 500 feet for commercial (top graph) and general aviation (bottom graph) aircraft in USA, 1990–2018. See Tables 11 and 12 for sample sizes.

Wildlife Strikes to Civil Aircraft in the United States, 1990–2018
90
Figure 11. Percentage of reported strikes that indicated damage to the civil aircraft (top graph) or a negative effect-on-flight (NEOF, bottom graph), USA, 1990–2018. See Tables 1, 14, and 15 for sample sizes and classifications of damage and negative effects-on-flight.
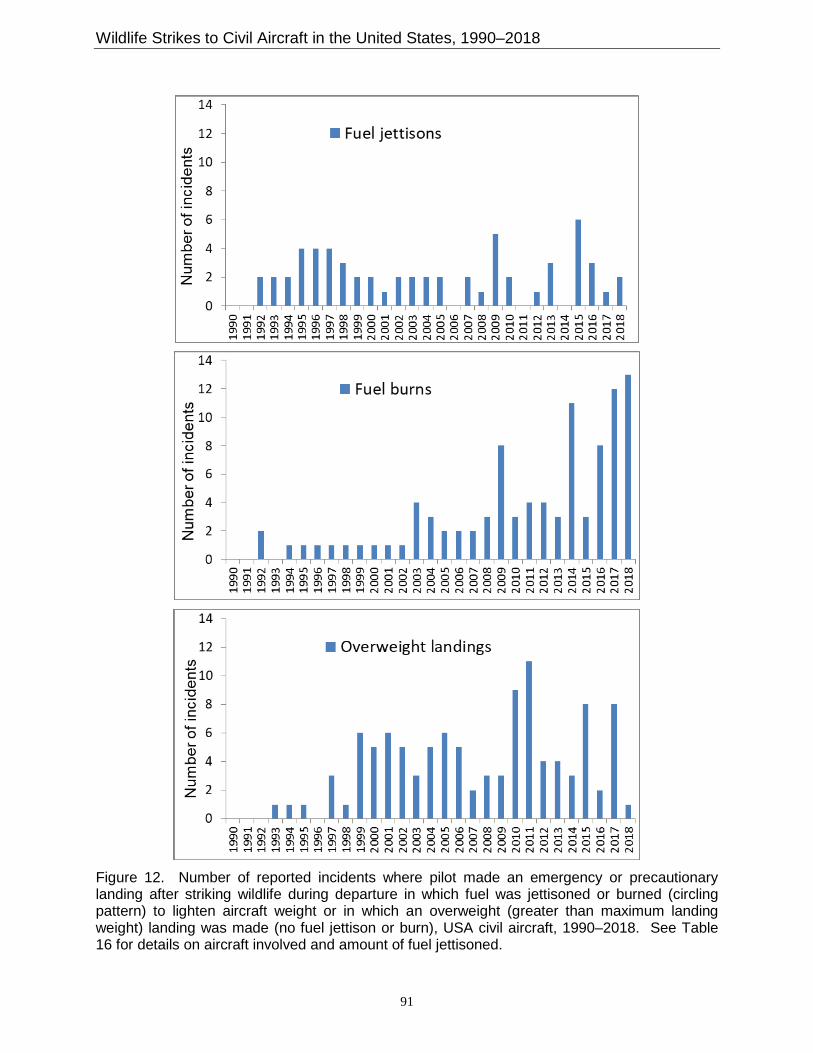
Wildlife Strikes to Civil Aircraft in the United States, 1990–2018
91
Figure 12. Number of reported incidents where pilot made an emergency or precautionary landing after striking wildlife during departure in which fuel was jettisoned or burned (circling pattern) to lighten aircraft weight or in which an overweight (greater than maximum landing weight) landing was made (no fuel jettison or burn), USA civil aircraft, 1990–2018. See Table 16 for details on aircraft involved and amount of fuel jettisoned.
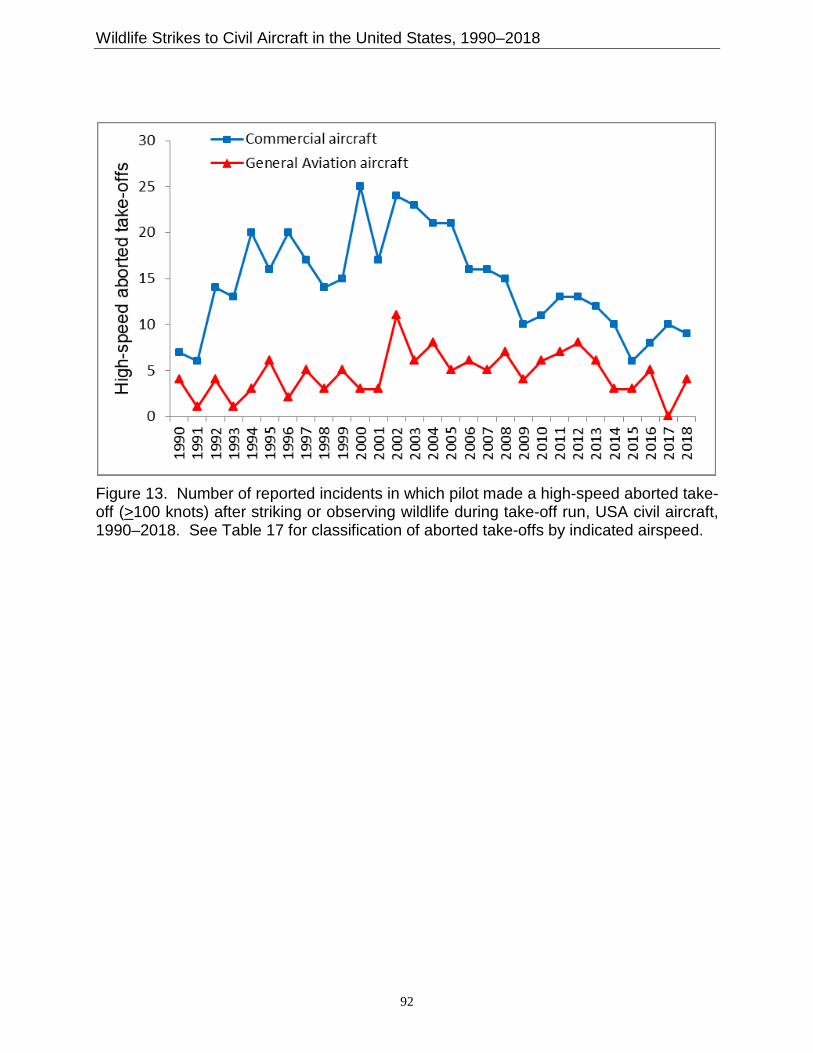
Wildlife Strikes to Civil Aircraft in the United States, 1990–2018
92
Figure 13. Number of reported incidents in which pilot made a high-speed aborted take-off (>100 knots) after striking or observing wildlife during take-off run, USA civil aircraft, 1990–2018. See Table 17 for classification of aborted take-offs by indicated airspeed.

Wildlife Strikes to Civil Aircraft in the United States, 1990–2018
93
Figure 14. Number of identified bird species struck by civil aircraft each year (top graph) and the percentage of reported bird strikes in which the bird was identified to species (bottom graph), 1990–2018. From 1990 through 2018, 576 different species of birds have been identified. See Tables 1 and 18 for sample sizes and list of species.
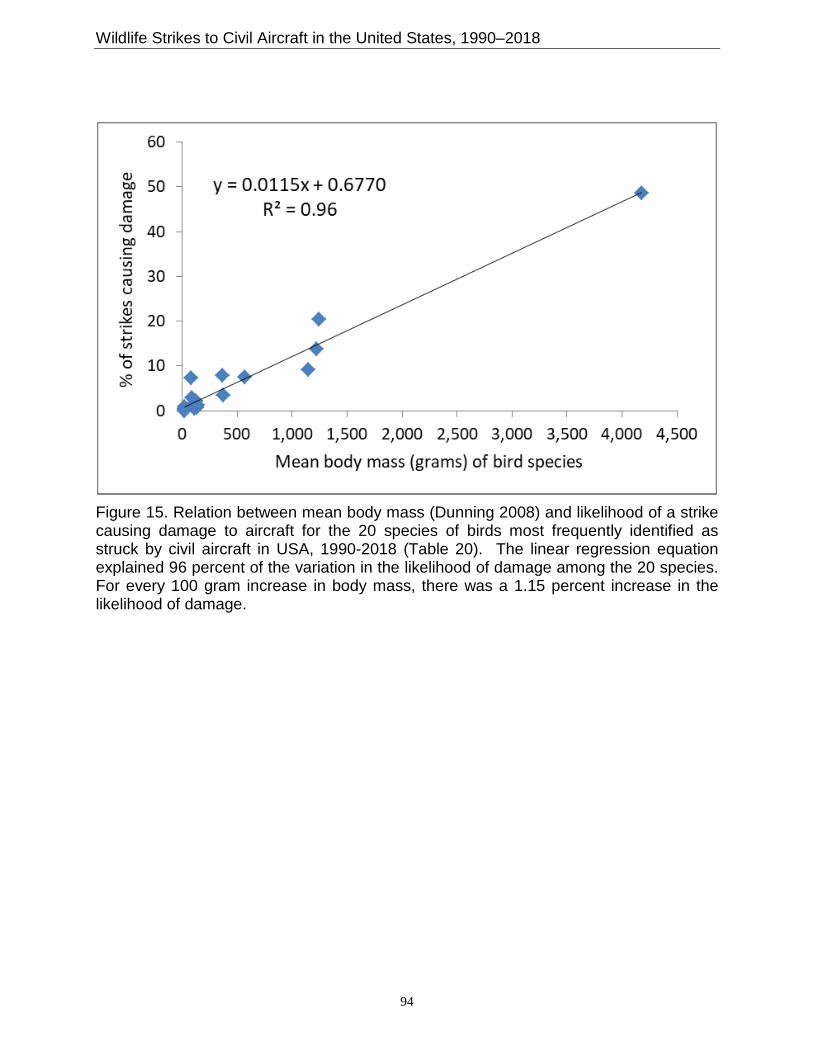
Wildlife Strikes to Civil Aircraft in the United States, 1990–2018
94
Figure 15. Relation between mean body mass (Dunning 2008) and likelihood of a strike causing damage to aircraft for the 20 species of birds most frequently identified as struck by civil aircraft in USA, 1990-2018 (Table 20). The linear regression equation explained 96 percent of the variation in the likelihood of damage among the 20 species. For every 100 gram increase in body mass, there was a 1.15 percent increase in the likelihood of damage.
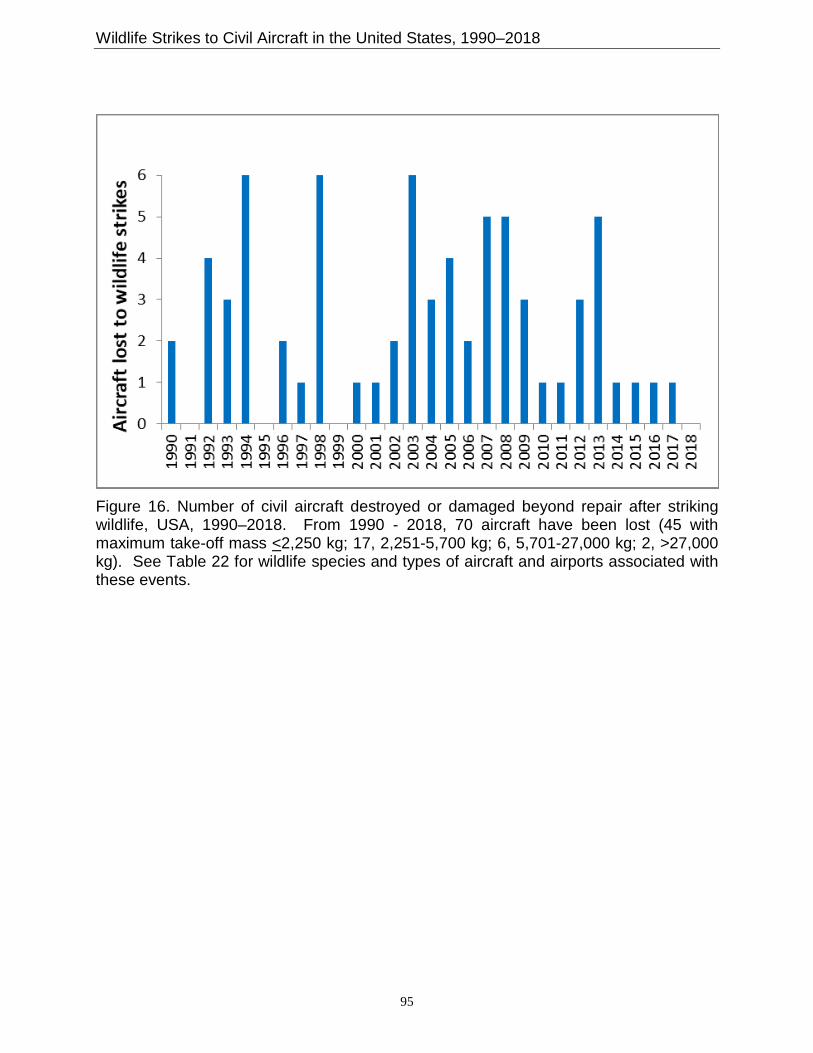
Wildlife Strikes to Civil Aircraft in the United States, 1990–2018
95
Figure 16. Number of civil aircraft destroyed or damaged beyond repair after striking wildlife, USA, 1990–2018. From 1990 - 2018, 70 aircraft have been lost (45 with maximum take-off mass <2,250 kg; 17, 2,251-5,700 kg; 6, 5,701-27,000 kg; 2, >27,000 kg). See Table 22 for wildlife species and types of aircraft and airports associated with these events.
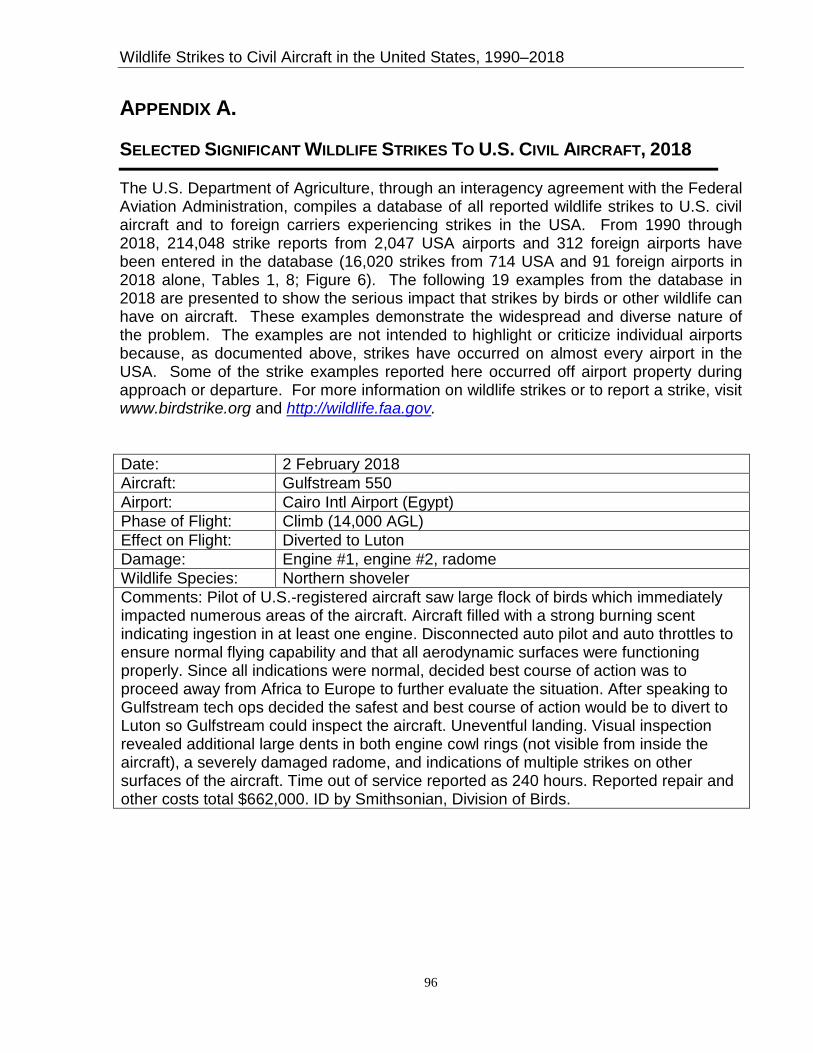
Wildlife Strikes to Civil Aircraft in the United States, 1990–2018
96
APPENDIX A.
SELECTED SIGNIFICANT WILDLIFE STRIKES TO U.S. CIVIL AIRCRAFT, 2018
The U.S. Department of Agriculture, through an interagency agreement with the Federal Aviation Administration, compiles a database of all reported wildlife strikes to U.S. civil aircraft and to foreign carriers experiencing strikes in the USA. From 1990 through 2018, 214,048 strike reports from 2,047 USA airports and 312 foreign airports have been entered in the database (16,020 strikes from 714 USA and 91 foreign airports in 2018 alone, Tables 1, 8; Figure 6). The following 19 examples from the database in 2018 are presented to show the serious impact that strikes by birds or other wildlife can have on aircraft. These examples demonstrate the widespread and diverse nature of the problem. The examples are not intended to highlight or criticize individual airports because, as documented above, strikes have occurred on almost every airport in the USA. Some of the strike examples reported here occurred off airport property during approach or departure. For more information on wildlife strikes or to report a strike, visit www.birdstrike.org and http://wildlife.faa.gov.
Date: 2 February 2018 Aircraft: Gulfstream 550 Airport: Cairo Intl Airport (Egypt) Phase of Flight: Climb (14,000 AGL) Effect on Flight: Diverted to Luton Damage: Engine #1, engine #2, radome Wildlife Species: Northern shoveler Comments: Pilot of U.S.-registered aircraft saw large flock of birds which immediately impacted numerous areas of the aircraft. Aircraft filled with a strong burning scent indicating ingestion in at least one engine. Disconnected auto pilot and auto throttles to ensure normal flying capability and that all aerodynamic surfaces were functioning properly. Since all indications were normal, decided best course of action was to proceed away from Africa to Europe to further evaluate the situation. After speaking to Gulfstream tech ops decided the safest and best course of action would be to divert to Luton so Gulfstream could inspect the aircraft. Uneventful landing. Visual inspection revealed additional large dents in both engine cowl rings (not visible from inside the aircraft), a severely damaged radome, and indications of multiple strikes on other surfaces of the aircraft. Time out of service reported as 240 hours. Reported repair and other costs total $662,000. ID by Smithsonian, Division of Birds.
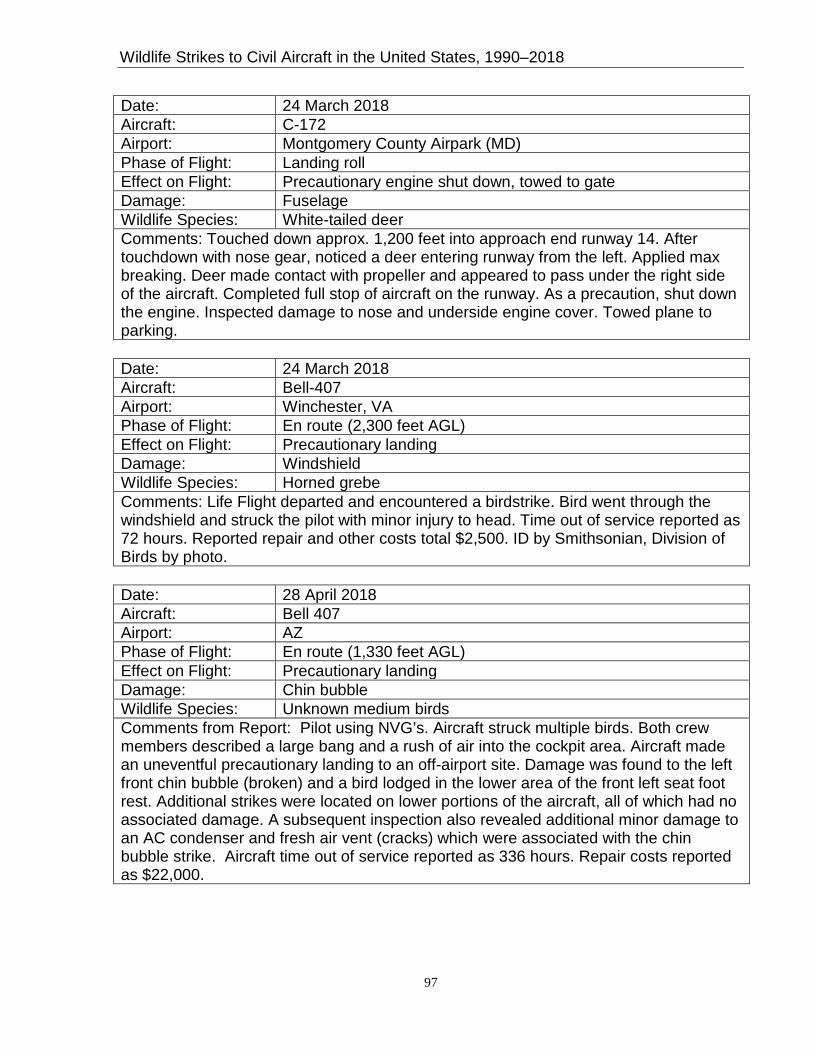
Wildlife Strikes to Civil Aircraft in the United States, 1990–2018
97
Date: 24 March 2018 Aircraft: C-172 Airport: Montgomery County Airpark (MD) Phase of Flight: Landing roll Effect on Flight: Precautionary engine shut down, towed to gate Damage: Fuselage Wildlife Species: White-tailed deer Comments: Touched down approx. 1,200 feet into approach end runway 14. After touchdown with nose gear, noticed a deer entering runway from the left. Applied max breaking. Deer made contact with propeller and appeared to pass under the right side of the aircraft. Completed full stop of aircraft on the runway. As a precaution, shut down the engine. Inspected damage to nose and underside engine cover. Towed plane to parking.
Date: 24 March 2018 Aircraft: Bell-407 Airport: Winchester, VA Phase of Flight: En route (2,300 feet AGL) Effect on Flight: Precautionary landing Damage: Windshield Wildlife Species: Horned grebe Comments: Life Flight departed and encountered a birdstrike. Bird went through the windshield and struck the pilot with minor injury to head. Time out of service reported as 72 hours. Reported repair and other costs total $2,500. ID by Smithsonian, Division of Birds by photo.
Date: 28 April 2018 Aircraft: Bell 407 Airport: AZ Phase of Flight: En route (1,330 feet AGL) Effect on Flight: Precautionary landing Damage: Chin bubble Wildlife Species: Unknown medium birds Comments from Report: Pilot using NVG’s. Aircraft struck multiple birds. Both crew members described a large bang and a rush of air into the cockpit area. Aircraft made an uneventful precautionary landing to an off-airport site. Damage was found to the left front chin bubble (broken) and a bird lodged in the lower area of the front left seat foot rest. Additional strikes were located on lower portions of the aircraft, all of which had no associated damage. A subsequent inspection also revealed additional minor damage to an AC condenser and fresh air vent (cracks) which were associated with the chin bubble strike. Aircraft time out of service reported as 336 hours. Repair costs reported as $22,000.
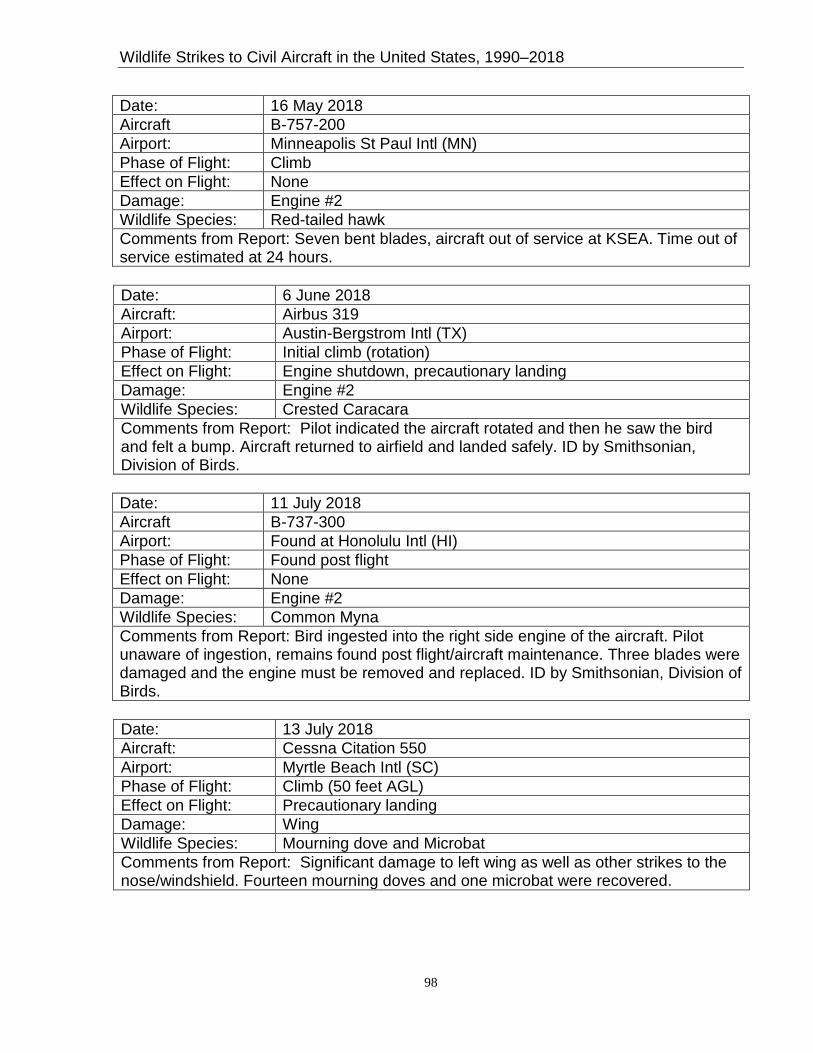
Wildlife Strikes to Civil Aircraft in the United States, 1990–2018
98
Date: 16 May 2018 Aircraft B-757-200 Airport: Minneapolis St Paul Intl (MN) Phase of Flight: Climb Effect on Flight: None Damage: Engine #2 Wildlife Species: Red-tailed hawk Comments from Report: Seven bent blades, aircraft out of service at KSEA. Time out of service estimated at 24 hours.
Date: 6 June 2018 Aircraft: Airbus 319 Airport: Austin-Bergstrom Intl (TX) Phase of Flight: Initial climb (rotation) Effect on Flight: Engine shutdown, precautionary landing Damage: Engine #2 Wildlife Species: Crested Caracara Comments from Report: Pilot indicated the aircraft rotated and then he saw the bird and felt a bump. Aircraft returned to airfield and landed safely. ID by Smithsonian, Division of Birds.
Date: 11 July 2018 Aircraft B-737-300 Airport: Found at Honolulu Intl (HI) Phase of Flight: Found post flight Effect on Flight: None Damage: Engine #2 Wildlife Species: Common Myna Comments from Report: Bird ingested into the right side engine of the aircraft. Pilot unaware of ingestion, remains found post flight/aircraft maintenance. Three blades were damaged and the engine must be removed and replaced. ID by Smithsonian, Division of Birds.
Date: 13 July 2018 Aircraft: Cessna Citation 550 Airport: Myrtle Beach Intl (SC) Phase of Flight: Climb (50 feet AGL) Effect on Flight: Precautionary landing Damage: Wing Wildlife Species: Mourning dove and Microbat Comments from Report: Significant damage to left wing as well as other strikes to the nose/windshield. Fourteen mourning doves and one microbat were recovered.

Wildlife Strikes to Civil Aircraft in the United States, 1990–2018
99
Date: 2 August 2018 Aircraft B-757-224 Airport: Orlando International (FL) Phase of Flight: Climb (1,300 feet AGL) Effect on Flight: None Damage: Wing Wildlife Species: Black vulture Comments from Report: Port Authority personnel recovered snarge on the leading edge of the right wing of the aircraft. UAL captain advised the bird strike occurred on the climb from Orlando. ID by Smithsonian, Division of Birds. Repair costs $350,000.
Date: 23 August 2018 Aircraft: EC-145 Airport: Between KEMV and VG45 Phase of Flight: En route (1,100 feet AGL) Effect on Flight: None Damage: Tail Wildlife Species: Red-tailed hawk Comments from Report: Left side vertical fin on horizontal damaged by bird strike. Bird was embedded in leading edge, leaving a 3 inch hole. 24 hours out of service and repair costs of $80,000. ID by Smithsonian, Division of Birds.
Date: 4 September 2018 Aircraft DA-2000 Airport: Dallas Love Field (TX) Phase of Flight: Climb (200 feet AGL) Effect on Flight: None Damage: Wing Wildlife Species: Raptor Comments from Report: Repair costs reported as $200,000.

Wildlife Strikes to Civil Aircraft in the United States, 1990–2018
100
Date: 27 September 2018 Aircraft: Lear 45 Airport: Salt Lake City Intl (UT) Phase of Flight: Climb (300 feet AGL) Effect on Flight: Precautionary landing Damage: Engine #2 Wildlife Species: Swainson’s hawk Comments from Report: Aircraft was in its climb just after the takeoff roll out about 300 ft above the ground when they saw a bird and then immediately heard the right engine make a noise. Pilots noticed a decrease in power on the right side. They decided to circle the airport and come back to land. During the runway inspection multiple pieces of fan blades and inside engine pieces were found along with a large amount of bird remains. Samples were collected from the right side fuselage, leading edge of the right wing, the top rear portion of the #2 engine, the rear section of the right elevator/flap and the vertical stabilizer. ID by Smithsonian Division of Birds. Wildlife ID and number struck Smithsonian gender-typed the results and found that at least one male and one female bird were struck; meaning at least 2 birds were struck.
Date: 8 October 2018 Aircraft: PA 28-235 Airport: South Valley Regional (UT) Phase of Flight: Approach (1,500 feet AGL) Effect on Flight: Precautionary landing Damage: Fuselage, tail, windshield Wildlife Species: Ruddy duck Comments from Report: The windscreen, right wing, rear left window and the vertical stabilizer were damaged. No injuries. Lots of remains inside of the cabin. 120 hours out of service and $20,000 in repair costs were reported. ID by Smithsonian, Division of Birds. All five samples of remains sent to Smithsonian for ID were Ruddy duck.
Date: 3 November 2018 Aircraft: PA 28-180 Airport: Comanche County-City Airport (TX) Phase of Flight: Takeoff run Effect on Flight: Emergency landing Damage: Nose, engine #1, fuselage, lights Wildlife Species: White-tailed deer Comments from Report: Emergency landing. Propeller strike, nose cowling and nose gear wheel pant struck and cracked. Right side of fuselage struck and damaged. Strobe light under fuselage broken off. Repair costs reported as $50,000. Note: Reported as Deer; assume white-tail based on location.
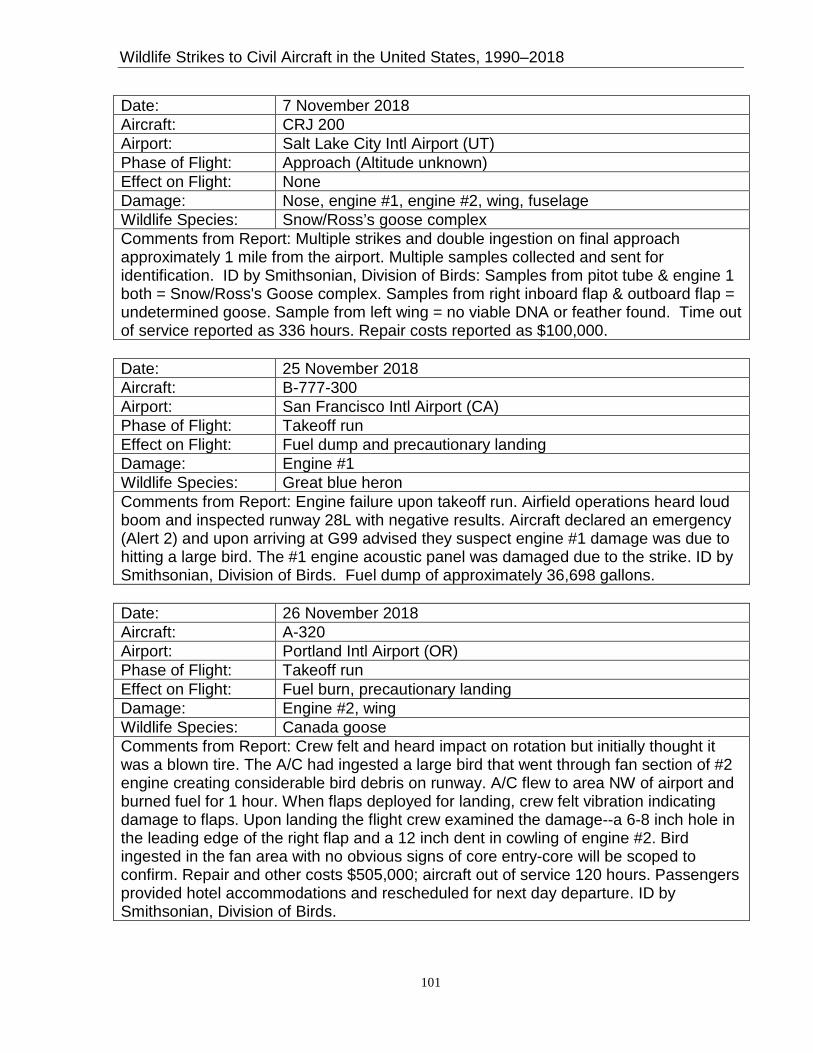
Wildlife Strikes to Civil Aircraft in the United States, 1990–2018
101
Date: 7 November 2018 Aircraft: CRJ 200 Airport: Salt Lake City Intl Airport (UT) Phase of Flight: Approach (Altitude unknown) Effect on Flight: None Damage: Nose, engine #1, engine #2, wing, fuselage Wildlife Species: Snow/Ross’s goose complex Comments from Report: Multiple strikes and double ingestion on final approach approximately 1 mile from the airport. Multiple samples collected and sent for identification. ID by Smithsonian, Division of Birds: Samples from pitot tube & engine 1 both = Snow/Ross's Goose complex. Samples from right inboard flap & outboard flap = undetermined goose. Sample from left wing = no viable DNA or feather found. Time out of service reported as 336 hours. Repair costs reported as $100,000.
Date: 25 November 2018 Aircraft: B-777-300 Airport: San Francisco Intl Airport (CA) Phase of Flight: Takeoff run Effect on Flight: Fuel dump and precautionary landing Damage: Engine #1 Wildlife Species: Great blue heron Comments from Report: Engine failure upon takeoff run. Airfield operations heard loud boom and inspected runway 28L with negative results. Aircraft declared an emergency (Alert 2) and upon arriving at G99 advised they suspect engine #1 damage was due to hitting a large bird. The #1 engine acoustic panel was damaged due to the strike. ID by Smithsonian, Division of Birds. Fuel dump of approximately 36,698 gallons.
Date: 26 November 2018 Aircraft: A-320 Airport: Portland Intl Airport (OR) Phase of Flight: Takeoff run Effect on Flight: Fuel burn, precautionary landing Damage: Engine #2, wing Wildlife Species: Canada goose Comments from Report: Crew felt and heard impact on rotation but initially thought it was a blown tire. The A/C had ingested a large bird that went through fan section of #2 engine creating considerable bird debris on runway. A/C flew to area NW of airport and burned fuel for 1 hour. When flaps deployed for landing, crew felt vibration indicating damage to flaps. Upon landing the flight crew examined the damage--a 6-8 inch hole in the leading edge of the right flap and a 12 inch dent in cowling of engine #2. Bird ingested in the fan area with no obvious signs of core entry-core will be scoped to confirm. Repair and other costs $505,000; aircraft out of service 120 hours. Passengers provided hotel accommodations and rescheduled for next day departure. ID by Smithsonian, Division of Birds.

Wildlife Strikes to Civil Aircraft in the United States, 1990–2018
102
Date: 22 December 2018 Aircraft: EMB-170 Airport: George Bush Intercontinental Arpt (TX) Phase of Flight: Takeoff run Effect on Flight: Precautionary landing Damage: Engine #2 Wildlife Species: Unknown Comments from Report: Five engine blades were damaged as well as a stator. Time out of service reported as 96 hours. Repair costs reported as $45,000.
Date: 26 December 2018 Aircraft: C-402 Airport: Provincetown Municipal Arpt (MA) Phase of Flight: Landing roll Effect on Flight: Engine shutdown Damage: Nose gear, nose gear door Wildlife Species: White-tailed deer Comments from Report: Damage to nose gear and nose gear door. Aircraft disabled on runway and airport was closed to air traffic. Passengers were deplaned on the runway and bused to the terminal. Aircraft was towed from the runway and airport was reopened.
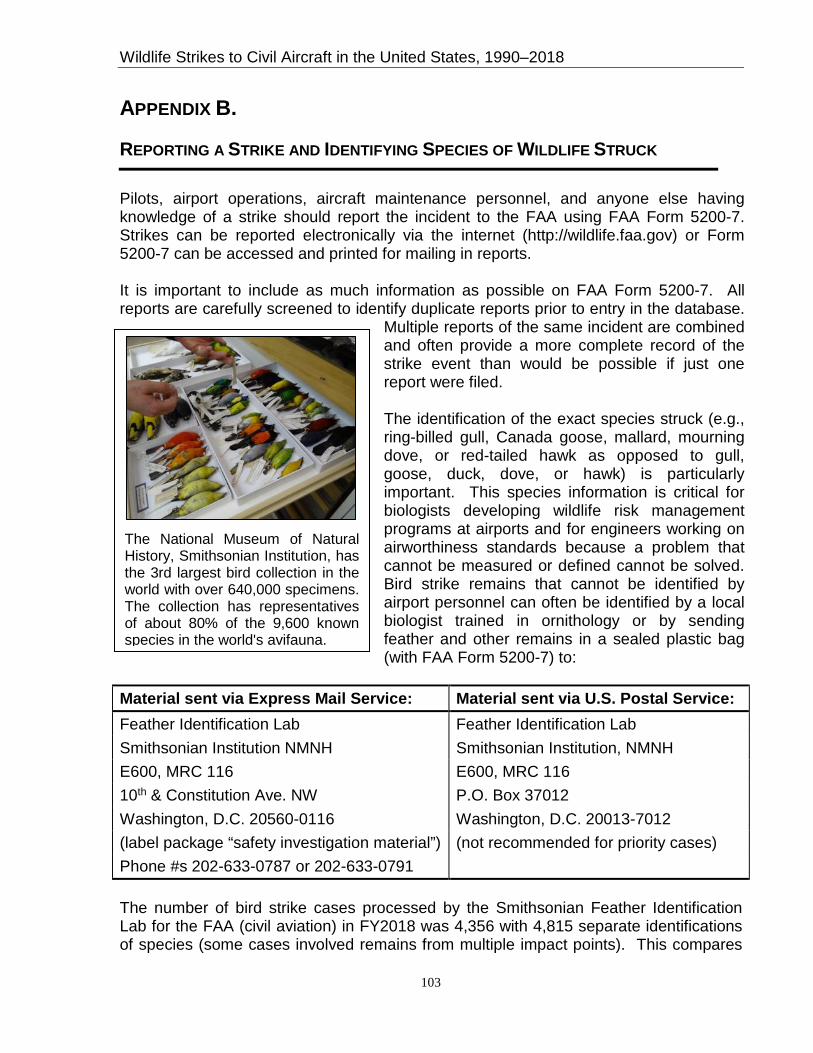
Wildlife Strikes to Civil Aircraft in the United States, 1990–2018
103
APPENDIX B.
REPORTING A STRIKE AND IDENTIFYING SPECIES OF WILDLIFE STRUCK
Pilots, airport operations, aircraft maintenance personnel, and anyone else having knowledge of a strike should report the incident to the FAA using FAA Form 5200-7. Strikes can be reported electronically via the internet (http://wildlife.faa.gov) or Form 5200-7 can be accessed and printed for mailing in reports.
It is important to include as much information as possible on FAA Form 5200-7. All reports are carefully screened to identify duplicate reports prior to entry in the database.
Multiple reports of the same incident are combined and often provide a more complete record of the strike event than would be possible if just one report were filed. The identification of the exact species struck (e.g., ring-billed gull, Canada goose, mallard, mourning dove, or red-tailed hawk as opposed to gull, goose, duck, dove, or hawk) is particularly important. This species information is critical for biologists developing wildlife risk management programs at airports and for engineers working on airworthiness standards because a problem that cannot be measured or defined cannot be solved. Bird strike remains that cannot be identified by airport personnel can often be identified by a local biologist trained in ornithology or by sending feather and other remains in a sealed plastic bag (with FAA Form 5200-7) to:
Material sent via Express Mail Service: Material sent via U.S. Postal Service: Feather Identification Lab Feather Identification Lab Smithsonian Institution NMNH Smithsonian Institution, NMNH E600, MRC 116 E600, MRC 116 10th & Constitution Ave. NW P.O. Box 37012 Washington, D.C. 20560-0116 Washington, D.C. 20013-7012 (label package “safety investigation material”) (not recommended for priority cases) Phone #s 202-633-0787 or 202-633-0791 The number of bird strike cases processed by the Smithsonian Feather Identification Lab for the FAA (civil aviation) in FY2018 was 4,356 with 4,815 separate identifications of species (some cases involved remains from multiple impact points). This compares
The National Museum of Natural History, Smithsonian Institution, has the 3rd largest bird collection in the world with over 640,000 specimens. The collection has representatives of about 80% of the 9,600 known species in the world's avifauna.

Wildlife Strikes to Civil Aircraft in the United States, 1990–2018
104
to 3,826 cases in FY2017, 3,670 cases in FY2016, and 3,118 cases in FY2015 (Dove et al. 2019). In addition, the Lab processed 3,645 cases involving 5,013 identifications for the U.S. Air Force and 810 cases involving 910 identifications for the U.S. Navy in FY2018 (not discussed in this report). DNA analysis (Dove et al. 2008) was used in 52 percent of civil aviation cases in FY2018 to identify the species and an additional 14 percent to supplement or verify traditional identification methods.
Whenever possible, reporters should send whole feathers as diagnostic characteristics are often found in the downy barbules at the feather base. Wings, as well as breast and tail feathers, should be sent whenever possible. Beaks, feet, bones, and talons are also useful diagnostic materials. Even blood smears can provide material for DNA analysis (Dove et al. 2008). Do not send entire bird carcasses through the mail! However, photographs of the carcasses can be useful supplemental documentation.
Guidelines for Collecting Bird Strike Material • Always include any feather material available. • Include copy of report (FAA 5200-7). • Always secure all remains in re-sealable plastic bag.
Feathers: Whole Bird – Pluck a variety of feathers (breast, back, wing, tail) Partial Bird – Collect a variety of feathers with color or pattern Feathers only – Send all material available. Do not cut feathers from the bird
(downy part at the base of the feathers is needed). Do not use any sticky substance (no tape or glue).
Tissue/blood (“Snarge”): Dry material – Scrape or wipe off into a clean re-closeable bag or wipe area with pre-packaged alcohol wipe or spray with alcohol to loosen material then wipe with clean cloth/gauze. (Do not use water, bleach, or other cleansers; they destroy DNA.) Fresh material – Wipe area with alcohol wipe and/or clean cloth/gauze or apply fresh tissue/blood to an FTA® DNA collecting card.
FTA® Micro Card and Sterile Applicators If you send a lot of fresh blood/ tissue samples for DNA identification, you may want to consider getting Whatman FTA® DNA cards. The material is sampled with a sterile applicator and placed onto the surface of the card that “fixes” the DNA in the sample. For more information on ordering these items contact the Feather Lab.
Note: If you only occasionally send blood/ tissue samples, a paper towel with alcohol or alcohol wipe is still a good option for this type of material.
Additional information on sending bird remains to the Smithsonian is available at http://wildlife.faa.gov.


