

Child Nutrition Services Mission Statement
Assist school districts and other institutions in providing quality
nutrition programs that promote life-long, healthy living while providing
nutritious meals each day that prepare children for learning.
Goals
• To provide leadership for the child nutrition meal programs
through administration, assistance, and advocacy. • To manage program resources for the benefit of recipients.
• To incorporate nutrition education in all phases of services.
Objectives
• Administer the Child Nutrition Programs.
• Assist Child Nutrition Program sponsors. • Advocate for good nutrition. • Support Child Nutrition program staff. • Promote strong agency cooperation, interaction, and
communication.
Chris Reykdal
State Superintendent of Public Instruction
Leanne Eko, RD, SNS
Director, Child Nutrition Services
Office of Superintendent of Public Instruction
PO Box 47200 Olympia, WA 98504-7200
Wendy Barkley, RD, SNS
Assistant Director, Child Nutrition Services
For additional data, information, or copies of this booklet please visit
http://www.k12.wa.us/ChildNutrition
Disclaimer: Statistics represent a snapshot in time, data is subject to
change.
2020 OFFICE OF SUPERINTENDENT OF PUBLIC INSTRUCTION

The Child Nutrition Programs
United States Department of Agriculture Child Nutrition Programs
administered in the state of Washington by Child Nutrition Services,
Office of Superintendent of Public Instruction are:
• School Nutrition Programs
➢ National School Lunch Program ➢ School Breakfast Program ➢ Fresh Fruit and Vegetable Program ➢ Special Milk Program ➢ Seamless Summer Option
• Community Nutrition Programs
➢ Child and Adult Care Food Program
➢ Summer Food Service Program
• Food Distribution Program
Program Contact Information
Liz Beechler
School Nutrition Programs
Supervisor
360-725-6220
Mary Nagel
Community Nutrition
Programs Supervisor
360-725-6218
Marlon Hopkins
Food Distribution Programs
Supervisor
360-725-6209
Hydie Kidd
Fiscal Supervisor
360-725-6287

CONTENTS
NATIONAL SCHOOL LUNCH AND SCHOOL BREAKFAST PROGRAMS ......... 1
FREE AND REDUCED-PRICE ELIGIBILITY.................................................................... 2
FEDERAL SUPPORT FOR PUBLIC SCHOOL MEAL PROGRAMS......................... 3
STATE SUPPORT FOR PUBLIC SCHOOL MEAL PROGRAMS .............................. 4
LOCAL SUPPORT FOR SCHOOL MEAL PROGRAMS ............................................. 5
COMMUNITY ELIGIBILITY PROVISION (CEP) ........................................................... 6
FRESH FRUIT AND VEGETABLE PROGRAM .............................................................. 7
FARM TO SCHOOL PROGRAM ..................................................................................... 7
SUMMER FOOD SERVICE PROGRAM ......................................................................... 8
SEAMLESS SUMMER OPTION ....................................................................................... 9
SPECIAL MILK PROGRAM ............................................................................................... 9
CHILD AND ADULT CARE FOOD PROGRAM ......................................................... 10
AT-RISK AFTERSCHOOL MEALS ................................................................................. 12
FOOD DISTRIBUTION PROGRAM .............................................................................. 13

1
NATIONAL SCHOOL LUNCH AND SCHOOL BREAKFAST PROGRAMS
The National School Lunch Program (NSLP) and School Breakfast Program (SBP)
promotes the health and well-being of children by providing nutritious meals to
children. The NSLP and SBP are served in public and private schools and
residential child care institutions (RCCIs). The NSLP and SBP are United States
Department of Agriculture (USDA) programs administered at the state level by
the Office of Superintendent of Public Instruction (OSPI).
Who Operates School Nutrition Programs?
School nutrition programs can be operated by public and nonprofit private
schools and residential child care institution. Washington law requires public
schools serving grades 1-4 that have 25% or more students qualified for free or
reduced-price lunch to implement a school lunch program. RCW 28A.235.160
(2). Public schools with 40% or more students qualify for free or reduced-price
lunches are required to implement a school breakfast program 28A.235.160 (3).
➢ 346 local education agencies (LEAs) in Washington State that participate
in the NSLP/SBP includes:
▪ 281 public school districts
▪ 29 RCCIs
▪ 24 private schools
▪ 8 charter schools
▪ 3 tribal compact schools
PUBLIC SCHOOL NSLP/SBP STATISTICS FOR OCTOBER 2019*
SBP NSLP
Districts** on Program 289 292
Schools/Sites on Program 1780 1874
Daily Average # of Students Eating Lunch, October 2019 202,489 479,731
*Based on information required by USDA for the last operating day in October.
**Districts include public schools, charter schools and tribal compact schools.

2
FREE AND REDUCED-PRICE ELIGIBILITY
Although all students may participate, the income eligibility guidelines for school
meals are intended to direct benefits to children most in need. These guidelines
are based on the federal income poverty guidelines and are revised annually. The
eligibility criterion is 130% of the federal poverty guidelines for free and 185% for
reduced-price meals.
Year Free
Eligible *
Reduced
Eligible **
# of
Students***
Free % Reduced
%
2016-17 405,921 71,165 1,097,705 37% 6%
2017-18 396,664 73,061 1,107,153 36% 7%
2018-19 406,941 75,861 1,111,411 37% 7%
2019-20 404,431 77,463 1,113,662 36% 7%
MEALS SERVED IN THE NSLP AND SBP*
Year Breakfast Lunch Snack
Oct-16 3,746,010 9,754,598 196,423
Oct-17 3,903,944 10,049,905 173,311
Oct-18 3,923,152 10,086,002 177,235
Oct -19 4,254,898 10,602,076 188,586
*Represents the number of meals/snacks reimbursed to participating schools during the
month of October.
9,754,598
10,049,905 10,086,002
10,602,076
9,200,000
9,400,000
9,600,000
9,800,000
10,000,000
10,200,000
10,400,000
10,600,000
10,800,000
2015-16 2016-17 2017-18 2018-19
Students Served in the NSLP
Lunch
*Free ≤ 130% of federal poverty guidelines **Reduced-price ≤ 185% of federal poverty guidelines
*** Represents students enrolled and have access to school meals

3
FEDERAL SUPPORT FOR PUBLIC SCHOOL MEAL PROGRAMS
Federal dollars are used to reimburse districts for each meal served.
Reimbursement per meal rates are set annually by USDA.
Year Breakfast Lunch
2015-16 $55,891,844 $201,787,929
2016-17 $55,524,362 $199,658,932
2017-18 $57,388,128 $199,629,727
2018-19 $59,322,322 $204,746,035
$196,000,000
$198,000,000
$200,000,000
$202,000,000
$204,000,000
$206,000,000
2015-16 2016-17 2017-18 2018-19
Federal Support for School Lunch
Federal Support for School Meals Lunch
$53,000,000
$54,000,000
$55,000,000
$56,000,000
$57,000,000
$58,000,000
$59,000,000
$60,000,000
2015-16 2016-17 2017-18 2018-19
Federal Support for School Breakfast
Federal Support for School Meals Breakfast

4
STATE SUPPORT FOR PUBLIC SCHOOL MEAL PROGRAMS
For school year 2018-19, the Washington State Legislature appropriated $7.111
million in support of public school food service programs*.
Of the funds appropriated, the following was spent by category:
Elimination of reduced-price breakfast co-pay: $994,723
Elimination of reduced-price lunch co-pay (K-3): $1,118,800
Free and reduced-price breakfast assistance: $4,652,177
State Match - Summer Food Meals Program: $100,000
Breakfast Meals for Kids Grants: $174,098
Summer Food Service Program Assistance: $48,038
Total: $7,087,836
*State Legislation passed in 2018 will provide funding for Breakfast After the Bell in SY 19-
20.
BREAKFAST AFTER THE BELL (BAB)
With the passage of the Washington Kids Ready to Learn Act of 2018, schools
with a Free and Reduced-Price Percentage of 70% or greater must implement
Breakfast After the Bell, making breakfast more accessible and equitable for
students. As a result, 389 schools statewide are implementing Breakfast After
the Bell during this first year of implementation. Breakfast After the Bell allows
all students the opportunity to eat a nutritious breakfast, ensuring that they are
ready to learn.
SEATED LUNCH DURATION
Following a performance audit from the State Auditor’s Office which concluded
that Washington Schools are not meeting the best practice of ensuring
students have twenty minutes of seat time to eat lunch, OSPI is reviewing
practices and rules around seated lunch durations. As directed by a 2019
budget proviso, OSPI is conducting a two-year pilot program to gather barriers
and best practices to reaching twenty minutes of seat time. The pilot program
will conclude in 2021.

5
LOCAL SUPPORT FOR SCHOOL MEAL PROGRAMS
The following graph shows revenue sources utilized to support school meal
programs. Many LEAs must provide funding for the operation of their school
meal programs.
*Local Levy: This is based on total direct food service expenditures only and does not
include indirect costs.
Federal
67.0%
Local Sales
26.4%
State
1.8%
Local Levy*
4.9%
Public Schools Food Services Revenue For School
Fiscal Year 2018-19
Federal
Local Sales
State
Local Levy

6
COMMUNITY ELIGIBILITY PROVISION (CEP)
The Community Eligibility Provision (CEP) provides an alternative approach for
offering school meals in low-income areas.
Beginning in SY 2014-15, CEP allowed the nation’s highest poverty schools and
districts to serve breakfast and lunch at no cost to all enrolled students without
collecting household applications. Schools that adopt CEP are reimbursed using a
formula based on the percentage of students directly certified for free meals.
Programs for which eligibility can be directly certified include Supplemental
Nutrition Assistance Program (SNAP), Temporary Assistance for Needy Families
(TANF), Food Distribution Program on Indian Reservations (FDPIR), Migrant,
Homeless, and foster children.
Washington state schools participating in CEP benefit from a reduction in
administrative tasks and increased participation in the school meal programs
decreasing the stigma associated with meal benefits and eliminating meal charge
debt.
77
163192
232
273
319
0
50
100
150
200
250
300
350
2014-15 2015-16 2016-17 2017-18 2018-19 2019-20
CEP Growth - Schools
# of Schools
25
4652
6672
89
0
20
40
60
80
100
2014-15 2015-16 2016-17 2017-18 2018-19 2019-20
CEP Growth - Districts
# of Districts

7
FRESH FRUIT AND VEGETABLE PROGRAM
The Fresh Fruit and Vegetable Program (FFVP), funded by the U.S. Department of
Agriculture, provides students in participating schools with a fresh fruit or vegetable
snack during the school day. The FFVP introduces students to a variety of produce
that they might not otherwise have the opportunity to experience with the goal of
increasing consumption of fruits and vegetables.
Schools eligible to participate must:
• Be inclusive of elementary aged students;
• Participate in the National School Lunch Program; and,
• Have 50% or more free and reduced-price eligibility.
The FFVP is an annual application-based program and schools with the highest
free and reduced-price percentages are awarded.
In SY 2019-20 FFVP is offered in 62 districts comprising of 171 sites.
TRENDS IN THE FRESH FRUIT AND VEGETABLE PROGRAM
School
Year
# of
Schools
# of Students Total USDA Funding
2016-17 163 75,159 $3,447,502
2017-18 151 69,760 $3,651,830
2018-19 151 70,639 $3,604,715
2019-20 171 76,528 $4,074,772
FARM TO SCHOOL PROGRAM
Local agriculture plays an important role in Child Nutrition Programs in
Washington State. Learning about where food comes from and getting to taste
local foods in school meals promotes lifelong healthy eating and supports local
farmers. OSPI works to promote, provide training, and recognize schools’ and
institutions’ efforts in Farm to School. OSPI is represented on the Washington
Farm to School Network Coordination Team and has dedicated staff time to
support Farm to School efforts.

8
SUMMER FOOD SERVICE PROGRAM
The Summer Food Service Program (SFSP) provides meals to children during
summer, when school is not in session.
Programs operate in areas where 50% or more of the children in the area are in
households at or below 185 percent of the federal poverty level and feed children
age 18 and younger. Sponsors may serve a maximum of two meals per day, which
includes snacks as a meal choice.
Who Operates SFSP?
▪ 100 School Districts/ Private Schools
▪ 44 Private Nonprofit Organizations
▪ 6 Indian Tribes
▪ 7 City and County Governments
▪ 3 Colleges/ Universities and Upward Bound Programs
▪ 2 Residential Camps
SUMMER FOOD SERVICE PROGRAM TRENDS
Year Breakfast Lunch Snacks Supper
# of
Sponsors # of Sites
2015-16 405,002 1,253,562 267,486 21,138 155 928
2016-17 379,356 1,164,593 256,923 19,801 154 910
2017-18 448,561 1,186,459 228,136 18,537 152 934
2018-19 391,065* 1,129,112* 222,776* 19,574 162 951
*Number of meals served is lower in part due to inclement weather during the school year, resulting in a
shorter summer with fewer operating days.
880
890
900
910
920
930
940
950
960
2015-16 2016-17 2017-18 2018-19
SFSP Site Expansion
9
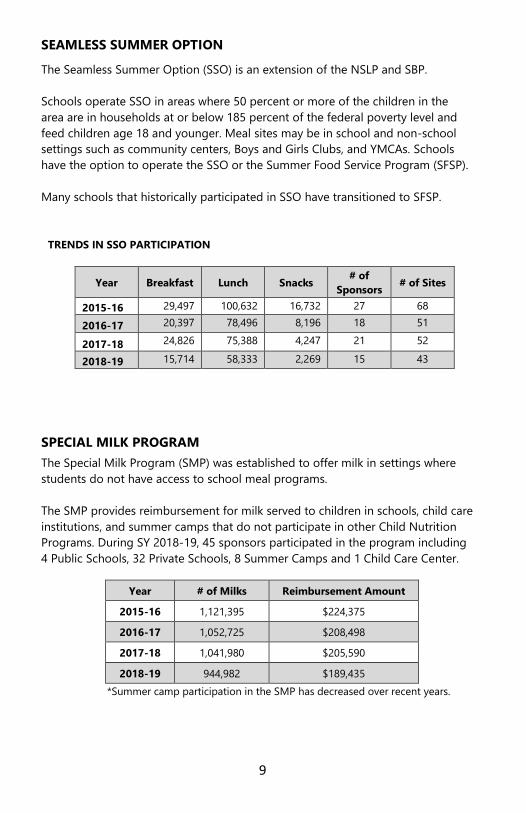
SEAMLESS SUMMER OPTION
The Seamless Summer Option (SSO) is an extension of the NSLP and SBP.
Schools operate SSO in areas where 50 percent or more of the children in the
area are in households at or below 185 percent of the federal poverty level and
feed children age 18 and younger. Meal sites may be in school and non-school
settings such as community centers, Boys and Girls Clubs, and YMCAs. Schools
have the option to operate the SSO or the Summer Food Service Program (SFSP).
Many schools that historically participated in SSO have transitioned to SFSP.
TRENDS IN SSO PARTICIPATION
Year Breakfast Lunch Snacks # of
Sponsors # of Sites
2015-16 29,497 100,632 16,732 27 68
2016-17 20,397 78,496 8,196 18 51
2017-18 24,826 75,388 4,247 21 52
2018-19 15,714 58,333 2,269 15 43
SPECIAL MILK PROGRAM
The Special Milk Program (SMP) was established to offer milk in settings where
students do not have access to school meal programs.
The SMP provides reimbursement for milk served to children in schools, child care
institutions, and summer camps that do not participate in other Child Nutrition
Programs. During SY 2018-19, 45 sponsors participated in the program including
4 Public Schools, 32 Private Schools, 8 Summer Camps and 1 Child Care Center.
Year # of Milks Reimbursement Amount
2015-16 1,121,395 $224,375
2016-17 1,052,725 $208,498
2017-18 1,041,980 $205,590
2018-19 944,982 $189,435
*Summer camp participation in the SMP has decreased over recent years.

CHILD AND ADULT CARE FOOD PROGRAM
The Child and Adult Care Food Program (CACFP) provides federal funds to
nonresidential child and adult care facilities to serve nutritious meals and
snacks. The goal of the CACFP is to improve and maintain the health and
nutritional status of children and adults in care while promoting the
development of good eating habits.
Who Operates CACFP?
• Nonresidential child care centers
• Licensed public or private centers
• Nonprofit child care centers
• Family day care homes
• Head Start
• Homeless shelters
• Early Childhood Educational Assistance Program (ECEAP)
• Outside-school-hours programs
• Area-eligible at-risk centers
• Eligible proprietary child care and adult care centers
BREAKDOWN OF CACFP SPONSORS IN SY 2019-20
Institution Type # of Institutions # of Sites Sponsored
Independent Centers & Sponsors 599 1504
Adult Care Sponsors 9 13
Family Day Care Home Sponsors 8 1587
Totals 616 3104

11
CHILD CARE AND ADULT CARE CENTERS
Year Meals Served Snacks Served
# of
Sponsors # of Sites
2015-16 16,222,227 10,807,023 614 1435
2016-17 16,319,617 10,748,586 621 1487
2017-18 16,554,312 10,789,833 615 1517
2018-19 16,245,711 10,657,576 608 1517
FAMILY DAY CARE HOMES
Year Meals Served Snacks Served # of
Sponsors # of Sites
2015-16 5,210,657 3,282,592 11 2175
2016-17 4,818,907 3,033,811 9 1920
2017-18 4,384,212 2,755,233 8 1731
2018-19 3,978,997 2,452,735 8 1587
1380
1400
1420
1440
1460
1480
1500
1520
1540
2015-16 2016-17 2017-18 2018-19
CACFP Sites

12
AT-RISK AFTERSCHOOL MEALS
The At-risk Afterschool Meal Program offers federal funding to afterschool
programs that serve a meal or snack to children in low-income areas.
Sponsors eligible to participate must:
• Be organized primarily to provide afterschool care for children.
• Have 50% or more free and reduced-price eligibility.
• Include education and/or enrichment activities.
• Be available during the school year.
Forty (40) School Districts sponsor the At-Risk Program. There has been a steady
increase of districts sponsoring this program.
Year
# of School
District
Sponsors
# of
Sponsors
(non-
district)
# of Meals
Served for
School Year
Total Reimbursement
Amounts
15-16 28 117 2,207,524 $ 4,494,070
16-17 32 111 2,388,573 $ 5,320,878
17-18 37 108 2,249,757 $ 5,224,636
18-19 40 107 2,480,345 $ 5,812,126
2,050,000
2,100,000
2,150,000
2,200,000
2,250,000
2,300,000
2,350,000
2,400,000
2,450,000
2,500,000
2,550,000
15-16 16-17 17-18 18-19
At-Risk Meals Served
# of Meals Served for School Year

13
FOOD DISTRIBUTION PROGRAM
School districts, private schools, and residential childcare institutions that
participate in the National School Lunch Program (NSLP) are eligible to receive
food purchased by the U.S. Department of Agriculture (USDA). The Child
Nutrition/Food Distribution Program coordinates the delivery, storage, and
contracting of USDA Foods to be received by Recipient Agencies.
Entitlement Allocation
The USDA Foods Program provides foods such as fruit and vegetables, poultry,
eggs, other meat items, nuts, grains, oils and cheese. NSLP sponsors receive an
entitlement of 0.3625 per Total Lunches Served during the previous school year.
Summer Food Service Program (SFSP) sponsors also receive USDA Foods based
on .015 cents for each eligible meal served. This represents approximately $20,000
additional entitlement dollars for these programs.
Child and Adult Care Food Program (CACFP) institutions are offered USDA
Foods or cash-in-lieu of USDA Foods. For 2019-20, this equaled $0.2375 for
each eligible meal served.
Types of Food
• USDA Direct Foods- Products which USDA purchases food items for
delivery to Recipient Agencies. USDA Direct Foods include both
unprocessed and minimally processed products as well as “value-added”
items.
• Washington State Processed USDA Foods - Processing program allows
states to contract with commercial food processors to convert raw bulk
USDA Foods into more convenient, ready-to-use end products.
• DoD Fresh Fruit and Vegetable Program- Allows schools to use USDA
Foods entitlement dollars to buy fresh, US grown produce. The program
is operated by the Defense Logistics Agency (DLA) at the Department of
Defense.
VALUE OF USDA FOOD DISTRIBUTED IN WASHINGTON
Year Value of USDA Foods
2016-17 $29,393,264
2017-18 $30,454,455
2018-19 $29,019,965
2019-20 $30,852,478

14
In accordance with Federal civil rights law and U.S. Department of
Agriculture (USDA) civil rights regulations and policies, the USDA, its
Agencies, offices, and employees, and institutions participating in or
administering USDA programs are prohibited from discriminating based on
race,
color, national origin, sex, disability, age, or reprisal or retaliation for prior
civil rights activity in any program or activity conducted or funded by
USDA.
Persons with disabilities who require alternative means of communication
for program information (e.g. Braille, large print, audiotape, American Sign
Language, etc.), should contact the Agency (State or local) where they
applied for benefits. Individuals who are deaf, hard of hearing or have
speech disabilities may contact USDA through the Federal Relay Service at
(800) 877-8339. Additionally, program information may be made available
in languages other than English.
To file a program complaint of discrimination, complete the USDA Program
Discrimination Complaint Form, (AD-3027) found online at: How to File a
Complaint, and at any USDA office, or write a letter addressed to USDA
and provide in the letter all of the information requested in the form. To
request a copy of the complaint form, call (866) 632-9992. Submit your
completed form or letter to USDA by:
(1) mail: U.S. Department of Agriculture
Office of the Assistant Secretary for Civil Rights
1400 Independence Avenue, SW
Washington, D.C. 20250-9410;
(2) fax: (202) 690-7442; or
(3) email: [email protected].
This institution is an equal opportunity provider.

15
OFFICE OF SUPERINTENDENT OF PUBLIC INSTRUCTION
Child Nutrition Services
Old Capitol Building
600 Washington Street SE
PO BOX 47200
Olympia, WA 98504-7200
Phone: 360-725-6200
TTY: 360-664-3631


