

Office of the Chief EconomistOffice of the Chief Economist
Seth Meyer,Chief Economist, USDA
2021 Agricultural Outlook

Office of the Chief Economist
U.S. GDP and Disposable Incomemoved in opposite directions in 2020 and may unwind in 2021
23000
28000
33000
38000
43000
48000
53000
58000
10000
12000
14000
16000
18000
20000
22000
24000
Q1
2006
Q1
2007
Q1
2008
Q1
2009
Q1
2010
Q1
2011
Q1
2012
Q1
2013
Q1
2014
Q1
2015
Q1
2016
Q1
2017
Q1
2018
Q1
2019
Q1
2020
Q1
2021
Per-
capi
ta d
ispos
able
inco
me
GDP
(bill
ion
dolla
rs, a
nnua
lized
)
GDP Per capita disposable income
Great Recession
Source: Oxford Economics survey results
2
Office of the Chief Economist
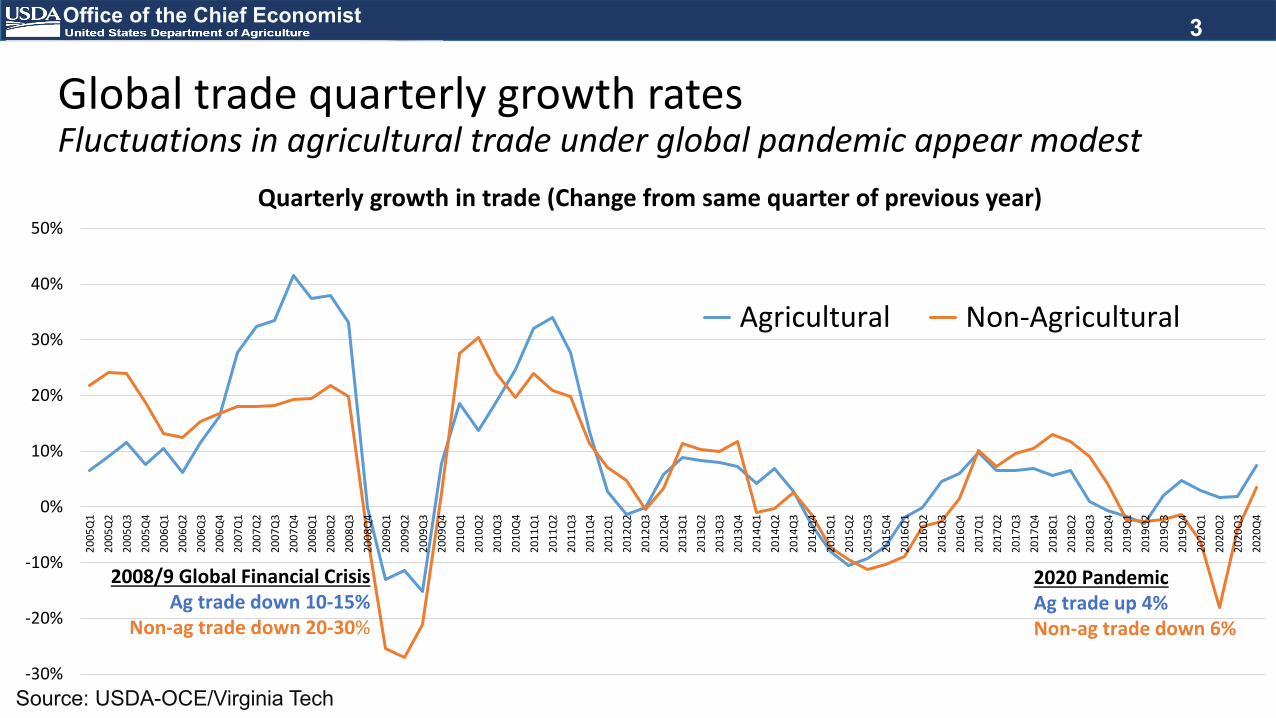
Global trade quarterly growth ratesFluctuations in agricultural trade under global pandemic appear modest
3
Source: USDA-OCE/Virginia Tech-30%
-20%
-10%
0%
10%
20%
30%
40%
50%
2005
Q1
2005
Q2
2005
Q3
2005
Q4
2006
Q1
2006
Q2
2006
Q3
2006
Q4
2007
Q1
2007
Q2
2007
Q3
2007
Q4
2008
Q1
2008
Q2
2008
Q3
2008
Q4
2009
Q1
2009
Q2
2009
Q3
2009
Q4
2010
Q1
2010
Q2
2010
Q3
2010
Q4
2011
Q1
2011
Q2
2011
Q3
2011
Q4
2012
Q1
2012
Q2
2012
Q3
2012
Q4
2013
Q1
2013
Q2
2013
Q3
2013
Q4
2014
Q1
2014
Q2
2014
Q3
2014
Q4
2015
Q1
2015
Q2
2015
Q3
2015
Q4
2016
Q1
2016
Q2
2016
Q3
2016
Q4
2017
Q1
2017
Q2
2017
Q3
2017
Q4
2018
Q1
2018
Q2
2018
Q3
2018
Q4
2019
Q1
2019
Q2
2019
Q3
2019
Q4
2020
Q1
2020
Q2
2020
Q3
2020
Q4
Quarterly growth in trade (Change from same quarter of previous year)
Agricultural Non-Agricultural
2008/9 Global Financial CrisisAg trade down 10-15%
Non-ag trade down 20-30%
2020 PandemicAg trade up 4%Non-ag trade down 6%

Office of the Chief Economist
COVID-19 drove wedge between farm & consumer pricespercent change from one year ago
-3%-2%-1%0%1%2%3%4%5%6%7%
-30%
-20%
-10%
0%
10%
20%
30%
40%
1/1/
2006
1/1/
2007
1/1/
2008
1/1/
2009
1/1/
2010
1/1/
2011
1/1/
2012
1/1/
2013
1/1/
2014
1/1/
2015
1/1/
2016
1/1/
2017
1/1/
2018
1/1/
2019
1/1/
2020
U.S. PPI Farm products U.S. CPI FoodSource: U.S. Bureau of Labor Statistics
right axis
left axis
4

Office of the Chief Economist
A drop in beef and pork plant capacity utilization was followed by a return to near normal
U.S. Beef and Pork Plant Capacity Utilization Daily Cattle and Hog Slaughter
Note: Excludes weekend operations. Adjusted to account for holiday operations.Sources: USDA, National Pork Board, and KC Fed Calculations
50556065707580859095100
50556065707580859095
100
Jan-
20
Feb-
20
Mar
-20
Apr-
20
May
-20
Jun-
20
Jul-2
0
Aug-
20
Sep-
20
Oct
-20
Nov
-20
Dec-
20
Jan-
21
Feb-
21
Beef
Pork
Percent of capacity, 5-day moving average
-50-40-30-20-10010203040
-50-40-30-20-10
010203040
Jan-
20
Feb-
20
Mar
-20
Apr-
20
May
-20
Jun-
20
Jul-2
0
Jul-2
0
Aug-
20
Sep-
20
Oct
-20
Nov
-20
Dec-
20
Jan-
21
Cattle Hogs
y/y percent change, 5-day moving average
5

Office of the Chief Economist
Temporary divergence in wholesale and retail beef and pork prices
Wholesale and Retail Beef Wholesale and Retail Pork
255075
100125150175200225
Jan-
20
Feb-
20M
ar-2
0
Apr-
20
May
-20
Jun-
20
Jul-2
0
Aug-
20
Sep-
20
Oct
-20
Nov
-20
Dec-
20
Jan-
21
Feb-
21
Boxed Beef Cutout Price (Choice/Select Avg.)*
Average Retail Price**
Index (Jan. 2020=100), 5-day moving average
255075
100125150175200225
Jan-
20
Feb-
20M
ar-2
0
Apr-
20
May
-20
Jun-
20
Jul-2
0
Aug-
20
Sep-
20
Oct
-20
Nov
-20
Dec-
20
Jan-
21
Feb-
21
Pork Carcass Cutout Price*
Average Retail Price**
Index (Jan. 2020=100), 5-day moving average
*Beef: negotiated prices and volume of boxed beef cuts delivered within 0-21 days and on average industry cutting yields. Pork: negotiated prices and volume of pork cuts delivered within 14 days and on average industry cutting yields. **Based on weekly national average of advertised prices, weighted based on carcass composition and interpolated to daily averageSource: USDA and KC Fed calculations.
6

Office of the Chief Economist
U.S. Motor Gasoline and Ethanol Domestic Usecorn marketing year
100
110
120
130
140
150
14/1
5
15/1
6
16/1
7
17/1
8
18/1
9
19/2
0
20/2
1
21/2
2
Billi
on G
allo
ns
Motor Gasoline
10
11
12
13
14
15
14/1
5
15/1
6
16/1
7
17/1
8
18/1
9
19/2
0
20/2
1
21/2
2
Billi
on G
allo
ns
Ethanol
Source: EIA, USDA
7
Office of the Chief Economist
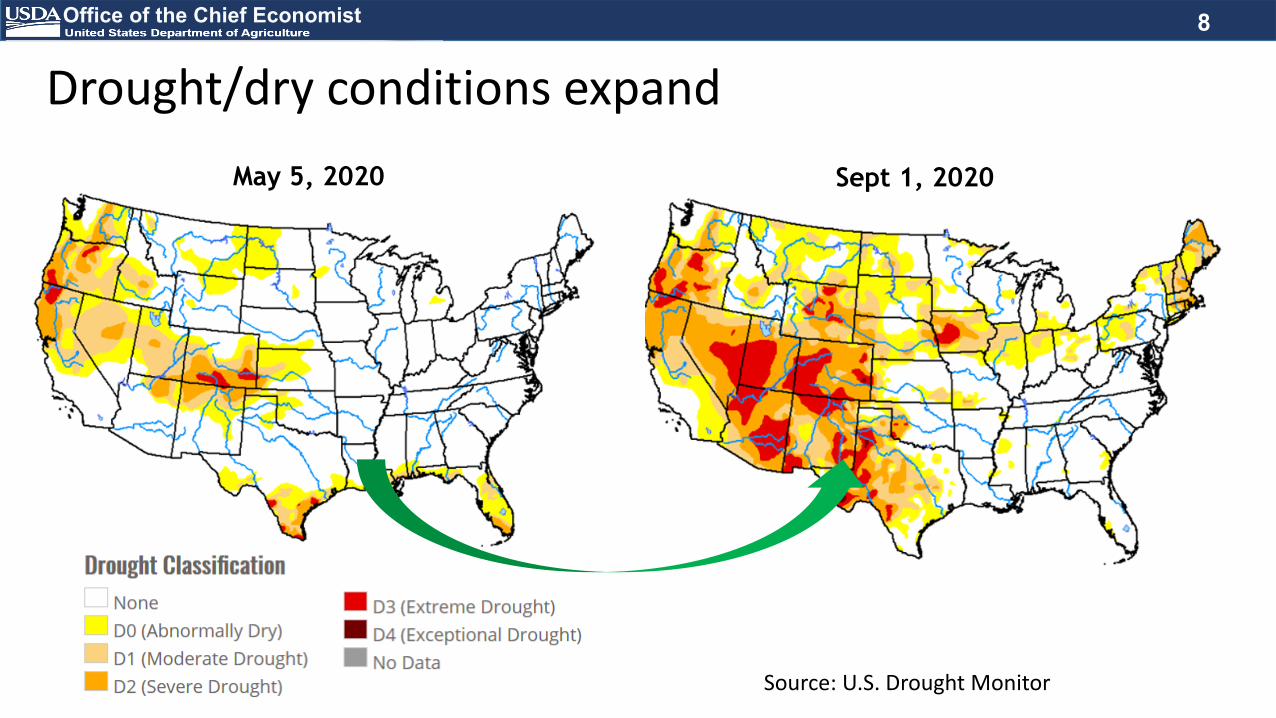
Drought/dry conditions expandSept 1, 2020May 5, 2020
Source: U.S. Drought Monitor
8

Office of the Chief Economist
Derecho as seen by Synthetic Aperture Radar (SAR)NASAharvest.org Iowa derecho impact analysis
Before After
9

Office of the Chief Economist
U.S. corn & soybean prices have been surging
Source: CME 2-1-2022 @ 11:50am
10

Office of the Chief Economist
Soybean and corn export demand expands even as the crop size shrinks
(1,500) (1,300) (1,100)
(900) (700) (500) (300) (100) 100 300 500
Supply Feed &Residual
Ethanol Exports Carryout
Chan
ge (m
illio
n bu
shel
s)
Corn
(500)
(400)
(300)
(200)
(100)
-
100
200
300
400
Supply Crush Exports Carryout
Soybeans
Source: OCE-WAOB
11

Office of the Chief Economist
Global crop supplies have tightened
900
950
1,000
1,050
1,100
1,150
1,200
2015
/16
2016
/17
2017
/18
2018
/19
2019
/20
2020
/21
Corn
280
300
320
340
360
380
2015
/16
2016
/17
2017
/18
2018
/19
2019
/20
2020
/21
Soybeans
680
700
720
740
760
780
2015
/16
2016
/17
2017
/18
2018
/19
2019
/20
2020
/21
Wheat
mill
ion
met
ric to
ns
Source: OCE-WAOB
12

Office of the Chief Economist
Chinese soybean imports and crush suggest a strong turn around in their hog herd
mill
ion
met
ric to
ns
0102030405060708090
100
2000
/200
1
2001
/200
2
2002
/200
3
2003
/200
4
2004
/200
5
2005
/200
6
2006
/200
7
2007
/200
8
2008
/200
9
2009
/201
0
2010
/201
1
2011
/201
2
2012
/201
3
2013
/201
4
2014
/201
5
2015
/201
6
2016
/201
7
2017
/201
8
2018
/201
9
2019
/202
0
2020
/202
1
Imports CrushSource: OCE-WAOB
13
Office of the Chief Economist
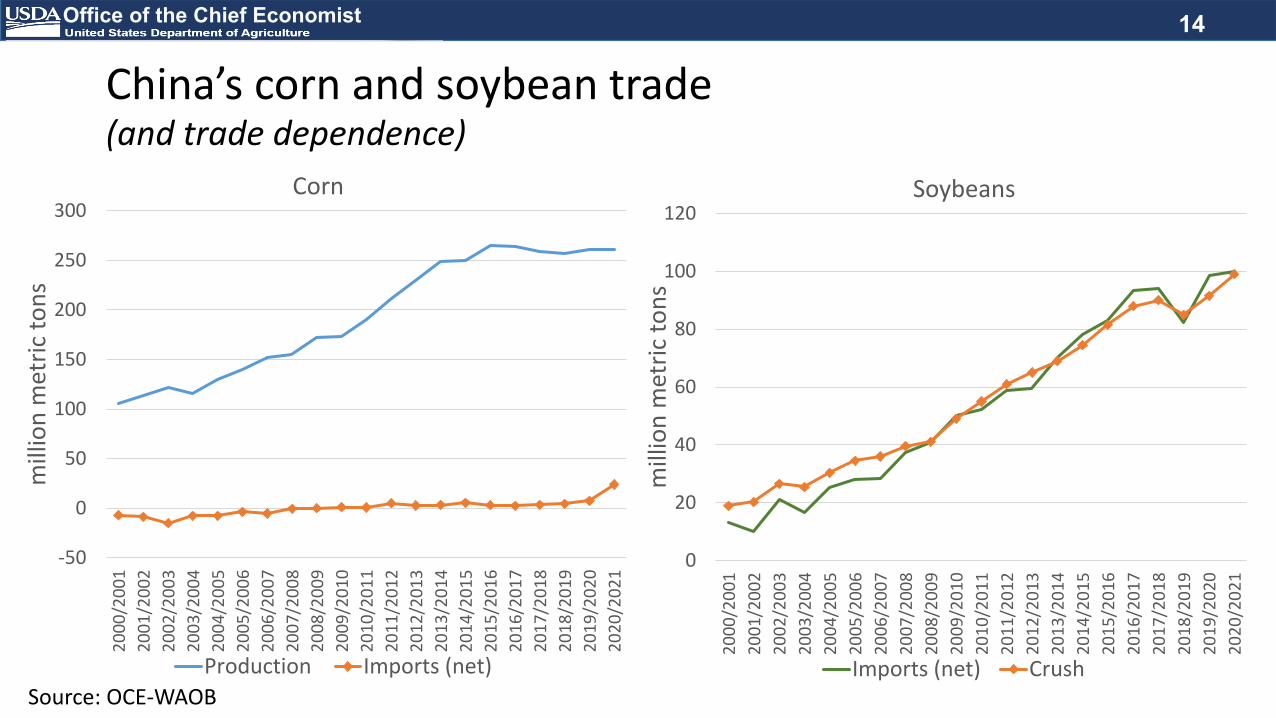
China’s corn and soybean trade(and trade dependence)
14
-50
0
50
100
150
200
250
300
2000
/200
120
01/2
002
2002
/200
320
03/2
004
2004
/200
520
05/2
006
2006
/200
720
07/2
008
2008
/200
920
09/2
010
2010
/201
120
11/2
012
2012
/201
320
13/2
014
2014
/201
520
15/2
016
2016
/201
720
17/2
018
2018
/201
920
19/2
020
2020
/202
1
mill
ion
met
ric to
ns
Corn
Production Imports (net)
0
20
40
60
80
100
120
2000
/200
120
01/2
002
2002
/200
320
03/2
004
2004
/200
520
05/2
006
2006
/200
720
07/2
008
2008
/200
920
09/2
010
2010
/201
120
11/2
012
2012
/201
320
13/2
014
2014
/201
520
15/2
016
2016
/201
720
17/2
018
2018
/201
920
19/2
020
2020
/202
1
mill
ion
met
ric to
ns
Soybeans
Imports (net) CrushSource: OCE-WAOB
14
Office of the Chief Economist
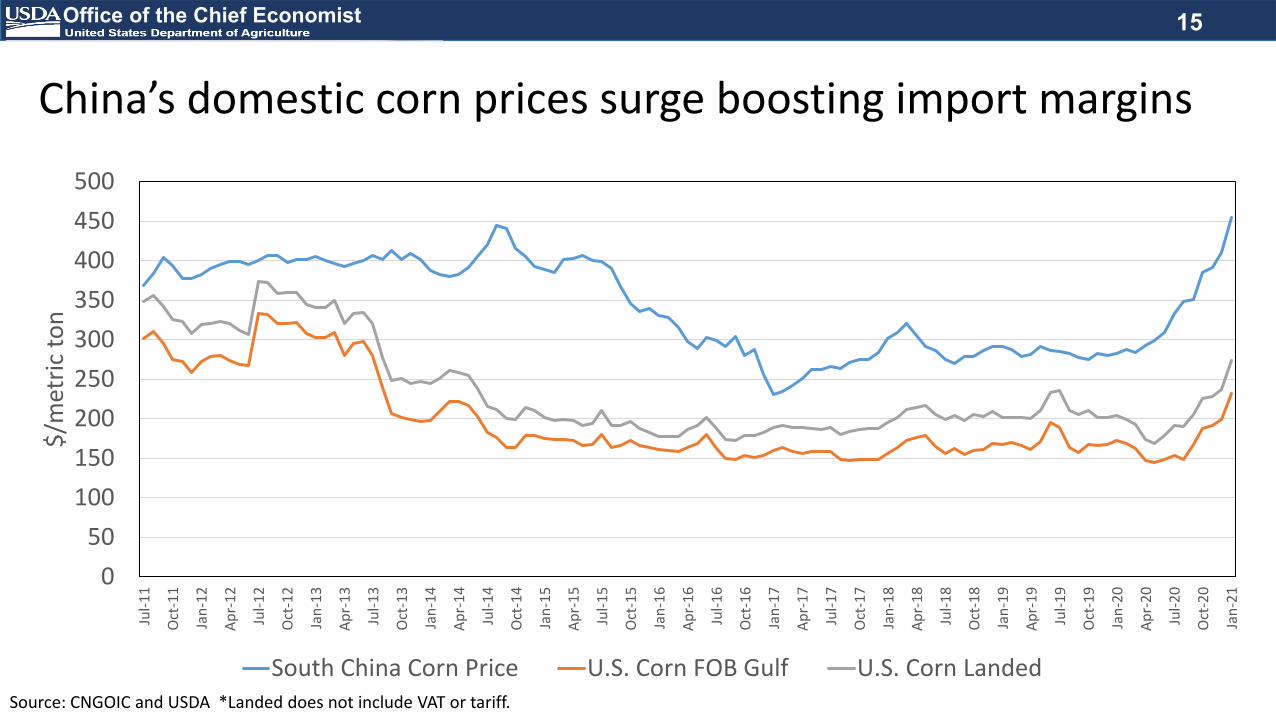
China’s domestic corn prices surge boosting import margins
050
100150200250300350400450500
Jul-1
1
Oct
-11
Jan-
12
Apr-
12
Jul-1
2
Oct
-12
Jan-
13
Apr-
13
Jul-1
3
Oct
-13
Jan-
14
Apr-
14
Jul-1
4
Oct
-14
Jan-
15
Apr-
15
Jul-1
5
Oct
-15
Jan-
16
Apr-
16
Jul-1
6
Oct
-16
Jan-
17
Apr-
17
Jul-1
7
Oct
-17
Jan-
18
Apr-
18
Jul-1
8
Oct
-18
Jan-
19
Apr-
19
Jul-1
9
Oct
-19
Jan-
20
Apr-
20
Jul-2
0
Oct
-20
Jan-
21
$/m
etric
ton
South China Corn Price U.S. Corn FOB Gulf U.S. Corn LandedSource: CNGOIC and USDA *Landed does not include VAT or tariff.
15

Office of the Chief Economist
China Energy Feedstuff Imports Forecast Record High, Exceeding 2014/15
0.00.51.01.52.02.53.03.54.04.55.0
Mill
ion
met
ric to
ns
U.S. Corn Ukraine Corn Other CornAustralia Barley Canada Barley Other BarleySorghum DDGS Field PeasSource: TDM
16

Office of the Chief Economist
China’s Corn Imports Exceeded TRQ For First Time in 2020more on the books just from the US than total TRQ for 2021
0
2
4
6
8
10
12
Jan Feb Mar Apr May Jun Jul Aug Sep Oct Nov Dec
Mill
ion
Met
ric To
ns
Range 2014-2019 2020 Imports TRQ Outstanding Sales
TRQ = 7.2 mmt or 283 mbu
17
Data: TDM and USDA-FAS Export Sales
US to China Outstanding Sales for 2020/21 Marketing Year, through Aug 31

Office of the Chief Economist
U.S. corn and soybean planted acreage
• In both 2019 and 2020 area considered ‘prevent plant’ was above average
• Simply going back to normal planting weather would increase total planted acres by several million acres
• Forecast prices, would further incentivize expanded acreage. Corn and soybean area expected to be a combined record 182 million acres
60
65
70
75
80
85
90
95
100
2014 2015 2016 2017 2018 2019 2020 2021
Mill
ion
acre
s
Corn SoybeansSource: OCE-WAOB
18

Office of the Chief Economist
Corn exports• China strong corn import
demand expected to continue to support solid US exports
• Brazil’s safrina corn area is up, but late planting limits yield prospects.
• Current phytosanitary restrictions in place by China on Brazilian corn is expected to reduce U.S. market share in key traditional export markets during the summer/fall.
01020304050607080
Mill
ion
met
ric to
nsU.S. exports Brazil exportsChina imports
Source: OCE-WAOB
19
Office of the Chief Economist
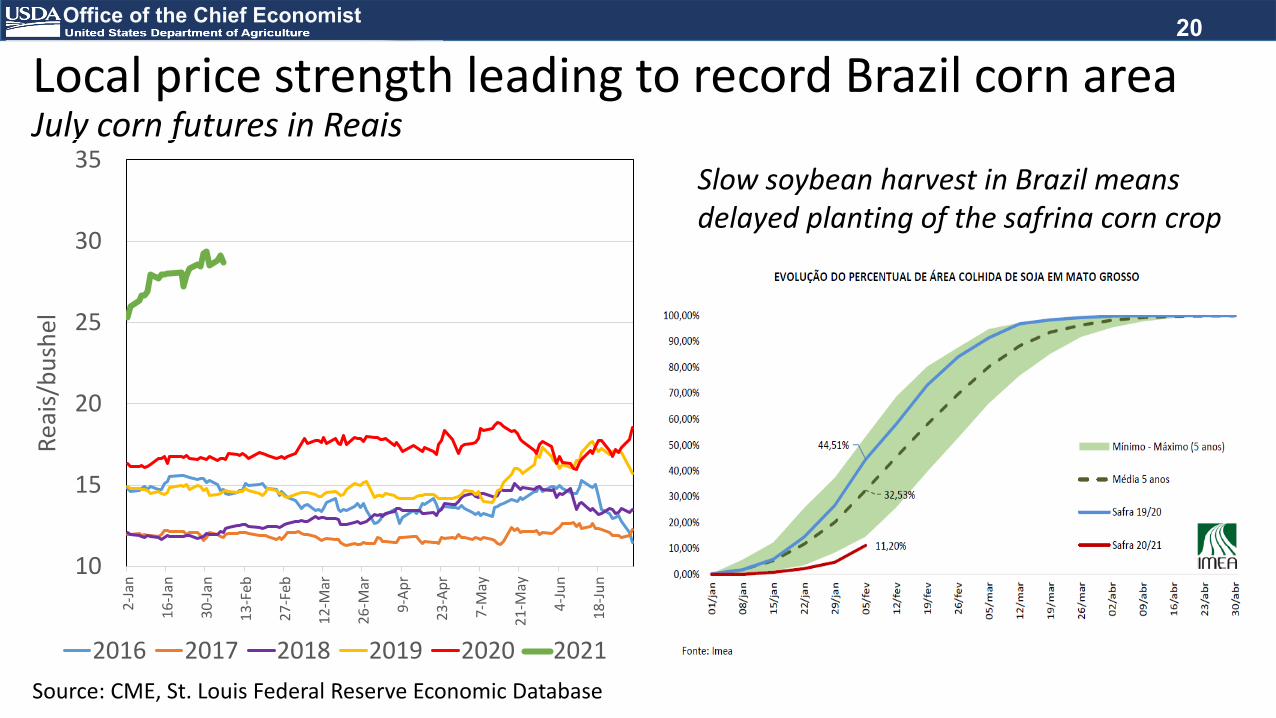
Local price strength leading to record Brazil corn areaJuly corn futures in Reais
10
15
20
25
30
352-
Jan
16-Ja
n
30-Ja
n
13-F
eb
27-F
eb
12-M
ar
26-M
ar
9-Ap
r
23-A
pr
7-M
ay
21-M
ay
4-Ju
n
18-Ju
n
Reai
s/bu
shel
2016 2017 2018 2019 2020 2021Source: CME, St. Louis Federal Reserve Economic Database
Slow soybean harvest in Brazil means delayed planting of the safrina corn crop
20

Office of the Chief Economist
U.S. wheat planted acres continue to decline
30
35
40
45
50
55
60
65
70
00/0
101
/02
02/0
303
/04
04/0
505
/06
06/0
707
/08
08/0
909
/10
10/1
111
/12
12/1
313
/14
14/1
515
/16
16/1
717
/18
18/1
919
/20
20/2
121
/22
mill
ion
acre
s
Wheat area has declined as gains in corn and soybean productivity push into wheat area
Wheat area expected to rise slightly, off the lowest area on record last year.
Winter wheat harvested area remains a question given prolonged dryness and recent extreme cold temperatures.
Source: OCE-WAOB
21

Office of the Chief Economist
U.S. cotton planted area to remain flat
0
2
4
6
8
10
12
14
16
18
00/0
1
02/0
3
04/0
5
06/0
7
08/0
9
10/1
1
12/1
3
14/1
5
16/1
7
18/1
9
20/2
1
mill
ion
acre
s
Cotton planted area held in check by better returns in other cropsand despite what are historically strong cotton prices.
Cotton area harvest remains in question given persistent dryness in some major cotton areas.
Source: OCE-WAOB
22

Office of the Chief Economist
U.S. cotton exports Cotton stocks fell
last year on a smaller crop and solid exports
Cotton demand held up well in total and relative to other fibers in 2020
Despite the projected larger crop, carryout stocks are expected to tighten further
0
5
10
15
20
25
2000
/01
2001
/02
2002
/03
2003
/04
2004
/05
2005
/06
2006
/07
2007
/08
2008
/09
2009
/10
2010
/11
2011
/12
2012
/13
2013
/14
2014
/15
2015
/16
2016
/17
2017
/18
2018
/19
2019
/20
2020
/21
2021
/22
mill
ion
bale
s
Production ExportsSource: OCE-WAOB
23

Office of the Chief Economist
U.S. crop prices and area
2010/11 to 2014/15 avg
2015/16 to 2019/20 avg
2020/21 2021/22
Corn 5.29 3.50 4.30 4.20
Soybeans 12.26 8.96 11.15 11.25
Wheat 6.71 4.65 5.00 5.50
Rice 14.40 12.34 13.40 13.60Upland Cotton 76.3 65.5 68.0 75.0 0
50
100
150
200
250
300
2000
-01
2002
/03
2004
/05
2006
/07
2008
/09
2010
/11
2012
/13
2014
/15
2016
/17
2018
/19
2020
/21
Corn SoybeansWheat Other 8-crop
8-crop planted area
mill
ion
acre
s
Source: OCE-WAOB
Prices ($/unit)
24

Office of the Chief Economist
Supplies of forage may be an issue for cattle given prior dry conditions and current heavy feeding needs during cold
25

Office of the Chief Economist
Livestock prices2016 2017 2018 2019 2020 2021f
dollars per hundredweightCattle 120.86 121.52 117.12 116.78 108.51 115.00Hogs 46.16 50.48 45.93 47.95 43.18 50.50
cents per poundBroilers 84.3 93.5 97.8 88.6 73.2 84.5Turkeys 117.1 96.1 80.2 89.2 106.5 110.8
cents per dozenEggs 85.7 100.9 137.6 94.0 112.2 111.8
Source: OCE-WAOB
26

Office of the Chief Economist
China’s Live Hog and Sow Inventories
15,000
20,000
25,000
30,000
35,000
40,000
45,000
50,000
55,000
150,000
200,000
250,000
300,000
350,000
400,000
450,000
500,000
550,000Live Hog(thousand head)Sow(thousand head)
Live HogsThousand head
SowsThousand head
Source: MARA, USMEF
27
Office of the Chief Economist
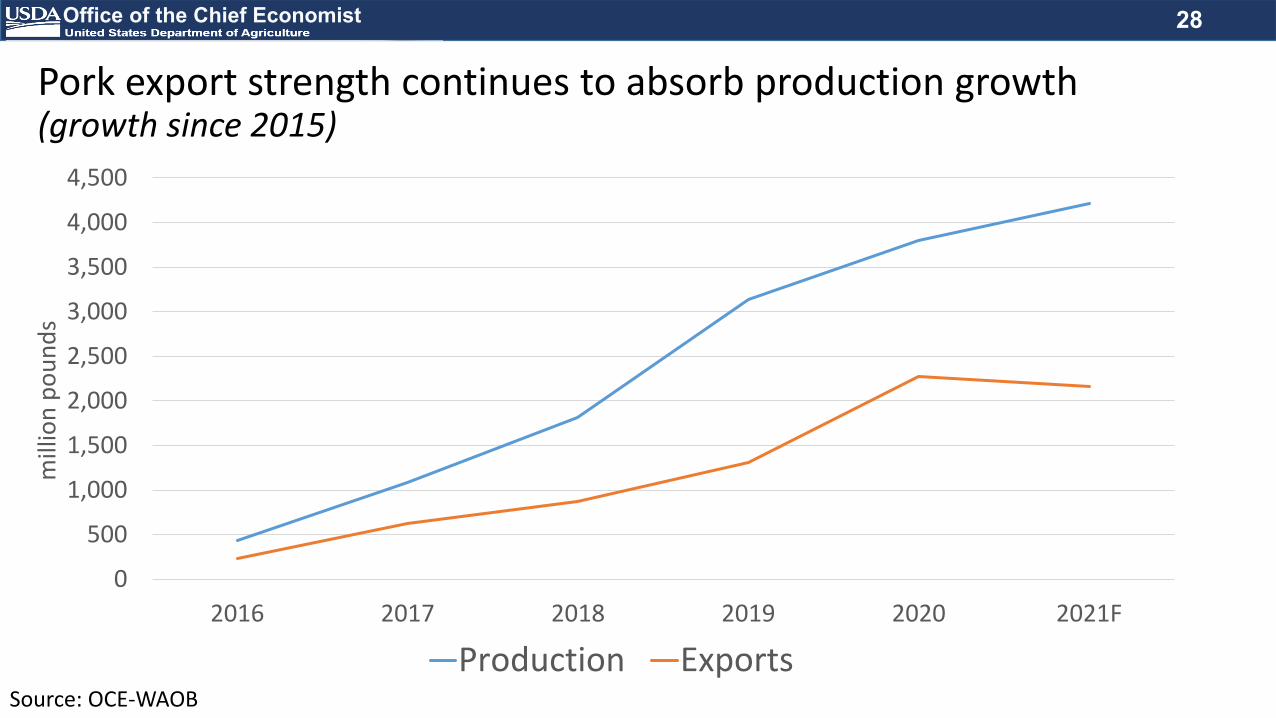
Pork export strength continues to absorb production growth (growth since 2015)
0
500
1,000
1,500
2,000
2,500
3,000
3,500
4,000
4,500
2016 2017 2018 2019 2020 2021F
mill
ion
poun
ds
Production ExportsSource: OCE-WAOB
28
Office of the Chief Economist
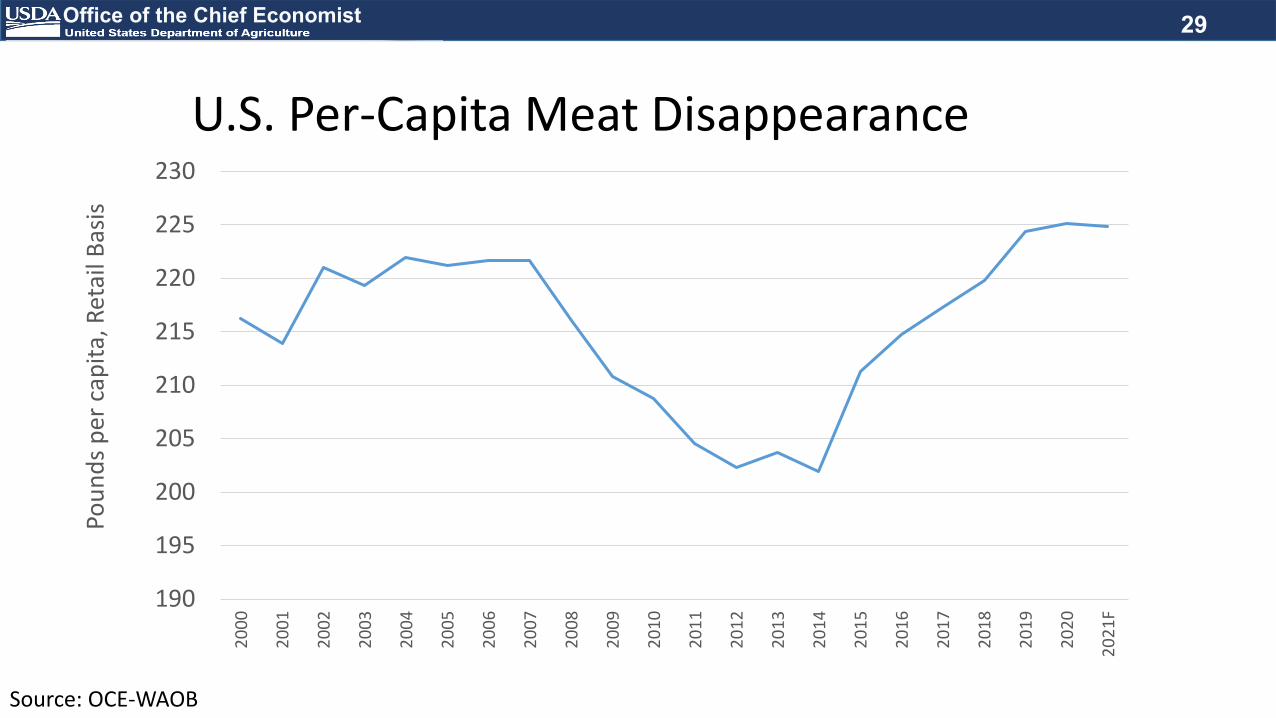
U.S. Per-Capita Meat Disappearance
190
195
200
205
210
215
220
225
230
2000
2001
2002
2003
2004
2005
2006
2007
2008
2009
2010
2011
2012
2013
2014
2015
2016
2017
2018
2019
2020
2021
F
Poun
ds p
er c
apita
, Ret
ail B
asis
Source: OCE-WAOB
29

Office of the Chief Economist
Considerable Dairy Product Price Volatility
30
*Weighted Average Blocks and Barrels
2019 2020 2021F
Butter ($/lb) 2.2431 1.5808 1.455
Cheese ($/lb) 1.7586 1.9236 1.695
Nonfat Dry Milk ($/lb)
1.0419 1.0417 1.125
Whey ($/lb) 0.3799 0.3621 0.480
All Milk ($/lb) 18.63 18.30 17.15
0
0.5
1
1.5
2
2.5
3
Weekly National Dairy Product Sales Report
Butter Cheese* Nonfat Dry Milk Whey
Source: AMS-NDPSR Source: OCE-WAOB
30

Office of the Chief Economist
U.S. Ag exports forecast up in FY2021 to a record $157B on strong China demand
Data: USDA
31
Record exports to China forecasted: $31.5B
0%
5%
10%
15%
20%
25%
-
20
40
60
80
100
120
140
160
180
2001 2002 2003 2004 2005 2006 2007 2008 2009 2010 2011 2012 2013 2014 2015 2016 2017 2018 2019 2020 2021F Canada Mexico China Other % of China Share
Billion dollars China Share

Office of the Chief Economist
Total government payments increased as a result of adverse circumstances but are projected to fall in 2021
32
05
101520253035404550
1985
1986
1987
1988
1989
1990
1991
1992
1993
1994
1995
1996
1997
1998
1999
2000
2001
2002
2003
2004
2005
2006
2007
2008
2009
2010
2011
2012
2013
2014
2015
2016
2017
2018
2019
2020
2021
Billions (2021$)
Other Government Payments MFP Covid-related (CFAP; Consolidated Appropriations Act, 2021; and PPP)
Source: Economic Research Service Farm Income

Office of the Chief Economist
Corn, soybeans, cattle and hogs push receipts higherand drive the $20.4 billion dollar increase in receipts
crop cash receipts livestock and dairy cash receipts
Source: Economic Research Service Farm Income
33

Office of the Chief Economist
Net cash farm income and net farm income are forecast to decrease in 2021
34
$111.4B
$128.3B
$0$20$40$60$80
$100$120$140$160$180
Billion dollars (2021$)
Net Farm Income (NFI) Net Cash Farm Income (NCFI)
2000-2020 Average NFI 2000-2020 Average NCFI
Data: USDA-ERS

Office of the Chief Economist
Outlook is positive - Uncertainties remain
• GDP expected to rebound, disposable income less certain.• Supply chain disruptions have moderated, at some cost.• Prospects for crops supported by solid domestic demand continued strong exports. • Livestock outlook supported by continued strong domestic demand and stable
exports.• Trade, particularly to China, a key element for 2021.• Good dairy demand but large product stocks.• Receipts from the market replacing ad-hoc assistance.• Weather will have the last say on supplies.
35

Office of the Chief Economist
Visit the OCE website for the latest USDA commodity reports and Agriculture Outlook Forum information @ www.usda.gov/oce
Questions? [email protected]
36
USDA’s 97th Annual Agricultural Outlook Forum: February 18-19, 2021


