

Future Lifestyle FashionsINVESTOR DECK July 2018
04 FLF Overview
Why grow with us
14 A burgeoning fashion market19 A favourable shift in consumer preferences38 A unique business model
Financial progress so far43 Business overview46 Key Deliverables47 Against Competition48 Key Financials49 Stake Holder Value creation
50 Behind it all – Visionary Leadership
53 The Road Ahead
56 Top 5 Reasons to Invest in FLF
58 Good to Know
Index
DisclaimerThis report contains forward-looking statements, which may be identified by their use of words like ‘plans’, ‘expects’, ‘will’, ‘anticipates’, ‘believes’, ‘intends’, ‘projects’, ‘estimates’, or other words of similar meaning. All statements that address expectations or projections about the future, including but not limited to statements about the Company’s strategy for growth, product development, market position, expenditures, and financial results are forward-looking statements. Forward-looking statements are based on certain assumptions and expectations of future events. The Company cannot guarantee that these assumptions and expectations are accurate or will be realized. The Company’s actual results, performance or achievements could thus differ materially from those projected in any such forward looking statements. The Company assumes no responsibility to publicly amend, modify or revise any forward looking statements, on the basis of any subsequent developments, information or events.


FLF – An Overview

INVESTMENT PROPOSITION
Future Group, a retail pioneer, has evolved into a CONSUMER GOODS centric company with offerings across
Home
Our Parent – Future Group
5
Business Backed by strong retail infrastructure & supply chain operations
Key Investors
Operates acrosshypermarkets, convenience stores and home segment
Offers end to end logistics andsupply chain solutions to the Group
Caters to in store retailIinfrastructure including furniture, fixtures, IT etc
Focuses on Integrated branded fashion from design to distribution; with a portfolio of brands in fashion space
Pure play integrated Food &FMCG company with a portfolio of brands across categories
Fashion Food

INVESTMENT PROPOSITION
An integrated fashion company deriving its strength from
• Fashion brands
• Fashion distribution
• Investment in fast growing fashion
companies
50.0%60% in FY18(40%in FY17)
Dividend
12.0%(17.7%in FY17)
19.3%` 4,498 Cr in FY18(` 3,877Crin FY17)
21.8%` 443 Cr in FY18(` 364Crin FY17)
182.3%` 127Cr in FY18(` 45 Cr in FY17)
279.2%` 6.6 in FY18
(` 2.4 in FY17)
1.6(1.8 times in FY17)
Same Store Growth#
Revenue* EBITDA PAT
EPS Debt EBITDA ratio
FLF - India’s leading integrated fashion player from the house of Future Group
6
FY18 Financial Performance
10.0%(18.1% in FY17)
Central SSG% Brand Factory SSG%
15.8%(16.6% in FY17)
Note:- all figures are based on Consolidated financial statement. * Revenue growth % is not comparable due to tax rate differentials. # FLF SSG% is Central + Brand Factory SSG
INVESTMENT PROPOSITION
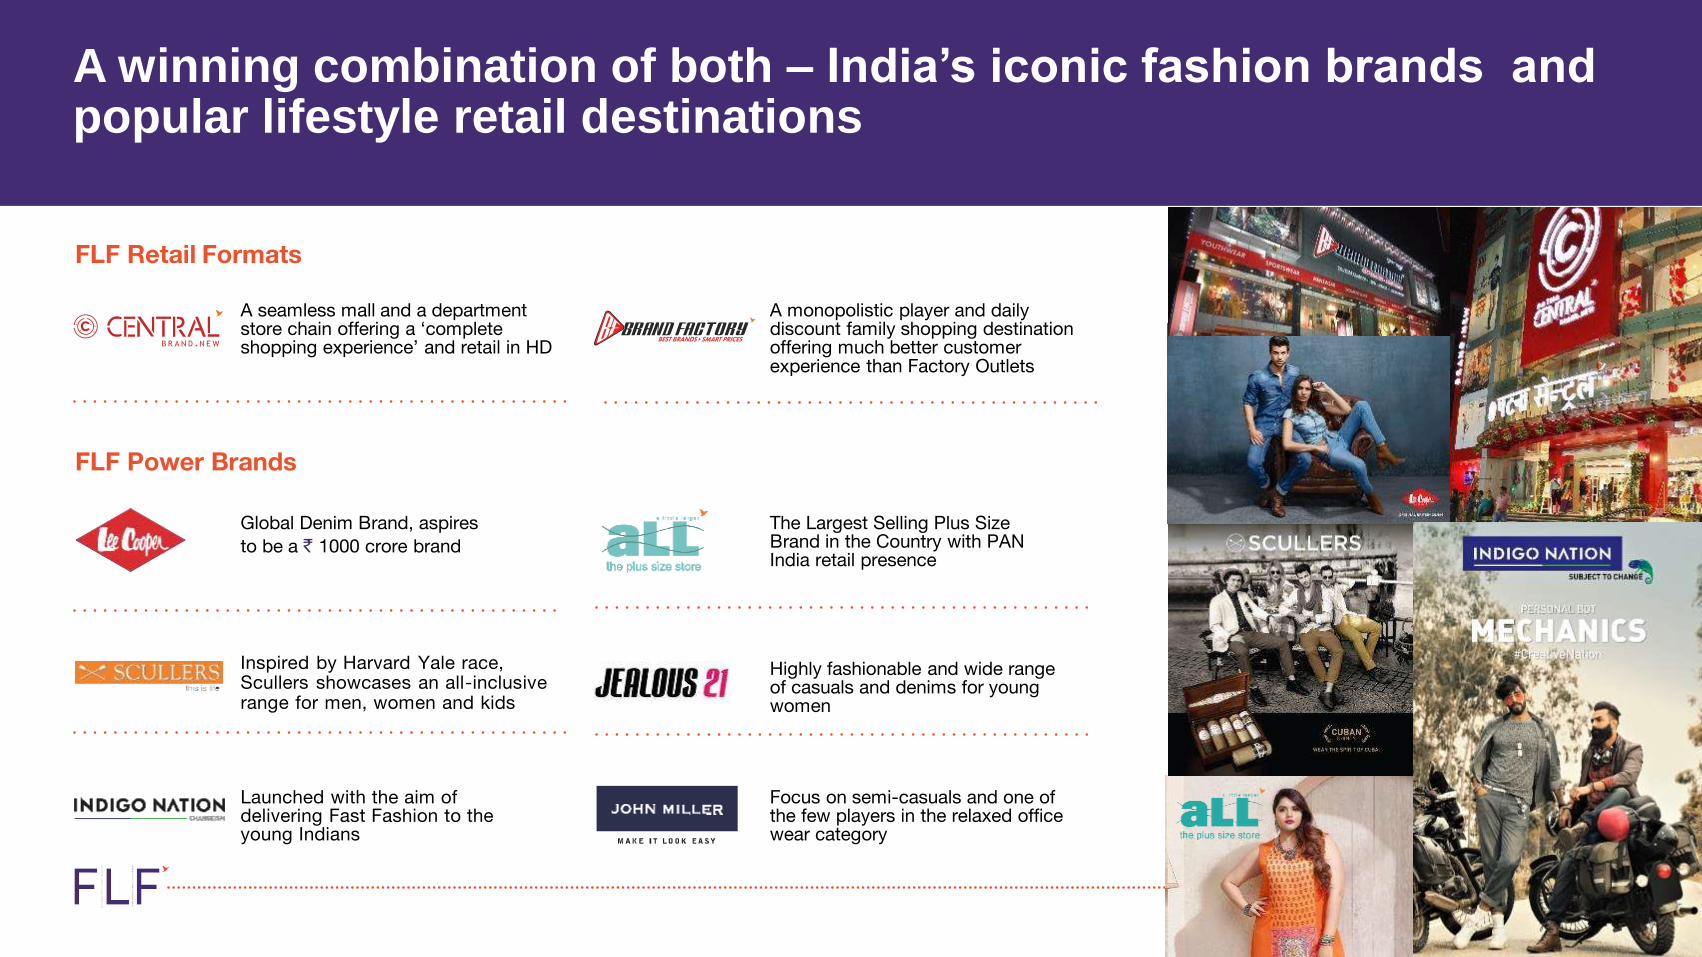
A winning combination of both – India’s iconic fashion brands and popular lifestyle retail destinations
7
FLF Retail Formats
A monopolistic player and daily discount family shopping destination offering much better customer experience than Factory Outlets
Inspired by Harvard Yale race, Scullers showcases an all-inclusive range for men, women and kids
Launched with the aim of delivering Fast Fashion to the young Indians
FLF Power Brands
A seamless mall and a department store chain offering a ‘complete shopping experience’ and retail in HD
Global Denim Brand, aspires to be a ` 1000 crore brand
The Largest Selling Plus Size Brand in the Country with PAN India retail presence
Highly fashionable and wide range of casuals and denims for young women
Focus on semi-casuals and one of the few players in the relaxed office wear category

INVESTMENT PROPOSITION
Holding an Associate company that houses investee brands
8
Key Investee Brands
Super TrendyandAffordable IndianFastFashion brand for Women.A bridge between luxury and unorganisedbrands
Expert shoemakerswith 190 years of experience
Offers formidable value and international style across a range of menswear apparel and accessories

INVESTMENT PROPOSITION
FLF Key Milestones
Revenue ` 3,877 Cr 16.4% SSG at FLF
2004 2005 2006 2012 2013 2014 2015 2016
FY17 Highest ever Free Cash Flow
2017
Central @
HD-Aerocity
Lee Cooper
Carved out
9
8 Central launched 11 Brand Factory launched
Disruption: Brand factory cover charge
Consistent double digit SSG% for FLF #
Power Brands transformation
Widely covered fashion stock in India including CLSA & Jefferies.
Inducted into India MSCI Index
Achieved double digit ROCE% Credit Rating Upgrade by CRISIL
Interest cost Reduction through NCDs
EPS tripled
~1 mn area added
Financial Efficiency ROCE: 11.7%, +ve FCF
FY
18
–S
us
tain
ing
mo
me
ntu
m
Business EffectivenessRevenue ` 4,498 Cr , 9.8% EBITDA
2018
Most profitable
branded fashion
retailer in India
# FLF SSG% is Central + Brand Factory SSG

INVESTMENT PROPOSITION
Awards & Recognition
10
Awards & Recognition
FLF was awarded the Most Admired Fashion Company of the year 2017.
Central @ HD was awarded the Design Concept of the Year –Theme Store.
Brand Factory's 'Free Weekend Sale' won the Most Admired Multi Fashion Retailer of the Year award, at the India Fashion Forum.
Indigo Nation was awarded the Most Admired Fashion Brand of the Year in Men’s Western Wear
CoverStory was awarded the Most Admired Brand of the Year – New Launch, at the India Fashion Forum.
Scullers won the Best Marketing Campaign of the Year award at CMO Asia
Jealous 21 won the Best Facebook Campaign of the Year Award at CMO Asia
Urbana won the Best Social Media Integrated Campaign of the Year at CMO Asia
Central received Gold and Merit awards for covering all 3 categories at VM & RD Retail Design Awards 2018
BF Won the Most effective marketing & Promotions campaign award for the 2 year in 2018 as well for “Free Shopping weekend Campaign.

INVESTMENT PROPOSITION
Key Highlights – FY18
Expansion of Central and Brand factory stores in line with plan – about 1 mngross sft added
Achieved a revenue growth of 19.3 %* backed by a +ve double digit SSG#
Acquired Lee Cooper footwear India license effective from April ‘18
Successfully carried out - India’s first ticketed shopping event for Brand Factory with overwhelming response.
Lee Cooper : ‘Digital First’ approach to market Lee Cooper
aLL's debut ad campaign points out the 'plus points' of being a plus size person - ‘What’s your Plus Point
Successfully completed Ind AS compliance, implementation supported by Deloitte
GST Roll out completed successfully
Positive FCF achieved and EPS tripled over FY17
* Revenue growth % is not comparable due to tax rate differentials # FLF SSG% is Central + Brand Factory SSG

INVESTMENT PROPOSITION12
Why grow with us-Investment proposition

INVESTMENT PROPOSITION 13
FLF Is Championing India’s Rising Fashion Momentum
A burgeoning fashion market
A favourableshift in
consumer preferences
enabled by
A unique business model

INVESTMENT PROPOSITION 14
A burgeoning fashion market

INVESTMENT PROPOSITION
India - One of the largest and fastest growing economies of the worldWorth $ 2.264 trillion,India’s GDP is growing at the rate of 7.1% annually(Source: CSO)
Key Policy and Tax Initiatives Supporting Formalisation of the EconomyIntroduction of the landmark GSTregimeandtheinitiatives like demonetisation have catapultedtheeconomytobe more organised and formal. (Source:CSO)
Strong demographic dividendNearly 50% of India’s population isbelow the age of 30.60% of the population is economically active (Source: 2011 Census)
15
The Burgeoning Fashion Market
Strong macroeconomics favour the segments FLF caters to
INVESTMENT PROPOSITION

INVESTMENT PROPOSITION 16
The Burgeoning Fashion Market
India’s consumption story is on the cusp of a major growth phase
India’s consumption story will be shaped by its “Burgeoning middle class”
Apparel and accessories has the organised penetration at ~23%, and will be key beneficiary of the growth in organised Brick and Mortar retail
Source :BCG CCI proprietary income database; BCG analysis. Note: Income distribution is calculated in constant 2015 Dollars; $1 = ` 65. Because of rounding, not all percentages add up
to 100. Technopak Research and Analysis
In India, income Distribution is evolving as affluence Rises
ELITE
(>-30.8)
AFFLUENT
(15.4-30.8)
ASPIRERS
(2.3- 7.7)
NEXT BILLION
(2.3- 7.7)
STRUGGLERS
(<2.3)
INDIAN HOUSEHOLDS, BY INCOME (MILLIONS)Annual Gross
Household Income
($-thousands)2005
3.1
(1.5%)
7
(3%)
17 (8%)
89 (42%)
93 (44%)
2016
6.5
(2%)
17
(6%)
40 (15%)
121 (45%)
82 (31%)
2025
15.8
(5%)
33
(11%)
61 (20%)
140 (46%)
55 (18%)
161 MILLION
HOUSEHOLDS
GDP
FY12 FY20FY16
1,318 3,4492,115
Private consumption
760 2,0001,262
Retail 386 960616
27 11555
CAGR –19%-20%
CAGR –21%-22%Organised
Brick & Mortar
Retail
Rural
Urban
386
201
185
52%
48%
Retail
Rural
Urban
616
314
302
51%
49%
Retail
Rural
Urban
960
460
499
48%
52%
All fig in $ bn

INVESTMENT PROPOSITION
India’s fashion industry hit$100bn in 2015 and is growing at the CAGR of 12%Source: A T Kearney
Global examples indicate when a country’s per capita GDP nears ~$2000, its fashion industry sees an exponential growth.
India’s per capita GDP is ~$1700 at presentSource: World Bank
3x
China
2006 2001 1986 1984 1982
Country
Reached GDP per capita of$2000 in (Year)
Trajectory of Retail sales after it reached $2000 per capita GDP 2x
Russia
2x
Brazil
4x
South Korea
3x
Singapore
Source: UNESCO, CLSA Report
17
The Burgeoning Fashion Market
India’s fashion market is nearing an inflection point

INVESTMENT PROPOSITION 18
The Burgeoning Fashion Market
India’s fashion retail market – A snapshot
The Indian Fashion Retail Market$46 billion fashion retail industry in India expected to grow to $115 billion by 2026
9.7% CAGR expected for the next 10 years
Indian apparel industry is the second largest contributor in the retail industry after food and grocery
Men’s WearThe largest segment of the Indian fashion retail market (41% of market) $19 billion market size, expected to reach $45.5 billion by 20269% CAGR expected for the next 10 yearsMen’s denims, active wear and t-shirts showing double-digit growth across tiers
Region-Wise Distribution of Apparel Market23% of the market contribution by metro cities such as Delhi/ NCR, Mumbai, Bengaluru, Chennai54% of low and economy price segments of apparel market by rural population
Women’s Wear38% of the Indian fashion retail market $17.5 billion market size, expected to reach $44 billion by 20269.9% CAGR expected for the next 10 years66% of the women’s apparel is ethnic wear Casuals, inner wear and denims are witnessing double-digit growth
Price Segmentation of Apparel MarketThe apparel market can be broadly divided into super premium, premium, medium, economy and low price segments 29% of market captured by the medium price segment 28% from the economy segment
2016 2026
The Indian Fashion Retail Market
$46 bn $115 bn
CAGR
9.7%
2016 2026
Men's Wear
$19 bn $46 bn
CAGR
9.0%
2016 2026
Women's Wear
$18 bn $44 bn
CAGR
10%

INVESTMENT PROPOSITION 19
A favourableshift in consumer preferences
INVESTMENT PROPOSITION
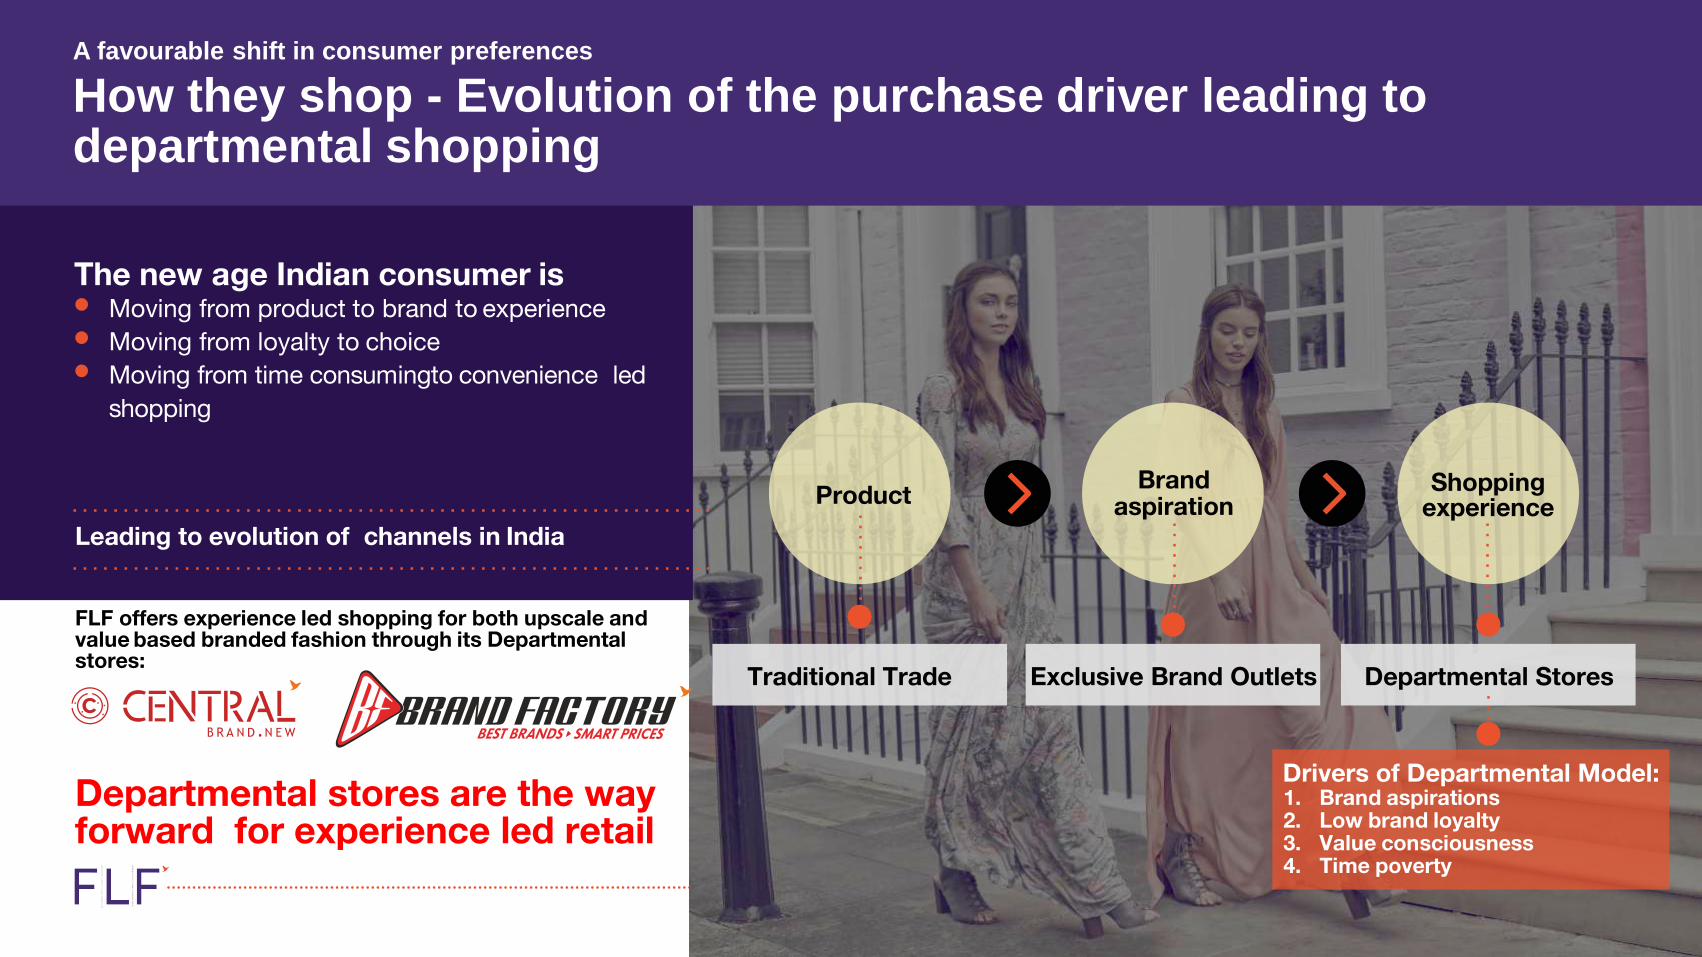
The new age Indian consumer is• Moving from product to brand to experience • Moving from loyalty to choice• Moving from time consumingto convenience led
shopping
Leading to evolution of channels in India
FLF offers experience led shopping for both upscale and value based branded fashion through its Departmentalstores:
Departmental stores are the way forward for experience led retail
A favourable shift in consumer preferences
How they shop - Evolution of the purchase driver leading to departmental shopping
Drivers of Departmental Model:1. Brand aspirations2. Low brand loyalty3. Value consciousness4. Time poverty
Product
Exclusive Brand OutletsTraditional Trade Departmental Stores
Brand aspiration
Shopping experience
INVESTMENT PROPOSITION
Our Reach
Overview
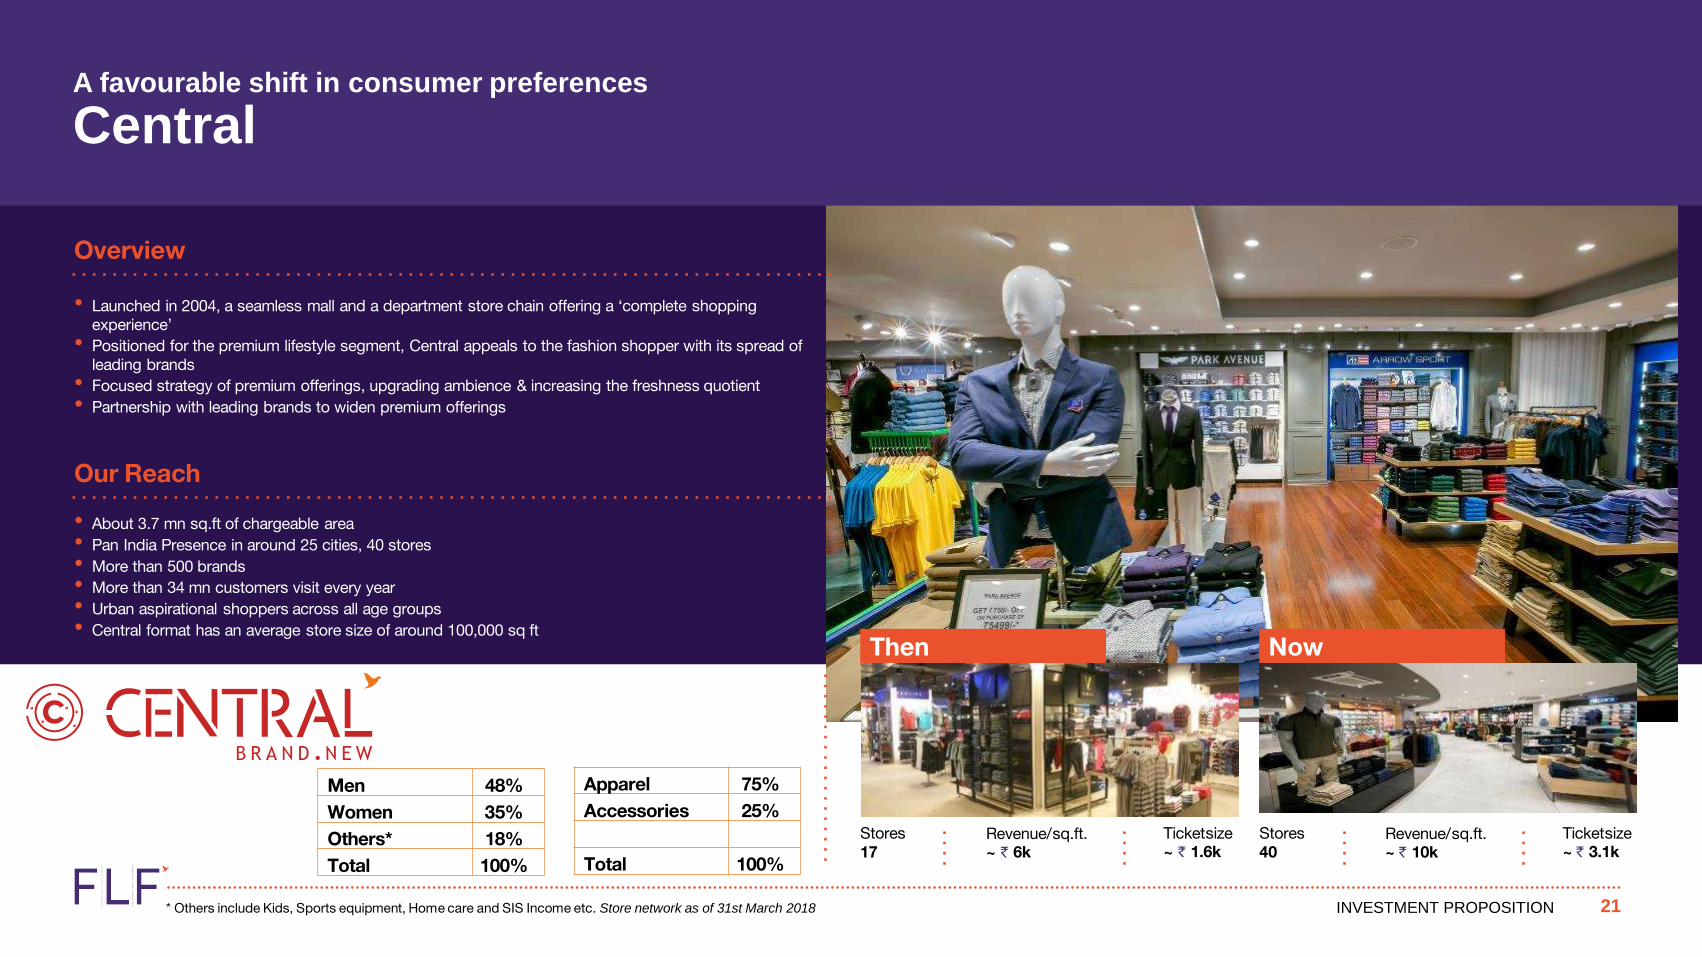
• Launched in 2004, a seamless mall and a department store chain offering a ‘complete shopping experience’
• Positioned for the premium lifestyle segment, Central appeals to the fashion shopper with its spread of leading brands
• Focused strategy of premium offerings, upgrading ambience & increasing the freshness quotient• Partnership with leading brands to widen premium offerings
A favourable shift in consumer preferences
Central
21
• About 3.7 mn sq.ft of chargeable area• Pan India Presence in around 25 cities, 40 stores• More than 500 brands• More than 34 mn customers visit every year• Urban aspirational shoppers across all age groups• Central format has an average store size of around 100,000 sq ft
Stores17
Stores40
Revenue/sq.ft.~ ` 6k
Revenue/sq.ft.~ ` 10k
Ticketsize~ ` 1.6k
Ticketsize~ ` 3.1k
Then Now
Men 48%Women 35%Others* 18%Total 100%
Apparel 75%Accessories 25%
Total 100%
* Others include Kids, Sports equipment, Home care and SIS Income etc. Store network as of 31st March 2018

INVESTMENT PROPOSITION
CENTRALHi Definition Fashion Experience
Ambience and Store facilities
Central Aroma
Mother’s room
Lux Billing
Product reserved service
Fashion stylists by
appointment
Valet Parking
Fashion attendants
Golf cart pickup & dropservice
Whatsapp shopping
Central buddies & Ushers
Complimentary wifi
Central privilege shoppers
A favourable shift in consumer preferences
Central – Hi Definition Fashion Experience
Assisted Shopping

INVESTMENT PROPOSITION
Our Reach
Overview Our Customers
Key Highlights
Family shopping destination offering much better customer experience than Factory Outlets Typically offers 20% -70% discounts on more than 200 brands for men, women and kids Perfect answer to e commerce with 365 days attractive discountsStrong liquidation channel not just for FLF brands but for the industryEfficient supply chain enables freshness of stock at both Central and Brand Factory
About 1.8 mn sq.ft of chargeable areaPan India Presence in around 26 cities, 63 stores More than 20 mn customers visit every year
Stores13
Stores63
Revenue/sq.ft.~ ` 4.5k
Revenue/sq.ft.~ ` 7.6k
Ticketsize~ ` 1.3k
Ticketsize~ ` 2.3k
Exciting growth prospectus with no offline competition Availability of marquee brands for fantastic shopping experience Brand Factory has an average store size of around 30,000 sq ftApparel contributed ~90% of total sales in FY18. Aspiration to take this format to next level tapping the significant market potential
Value seeking suburban familiesFashion following mini-metro/smart shoppers Brand conscious explorative youthYoung qualified, status seekers
Then Now
A favourable shift in consumer preferences
Brand Factory – India’s Leading Fashion Discount Chain
23
Men 74%Women 15%Others* 11%Total 100%
Apparel 90%Accessories 10%
Total 100%
* Others include Kids, Sports equipment, Home care and SIS Income etc. Store network as of 31st March 2018

INVESTMENT PROPOSITION
A favourable shift in consumer preferences
Brand Factory - In a New Avatar
24
Brand Factory 2.0• Large format contemporary branded value store catering to fashion aspiration of
youth.
• Five floors covering categories like Men’s Fashion, Women’s Fashion & Kids Fashion, Sportswear, Travel & Handbags, Footwear and Fashion Accessories
• Store experience with more than 200 brands to choose from.
A different branding approach• The overall thought is to give a definite character to the store
• Store reflects the brand personality visually as well as through language.
• Critical store touch points like Billing counter/CSD Desk/Entry and Exit points are also given a new twist

INVESTMENT PROPOSITION
A favourable shift in consumer preferences
What they want to shop- Evident shift towards organised markets offering popular brands and best experience under one roof
25
Clear and rapid shift towards branded products
Growing desire for fast fashion
• Branded fashion grew at 24% CAGR over 2011-15
• Branded apparel growing faster than overallmarket (14% vs. 9.2% CAGR)
• Modern retail has high (~43%) penetration of branded apparel
• Fast fashion in India is growing at a yearly pace of 25-30%, twice the rate of overall market.
• The rise in disposable income coupled with a growing desire for global fashion, has led the Indian consumer to go shopping, 10-12 times a year as compared to 1-2 occasion-led shopping before
2011 2015 CAGR (%)25% 7% 13%
14%
33%
34%29%
10%34%
75% 40 15
145229
88
47%
19
21
15
10
71%41%
66%
20152020
2021e
Branded MenUnbranded KidsWomen Sports/Others
Source: UNESCO, CLSA Report
Branded Apparel Market Growing Faster Than Overall Market #
(US$ bn) (US$ bn)

INVESTMENT PROPOSITION
A favourable shift in consumer preferences
Brand Profile
26
FLF present across all key categories and well diversified (Not overly dependent on any category for growth)
Branded Market Opportunity FLF Brands Investee Brands
Men’s wearSize: USD 7bnGrowth: 10% CAGR
Unisex Brands
Women’s wearSize: USD 5bnGrowth: 15% CAGR
Sports /Leisure wear
Footwear /Others

INVESTMENT PROPOSITION
A favourable shift in consumer preferences
Brand Pyramid
27
Value brands
Main stream
Premium/ Bridge
Bra
nd H
iera
rchy
Key steps taken in FY18 … Rise of Power Brands
Product and Design
Redefined brands philosophy and
roadmap
London Design team for Scullers
and Jealous
Sourcing
consolidation &
Assortment
Closure of loss
making EBOs
Multiple reviews &
brain storming
sessions in last few
months
FashioNext 18 –
Trade fair
Range Selection
after multiple
versions
Detailed analysis
basis Rate of Sale
Comprehensive
pricing strategy
Last seasons sale
feedback
incorporated
Highlighting
the unique
features
Focus on
increasing the
own share
brands
Brand Pyramid

INVESTMENT PROPOSITION
A favourable shift in consumer preferences
Journey of Power brands
28
FY15 FY18 FY21
Power Brands Share of FLF Brands Revenue
53%
63%
Power Brands to constitute ~70% to own brand sales by FY21 and expected to grow at a rate 2x growth rate of other brands
What went well in FY18
Power brands revamp across product quality through standardized sourcing and Vendor up-gradation, achieving sharper price points.
Lee Cooper : ‘Digital First’ approach to market Lee Cooper
aLL: aLL's debut ad campaign points out the 'plus points'
of being a plus size person - ‘What’s your Plus Point‘
Bangalore brands:
Improving the product quality through standardized sourcing and Vendor up-gradation
Increasing the share of full price sales by having a comprehensive pricing strategy and liquidate old inventory
Organizing trade fairs to show case the forthcoming season collection
Improved merchandise to hit the floor from AW18 season
Lee Cooper
Footwear Initiative: Introduction of LCO footwear, Launch of Ladies & Kids line
Pilot EBO Concept : Planned launch of 5-8 Stores covering major cities
Footwear Initiative: Introduction of LCO footwear, Launch of Ladies & Kids line
aLL
Targeting multifold growth in Online channel
Key Focus area for Next year

INVESTMENT PROPOSITION
Overview
A favourable shift in consumer preferences
Power brand – Lee Cooper
29
CategoryDenim and Casual wear – one of thefastest growing segment
Target CustomerYoung Men and Women who are relaxed, easy going yet strong and level headed
CompetitorsLevi’s, Pepe Jeans, Wrangler, Lee, Killer
DistributionSold through Central, Brand Factory, EBOs and is also available on leading ecommerce websites and third party Multi Brand Outlets
LC business has been carved out into a separate subsidiary of FLF in FY17 and 26 pc has been diluted
F L F – Key Brands
Avg. Price Point ( ` ):Lee Cooper Originals
1,500Lee Cooper
2,500
Original British Denim Brand having 100+ years of rich history with large international following. Licensed from Iconix BrandGroup, Lee Cooper is sold in over 100 countries
Revenue (in ` Cr)
420
Video tocome here

INVESTMENT PROPOSITION
A favourable shift in consumer preferences
Power brand – Lee Cooper Footwear
Opportunity
FY19 expected revenue ( ` Cr.):
~250*
F L F – Key Brands
Distributed through more than2,500 multi-branded stores.
High brand recall and higheracceptance of the brand formenswear.
Opportunity to expand the offeringto Women & Kids, since the brandis well accepted for apparelsacross.
CategoryCurrent offering is more classical / traditional. There is opportunity to bring in the latest in fashion with the best in technology.
Target CustomerYoung Men and Women who are relaxed, easy going yet strong and level headed. ‘Comfort’ and ‘Style’ go hand-in-hand in this category.
CompetitorsRed tape, Woodland, Hush Puppies
India MarketIndia is the 2nd largest producer of footwear globally, with ~95% of its produce meeting domestic demand. India is the 3rd largest footwear consuming country in the world after China and USA..
GrowthMen’s market is growing at a CAGR of 10 %. At present, men’s market contributes around 60 % of sales in the footwear segment as against women’s share of 30 per cent. Women’s segment, however, is growing at a much faster CAGR of 20 %.
* Revenue has been annualized, expected months of operation is ~6 months

INVESTMENT PROPOSITION
Overview
A favourable shift in consumer preferences
Power brand – aLL
CategoryDedicated plus-size clothing category for men and women including everything from westernto ethnic wear and accessories that make you look sexy, cool andconfident
Target CustomerPopulation of overweight crowd that feels judged by modern culture and people who typically find it difficult to find clothes that are right for their body shapes
CompetitorsOnly plus size brand of meaningful scale
DistributionSold through the Central network. Alsodistributed through EBOs and its online store. aLL was also featured at the Lakme FashionWeek
Avg. Price Point ( ` ):
1,200Revenue ( ` Cr.)
~130
Fashion for The Plus Size. aLL is the Largest Selling Plus Size Brand in the Country with PAN India retail presence. The plus size clothing category is pegged at ` 11,000 cr and is expected to double by 2020. It makes up 15% of the Indian apparel market.
F L F – Key Brands

INVESTMENT PROPOSITION
Overview
A favourable shift in consumer preferences
Key Investee brand– Cover Story
CategoryFast Fashion forwomen, which is one of thefastest growing fashionsegment, recently attracted internationalplayerssuch as Zara
Target Customer23 to 40 years, Independent woman with a rising disposable income, She thrives on social media. Switches effortlessly between Indian and western wear
CompetitorsH&M, ZARA
DistributionCentral and EBOs
F L F – Investee Brands
Avg. Price Point ( ` ):
1,800Stake (%)
90%
Super Trendy and affordableIndian Fast Fashion brand forWomen.Fills up the gap between high priced luxury brands and lowpriced unorganized brands between the price point ` 1,000 to ` 5,000

INVESTMENT PROPOSITION
Overview
A favourable shift in consumer preferences
Key Investee brand– Clarks
CategoryPremium boots, sandals andshoes
Target CustomerMen and women in the age group of 25 – 45yrs, Upwardly mobile
CompetitorsHush Puppies, Aldo, Charles & Keith, Geox & Woodland
DistributionSold through the Central network. Also available at EBOs, third party MBOs and ecommerce sites
DistributionLaunched at a Grand Fashion Show in 2011 as part of a JV between Future Group and C. & J. Clark International Ltd by CEO of ClarksMelissa Potter. Offers excellent expertise in the category to FLF
Avg. Price Point ( ` ):
4,500Sales (` Cr.)
~150Stake (%.)
50%
Expert shoemakers with 190 years of experience in makingfashionable shoes that are a pleasure to wear.Known as a brand thatresonates with reliability.
F L F – Investee Brands

INVESTMENT PROPOSITION
A favourable shift in consumer preferences
Women’s ethnic wear
34
Indian ethnic wear market
` 70,000 cr+
Expected CAGR next 5 years
9%
Organised market share
30%
Sup
er
pre
miu
mP
rem
ium
Val
ue/
Eco
nom
y
Traditional Fusion
Source: Technopak, Avendus Capital

INVESTMENT PROPOSITION
A favourable shift in consumer preferences
Women’s ethnic wear
35
FY18 Sales
Quantity sold
` 350 cr +
30 lacs +
` 100 cr +
20 lacs +
` 450 cr +
50 lacs +
Key initiatives journey of
Women’s Ethnic wear
Focus on full price sales in Morpankh
Focus on core – increased the width
to cater to categories like Dupatta,
Legwear etc.
Introduced a new category – ‘Core
Fashion’ for work wear
Introduced a dedicated brand for
Brand Factory – ‘Mohr’75%
FY16 FY18
Own
3rd party
30%
36%

INVESTMENT PROPOSITION
A favourable shift in consumer preferences
Investment in online space - Koovs
36
• The emerging “ASOS” of India – Koovs sells affordable western fashion online in India
• Designed in London, Made in India for Indians
• 3 key pillars: (1) Private Label; (2) Customer Experience & Engagement; (3) backed by strong management
Koovs – Business Overview
Business Customers Operations
• Affordable, Aspirational & Authentic Western
Fashion
• Western Fashion Authority & Credentials with
Private Label strategy - curated in London
(21% brand awareness)
• Focus on Customer Experience &
Engagement (2.4m followers on social
media & strong in-house content)
• Scalable technology platform, built for
mobile (80% of business on mobile)
• Experienced management team in fashion
and tech
• Caters to young women between age 18-30
(only western wear)
• Selling three categories – Good (up to rs999
– 50%), Better (up to rs1999 – 30%), Best
(rs1999 – 4999 – 20%)
• Established customer base of 500k active
users
• Private label accounts for about 40% of sales
• Blended margins at 46%
• Design and top management based in London
(15 staff)
• Remaining teams in Delhi (221 staff)
• Buying and Merchandising is done in India,
Warehouse and Distribution has been
outsourced
• Always connected via social media and lifestyle
content, driving 80% of Koovs’ transactions on
mobile. ~40% returning customers
INVESTMENT PROPOSITION
A favourable shift in consumer preferences
Investment in online space - Koovs
37
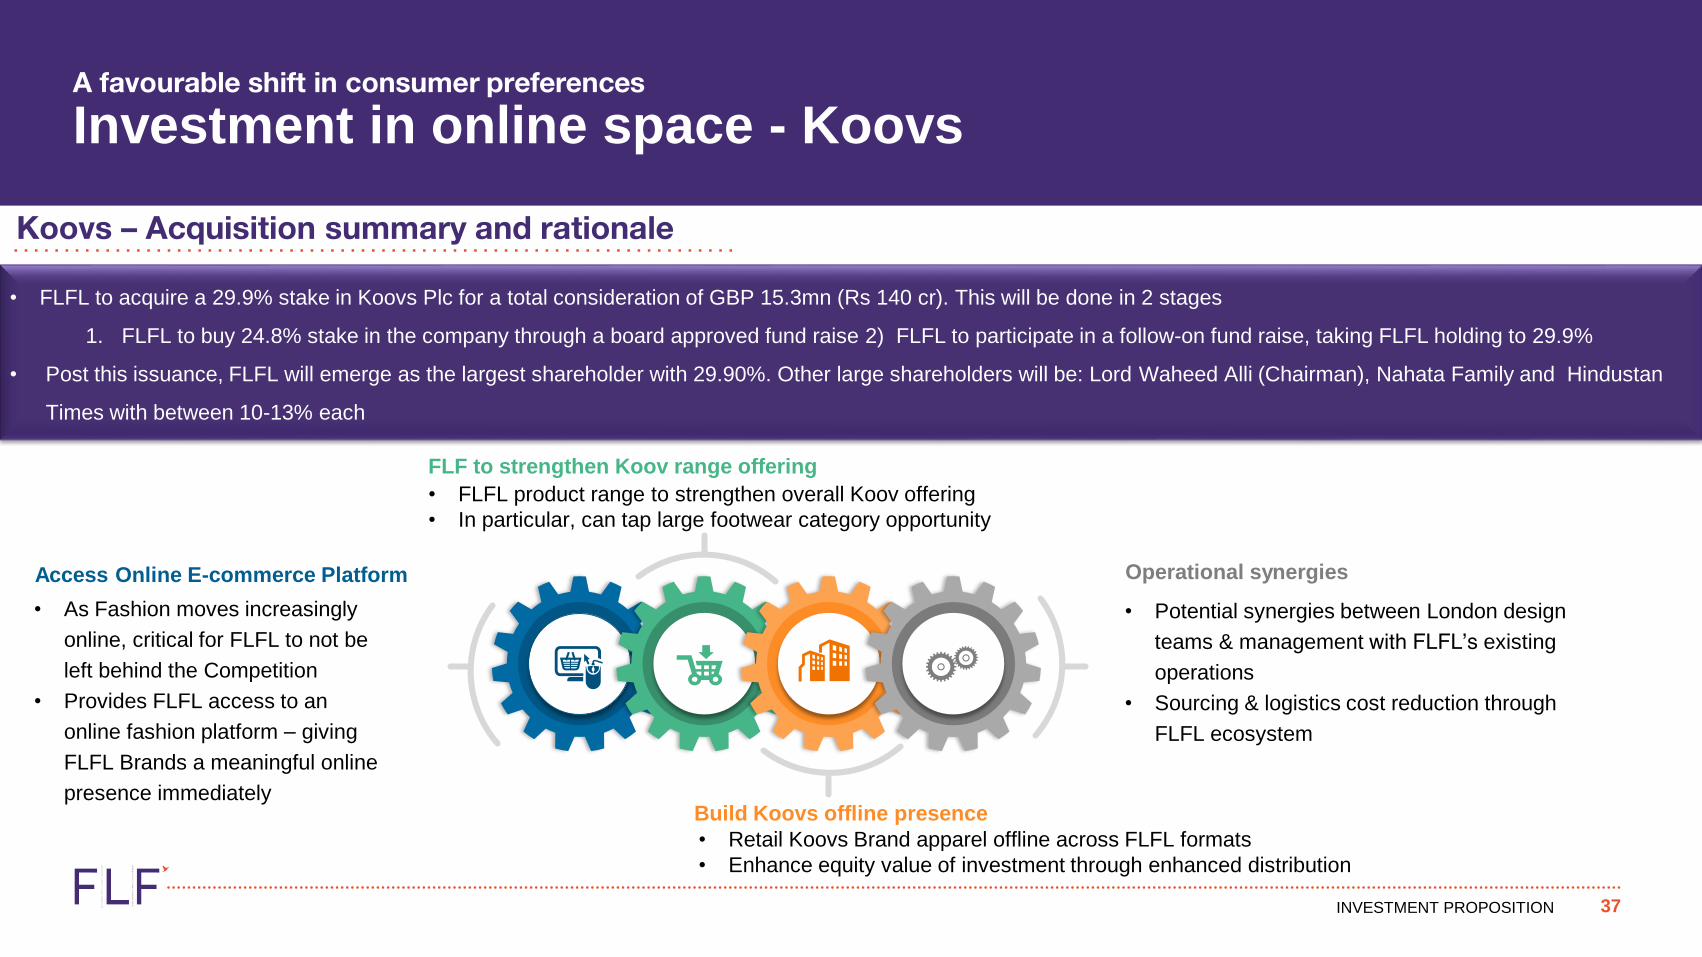
• FLFL to acquire a 29.9% stake in Koovs Plc for a total consideration of GBP 15.3mn (Rs 140 cr). This will be done in 2 stages
1. FLFL to buy 24.8% stake in the company through a board approved fund raise 2) FLFL to participate in a follow-on fund raise, taking FLFL holding to 29.9%
• Post this issuance, FLFL will emerge as the largest shareholder with 29.90%. Other large shareholders will be: Lord Waheed Alli (Chairman), Nahata Family and Hindustan
Times with between 10-13% each
Koovs – Acquisition summary and rationale
Access Online E-commerce Platform
• As Fashion moves increasingly
online, critical for FLFL to not be
left behind the Competition
• Provides FLFL access to an
online fashion platform – giving
FLFL Brands a meaningful online
presence immediately
FLF to strengthen Koov range offering
• FLFL product range to strengthen overall Koov offering
• In particular, can tap large footwear category opportunity
Build Koovs offline presence
• Retail Koovs Brand apparel offline across FLFL formats
• Enhance equity value of investment through enhanced distribution
Operational synergies
• Potential synergies between London design
teams & management with FLFL’s existing
operations
• Sourcing & logistics cost reduction through
FLFL ecosystem

INVESTMENT PROPOSITION
A Unique Business Model
38

INVESTMENT PROPOSITION
A unique business model
Integrated play is the way forward – THE FLF Advantage
FLF is best positioned to win, since it is one of the few apparel players with:
Strong own brands and a large retail channel to support it
Own brand sales comprising ~ 40% of total FLF revenues
Own channel comprising 70% of own brands
Brands Retail
39

INVESTMENT PROPOSITION
Developed markets saw the emergence of distinctbusiness models in fashion industry (i) Multi BrandPortfolios (ii) Specialty Retail
In emerging markets, this individualistic approach of focusing on either brands or retail has not worked
Pure-play retailers in India are facing price pressure from Ecommerce companies, leading to muted SSG growth for the last several quarters
Further, own store expansion for branded players is capital expensive and would lead to drag on ROCEs
Pure Play Brand Pure Play Retail
Retailers in India have consolidated now to big players (FLF, SS, Lifestyle)
Pure-play branded players without their own retail channel end up paying 35%-40% channel margins to large format retailers
A unique business model
Challenges of traditional, pure-play models
40

INVESTMENT PROPOSITION
A unique business model
Benefits of an integrated fashion play model
Better Brand ExperienceThrough better control of brand presence and display, customer experience is enhanced
Power of own distribution and brandsQuicker scale up of brands and better shopping experience
Cost and Scale EfficiencyThrough multiple cross-selling avenues, efficiency is bolstered
Higher ProfitabilityHigher EBITDA Margins than industry average
Enhanced Value CreationOwned channels and owned brands help in creating better business value
INVESTMENT PROPOSITION
Key Financials

INVESTMENT PROPOSITION
Company overview
Business Overview
43
• EBOs & Others• Online
An integrated fashion company deriving its strength from – fashion brands, fashion distribution and investment in fast growing fashion companies
FLF Brands(Revenue: ` 1,665 cr)
Portfolio includes ~30 brands, catering to men, women and kids
Strategic Investments (FY18 Revenues ~ ` 660 cr)1
Third Party Brands(Revenue: ` 2,833 cr)
• Third party brands are distributed to a wide distribution network of Central and Brand Factory
• Operates an overall distribution network of ~ 332 stores in 90 odd cities, spread ~ 5.7 million square feet
FY18 Revenue` 4,498 cr
1: As per latest filings, revenue figures are on unaudited basis & Strategic Investment revenues are not consolidated with Retail & Brand business Note: Store network as of 31st March 2018
INVESTMENT PROPOSITION
Investment Proposition
Snapshot – FY18
44
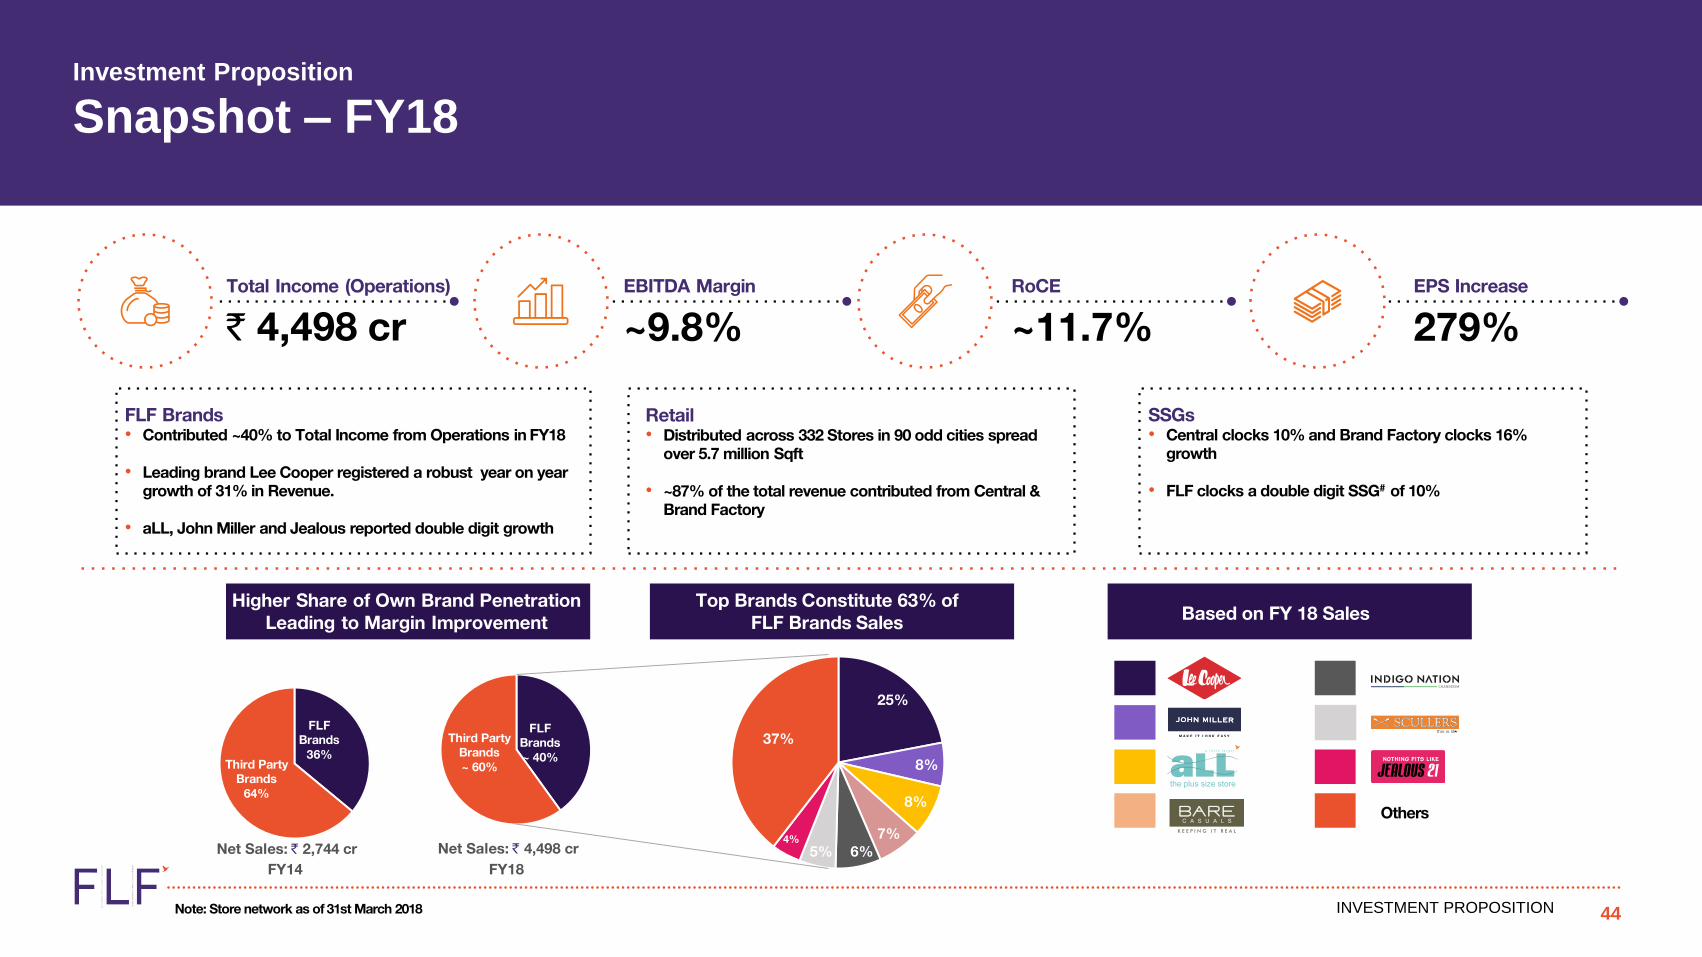
Total Income (Operations)
` 4,498 cr
Higher Share of Own Brand Penetration Leading to Margin Improvement
Top Brands Constitute 63% of FLF Brands Sales
25%
8%
8%
7%6%5%
4%
37%FLF
Brands36%
Third Party Brands
64%
FY14Net Sales: ̀ 2,744 cr
FLF Brands~ 40%
Third Party Brands~ 60%
FY18Net Sales: ̀ 4,498 cr
Based on FY 18 Sales
Others
FLF Brands• Contributed ~40% to Total Income from Operations in FY18
• Leading brand Lee Cooper registered a robust year on year growth of 31% in Revenue.
• aLL, John Miller and Jealous reported double digit growth
Retail• Distributed across 332 Stores in 90 odd cities spread
over 5.7 million Sqft
• ~87% of the total revenue contributed from Central & Brand Factory
SSGs• Central clocks 10% and Brand Factory clocks 16%
growth
• FLF clocks a double digit SSG# of 10%
EBITDA Margin
~9.8%RoCE
~11.7%EPS Increase
279%
Note: Store network as of 31st March 2018
INVESTMENT PROPOSITION
Investment Proposition
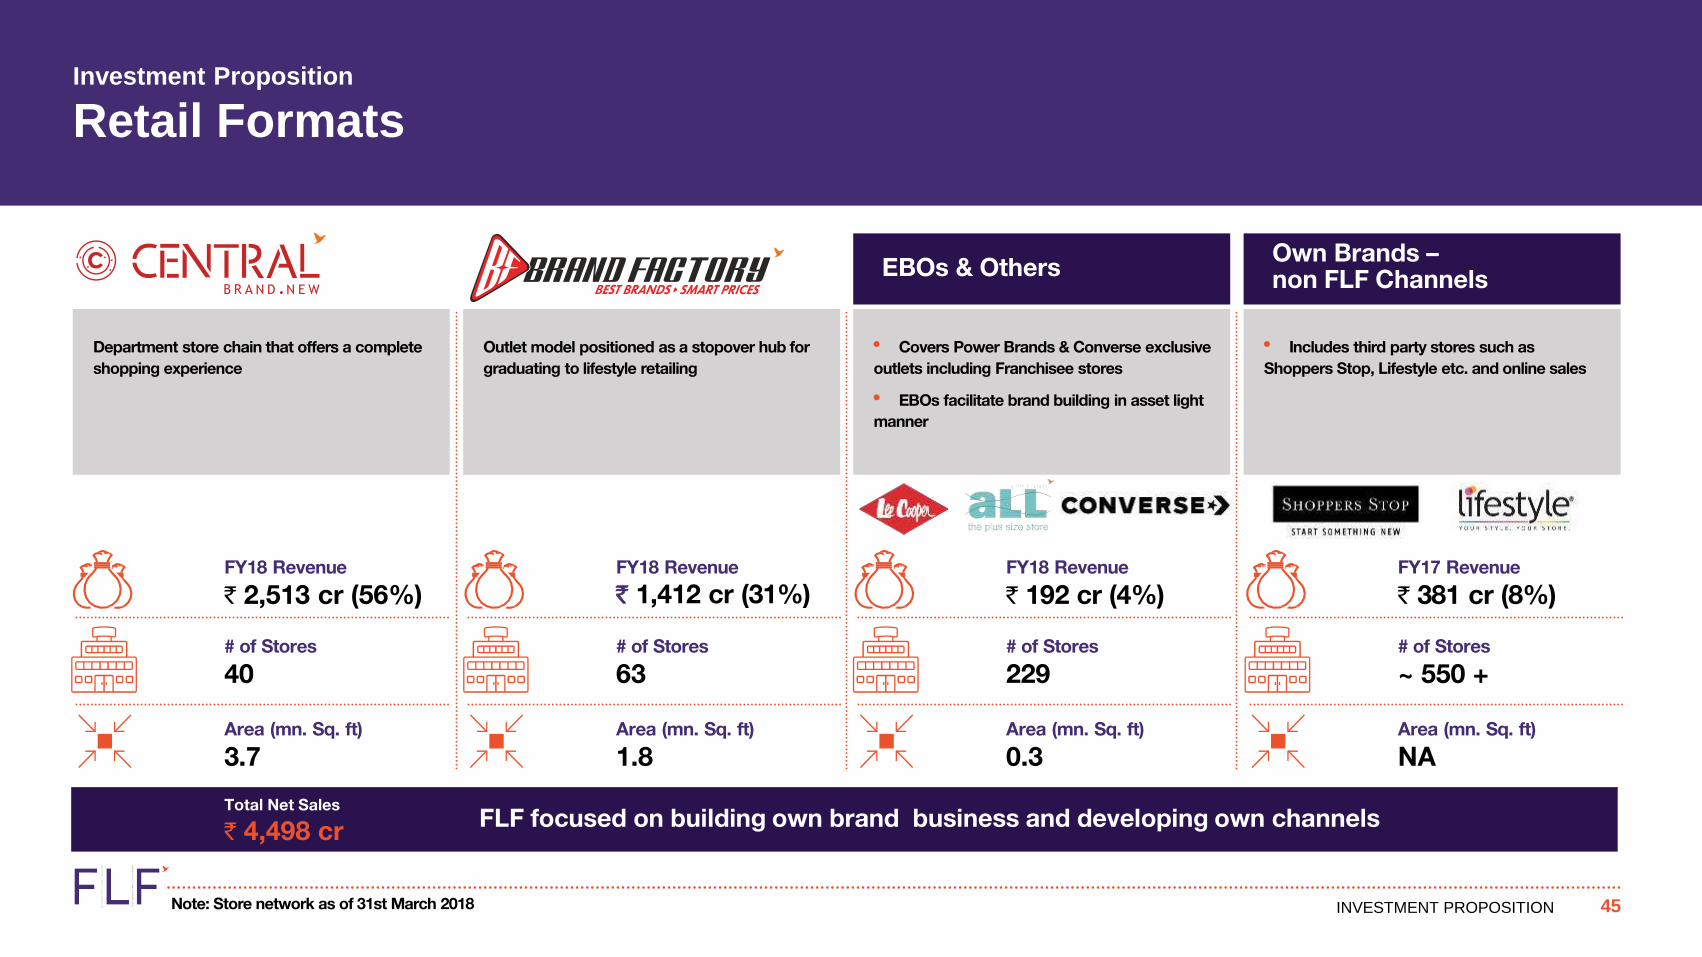
Retail Formats
45
• Includes third party stores such as Shoppers Stop, Lifestyle etc. and online sales
• Covers Power Brands & Converse exclusive outlets including Franchisee stores
• EBOs facilitate brand building in asset light manner
Outlet model positioned as a stopover hub for graduating to lifestyle retailing
Department store chain that offers a complete shopping experience
EBOs & Others Own Brands –non FLF Channels
FY18 Revenue
` 2,513 cr (56%)
# of Stores
40
Area (mn. Sq. ft)
3.7
FY18 Revenue
` 1,412 cr (31%)
# of Stores
63
Area (mn. Sq. ft)
1.8
FY18 Revenue
` 192 cr (4%)
# of Stores
229
Area (mn. Sq. ft)
0.3
FY17 Revenue
` 381 cr (8%)
# of Stores
~ 550 +
Area (mn. Sq. ft)
NA
FLF focused on building own brand business and developing own channelsTotal Net Sales
` 4,498 cr
Note: Store network as of 31st March 2018

INVESTMENT PROPOSITION
Key Deliverables
Note: all figures are based on Consolidated financial statement .Revenue growth % for FY18 is not comparable due to tax rate difference
FY17 FY18 Indicative trajectory
SSG%#
Revenue
Growth %
17.7% 12.0%
ROCE%
Debt/
EBITDA
Sustain close to
double digit SSG
17.5% 19.3% 15-17% CAGR
7.8% 11.7%Expand by 400-500 bps
over 3 years
1.8 1.6 Around 2 times of EBITDA
Margin % 9.4% 9.8%Expand by 50-80 bps
over 3 years

INVESTMENT PROPOSITION
Financial Performance vs Peer
SSG# (YoY%)
Central Competitor1
1
10
5
31
20
21
-4
1
-7
20
-1
6
Q4FY18
Q3FY18
Q2FY18
Q1FY18
Q4FY17
Q3FY17
Revenue (YoY%)
FLF Competitor1
19
10
10
35
16
22
-2
-5
-12
21
2
11
Q4FY18
Q3FY18
Q2FY18
Q1FY18
Q4FY17
Q3FY17
Gross Margin (%)
FLF Competitor1
39
37
36
37
37
36
38
39
40
36
37
37
Q4FY18
Q3FY18
Q2FY18
Q1FY18
Q4FY17
Q3FY17
EBITDA Margin (%)
FLF Competitor1
9
10
10
10
10
9
6
9
7
4
6
8
Q4FY18
Q3FY18
Q2FY18
Q1FY18
Q4FY17
Q3FY17
# FLF SSG% is Central + Brand Factory SSG

INVESTMENT PROPOSITION
Financial Overview – FY 18
Income Statement (` cr.) Twelve Months ended
Particulars FY17 FY18
Balance Sheet (` cr.) As of
Particulars 31-Mar-17 31-Mar-18
NetSales 3,800 4,408
Other Operating Income 77 90
TotalIncomefromOperations 3,884 4,498
Gross Profit 1,432 1,651
Gross Margin% 36.9% 36.7%
TotalExpenditure 1,074 1,243
EBITDA 364 443
EBITDA % 9.4% 9.8%
Net Profit 45 127
• Investment Grade Credit Rating of CARE "AA-, stable” and of Crisil “AA-, with positive outlook”
• Consistent margin delivery and SSG growth#
• Positive FCF achieved
• First Listed Brand and Retail Fashion company to reach double digit ROCE%
• Successfully completed IND AS compliance, implementation supported by Deloitte
• GST Roll out completed successfully
48
Shareholders’Funds 1,383 1,530
NetDebt 652 690
Less:CurrentInvestments 41 42
Net Adjusted Capital Employed 1,994 2,177
NetNon-CurrentAssets 1,383 1,558
NetCurrentAssets 511 619
Net Adjusted Capital Employed 1,994 2,177
Note: all figures are based on IND AS Consolidated financial statement except FY17 income statement. For ease of reference and comparability FLFL has disclosed here above, figures of previous year under IND GAAP, which are comparable with the numbers of current year. # FLF SSG% is Central + Brand Factory SSG

INVESTMENT PROPOSITION
Stakeholder Value Creation
49
Underlined by a unique business model
MAXIMISING STAKEHOLDER VALUE
Good Revenue Growth
Lower Debt
15-17 %CAGR
Better ROCE
Expand by 400-500 bps over 3 years
around 2 times of EBITDA
Sustainable SSG%
Close to double digit
Brands Retail
FLF has time and again proved itself in the bourses with the stock prices ramping up. Compared to the benchmark indices of both the BSE and NSE, the growth of FLF stock has been exceptional
Stellar Shareholder Returns
Top Institutional Holders*
Institutions OS %
L Catterton 8.2
Premji Invest 7.3
L&T MF 4.1
Timf Holdings 2.7
HSBC Global Investment Funds 1.3
* Shareholding as on 1st June 2018
Share Holding Pattern*
Promoter 54.6
Institutional Holders 29.4
Non -Institutional Holders 15.9
+300%
+100%
0%
INVESTMENT PROPOSITION
Behind It All –Visionary Leadership

INVESTMENT PROPOSITION
Board of Directors
51
Is the founder and group CEO of Future Group and is widelyrecognised among the pioneer of modern retail in India. He hasled the Future Group’s emergence as among the leadingconsumer goods organisation in the fashion, food and personalcare space.
Is a Fellow CA and the Chairman of Haribhakti & Co. LLP. With overdecades of hands-on professional involvement, he now serves on theboard of large multinational and Indian companies and chairsmultiple audit committees. He also lends his expertise to severalprofessional and regulatory bodies. He is currently Chairman &Trustee of the NPS Trust and Member of Pension AdvisoryCommittee of Pension Fund Regulatory & Development Authority.
Shailesh HaribhaktiChairman
Kishore BiyaniManaging Director
Is a Doctorate in Management from IIT Delhi. He was founder facultymember at NIFT from 1987 to 2000 and was Director of NationalInstitute of Design from 2000 to 2009. He had developed the “NationalDesign Policy” which was approved by Govt. of India in 2007. He alsoserved the Executive Board of World Body of Design (ICSID) for 3terms. He currently serves as Director General and CEO of Appareland Training & Design Centre, since 2009 which have a network of200 institutes across country.
Dr. Darlie O KoshyNon-Executive Independent Director
Is a consumer industry veteran having been involved with the launchof iconic brands such as Titan, Fastrack and Tanishq. He started hiscareer with Hindustan Unilever and was till recently associated asCEO of Reliance Lifestyle.
Bijou KurienNon-Executive Independent Director
Has been associated with the Future Group for over 25years leading strategic planning and finance functionsacross group entities. He is also the recipient of the BestCFO Award 2011 in the services sector by ICAI.
C.P ToshniwalNon-ExecutiveDirector
Sharda AgarwalNon-ExecutiveIndependent Director
Is a noted marketing and brand expert with over two decadesof experience in various industries and sectors. She was theco-founder of MarketGate Consulting and has served asDirector of Marketing at Coca Cola India and was alsoassociated with Johnson & Johnson in India and the UnitedStates. She is currently co-founder of Sepalika - a website thatpartners people to reverse chronic disease.
Part of the founding team at Future Group and has ledthe fashion business of the group through his stronghands-on expertise in operations management, supplychain and technology.
Rakesh BiyaniNon-ExecutiveDirector
Brings on board the pulse of India’s millennialgeneration and has been closely involved with theconceptualisation and launch of brands such asCoverStory. She is the founder and concept head ofIndia’s pre-eminent gourmet chain, Foodhall.
Avni BiyaniNon-ExecutiveDirector
Mr Ravi Thakran has been working in various leadingpositions at the Louis Vuitton Moët Hennessey Group(LVMH) since 2001 and has been the Group Chairmanof LVMH South & Southeast Asia, Australia andMiddle East since September 2007.Prior to his time at LVMH, he held senior managementpositions at the Swatch Group, Nike & the Tata Group
Ravi ThakranNon-ExecutiveDirector

INVESTMENT PROPOSITION
Management Team
Over 30 years of sales and retail experience. Joined FutureGroup in 2001 to set up the Big Bazaar stores in the southbefore moving on to head the Central business.
Comes with an experience of over 15 years in the Food &Fashion industry. Previously worked with MondelezInternational, Aditya Birla Nuvo & TVS Motors. A qualifiedChartered Accountant from ICAI & Masters of BusinessAdministration (Finance), Singapore.
Over 17 years of experience across branded apparel andretail. Past experience includes Brand Director and ChiefOperating Officer, Color Plus and Park Avenue at RaymondLimited.
Heads the People Office for FLF with 23 years of variedexperience in organizations like Sterling Holidays, ReliancePetroleum, Reliance Infocom, MTS Group.
20 years of rich retail experience. Heading Brand Factorysince 2014 since then the format has doubled its turnoverand added more than 20 new stores across India.
Corporate experience of over 16 years in the Secretarial andLegal functions and handled various corporate actions.Previously worked with Mather & Platt, Mahindra andMahindra and CMI FPE. A qualified Company Secretary fromICSI.
Over 22 years experience in the fashion & lifestyle industry.Launched and developed a range of high street brands likeEsprit, Benetton bringing significant knowledge of Indiancustomers. Heads Future Style Lab looking after CoverStory
Vishnu PrasadCEO-FLF
Kaleeswaran ArunachalamCFO - FLF
Hetal KotakHead – Lee Cooper & aLL
Venkatesh RajaHuman Resources
Suresh SadhwaniHead – Brand Factory
Manjula TiwariHead – Cover Story
Sanjay MuthaCompany Secretary
52
INVESTMENT PROPOSITION
The Road Ahead

INVESTMENT PROPOSITION
Growth strategy
Central Brand Factory
Good revenue growth with sustainable margins
Brands
Sustain efficiency Category expansion Increase assortment & merchandise
Network expansion Brand Expansion
Geographic expansion
Improve distribution
Optimise price points
1 2 3

INVESTMENT PROPOSITION
The Road Ahead
The Way Forward to maximise stakeholder value
Indicative Top line Growth / Margin Expansion
FY18 FY18
FY21 FY21 FY21
FY18 9.8% 12%
Targeted Revenue Trajectory
Growth of 15%-17% FY20
EBITDA Margin Expansion Potential Resultant ROCE Improvement
X =
Potential EBITDA margin Potential for ROCEexpansion of around 50-80 bps on the back of,
expansion of 400-500 bps over next 3 years drivenby,
• Premiumization of the Portfolio • Top line growth• Increasing own brand penetration • Higher share of own brand• Supply chain optimization • Margin expansion
4,498
40%
55

INVESTMENT PROPOSITION
Top 5 reasons toinvest in FLF
INVESTMENT PROPOSITION
The Road Ahead
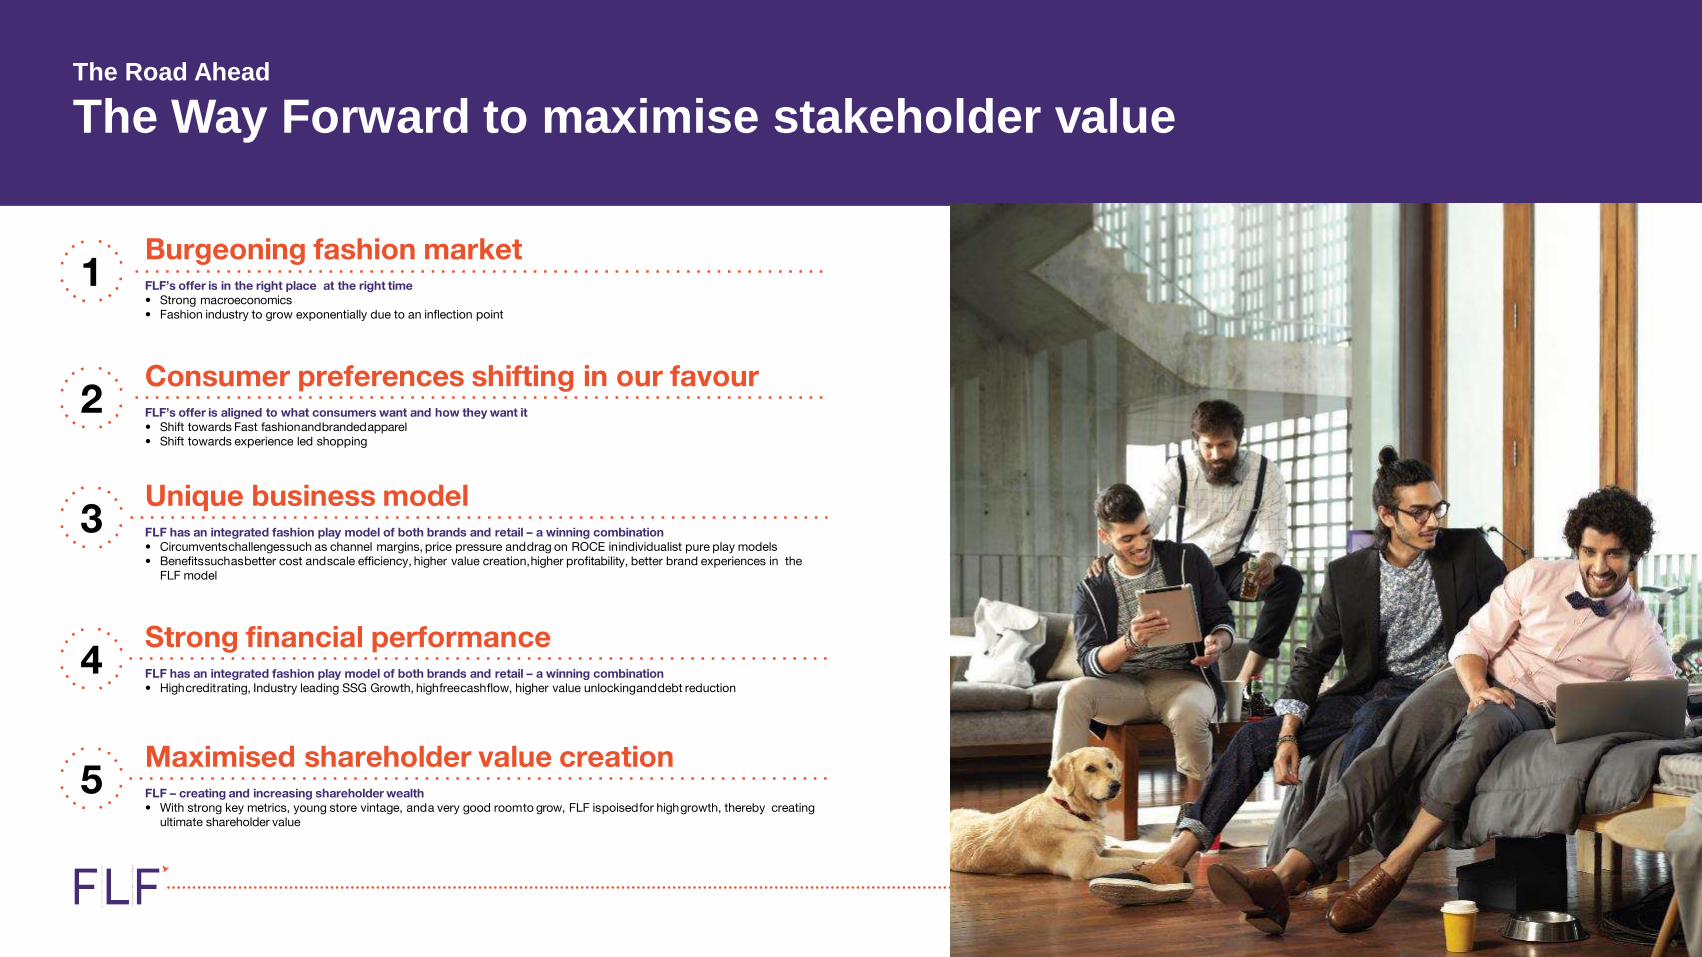
The Way Forward to maximise stakeholder value
Burgeoning fashion marketFLF’s offer is in the right place at the right time• Strong macroeconomics• Fashion industry to grow exponentially due to an inflection point
1
Consumer preferences shifting in our favourFLF’s offer is aligned to what consumers want and how they want it• Shift towards Fast fashionandbrandedapparel• Shift towards experience led shopping
2
Unique business modelFLF has an integrated fashion play model of both brands and retail – a winning combination• Circumventschallengessuch as channel margins, price pressure anddrag on ROCE inindividualist pure play models• Benefitssuchasbetter cost andscale efficiency, higher value creation,higher profitability, better brand experiences in the
FLF model
3
Strong financial performanceFLF has an integrated fashion play model of both brands and retail – a winning combination• Highcreditrating, Industry leading SSG Growth, highfreecashflow, higher value unlockinganddebt reduction
4
Maximised shareholder value creationFLF – creating and increasing shareholder wealth• With strong key metrics, young store vintage, anda very good roomto grow, FLF ispoisedfor highgrowth, thereby creating
ultimate shareholder value
5

Good to Know
INVESTMENT PROPOSITION
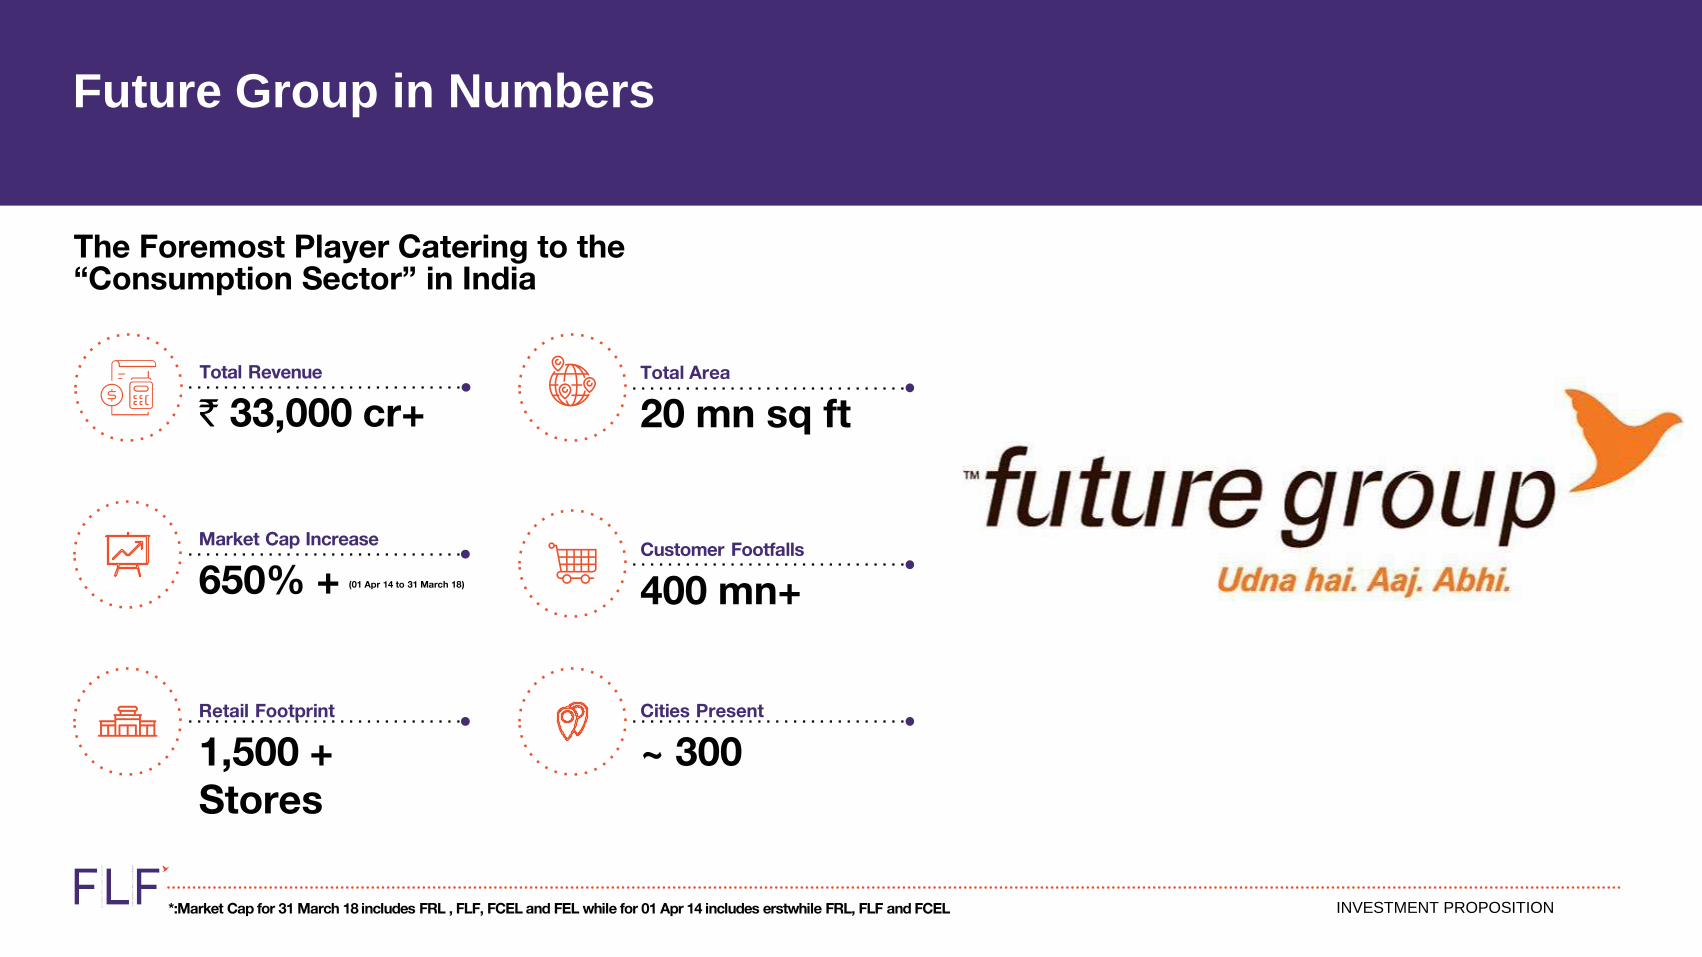
Future Group in Numbers
*:Market Cap for 31 March 18 includes FRL , FLF, FCEL and FEL while for 01 Apr 14 includes erstwhile FRL, FLF and FCEL
The Foremost Player Catering to the “Consumption Sector” in India
Cities Present
~ 300
Customer Footfalls
400 mn+
Total Area
20 mn sq ft
Retail Footprint
1,500 + Stores
(01 Apr 14 to 31 March 18)
Market Cap Increase
650% +
Total Revenue
` 33,000 cr+
INVESTMENT PROPOSITION
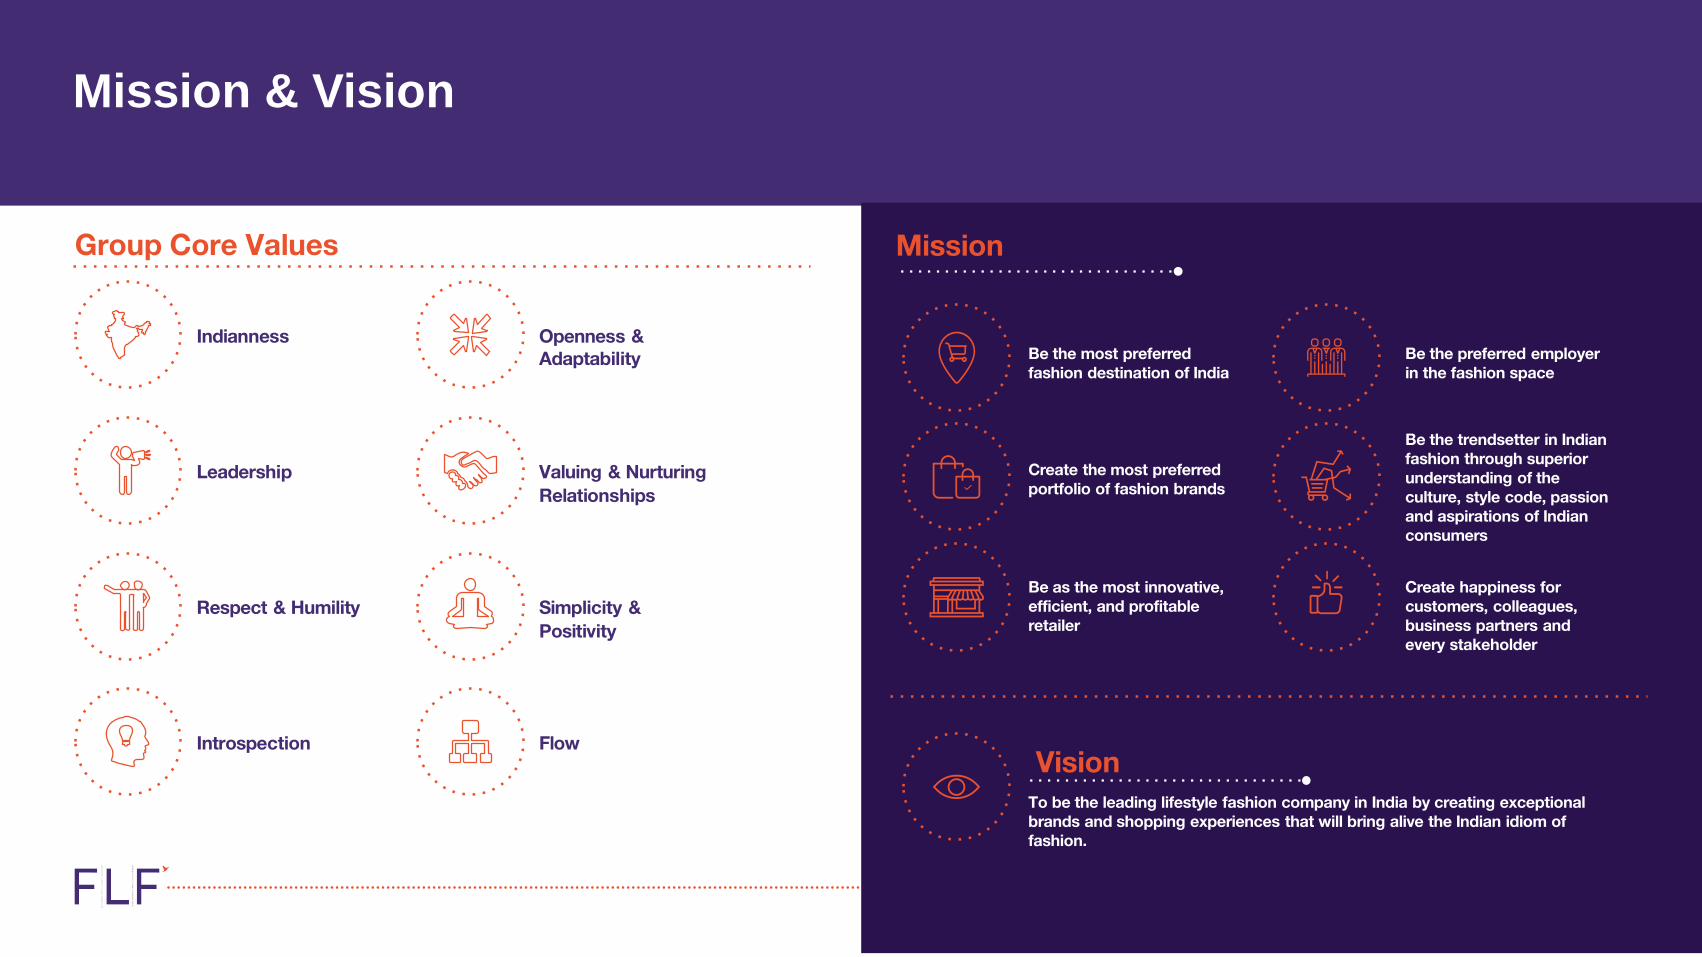
Mission & Vision
Group Core Values
Indianness
Leadership
Respect & Humility
Introspection
Openness & Adaptability
Valuing & NurturingRelationships
Simplicity &Positivity
Flow
Mission
To be the leading lifestyle fashion company in India by creating exceptional brands and shopping experiences that will bring alive the Indian idiom of fashion.
Vision
Be the most preferred fashion destination of India
Create the most preferred portfolio of fashion brands
Be as the most innovative, efficient, and profitable retailer
Be the preferred employer in the fashion space
Be the trendsetter in Indian fashion through superior understanding of the culture, style code, passion and aspirations of Indian consumers
Create happiness for customers, colleagues, business partners and every stakeholder
INVESTMENT PROPOSITION
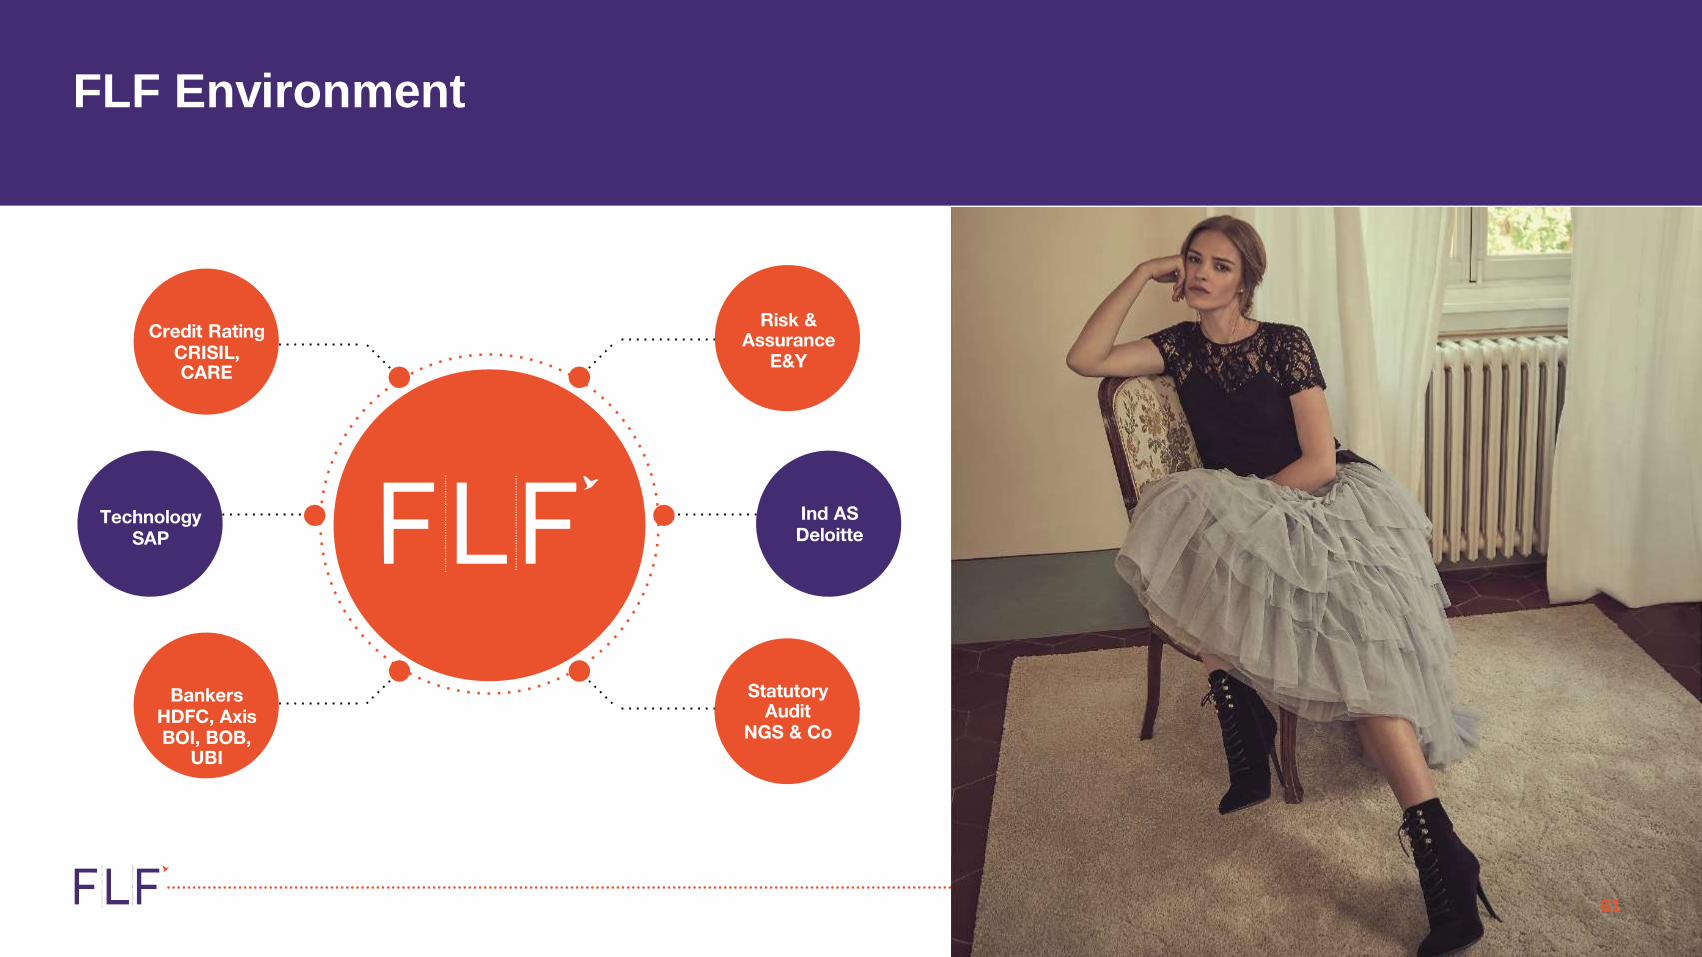
FLF Environment
61
Statutory Audit
NGS & Co
Risk & Assurance
E&Y
Credit RatingCRISIL, CARE
BankersHDFC, AxisBOI, BOB,
UBI
TechnologySAP
Ind ASDeloitte

INVESTMENT PROPOSITION
Young store vintage and vast Company store network
Indicative Graphical representation of store journey
Central Y1-Y2 Y3-Y4 Y4-Y5 Y6 Onwards
Store Maturity Cycle Cash Break Even Scale up Pay BackMatured & High
ROCE
Brand Factory Y1 Y2-Y3 Y4 Y5 onwards
Store Maturity Cycle Cash Break Even Scale up Pay BackMatured & High
ROCE
Central 40Brand Factory 63EBOs 229Total 332Area (Mn sqft.) 5.7
Store count
Brand Factory
EBO’s
Central
*Store Network as on 31st March 2018
Age of Store Central Brand Factory EBOs Total
Greater than 5 Yrs 14 11 82 107
3-5 Yrs 9 19 63 91
Less than 2 Yrs 17 33 84 134
Total Store Count 40 63 229 332
Less than 5 YrsMix %
65% 83% 64% 68%
INVESTMENT PROPOSITION
Awards & Recognition
63
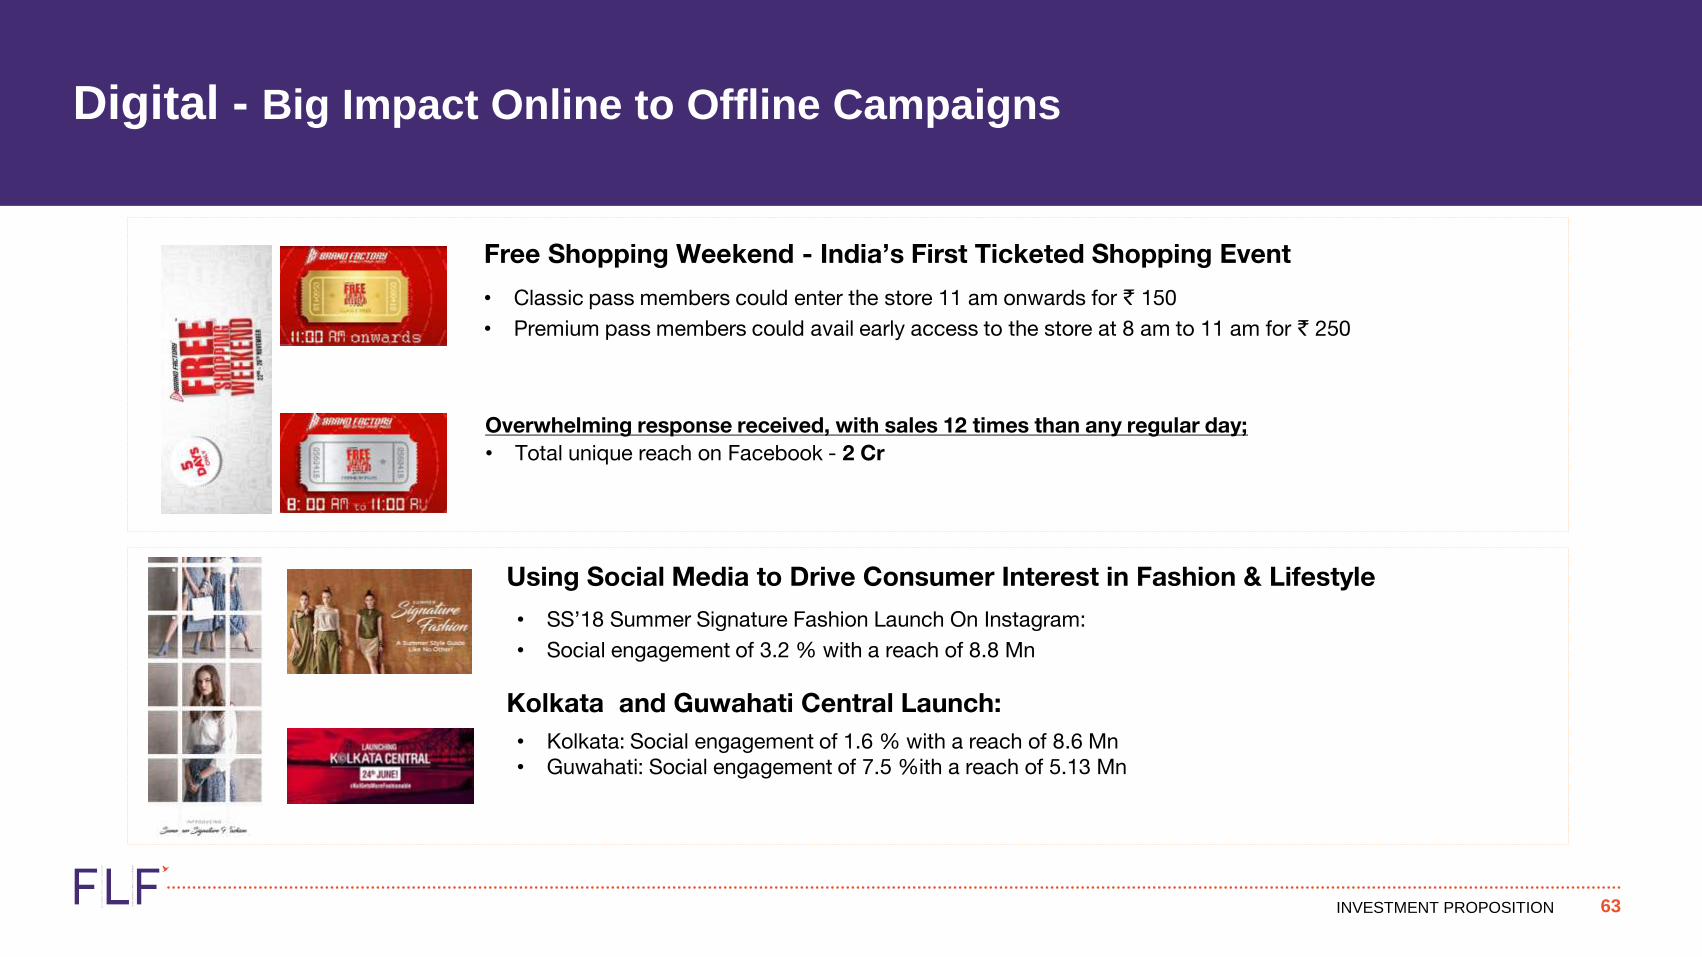
Digital - Big Impact Online to Offline Campaigns
Free Shopping Weekend - India’s First Ticketed Shopping Event
• Classic pass members could enter the store 11 am onwards for ` 150• Premium pass members could avail early access to the store at 8 am to 11 am for ` 250
Overwhelming response received, with sales 12 times than any regular day;• Total unique reach on Facebook - 2 Cr
Using Social Media to Drive Consumer Interest in Fashion & Lifestyle
• SS’18 Summer Signature Fashion Launch On Instagram:• Social engagement of 3.2 % with a reach of 8.8 Mn
Kolkata and Guwahati Central Launch: • Kolkata: Social engagement of 1.6 % with a reach of 8.6 Mn• Guwahati: Social engagement of 7.5 %ith a reach of 5.13 Mn
INVESTMENT PROPOSITION
Awards & Recognition
64
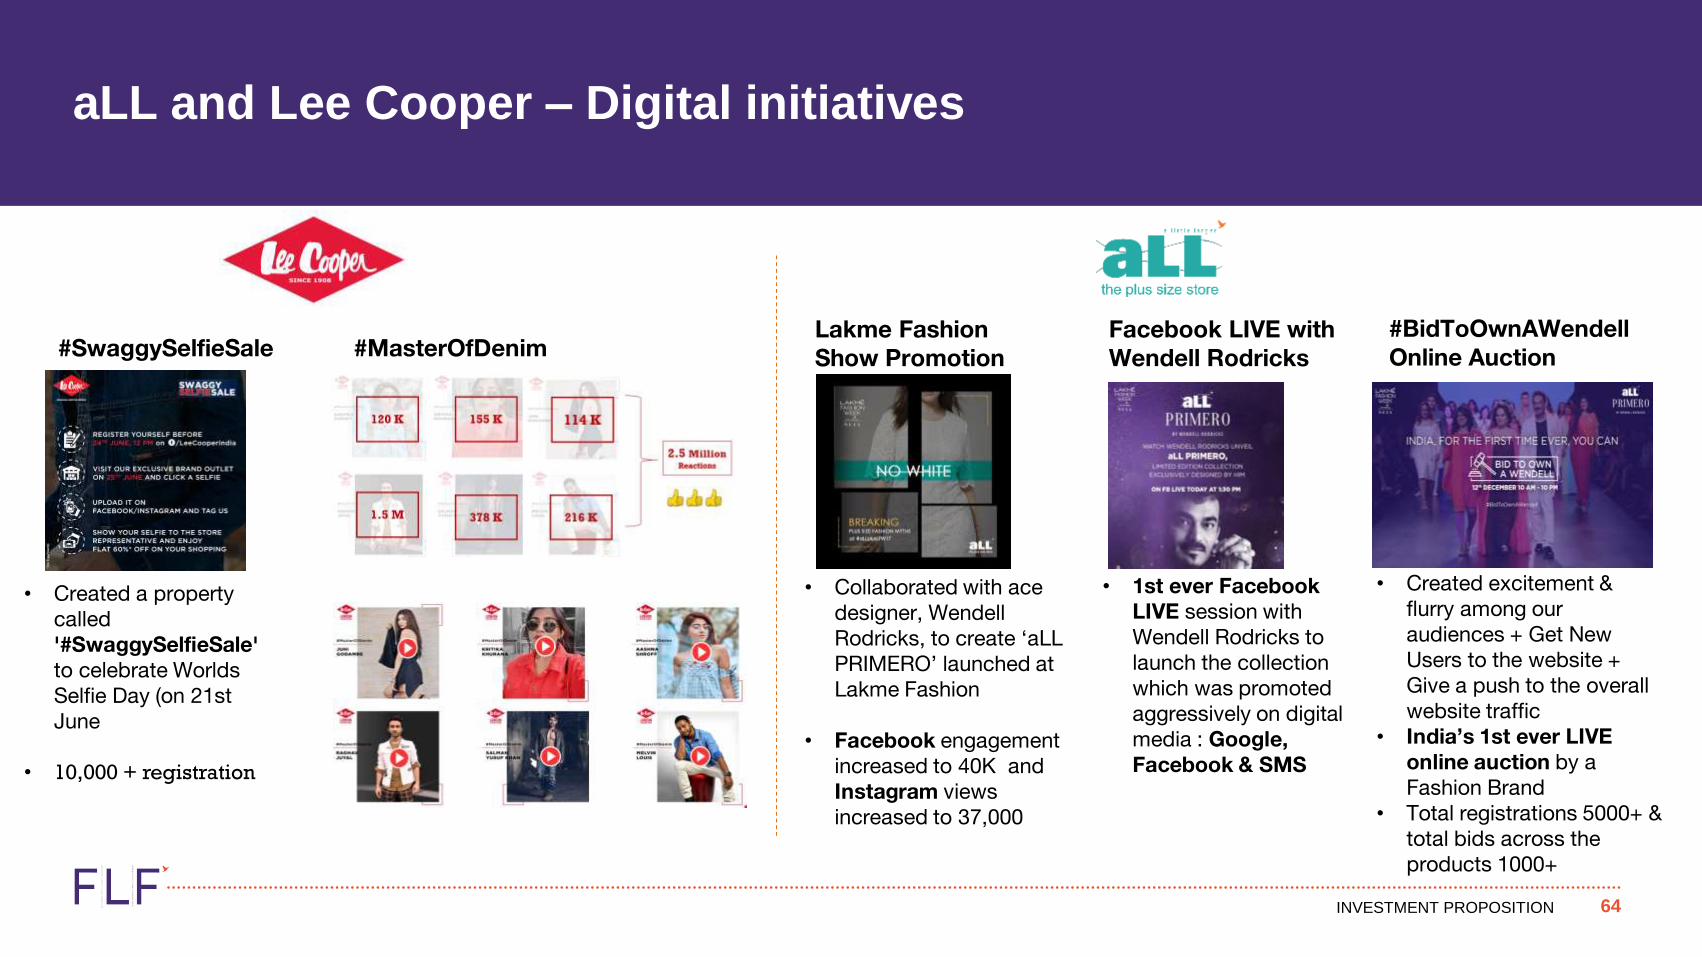
aLL and Lee Cooper – Digital initiatives
#SwaggySelfieSale
• Created a property called '#SwaggySelfieSale' to celebrate Worlds Selfie Day (on 21st June
• 10,000 + registration
#MasterOfDenimLakme Fashion Show Promotion
• Collaborated with ace designer, Wendell Rodricks, to create ‘aLLPRIMERO’ launched at Lakme Fashion
• Facebook engagement increased to 40K and Instagram views increased to 37,000
Facebook LIVE with Wendell Rodricks
• 1st ever Facebook LIVE session with Wendell Rodricks to launch the collection which was promoted aggressively on digital media : Google, Facebook & SMS
#BidToOwnAWendellOnline Auction
• Created excitement & flurry among our audiences + Get New Users to the website + Give a push to the overall website traffic
• India’s 1st ever LIVE online auction by a Fashion Brand
• Total registrations 5000+ & total bids across the products 1000+

INVESTMENT PROPOSITION
Awards & Recognition
65
Retail and Brands Digital Footprint 3+ Mn

INVESTMENT PROPOSITION
Typical Fashion Season
Concept to ConsumptionDesign to Consumer – 12 to 14 months cycle
DESIGN / MERCHAN-
DISING
T
T+1 MonthsT+12to 14 Months
T+3 MonthsT+8 Months
T+7 Months
SELECTION / FINALIZATION
END OF SEASON
RECEIPT OF SUPPLIES
ORDERING/SOURCING
RETAIL LAUNCH
Indicative Inventory Overview
Inventory =~` 1,480 cr
Third Party - SoR~ (60%)Backed by equivalent Payables
Full-year, core and non seasonal offerings
Less than 1/3rd of the overall inventory is seasonal and non core
OwnBrands~(40%)
Core~(12%)
Fashion~(28%)

INVESTMENT PROPOSITION
Technological Architecture
INFORMATION TECHNOLOGY
INFRA
OPERATIONSPOS SYSTEM
ASSORTMENT PLANNINGPEOPLE
BI/ANALYTICS
FINANCIALSENTERPRISE PERFORMANCE MANAGEMENT SOFTWARE
LOYALTY/ CFS/CRM
WAREHOUSE MANAGEMENT
• Sanchayan
• Sampradan
• AnushasanPurti
• Shoppers
• TPLinux
• Dunnhumby
• TXT
• PRIDE
• BookMItraining
• Manthan
• Dunnhumby
• SAP
• Vistex
• Payback• SAP
• WMS
• Infor-warehouse
67

INVESTMENT PROPOSITION
Key Performance Highlights
68
3,134
3,300
3,877
4,498FY18
FY16
FY15
FY17
Revenue (in ₹ Crore)
338
331
364
443
EBITDA (in ₹ Crore)
19
29
46
127
PAT (in ₹ Crore)
EPS (in ₹ )
7
7
8
12
ROCE (%)
20
20
40
60
Dividend Payout (%)
3.5
3.4
1.8
1.6
Net Debt / EBITDA
1,185
1,126
653
690
Net Debt (in ₹ Crore)
70
68
52
56
NWC Days
1.1
1.6
2.4
6.6FY18
FY16
FY15
FY17
FY18
FY16
FY15
FY17
FY18
FY16
FY15
FY17
FY18
FY16
FY15
FY17
FY18
FY16
FY15
FY17
FY18
FY16
FY15
FY17
FY18
FY16
FY15
FY17
FY18
FY16
FY15
FY17

INVESTMENT PROPOSITION
Key Accounting Policies
69
Revenue Recognition• Revenue is recognized basis the economic benefits that will flow to the Company and that can be reliably measured.
• Revenue from sale of products is recognized when the significant risks and rewards of ownership of the goods have been passed to the buyers.
• Sale of goods are recorded at net of trade discounts, rebates and taxes
• Revenue from services are recognized as they are rendered based on agreements/arrangements with the concerned parties and recognized net of taxes.
Fixed Assets & Depreciation• FLFL opens its stores on leased premises and invest in fixed assets like electrical equipment, furniture & fittings. lease hold improvements etc.,
• Company depreciates its Fixed Assets over the useful life of the assets and in case of store related assets depreciation is charged basis useful life of assets or renovation period which ever is earlier.
Inventory
• Being the brand and retail player – FLFL revenue for about 60% of its business is through third party brands. Inventory for these third party brands are in FLFL Books and equally backed by creditors hence no impact on working capital. General commercial terms for these third party brands are largely on sale or return basis.
• About 40% of FLFL revenue comes from own brands for which inventory is also owned by FLFL
• The company provides for shrinkage, aged/Damaged & Dead inventory on a periodic basis using historical rate of sales.

INVESTMENT PROPOSITION
Ind AS adjustment
70
Key impact of Ind AS adjustments
• Employee stock option cost at fair value
• Under the previous GAAP, the cost of equity-settled employee share-based plan were recognized using the intrinsic value method. Under Ind AS, the cost of equity settled share-based plan is recognized based on the fair value of the options as at the grant date
• Fair valuation of property, plant and equipment
• In accordance with Ind AS 101, the Company has elected to measure certain items of Property, plant and equipment (PPE) at fair value as at transition date of April 01, 2016. These fair values are considered as deemed cost. All other assets are measured as per Ind AS 16. Depreciation is calculated on deemed cost effective from transition date
• Actuarial gain or loss on defined benefit obligation under OCI
• Under Ind AS, actuarial gains and losses on re-measurements of defined benefit obligation are recognized in Other Comprehensive Income instead of Statement of Profit and Loss. Consequential tax impact is also recognised in other comprehensive income
• Discounting of interest free rent deposit
• Under the previous GAAP, interest free lease security deposits are recorded at their transaction value. Under Ind AS, all financial assets are required to be recognized at fair value on initial recognition. Accordingly, the company has measured these deposits at fair value as at initial recognition. Difference between the fair value and transaction value of the security deposit has been recognized as prepaid rent as at initial recognition. Subsequently, security deposit is measured at amortized by recognizing interest income and prepaid rent is amortized as rent expenses
• Measurement of borrowing at amortized cost
• Under previous GAAP, interest expense was recognized based on contractual rate and expenses directly attributable for fund raising has been charged off in statement of Profit and Loss when incurred. Under Ind AS, effective interest rate method is used to recognize interest expenses and for calculation of amortized cost of borrowing

INVESTMENT PROPOSITION
Ind AS adjustment
71
Key impact of Ind AS adjustments• Employee stock option cost at fair value
• Fair valuation of property, plant and equipment
• Actuarial gain or loss on defined benefit obligation under OCI
• Discounting of interest free rent deposit
• Measurement of borrowing at amortized cost
FY17 P&L bridge with Ind AS
76
3 31
89
45
13222
FY17 reportedPAT GAAP
Depreciation Other adjustment Discounting ofinterest free rent
deposits
Loss of previouslyunconsolidatedAssociates andJoint Ventures
Effect of deferredtax on Ind ASadjustments
FY17 under Ind AS
Particulars 2016-2017
Profit after tax as reported under previous GAAP 45
Add/(Less): Impact of Ind AS adjustments
Impact on depreciation expenses 132
Recognition of Finance Cost on Liability portion of
compound financial instrument(2)
Discounting of interest free rent deposits (3)
Actuarial gains/ losses on defined benefit obligation
(net of tax)(0)
Measurement of derivative at fair value 1
Income recognition on Financial Guarantee 1
Loss of previously unconsolidated Associates and
Joint Ventures(31)
Other adjustments 23
Effect of deferred tax on Ind AS adjustments (89)
Profit or loss under Ind AS 76
Other comprehensive income under Ind AS, net of
tax0
Total comprehensive income under Ind AS 76
(+) (+) (-) (-) (-)

Thank you
Registered and Corporate Office:Future Lifestyle Fashions Ltd
Knowledge House, Shyam Nagar, Off Jogeshwari - Vikhroli Link Road, Jogeshwari (East), Mumbai 400 060
+91 22 30842336www.futurelifestyle.in [email protected]
Contact Detail:Kaleeswaran Arunachalam
Chief Financial [email protected]


