
1
TITLE: 1
Mitochondrial DNA content and methylation in fetal cord blood of pregnancies with placental 2
insufficiency 3
4
AUTHOR NAMES AND AFFILIATIONS: 5
Chiara NOVIELLIa; Chiara MANDÒa; Silvia TABANOb; Gaia M. ANELLIa; Laura FONTANAb; 6
Patrizio ANTONAZZOc; Monica MIOZZOb; Irene CETINa,c. 7
8
a: ‘‘L. Sacco’’ Department of Biomedical and Clinical Sciences, Laboratory of maternal-fetal 9
translational research “Giorgio Pardi”, Università degli Studi di Milano, via G.B. Grassi 74, 20157 10
Milano, Italy 11
b: Department of Pathophysiology and Transplantation, Università degli Studi di Milano, Via F. 12
Sforza 35, 20122 Milano, Italy 13
c: Department of Mother and Child, Luigi Sacco Hospital, via G.B. Grassi 74, 20157 Milano, Italy 14
15
CORRESPONDING AUTHOR: 16
Irene Cetin 17
via G.B. Grassi 74, 20157 Milano, Italy 18
work phone number: +390250319804 / +390239042818 19
fax number: +390250319806 20
email address: [email protected] 21
22
KEY WORDS 23
mitochondria; methylation; cord blood; intrauterine growth restriction; preeclampsia 24
25
2
ABSTRACT 1
Introduction: 2
Intrauterine growth restriction (IUGR) and preeclampsia (PE) are pregnancy disorders characterized 3
by placental insufficiency with oxygen/nutrient restriction and oxidative stress, all influencing 4
mitochondria functionality and number. Moreover, IUGR and PE fetuses are predisposed to 5
diseases later in life, and this might occur through epigenetic alterations. 6
Here we analyze content and methylation of mitochondrial DNA (mtDNA), for the first time in 7
IUGR and PE singleton fetuses, to identify possible alterations in mtDNA levels and/or epigenetic 8
control of mitochondrial loci relevant to replication (D-loop) and functionality (mt-TF/RNR1: 9
protein synthesis, mt-CO1: respiratory chain complex). 10
Methods: 11
We studied 35 term and 8 preterm control, 31 IUGR, 17 PE/IUGR and 17 PE human singleton 12
pregnancies with elective cesarean delivery. Fetal cord blood was collected and evaluated for 13
biochemical parameters. Extracted DNA was subjected to Real-time PCR to assess mtDNA content 14
and analyzed for D-loop, mt-TF/RNR1 and mt-CO1 methylation by bisulfite conversion and 15
pyrosequencing. 16
Results: 17
mtDNA levels were increased in all pathologic groups compared to controls. Mitochondrial loci 18
showed very low methylation levels in all samples; D-loop methylation was further decreased in the 19
most severe cases and associated to umbilical vein pO2. mt-CO1 methylation levels inversely 20
correlated to mtDNA content. 21
Discussion: 22
Increased mtDNA levels in IUGR, PE/IUGR and PE cord blood may denote a fetal response to 23
placental insufficiency. Hypomethylation of D-loop, mt-TF/RNR1 and mt-CO1 loci confirms their 24
relevance in pregnancy. 25
26
3
ABBREVIATIONS 1
IUGR: intrauterine growth restriction 2
PE: preeclampsia 3
mtDNA: mitochondrial DNA 4
CO1: Cytochrome C Oxidase I 5
TF/RNR1: tRNA Phenylalanine / 12S RNA 6
BMI: body mass index 7
pO2: oxygen partial pressure 8
9
4
INTRODUCTION 1
Intrauterine growth restriction (IUGR) and preeclampsia (PE) are pregnancy disorders characterized 2
by defective placental functions, leading to impaired oxygen and nutrients transfer to the fetus [1-5], 3
and increased oxidative stress and inflammation [6]. Adverse intrauterine conditions are known to 4
have an impact also on adult health of newborns, predisposing them to later pathologies such as 5
diabetes, cardiovascular diseases and allergic sensitization [7-9]. Reprogramming of fetal 6
epigenome by intrauterine exposures can occur through methylation of DNA, affecting gene 7
expression and activity without changes in DNA sequence. 8
Mitochondria, as cell energy producers, have been recently investigated as potentially associated 9
with the pathogenesis of placental insufficiency. The number of mitochondria is proportional to the 10
energy requirements of the cells and can deviate from a “healthy range” in conditions of altered 11
oxygen/nutrients availability or oxidative stress impairing mitochondrial functionality [10]. 12
Mitochondria have their own DNA, coding for respiratory chain enzymes, which is distinct but in 13
continuous cross-talk with the nuclear genome. The amount of mitochondrial DNA (mtDNA) is 14
recognized as a measure of the mitochondrial content [11]. Changes in mitochondrial DNA levels 15
have been consistently reported in placenta and maternal blood of pathologic pregnancies [12-17]. 16
However, no data are available about mtDNA content in fetal blood of IUGR and PE singleton 17
pregnancies. 18
Mitochondrial DNA, in addition to nuclear DNA, is subjected to cytosine methylation by a 19
mitochondrial-specific DNA methyltransferase [18]. Methylation makes DNA less accessible to 20
replication and transcription, therefore it may potentially interfere with the expression of respiratory 21
chain complexes, impacting on mitochondrial functionality. Few studies have been conducted on 22
mtDNA methylation, focusing on degenerative diseases, cancer, aging and exposition to 23
environmental pollutants [19-24]. 24
25
5
In this study, we investigated mitochondrial DNA in fetal cord blood of pregnancies affected by 1
IUGR and/or PE. In particular, we evaluated whether alterations of mitochondrial content, reported 2
for placentas and maternal blood, are also present in the fetus, and we analyzed the methylation 3
levels of three mitochondrial genes in pathologic versus control fetuses to evaluate for a possible 4
epigenetic control of mitochondrial number and gene expression. D-loop, mt-CO1 and mt-TF/RNR1 5
are mitochondrial loci relevant to mtDNA and mitochondrial functionality that have been already 6
tested in methylation studies on other pathologies [19-24]. D-loop control region is involved in 7
mtDNA replication, mt-TF/RNR1 locus contains two genes respectively constituting phenylalanine 8
tRNA (TF) and 12S rRNA (RNR1), both needed for protein synthesis, whereas mt-CO1 encodes for 9
Cytochrome C oxidase subunit 1, belonging to respiratory chain and thus involved in mitochondrial 10
function. 11
12
METHODS 13
Population 14
One hundred and eight pregnancies were studied: control pregnancies at term (n=35) and preterm 15
(n=8), and pregnancies complicated by placental insufficiency (IUGR: n=31; PE/IUGR: n=17; PE: 16
n=17). 17
Only patients with singleton pregnancies undergoing elective Cesarean section were included in this 18
study. Exclusion criteria for all groups were maternal drug or alcohol abuse, maternal or fetal 19
infections, fetal abnormal karyotype or major malformations. All pregnant women were of 20
Caucasian origin. 21
Controls were term (> 37 weeks) or preterm (≤ 37 weeks) pregnancies with normal intrauterine 22
growth and appropriate-for-gestational-age birth weight according to reference ranges for the Italian 23
population [25]. Indications for Cesarean section were breech presentation, previous Cesarean 24
delivery or maternal indications not influencing fetal growth. 25
6
IUGR fetuses were identified in utero, through longitudinal measurements indicating abdominal 1
circumferences below the 10th percentile of age-related reference values and a shift from the 2
reference growth curve greater than 40 centiles [26]. IUGR pregnancies were further classified 3
according to umbilical artery pulsatility index, measured by Doppler velocimetry [27-29]. 4
Preeclampsia was defined as blood pressure >140/90 mmHg in two measurements/24h and 5
proteinuria >300mg/24h after the 20th week of pregnancy in a previously normotensive and 6
nonproteinuric woman [30]. PE pregnancies were further divided in two subgroups, with disease 7
onset before or after the 34th week of gestation. 8
The study was approved by the Institutional Ethics Committee, and all pregnant patients gave their 9
informed consent. 10
11
Sampling 12
Umbilical blood was collected from a doubly-clamped segment of the cord at the time of Cesarean 13
section and stored at -20°C until analysis. 14
Oxygenation and acid-base parameters of umbilical artery and vein blood were measured 15
immediately after delivery using a GEM Premier 3000 portable system (Instrumentation 16
Laboratory). 17
18
mtDNA analysis 19
Total DNA was extracted from cord blood samples using QIAamp DNA Blood Mini Kit (Qiagen; 20
Valencia, CA, USA) and quantified by NanoDrop ND 1000 spectrophotometer (NanoDrop 21
Technologies; Wilmington, DE, USA). 22
23
mtDNA content was assessed in Real-time PCR experiments by normalizing the levels of a 24
mitochondrial gene (Cytochrome B) to those of a single-copy nuclear gene (RNase P). For each 25
gene, 30 ng of total DNA were analyzed in triplicate with TaqMan assays (Hs02596867_s1 and 26
7
4316849) on the 7500 Fast Real-Time PCR System (Applied Biosystems by ThermoFisher 1
Scientific; Carlsbad, CA, USA). Cq values with standard deviation exceeding 0.25 were excluded 2
and experiments repeated. The median inter-run coefficient of variation was 1.90%. For each 3
sample, mtDNA level was calculated as 2-∆Cq, obtained after subtracting RNase P average Cq value 4
to Cytochrome B average Cq value (∆Cq). 5
6
mtDNA methylation analyses were performed in a subset of cord blood samples (24 term controls, 7
6 preterm controls, 24 IUGR, 14 PE/IUGR and 9 PE). 8
Total DNA samples (100-500 ng) were bisulfite-converted using EZ DNA Methylation-Direct Kit 9
(Zymo Research Corporation; Irvine, CA, USA) and eluted in 30 µl of M-Elution buffer. 10
Bisulfite-converted DNA (20-50 ng) was subjected to PCR of mitochondrial D-loop, TF/RNR1 and 11
CO1 segments, in a final volume of 50 µl, with GoTaq Hot Start Polymerase (Promega; Madison, 12
WI, USA) and specific primers (Supplementary Table). Cytosine methylation was quantified by 13
pyrosequencing using primers described in Supplementary Table and PyroGold SQA Reagent Kit 14
(Qiagen). Pyrosequencing also allowed to verify bisulfite conversion occurred properly: data from 15
incompletely converted samples were excluded and experiments repeated. The methylation 16
percentage at each CpG site was quantitatively analyzed by PyroMark ID instrument and software 17
Q-CpG v.1.0.11 (both Qiagen). Methylation values represent the mean between at least two 18
independent PCR and pyrosequencing experiments, with a standard deviation ≤3%. The median 19
inter-run coefficient of variation was 8.08%. 20
21
Real-time PCR and pyrosequencing runs were carried out in a blinded and randomized fashion. 22
23
Statistical analysis 24
Data distribution was evaluated with the Kolmogorov-Smirnov test. Maternal age and D-loop 25
methylation levels, showing normal distribution, were compared between two groups using 26
8
independent-samples t-test, with applied correction when the equality of variances assumption was 1
violated (Levene’s test). All other clinical and molecular data were analyzed by independent-2
samples Mann-Whitney U test. Correlation between values was assessed using bivariate Pearson 3
correlation and the r coefficient reported. Differences and correlations were considered statistically 4
significant when p<0.05. No adjustments for multiple comparisons were made. 5
Analyses were performed using the statistical package SPSS (IBM SPSS Statistics, v.23; Armonk, 6
NY, USA). 7
8
RESULTS 9
10
Clinical data of the study population 11
Maternal and fetal characteristics of cases and controls are compared in Table 1. 12
As expected, PE women had higher pre-pregnancy BMI. All pathologic cases had lower gestational 13
age, placental and fetal weight than term controls. However, gestational age of IUGR and PE 14
fetuses was similar to the preterm control subgroup. 15
16
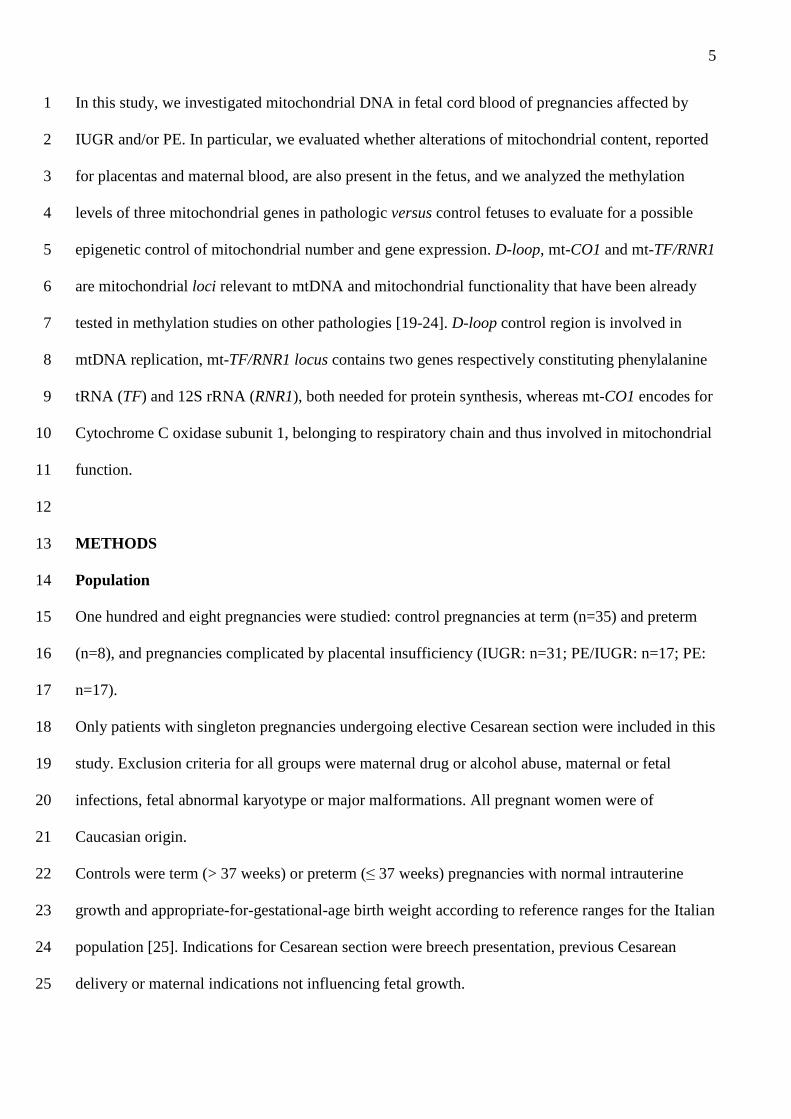
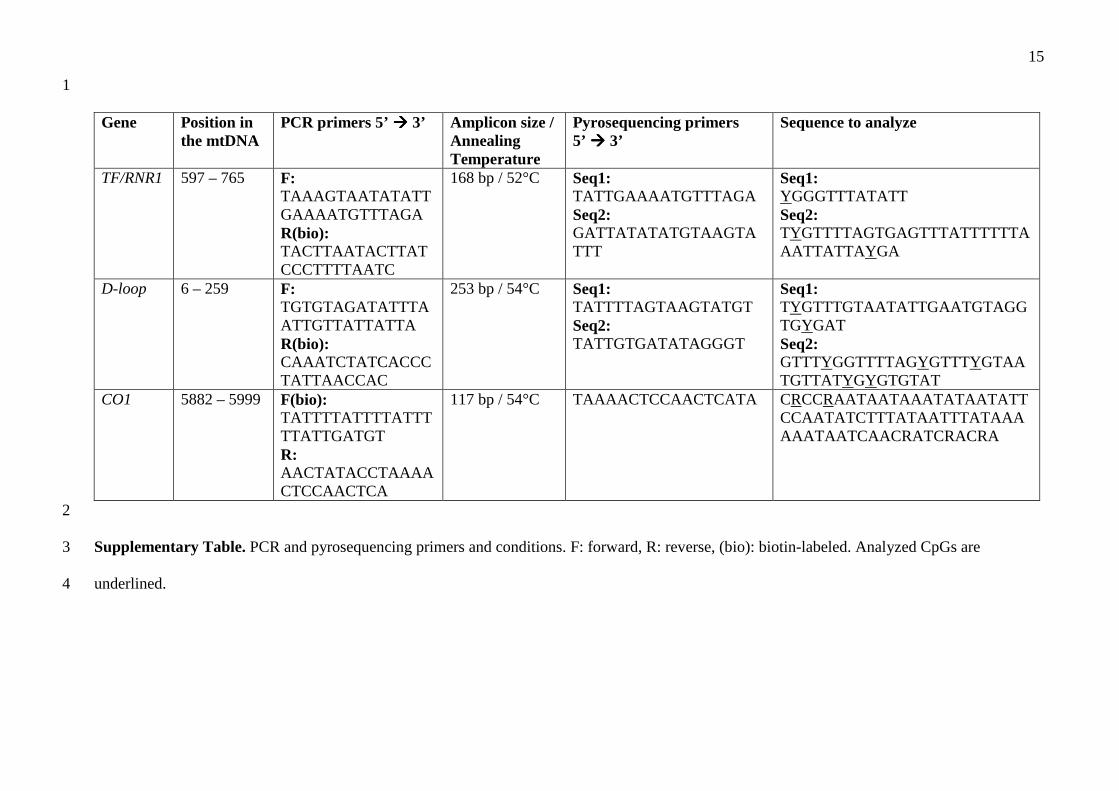
mtDNA content 17
No significant relationship was observed between mtDNA content and gestational age in control 18
pregnancies. Moreover, there were no significant differences between term and preterm controls 19
(Figure 1A). Based on these observations and given the small size of the preterm control group, we 20
pooled the term and preterm controls for all subsequent comparisons. 21
All cases presented a strong significant increase in mtDNA levels compared to controls (Figure 1B; 22
IUGR p=0.000; PE/IUGR p=0.004; PE p=0.000). 23
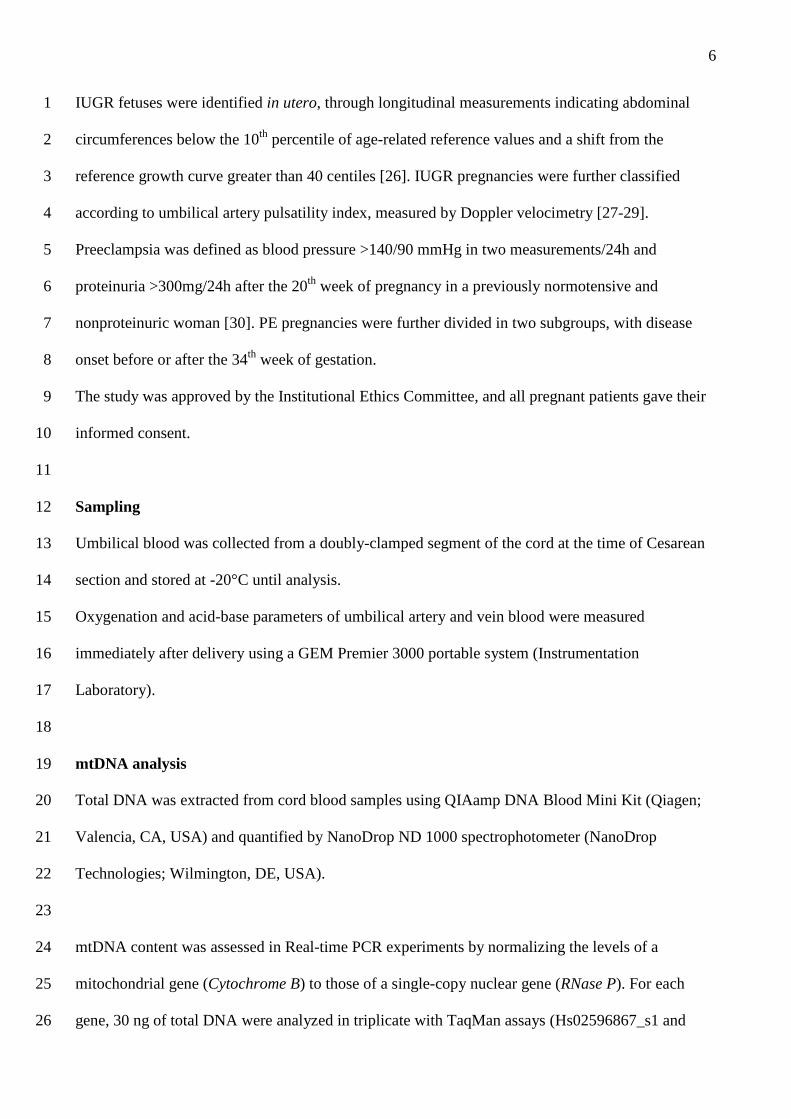
We further examined pathologic samples after classifying them for disease severity: IUGR (with or 24
without PE) were divided in two subgroups with normal or altered pulsatility index, PE pregnancies 25
with disease onset before or after the 34th week of gestation. As shown in Figure 2, mtDNA content 26
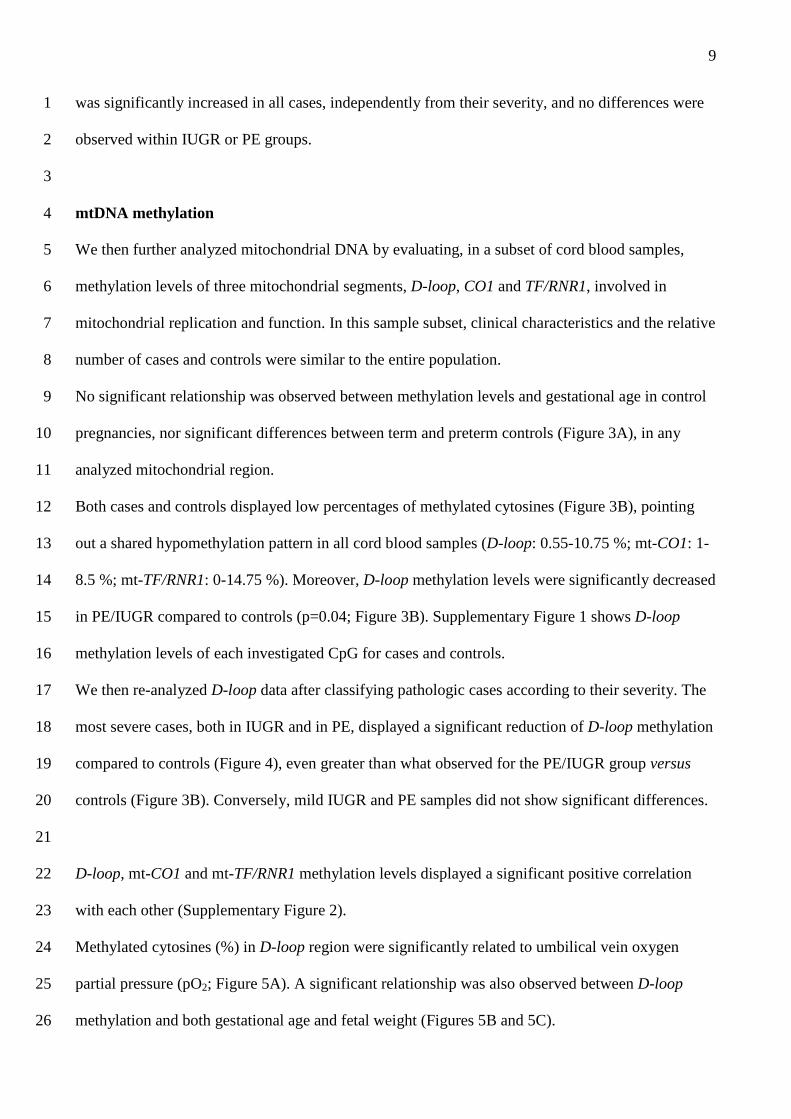
9
was significantly increased in all cases, independently from their severity, and no differences were 1
observed within IUGR or PE groups. 2
3
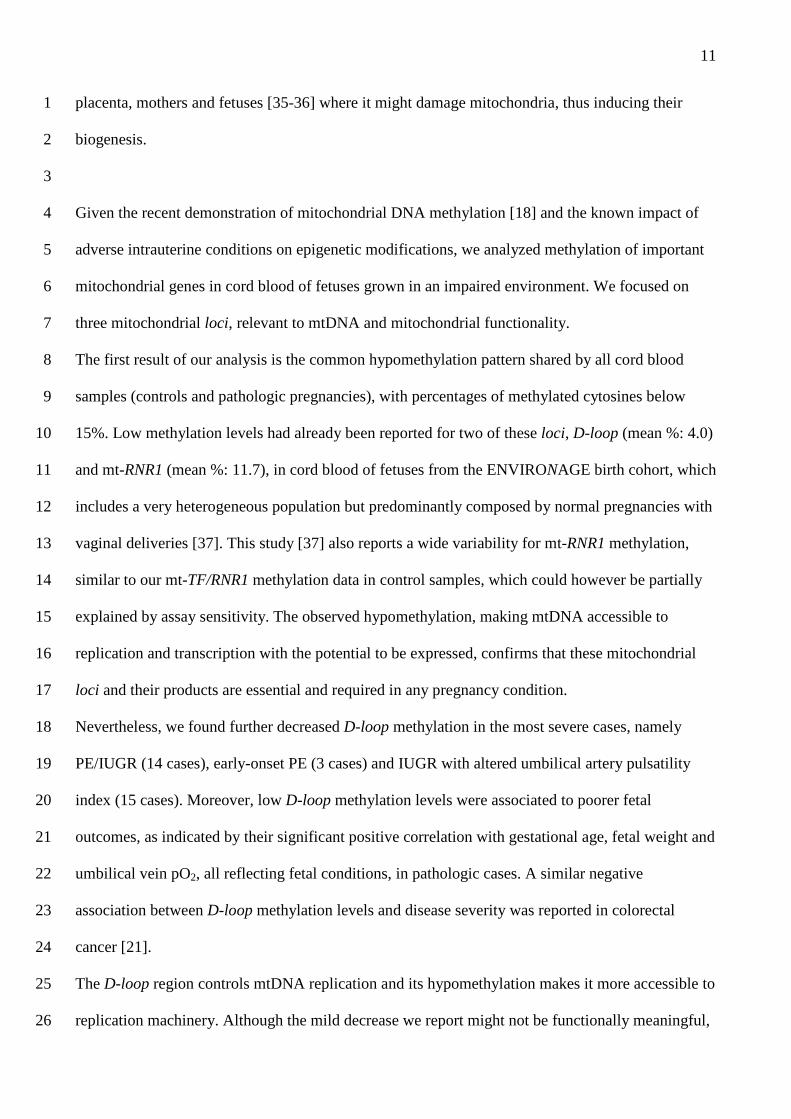
mtDNA methylation 4
We then further analyzed mitochondrial DNA by evaluating, in a subset of cord blood samples, 5
methylation levels of three mitochondrial segments, D-loop, CO1 and TF/RNR1, involved in 6
mitochondrial replication and function. In this sample subset, clinical characteristics and the relative 7
number of cases and controls were similar to the entire population. 8
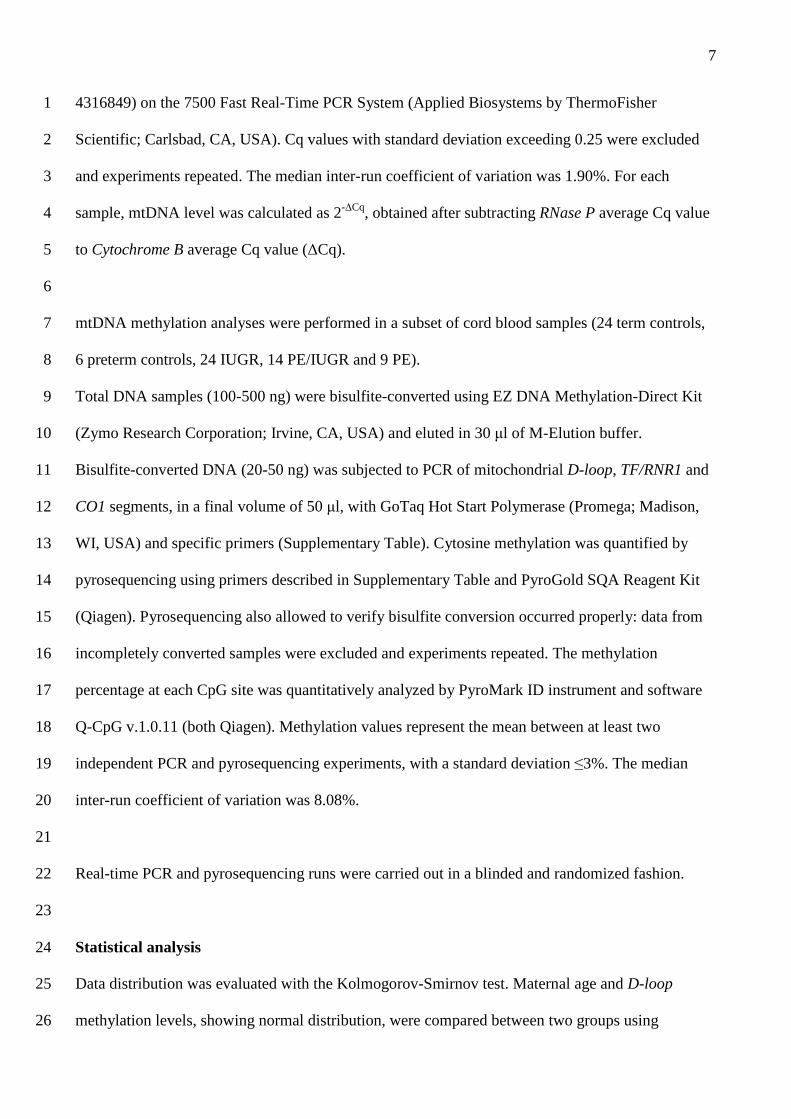
No significant relationship was observed between methylation levels and gestational age in control 9
pregnancies, nor significant differences between term and preterm controls (Figure 3A), in any 10
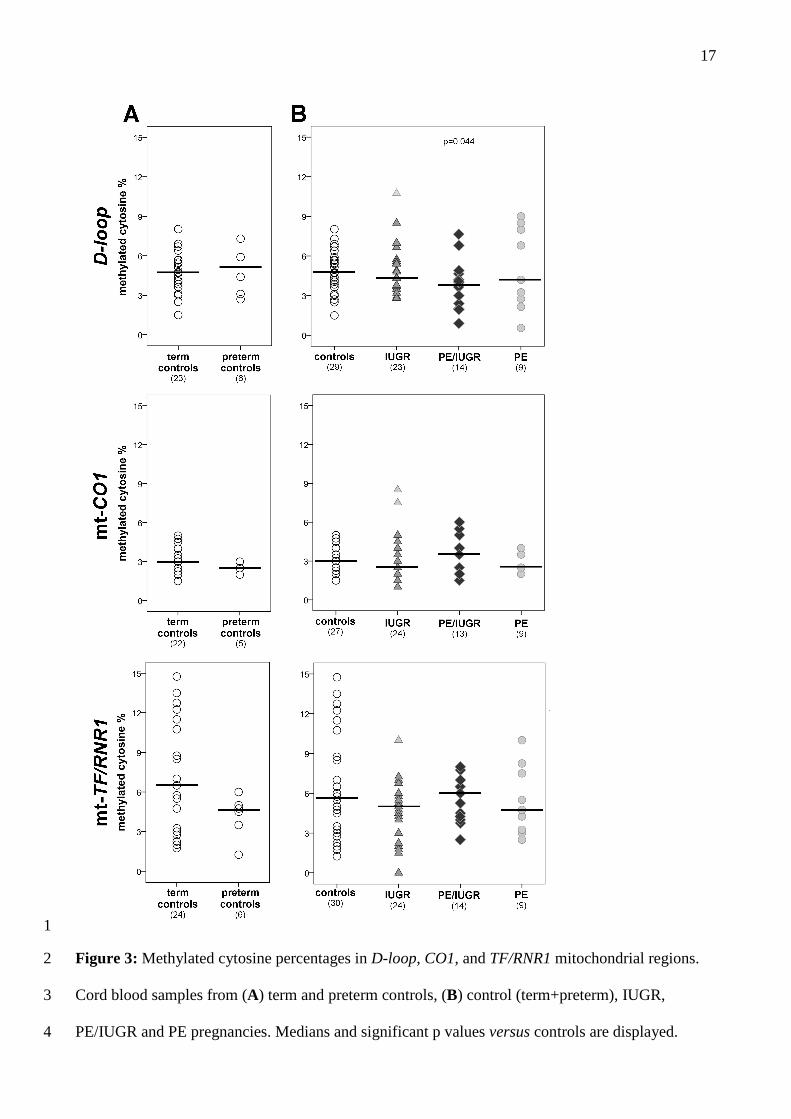
analyzed mitochondrial region. 11
Both cases and controls displayed low percentages of methylated cytosines (Figure 3B), pointing 12
out a shared hypomethylation pattern in all cord blood samples (D-loop: 0.55-10.75 %; mt-CO1: 1-13
8.5 %; mt-TF/RNR1: 0-14.75 %). Moreover, D-loop methylation levels were significantly decreased 14
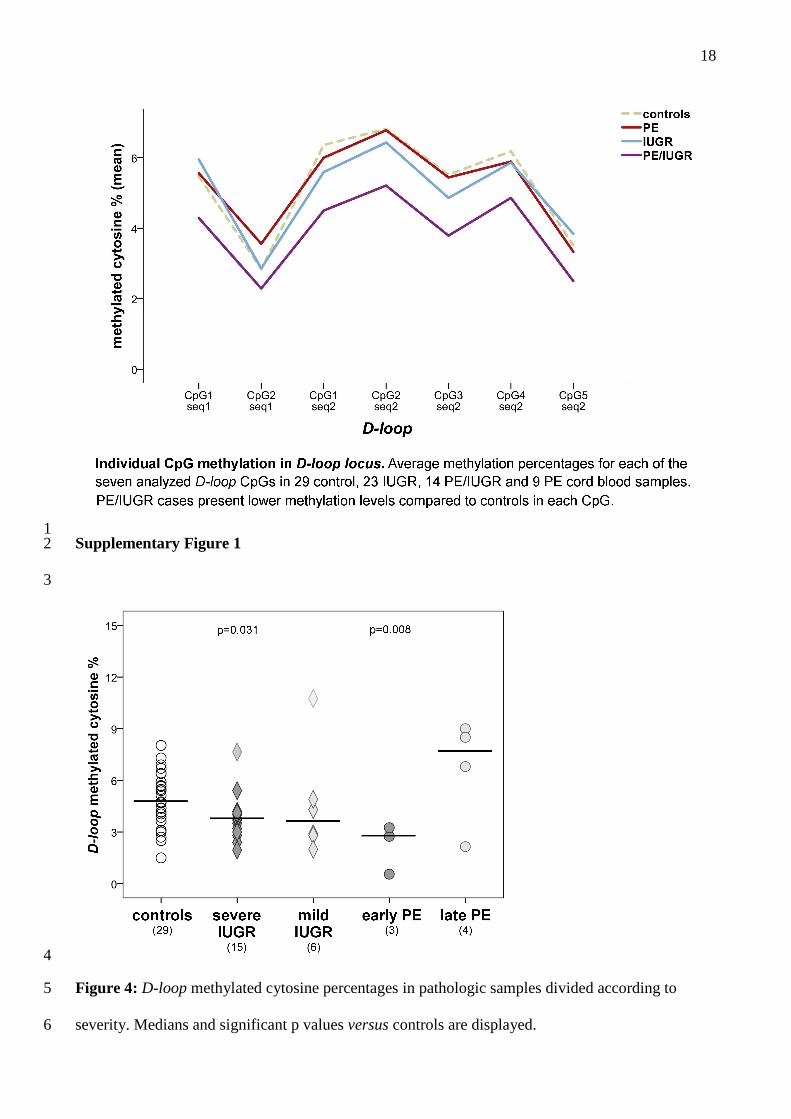
in PE/IUGR compared to controls (p=0.04; Figure 3B). Supplementary Figure 1 shows D-loop 15
methylation levels of each investigated CpG for cases and controls. 16
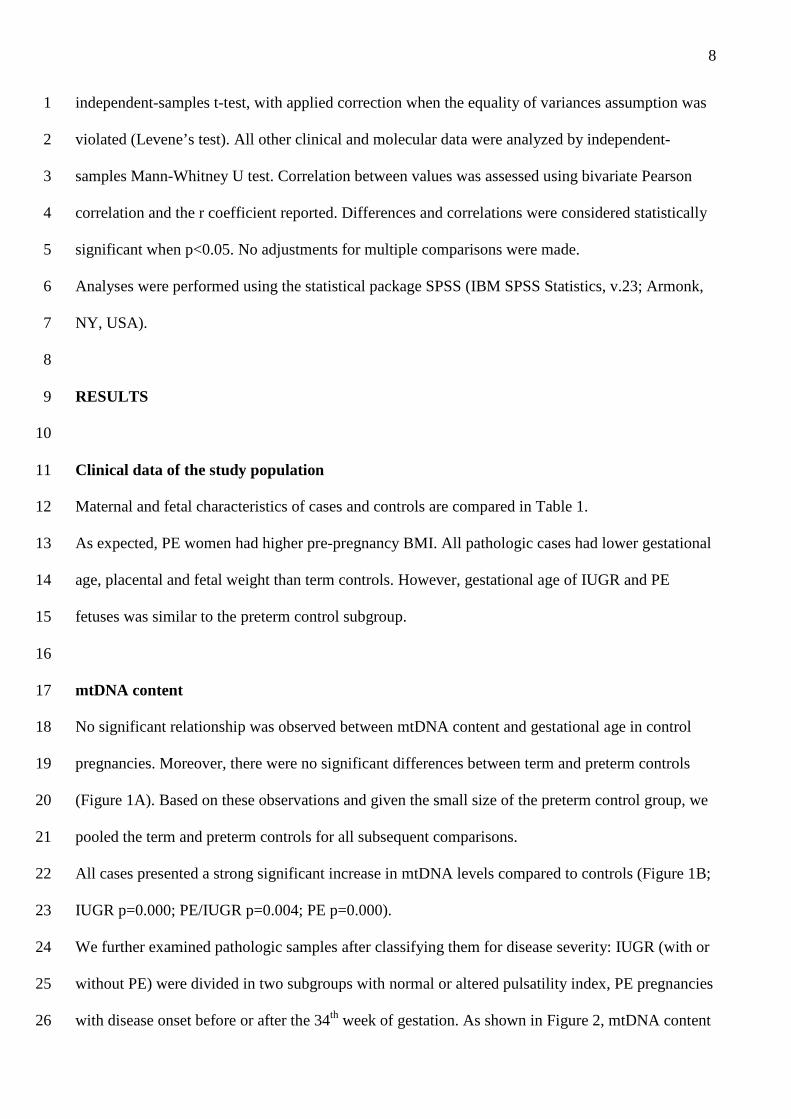
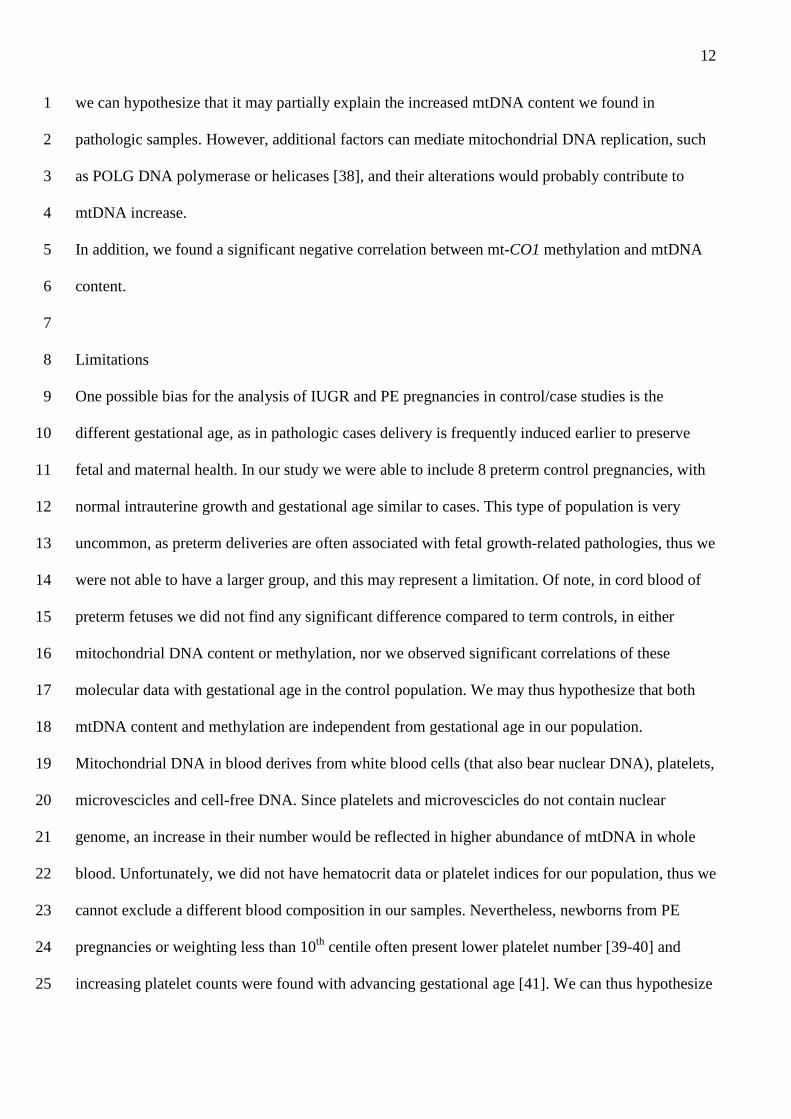
We then re-analyzed D-loop data after classifying pathologic cases according to their severity. The 17
most severe cases, both in IUGR and in PE, displayed a significant reduction of D-loop methylation 18
compared to controls (Figure 4), even greater than what observed for the PE/IUGR group versus 19
controls (Figure 3B). Conversely, mild IUGR and PE samples did not show significant differences. 20
21
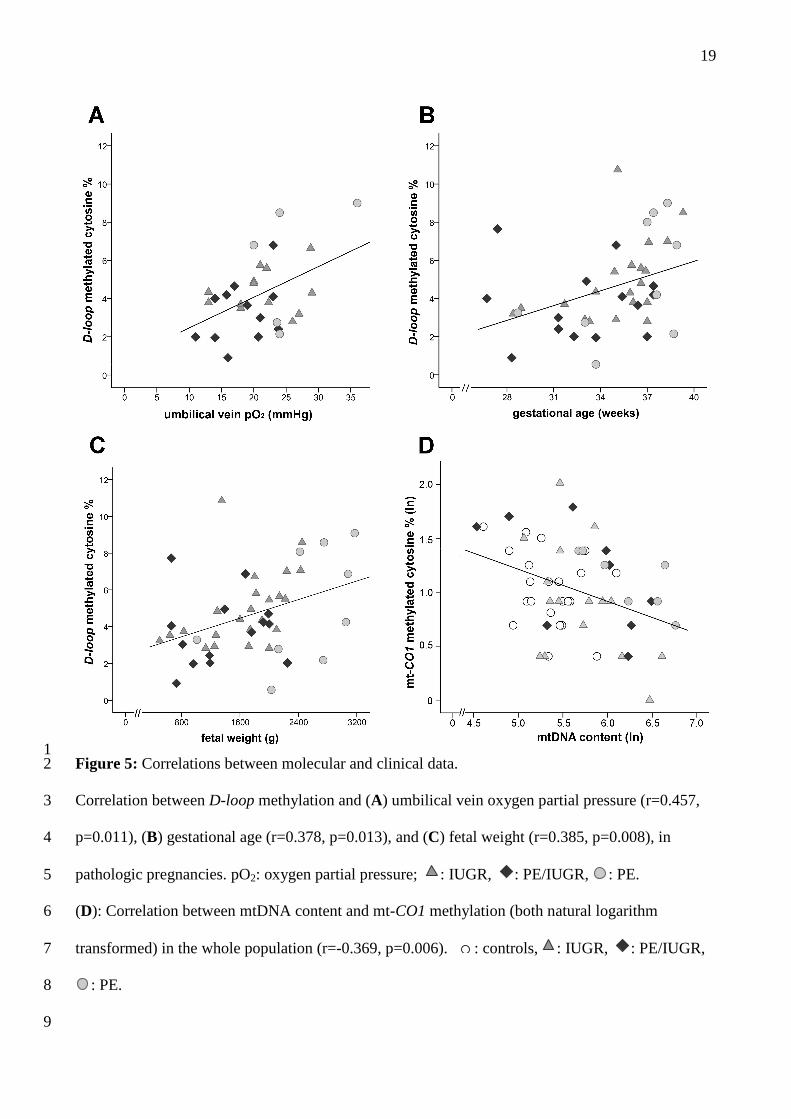
D-loop, mt-CO1 and mt-TF/RNR1 methylation levels displayed a significant positive correlation 22
with each other (Supplementary Figure 2). 23
Methylated cytosines (%) in D-loop region were significantly related to umbilical vein oxygen 24
partial pressure (pO2; Figure 5A). A significant relationship was also observed between D-loop 25
methylation and both gestational age and fetal weight (Figures 5B and 5C). 26
10
Finally, we found a significant and inverse correlation between mt-CO1 methylation levels and 1
mtDNA content, both in pathologic samples (r=-0.431, p=0.014; data not shown) and in the whole 2
population (r=-0.369, p=0.006; Figure 5D). 3
4
DISCUSSION 5
Here we analyzed the mitochondrial DNA amount in fetal blood from pregnancies characterized by 6
IUGR or preeclampsia compared to control pregnancies. We found significantly higher mtDNA 7
levels in all pathologic groups than in controls, which included also preterm pregnancies with 8
gestational age similar to cases. These results are consistent with a previous study comparing cord 9
blood mtDNA in monochorionic twins with one IUGR fetus, that reported higher mtDNA amount 10
in the IUGR fetuses than in their respective larger twins [31]. Moreover, our findings give novel 11
insights into preeclamptic pregnancies, being to our knowledge the first mtDNA data in PE cord 12
blood to be described. 13
We previously reported that mtDNA levels, accounting for mitochondrial content, are increased in 14
IUGR placental tissue and placental mesenchymal stromal cells but decreased in cytotrophoblast 15
cells, compared to controls, suggesting different mitochondrial contents depending on the analyzed 16
cell lineages [12,13,32]. A different cell composition may indeed account for the lower mtDNA 17
amount conversely found in IUGR placentas in another study [14]. Increased mtDNA levels were 18
also reported in blood of women with IUGR [16] and PE [17] pregnancies. 19
Our present results suggest that fetuses react to placental insufficiency and to the adverse 20
intrauterine environment by increasing their mitochondrial content, with a compensatory 21
mechanism facing the oxidative stress and/or hypoxia and calorie restriction occurring in 22
pathologies related to placental insufficiency [33,1]. In particular, IUGR fetuses are characterized 23
by oxygen and nutrient restriction, which is known to induce mitochondrial biogenesis [34]. 24
Preeclamptic pregnancies are instead characterized by increased oxidative stress, reported in 25
11
placenta, mothers and fetuses [35-36] where it might damage mitochondria, thus inducing their 1
biogenesis. 2
3
Given the recent demonstration of mitochondrial DNA methylation [18] and the known impact of 4
adverse intrauterine conditions on epigenetic modifications, we analyzed methylation of important 5
mitochondrial genes in cord blood of fetuses grown in an impaired environment. We focused on 6
three mitochondrial loci, relevant to mtDNA and mitochondrial functionality. 7
The first result of our analysis is the common hypomethylation pattern shared by all cord blood 8
samples (controls and pathologic pregnancies), with percentages of methylated cytosines below 9
15%. Low methylation levels had already been reported for two of these loci, D-loop (mean %: 4.0) 10
and mt-RNR1 (mean %: 11.7), in cord blood of fetuses from the ENVIRONAGE birth cohort, which 11
includes a very heterogeneous population but predominantly composed by normal pregnancies with 12
vaginal deliveries [37]. This study [37] also reports a wide variability for mt-RNR1 methylation, 13
similar to our mt-TF/RNR1 methylation data in control samples, which could however be partially 14
explained by assay sensitivity. The observed hypomethylation, making mtDNA accessible to 15
replication and transcription with the potential to be expressed, confirms that these mitochondrial 16
loci and their products are essential and required in any pregnancy condition. 17
Nevertheless, we found further decreased D-loop methylation in the most severe cases, namely 18
PE/IUGR (14 cases), early-onset PE (3 cases) and IUGR with altered umbilical artery pulsatility 19
index (15 cases). Moreover, low D-loop methylation levels were associated to poorer fetal 20
outcomes, as indicated by their significant positive correlation with gestational age, fetal weight and 21
umbilical vein pO2, all reflecting fetal conditions, in pathologic cases. A similar negative 22
association between D-loop methylation levels and disease severity was reported in colorectal 23
cancer [21]. 24
The D-loop region controls mtDNA replication and its hypomethylation makes it more accessible to 25
replication machinery. Although the mild decrease we report might not be functionally meaningful, 26
12
we can hypothesize that it may partially explain the increased mtDNA content we found in 1
pathologic samples. However, additional factors can mediate mitochondrial DNA replication, such 2
as POLG DNA polymerase or helicases [38], and their alterations would probably contribute to 3
mtDNA increase. 4
In addition, we found a significant negative correlation between mt-CO1 methylation and mtDNA 5
content. 6
7
Limitations 8
One possible bias for the analysis of IUGR and PE pregnancies in control/case studies is the 9
different gestational age, as in pathologic cases delivery is frequently induced earlier to preserve 10
fetal and maternal health. In our study we were able to include 8 preterm control pregnancies, with 11
normal intrauterine growth and gestational age similar to cases. This type of population is very 12
uncommon, as preterm deliveries are often associated with fetal growth-related pathologies, thus we 13
were not able to have a larger group, and this may represent a limitation. Of note, in cord blood of 14
preterm fetuses we did not find any significant difference compared to term controls, in either 15
mitochondrial DNA content or methylation, nor we observed significant correlations of these 16
molecular data with gestational age in the control population. We may thus hypothesize that both 17
mtDNA content and methylation are independent from gestational age in our population. 18
Mitochondrial DNA in blood derives from white blood cells (that also bear nuclear DNA), platelets, 19
microvescicles and cell-free DNA. Since platelets and microvescicles do not contain nuclear 20
genome, an increase in their number would be reflected in higher abundance of mtDNA in whole 21
blood. Unfortunately, we did not have hematocrit data or platelet indices for our population, thus we 22
cannot exclude a different blood composition in our samples. Nevertheless, newborns from PE 23
pregnancies or weighting less than 10th centile often present lower platelet number [39-40] and 24
increasing platelet counts were found with advancing gestational age [41]. We can thus hypothesize 25
13
that the increased mtDNA levels we observed were not due to higher platelet counts in pathologic 1
cord blood, although we cannot totally exclude this limit. 2
3
Conclusions 4
In this study we describe increased mitochondrial content in fetal blood of IUGR, PE/IUGR and PE 5
pregnancies, suggesting a fetal response to restricted nutrients and oxygen availability as well as to 6
oxidative stress. 7
Moreover, this is the first study to our knowledge investigating DNA methylation of important 8
mitochondrial regions in cord blood of pregnancies with placental insufficiency. We found a 9
common hypomethylation pattern shared by both controls and pathologic cases, indicating the 10
relevance of these mitochondrial genes (D-loop, CO1, TF/RNR1) that need to be expressed. 11
Future analyses, e.g. investigating mitochondrial gene expression and function, are needed to 12
further explore these hypotheses and to identify the relative contributions of cord blood cells or cell-13
free DNA to the observed results. 14
15
16
ACKNOWLEDGEMENTS 17
This work was financially supported by grants from Fondazione Giorgio Pardi and from the Italian 18
Ministry of University and Research PRIN 2010-2011 prot. 20102chst5_005 “Parto pre-termine: 19
markers molecolari, biochimici e biofisici dell’unità feto-placentare” (to I.C.). 20
21
DISCLOSURE STATEMENT 22
The authors report no conflict of interest.23
14
TERM
CONTROLS PRETERM
CONTROLS IUGR PE/IUGR PE
(n = 35) (n = 8) (n = 31) (n = 17) (n = 17)
Maternal age, years
34 (19-39)
36 (27-40)
35 (22-45)
36 (33-43)
* 37 (17-44)
Pre-pregnancy BMI, kg/m 2
21.2 (18.7-25.2)
20.2 (19.3-31.3)
20.2 (17.2-32.1)
23.2 (17.5-37.7)
* 22.8 (18-35.6)
*
Gestational age, weeks
39.0 (37.6-40)
36.0 (31.7-37)
*** 35.9 (28.4-39.7)
*** 33 (26.7-37.4)
*** + 34.6 (27.7-38.9)
***
Fetal weight (F), g
3200 (2630-3920)
2745 (2580-3300)
** 1820 (500-2620)
*** +++
1230 (660-2250)
*** +++ 2020 (800-3170)
*** +
Placental weight (P), g
670 (415-950)
600 (520-750)
273
(120-580) *** +++
215 (113-378)
*** +++ 350 (135-700)
*** ++
F/P weight ratio 4.84 (3.37-6.63)
4.62 (3.49-5.31)
5.71
(3.32-10.75) *
5.56 (3.3-12.3)
5.52 (2.43-9.45)
1
2
Table 1. Maternal, fetal and placental data of cases and controls. Data are presented as median and range. BMI: Body Mass Index. *p<0.05, 3
**p<0.01, ***p<0.001 versus term controls; +p<0.05, ++p<0.01, +++p<0.001 versus preterm controls. 4
5
15
1
Gene Position in the mtDNA
PCR primers 5’ ���� 3’ Amplicon size / Annealing Temperature
Pyrosequencing primers 5’ ���� 3’
Sequence to analyze
TF/RNR1 597 – 765 F: TAAAGTAATATATTGAAAATGTTTAGA R(bio): TACTTAATACTTATCCCTTTTAATC
168 bp / 52°C Seq1: TATTGAAAATGTTTAGA Seq2: GATTATATATGTAAGTATTT
Seq1: YGGGTTTATATT Seq2: TYGTTTTAGTGAGTTTATTTTTTAAATTATTAY GA
D-loop 6 – 259 F: TGTGTAGATATTTAATTGTTATTATTA R(bio): CAAATCTATCACCCTATTAACCAC
253 bp / 54°C Seq1: TATTTTAGTAAGTATGT Seq2: TATTGTGATATAGGGT
Seq1: TYGTTTGTAATATTGAATGTAGGTGYGAT Seq2: GTTTYGGTTTTAGYGTTTYGTAATGTTATYGYGTGTAT
CO1 5882 – 5999 F(bio): TATTTTATTTTATTTTTATTGATGT R: AACTATACCTAAAACTCCAACTCA
117 bp / 54°C TAAAACTCCAACTCATA CRCCRAATAATAAATATAATATTCCAATATCTTTATAATTTATAAAAAATAATCAACRATCRACRA
2
Supplementary Table. PCR and pyrosequencing primers and conditions. F: forward, R: reverse, (bio): biotin-labeled. Analyzed CpGs are 3
underlined. 4
16
FIGURES 1
2
Figure 1: mtDNA levels in cord blood of (A) term and preterm controls, (B) control 3
(term+preterm), IUGR, PE/IUGR and PE pregnancies. Medians and significant p values versus 4
controls are displayed. mtDNA content was calculated as 2-∆Cq, where ∆Cq = Cytochrome B (mt 5
gene) Cq – RNase P (nuclear gene) Cq. 6
7
8
Figure 2: mtDNA content in 9
pathologic samples divided 10
according to severity. Medians and 11
significant p values versus controls 12
are displayed. mtDNA content was 13
calculated as 2-∆Cq, where ∆Cq = 14
Cytochrome B (mt gene) Cq – 15
RNase P (nuclear gene) Cq. 16
17
17
1
Figure 3: Methylated cytosine percentages in D-loop, CO1, and TF/RNR1 mitochondrial regions. 2
Cord blood samples from (A) term and preterm controls, (B) control (term+preterm), IUGR, 3
PE/IUGR and PE pregnancies. Medians and significant p values versus controls are displayed. 4
18
1 Supplementary Figure 1 2
3
4
Figure 4: D-loop methylated cytosine percentages in pathologic samples divided according to 5
severity. Medians and significant p values versus controls are displayed. 6
19
1 Figure 5: Correlations between molecular and clinical data. 2
Correlation between D-loop methylation and (A) umbilical vein oxygen partial pressure (r=0.457, 3
p=0.011), (B) gestational age (r=0.378, p=0.013), and (C) fetal weight (r=0.385, p=0.008), in 4
pathologic pregnancies. pO2: oxygen partial pressure; : IUGR, : PE/IUGR, : PE. 5
(D): Correlation between mtDNA content and mt-CO1 methylation (both natural logarithm 6
transformed) in the whole population (r=-0.369, p=0.006). : controls, : IUGR, : PE/IUGR, 7
: PE. 8
9

20
1
Supplementary Figure 2 2
3
21
REFERENCES 1
[1] I. Cetin, G. Alvino, Intrauterine growth restriction: implications for placental metabolism 2
and transport. A review, Placenta. 30 (Suppl A) (2009) S77-82. 3
4
[2] C. Mandò, S. Tabano, P. Pileri, P. Colapietro, M.A. Marino, L. Avagliano, et al., SNAT2 5
expression and regulation in human growth-restricted placentas, Pediatr Res. 74 (2) (2013) 104-110. 6
7
[3] C. Mandò, S. Tabano, P. Colapietro, P. Pileri, F. Colleoni, L. Avagliano, et al., Transferrin 8
receptor gene and protein expression and localization in human IUGR and normal term placentas, 9
Placenta. 32 (1) (2011) 44-50. 10
11
[4] C. Wadsack, S. Tabano, A. Maier, U. Hiden, G. Alvino, V. Cozzi, et al., Intrauterine growth 12
restriction is associated with alterations in placental lipoprotein receptors and maternal lipoprotein 13
composition, Am J Physiol Endocrinol Metab. 292 (2) (2007) E476-E484. 14
15
[5] S. Tabano, G. Alvino, P. Antonazzo, F.R. Grati, M. Miozzo, I. Cetin, Placental LPL gene 16
expression is increased in severe intrauterine growth-restricted pregnancies, Pediatr Res. 59 (2) 17
(2006) 250-253. 18
19
[6] C.W. Redman, G.P. Sacks, I.L. Sargent, Preeclampsia: an excessive maternal inflammatory 20
response to pregnancy, Am J Obstet Gynecol. 180 (1999) 499-506. 21
22
[7] R. Mierzynski, D. Dluski, D. Darmochwal-Kolarz, E. Poniedziałek-Czajkowska, B. 23
Leszczynska-Gorzelak, Z. Kimber-Trojnar, et al., Intra-uterine Growth Retardation as a Risk Factor 24
of Postnatal Metabolic Disorders, Curr Pharm Biotechnol. 17 (7) (2016) 587-596. 25
26
22
[8] E.F. Davis, L. Newton, A.J. Lewandowski, M. Lazdam, B.A. Kelly, T. Kyriakou, P. Leeson, 1
Pre-eclampsia and offspring cardiovascular health: mechanistic insights from experimental studies, 2
Clin Sci (Lond). 123 (2) (2012) 53-72. 3
4
[9] K.K. Byberg, B. Ogland, G.E. Eide, K. Oymar, Birth after preeclamptic pregnancies: 5
association with allergic sensitization and allergic rhinoconjunctivitis in late childhood; a 6
historically matched cohort study, BMC Pediatr. 14 (2014) 101. 7
8
[10] A.N. Malik, A. Czajka, Is mitochondrial DNA content a potential biomarker of 9
mitochondrial dysfunction? Mitochondrion. 13 (5) (2013) 481-492. 10
11
[11] D.P. Kelly, R.C. Scarpulla, Transcriptional regulatory circuits controlling mitochondrial 12
biogenesis and function, Genes Dev. 18 (4) (2004) 357-368. 13
14
[12] D. Lattuada, F. Colleoni, A. Martinelli, A. Garretto, R. Magni, T. Radaelli, I. Cetin, Higher 15
mitochondrial DNA content in human IUGR placenta, Placenta. 29 (12) (2008) 1029-1033. 16
17
[13] C. Mandò, C. De Palma, T. Stampalija, G.M. Anelli, M. Figus, C. Novielli, et al., Placental 18
mitochondrial content and function in intrauterine growth restriction and preeclampsia, Am J 19
Physiol Endocrinol Metab. 306 (4) (2014) E404-413. 20
21
[14] D. Poidatz, E. Dos Santos, F. Duval, H. Moindjie, V. Serazin, F. Vialard, et al., Involvement 22
of estrogen-related receptor-γ and mitochondrial content in intrauterine growth restriction and 23
preeclampsia, Fertil Steril. 104 (2) (2015) 483-490. 24
25
23
[15] P.A. Vishnyakova, M.A. Volodina, N.V. Tarasova, M.V. Marey, D.V. Tsvirkun, O.V. 1
Vavina, et al., Mitochondrial role in adaptive response to stress conditions in preeclampsia, Sci Rep. 2
6 (2016) 32410. 3
4
[16] F. Colleoni, D. Lattuada, A. Garretto, M. Massari, C. Mandò, E. Somigliana, I. Cetin, 5
Maternal blood mitochondrial DNA content during normal and intrauterine growth restricted 6
(IUGR) pregnancy, Am J Obstet Gynecol. 203 (4) (2010) 365.e1-6. 7
8
[17] C. Qiu, K. Hevner, D.A. Enquobahrie, M.A. Williams, A case-control study of maternal 9
blood mitochondrial DNA copy number and preeclampsia risk, Int J Mol Epidemiol Genet. 3 (3) 10
(2012) 237-244. 11
12
[18] L.S. Shock, P.V. Thakkar, E.J. Peterson, R.G. Moran, S.M. Taylor, DNA methyltransferase 13
1, cytosine methylation, and cytosine hydroxymethylation in mammalian mitochondria, Proc Natl 14
Acad Sci U S A. 108 (9) (2011) 3630-3635. 15
16
[19] M. Blanch, J.L. Mosquera, B. Ansoleaga, I. Ferrer, M. Barrachina, Altered Mitochondrial 17
DNA Methylation Pattern in Alzheimer Disease-Related Pathology and in Parkinson Disease, Am J 18
Pathol. 186 (2) (2016) 385-397. 19
20
[20] C.J. Pirola, T.F. Gianotti, A.L. Burgueño, M. Rey-Funes, C.F. Loidl, P. Mallardi, et al., 21
Epigenetic modification of liver mitochondrial DNA is associated with histological severity of 22
nonalcoholic fatty liver disease, Gut. 62 (9) (2013) 1356-1363. 23
24
24
[21] J. Gao, S. Wen, H. Zhou, S. Feng, De-methylation of displacement loop of mitochondrial 1
DNA is associated with increased mitochondrial copy number and nicotinamide adenine 2
dinucleotide subunit 2 expression in colorectal cancer, Mol Med Rep. 12 (5) (2015) 7033-7038. 3
4
[22] P. D'Aquila, M. Giordano, A. Montesanto, F. De Rango, G. Passarino, D. Bellizzi, Age-and 5
gender-related pattern of methylation in the MT-RNR1 gene, Epigenomics. 7 (5) (2015) 707-716. 6
7
[23] H.M. Byun, T. Panni, V. Motta, L. Hou, F. Nordio, P. Apostoli, et al., Effects of airborne 8
pollutants on mitochondrial DNA methylation, Part Fibre Toxicol. 10 (2013) 18. 9
10
[24] B.G. Janssen, H.M. Byun, W. Gyselaers, W. Lefebvre, A.A. Baccarelli, T.S. Nawrot, 11
Placental mitochondrial methylation and exposure to airborne particulate matter in the early life 12
environment: An ENVIRONAGE birth cohort study, Epigenetics. 10 (6) (2015) 536-544. 13
14
[25] E. Bertino, E. Spada, L. Occhi, A. Coscia, F. Giuliani, L. Gagliardi, et al., Neonatal 15
anthropometric charts: the Italian neonatal study compared with other European studies, J Pediatr 16
Gastroenterol Nutr. 51 (3) (2010) 353-361. 17
18
[26] T. Todros, E. Ferrazzi, C. Groli, U. Nicolini, L. Parodi, M. Pavoni, et al., Fitting growth 19
curves to head and abdomen measurements of the fetus: a multicentric study, J Clin Ultrasound. 15 20
(2) (1987) 95-105. 21
22
[27] G. Pardi, I. Cetin, A.M. Marconi, A. Lanfranchi, P. Bozzetti, E. Ferrazzi, et al., Diagnostic 23
value of blood sampling in fetuses with growth retardation, N Engl J Med. 328 (1993) 692–696. 24
25
25
[28] J. Zhang, M. Merialdi, L.D. Platt, M.S. Kramer, Defining normal and abnormal fetal growth: 1
Promises and challenges, Am J Obstet Gynecol. 202 (2010) 522–528. 2
3
[29] F. Figueras, J. Gardosi, Intrauterine growth restriction: New concepts in antenatal 4
surveillance, diagnosis, and management, AmJ Obstet Gynecol. 204 (2011) 288–300. 5
6
[30] M.A. Brown, M.D. Lindheimer, M. de Swiet, A. Van Assche, J.M. Moutquin, The 7
classification and diagnosis of the hypertensive disorders of pregnancy: statement from the 8
International Society for the Study of Hypertension in Pregnancy (ISSHP), Hypertens Pregnancy. 9
20 (1) (2001) IX-XIV. 10
11
[31] Y.L. Chang, C.N. Wang, P.C. Wei, H.H. Peng, A.S. Chao, S.D. Chang, et al., Mitochondrial 12
activation in the growth-restricted fetus of monochorionic twins, Fertil Steril. 100 (1) (2013) 241-13
246.e1-2. 14
15
[32] C. Mandò, P. Razini, C. Novielli, G.M. Anelli, M. Belicchi, S. Erratico, et al., Impaired 16
Angiogenic Potential of Human Placental Mesenchymal Stromal Cells in Intrauterine Growth 17
Restriction, Stem Cells Transl Med. 5 (4) (2016) 451-463. 18
19
[33] C.P. Sibley, M.A. Turner, I. Cetin, P. Ayuk, C.A. Boyd, S.W. D'Souza, et al., Placental 20
phenotypes of intrauterine growth, Pediatr Res. 58 (5) (2005) 827-832. 21
22
[34] D.R. Gutsaeva, M.S. Carraway, H.B. Suliman, I.T. Demchenko, H. Shitara, H. Yonekawa, 23
et al., Transient hypoxia stimulates mitochondrial biogenesis in brain subcortex by a neuronal nitric 24
oxide synthase-dependent mechanism, J Neurosci. 28 (9) (2008) 2015–2024. 25
26
26
[35] M.Z. Howlader, S. Parveen, S. Tamanna, T.A. Khan, F. Begum, Oxidative stress and 1
antioxidant status in neonates born to pre-eclamptic mother, J Trop Pediatr. 55 (6) (2009) 363-367. 2
3
[36] S. Namdev, V. Bhat, B. Adhisivam, B. Zachariah, Oxidative stress and antioxidant status 4
among neonates born to mothers with pre-eclampsia and their early outcome, J Matern Fetal 5
Neonatal Med. 27 (14) (2014) 1481-1484. 6
7
[37] B.G. Janssen, H.M. Byun, B. Cox, W. Gyselaers, B. Izzi, A.A. Baccarelli, T.S. Nawrot, 8
Variation of DNA methylation in candidate age-related targets on the mitochondrial-telomere axis 9
in cord blood and placenta, Placenta. 35 (9) (2014) 665-672. 10
11
[38] W.T. Lee, J. St John, The control of mitochondrial DNA replication during development and 12
tumorigenesis, Ann N Y Acad Sci. 1350 (2015) 95-106. 13
14
[39] S.C. Huang, F.M. Chang, The adverse effect on fetal hemogram by preeclampsia: marked 15
anisocytosis with normocytic, normochromic erythrocythemia as well as thrombocytopenia, Early 16
Hum Dev. 37 (2) (1994) 91-98. 17
18
[40] A. Wasiluk, M. Dabrowska, J. Osada, E. Jasinska, T. Laudanski, S. Redzko, Platelet indices 19
in SGA newborns, Adv Med Sci. 56 (2) (2011) 361-365. 20
21
[41] L. Glasser, N. Sutton, M. Schmeling, J.T. Machan, A comprehensive study of umbilical cord 22
blood cell developmental changes and reference ranges by gestation, gender and mode of delivery, J 23
Perinatol. 35 (7) (2015) 469-475. 24
25


