
7th ed. August 2020
2
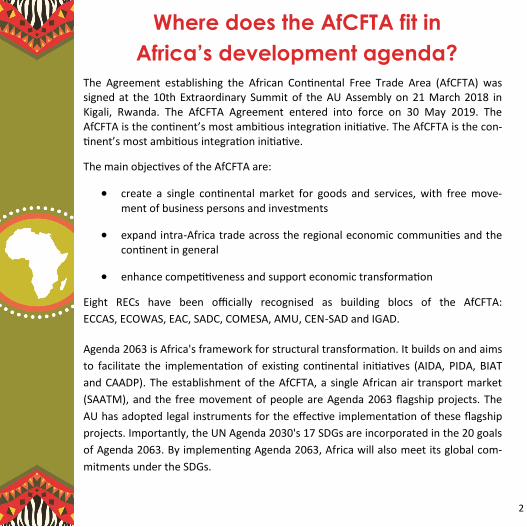
Where does the AfCFTA fit in
Africa’s development agenda?
The Agreement establishing the African Continental Free Trade Area (AfCFTA) was signed at the 10th Extraordinary Summit of the AU Assembly on 21 March 2018 in Kigali, Rwanda. The AfCFTA Agreement entered into force on 30 May 2019. The AfCFTA is the continent’s most ambitious integration initiative. The AfCFTA is the con-tinent’s most ambitious integration initiative.
The main objectives of the AfCFTA are:
• create a single continental market for goods and services, with free move-ment of business persons and investments
• expand intra-Africa trade across the regional economic communities and the continent in general
• enhance competitiveness and support economic transformation
Eight RECs have been officially recognised as building blocs of the AfCFTA:
ECCAS, ECOWAS, EAC, SADC, COMESA, AMU, CEN-SAD and IGAD.
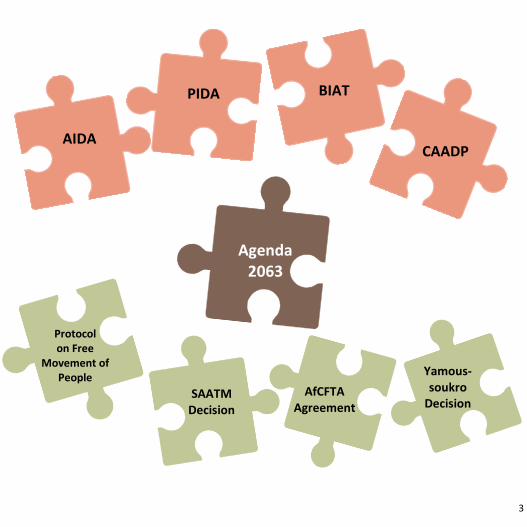
Agenda 2063 is Africa's framework for structural transformation. It builds on and aims
to facilitate the implementation of existing continental initiatives (AIDA, PIDA, BIAT
and CAADP). The establishment of the AfCFTA, a single African air transport market
(SAATM), and the free movement of people are Agenda 2063 flagship projects. The
AU has adopted legal instruments for the effective implementation of these flagship
projects. Importantly, the UN Agenda 2030's 17 SDGs are incorporated in the 20 goals
of Agenda 2063. By implementing Agenda 2063, Africa will also meet its global com-
mitments under the SDGs.
3
Agenda 2063
PIDA
AIDA
BIAT
CAADP
SAATM Decision
Protocol on Free
Movement of People
AfCFTA Agreement
Yamous-soukro
Decision
4
Architecture of the AfCFTA
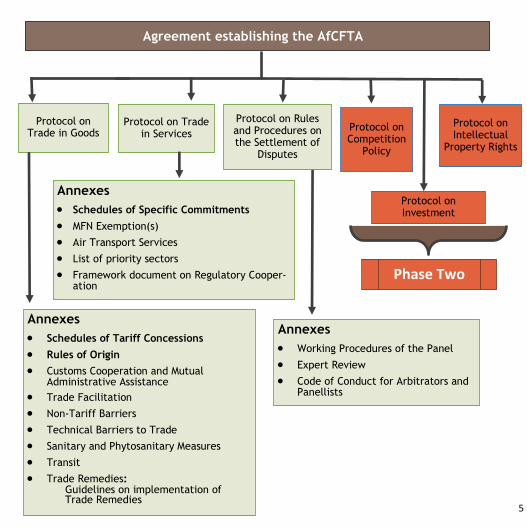
The AfCFTA Agreement is a framework agreement covering Trade in Goods and
Services, Investment, Intellectual Property Rights and Competition Policy.
The Protocols on Trade in Goods, Trade in Services, Investment, Intellectual Prop-
erty Rights, and Competition Policy, as well as Dispute Settlement, form an integral
part of the Agreement. The Protocols on Trade in Goods and Trade in Services each
have several Annexes covering substantive disciplines.
Trade in Goods and Trade in Services are being negotiated in Phase 1; with
negotiations on a number of issues (e.g. tariff concessions, rules of origin for goods
and schedules of specific commitments for services) still ongoing. Phase 2 of the
negotiations will cover Investment, Competition Policy and Intellectual Property
Rights.
Phase 2 negotiations and the draft texts of the Protocols on Investment,
Competition Policy and Intellectual Property Rights are expected to be finalised by
December 2020.* The Assembly has also decided to add e-commerce to the
AfCFTA negotiations – AfCFTA Protocol on E-Commerce.**
*Phase 2 Protocols shall enter into force 30 days after the deposit of the 22nd instrument of ratification.
**Decision on the AfCFTA Doc. Assembly/AU/4(XXXIII) Assembly/AU/Dec.751(XXXIII) available at
https://au.int/sites/default/files/decisions/38180-assembly_au_dec_749-795_xxxiii_e.pdf
5
Agreement establishing the AfCFTA
Protocol on Rules and Procedures on the Settlement of
Disputes
Protocol on Trade in Services
Protocol on Trade in Goods
Protocol on Investment
Protocol on Intellectual
Property Rights
Protocol on Competition
Policy
Annexes
• Schedules of Specific Commitments
• MFN Exemption(s)
• Air Transport Services
• List of priority sectors
• Framework document on Regulatory Cooper-ation
Annexes
• Schedules of Tariff Concessions
• Rules of Origin
• Customs Cooperation and Mutual Administrative Assistance
• Trade Facilitation
• Non-Tariff Barriers
• Technical Barriers to Trade
• Sanitary and Phytosanitary Measures
• Transit
• Trade Remedies: Guidelines on implementation of Trade Remedies
Phase Two
Annexes
• Working Procedures of the Panel
• Expert Review
• Code of Conduct for Arbitrators and Panellists
6
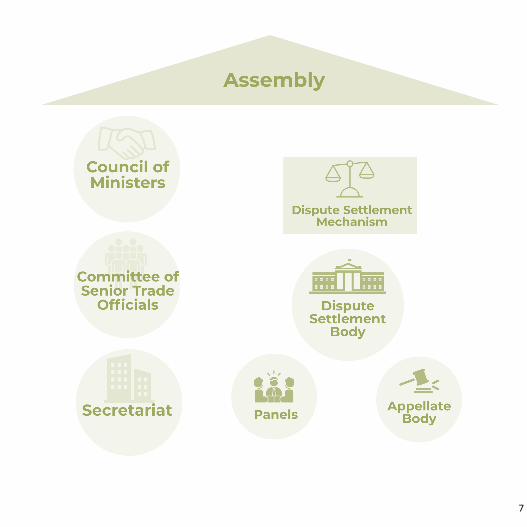
Institutions of the AfCFTA The institutions established under the AfCFTA, and their powers, represent
a compromise between the typical institutional arrangements of a stand-
alone Free Trade Agreement (FTA) and the AfCFTA as a flagship project of
the African Union (AU) under Agenda 2063.
The founding Agreement does not state that this arrangement will be a legal
person (as is the case in several regional economic communities, including
SADC and EAC). It does provide an institutional architecture for this arrange-
ment (shown below). Notably, the apex institution is the Assembly – this is
the Assembly of the African Union.
The Assembly of the African Union comprises all AU Heads of State and Government, not just those of
State Parties to the Agreement. It provides oversight and guidance on the AfCFTA and is the ultimate
decision-making body for the AfCFTA.
The Council of Ministers comprises Ministers for Trade or other nominees from State Parties. It has
authority to take decisions in accordance with the AfCFTA Agreement. and works in collaboration with
the relevant AU organs and institutions. It reports to the Assembly through the Executive Council of
the AU and makes recommendations to the Assembly for the adoption of an authoritative
interpretation of the Agreement. It is separate from the African Union Ministers of Trade (AMOT)
committee under the AU.
The Committee of Senior Trade Officials consists of Permanent Secretaries or other officials
designated by State Parties. It is responsible for the development of programmes and action plans for
the implementation of the AfCFTA Agreement.
The AfCFTA Secretariat is the administrative organ to coordinate the implementation of the AfCFTA. It
is based in Accra, Ghana. The Parliament of Ghana ratified the Agreement to host the AfCFTA
Secretariat on 03 August 2020.
The Dispute Settlement Mechanism replicates, with the necessary adaptations, the WTO dispute
settlement system. The principles and procedures appear in a dedicated Protocol. Only State Parties
will be able to bring applications. Private party litigation is not possible.
7
8
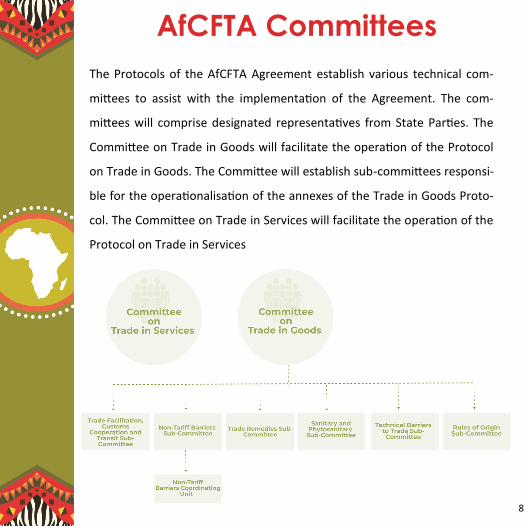
AfCFTA Committees
The Protocols of the AfCFTA Agreement establish various technical com-
mittees to assist with the implementation of the Agreement. The com-
mittees will comprise designated representatives from State Parties. The
Committee on Trade in Goods will facilitate the operation of the Protocol
on Trade in Goods. The Committee will establish sub-committees responsi-
ble for the operationalisation of the annexes of the Trade in Goods Proto-
col. The Committee on Trade in Services will facilitate the operation of the
Protocol on Trade in Services
9
Other AfCFTA initiatives
African Trade Observatory: the African Trade Observatory (ATO) aims to create a
continent-wide trade information portal to facilitate intra-African trade and to support
the roll-out of the AfCFTA. The ATO will seek to collect trade-related data from member
states and provide trade intelligence to both market players and governmental and
non-governmental agencies. The ATO will also include services trade, exchange rate and
competitiveness indicators, internal tax data and foreign direct investment data.
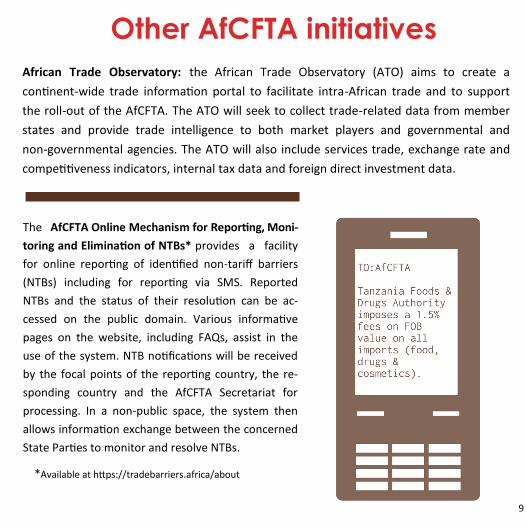
The AfCFTA Online Mechanism for Reporting, Moni-
toring and Elimination of NTBs* provides a facility
for online reporting of identified non-tariff barriers
(NTBs) including for reporting via SMS. Reported
NTBs and the status of their resolution can be ac-
cessed on the public domain. Various informative
pages on the website, including FAQs, assist in the
use of the system. NTB notifications will be received
by the focal points of the reporting country, the re-
sponding country and the AfCFTA Secretariat for
processing. In a non-public space, the system then
allows information exchange between the concerned
State Parties to monitor and resolve NTBs.
*Available at https://tradebarriers.africa/about
10
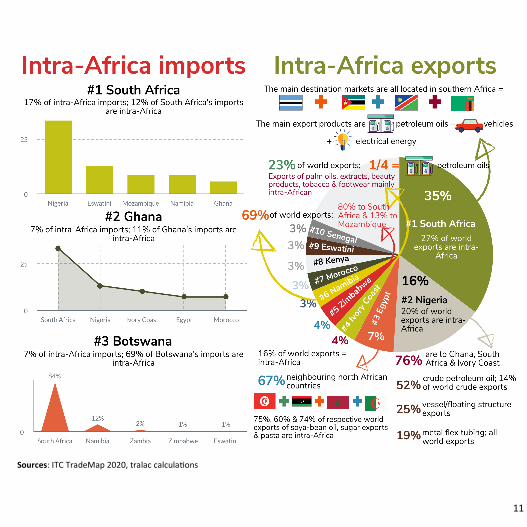
Intra-African trade at a glance For 2019* intra-African exports were valued at US$69 billion; 15% of Africa’s
world exports. Between 2018 and 2019 intra-Africa exports and Africa’s
world exports respectively declined by 5% and 8%
• Although South Africa is the main intra-Africa exporter and importer;
(accounting for 35% of intra-Africa exports and 17% of intra-Africa
imports), South Africa’s intra-Africa trade declined while intra-Africa
exports from Nigeria and Zimbabwe and intra-Africa imports by Gha-
na and Mozambique increased significantly.
• Other main intra-African exporters Nigeria, Egypt, Ivory Coast and
Zimbabwe account for 31% of intra-Africa exports.
• 23% of intra-Africa exports are mineral fuels, followed by exports of
machinery, floating structures, vehicles and precious metals.
• Apart from South Africa, all other main intra-Africa imports except
Ghana are also in southern Africa (Botswana, Mozambique, Namibia
and Zambia). Between 2018 and 2019 Ghana’s intra-Africa imports
more than doubled, while Mozambique’s imports increased by 22%.
• The biggest portion of Africa’s world exports of cereals, photographic
equipment, arms and ammunitions, printed books and articles of
base metals are intra-Africa exports.
* Intra-Africa data is based on the up-to-date trade data from 26 African countries as of the end of August.
11
Sources: ITC TradeMap 2020, tralac calculations
12
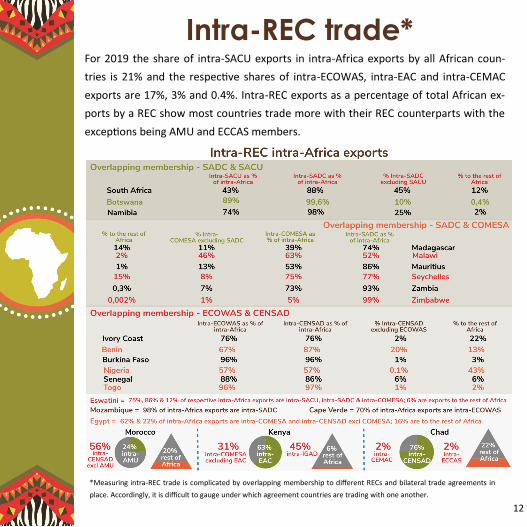
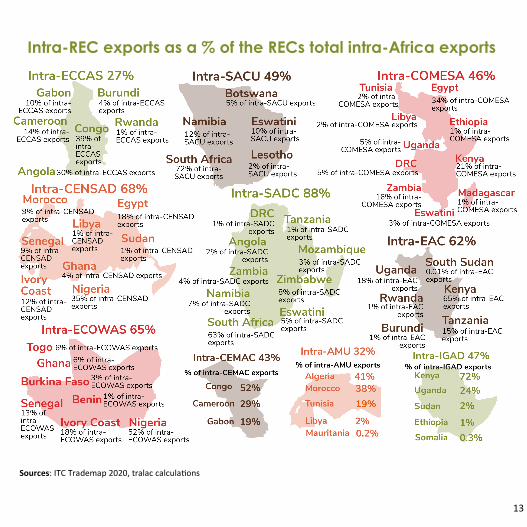
Intra-REC trade* For 2019 the share of intra-SACU exports in intra-Africa exports by all African coun-
tries is 21% and the respective shares of intra-ECOWAS, intra-EAC and intra-CEMAC
exports are 17%, 3% and 0.4%. Intra-REC exports as a percentage of total African ex-
ports by a REC show most countries trade more with their REC counterparts with the
exceptions being AMU and ECCAS members.
*Measuring intra-REC trade is complicated by overlapping membership to different RECs and bilateral trade agreements in
place. Accordingly, it is difficult to gauge under which agreement countries are trading with one another.
13
Intra-REC exports as a % of the RECs total intra-Africa exports
Sources: ITC Trademap 2020, tralac calculations
14
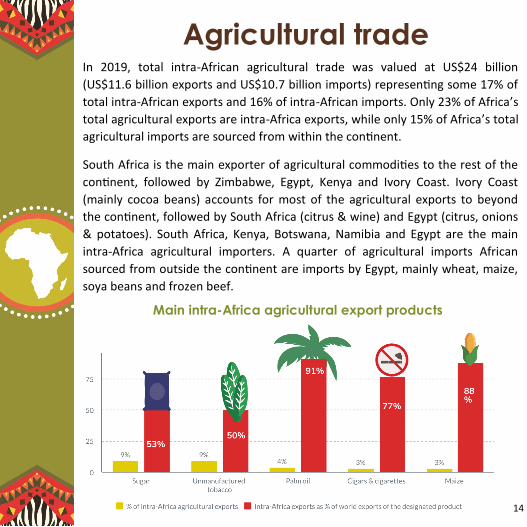
Agricultural trade In 2019, total intra-African agricultural trade was valued at US$24 billion
(US$11.6 billion exports and US$10.7 billion imports) representing some 17% of
total intra-African exports and 16% of intra-African imports. Only 23% of Africa’s
total agricultural exports are intra-Africa exports, while only 15% of Africa’s total
agricultural imports are sourced from within the continent.
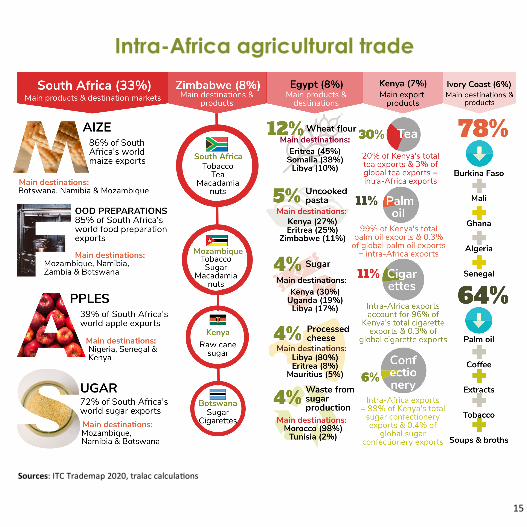
South Africa is the main exporter of agricultural commodities to the rest of the
continent, followed by Zimbabwe, Egypt, Kenya and Ivory Coast. Ivory Coast
(mainly cocoa beans) accounts for most of the agricultural exports to beyond
the continent, followed by South Africa (citrus & wine) and Egypt (citrus, onions
& potatoes). South Africa, Kenya, Botswana, Namibia and Egypt are the main
intra-Africa agricultural importers. A quarter of agricultural imports African
sourced from outside the continent are imports by Egypt, mainly wheat, maize,
soya beans and frozen beef.
Main intra-Africa agricultural export products
15
Intra-Africa agricultural trade
Sources: ITC Trademap 2020, tralac calculations
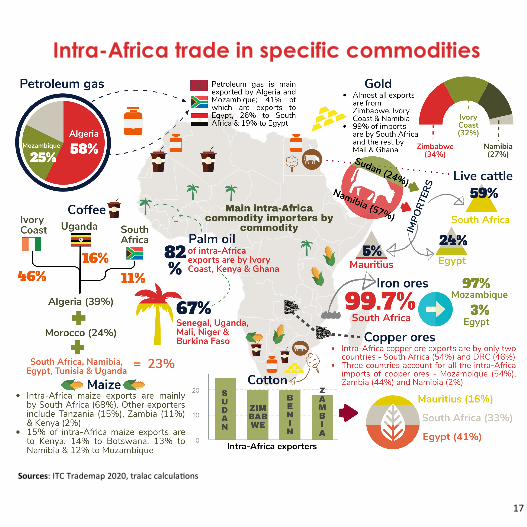
16
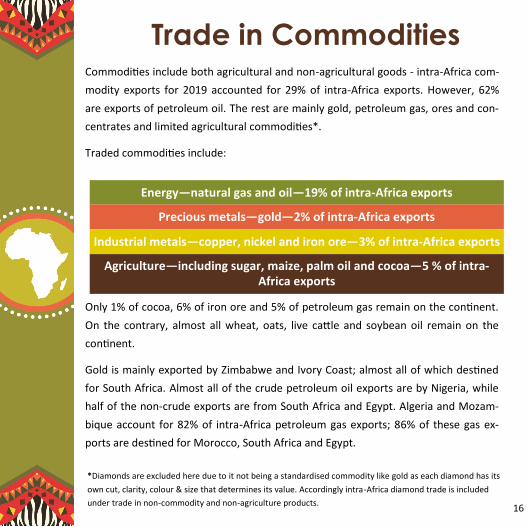
Commodities include both agricultural and non-agricultural goods - intra-Africa com-
modity exports for 2019 accounted for 29% of intra-Africa exports. However, 62%
are exports of petroleum oil. The rest are mainly gold, petroleum gas, ores and con-
centrates and limited agricultural commodities*.
Traded commodities include:
Only 1% of cocoa, 6% of iron ore and 5% of petroleum gas remain on the continent.
On the contrary, almost all wheat, oats, live cattle and soybean oil remain on the
continent.
Gold is mainly exported by Zimbabwe and Ivory Coast; almost all of which destined
for South Africa. Almost all of the crude petroleum oil exports are by Nigeria, while
half of the non-crude exports are from South Africa and Egypt. Algeria and Mozam-
bique account for 82% of intra-Africa petroleum gas exports; 86% of these gas ex-
ports are destined for Morocco, South Africa and Egypt.
Trade in Commodities
Precious metals—gold—2% of intra-Africa exports
Industrial metals—copper, nickel and iron ore—3% of intra-Africa exports
Energy—natural gas and oil—19% of intra-Africa exports
Agriculture—including sugar, maize, palm oil and cocoa—5 % of intra-Africa exports
*Diamonds are excluded here due to it not being a standardised commodity like gold as each diamond has its
own cut, clarity, colour & size that determines its value. Accordingly intra-Africa diamond trade is included
under trade in non-commodity and non-agriculture products.
17
Intra-Africa trade in specific commodities
Sources: ITC Trademap 2020, tralac calculations
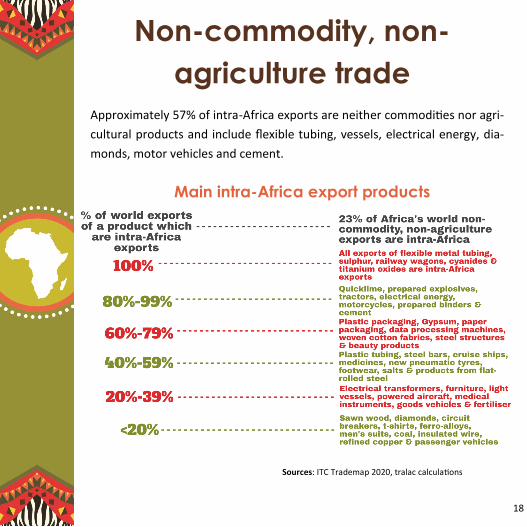
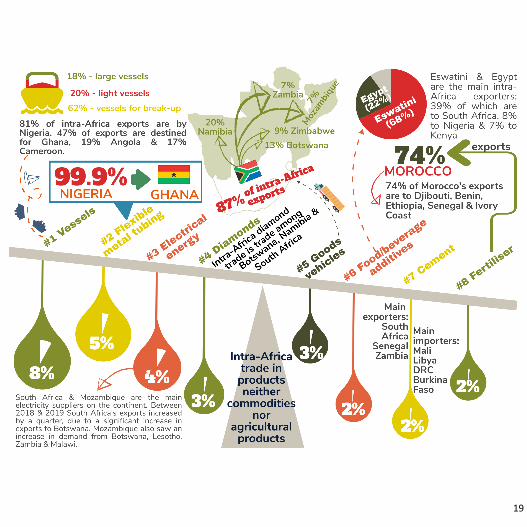
18
Non-commodity, non-
agriculture trade
Main intra-Africa export products
Approximately 57% of intra-Africa exports are neither commodities nor agri-
cultural products and include flexible tubing, vessels, electrical energy, dia-
monds, motor vehicles and cement.
Sources: ITC Trademap 2020, tralac calculations
19
20
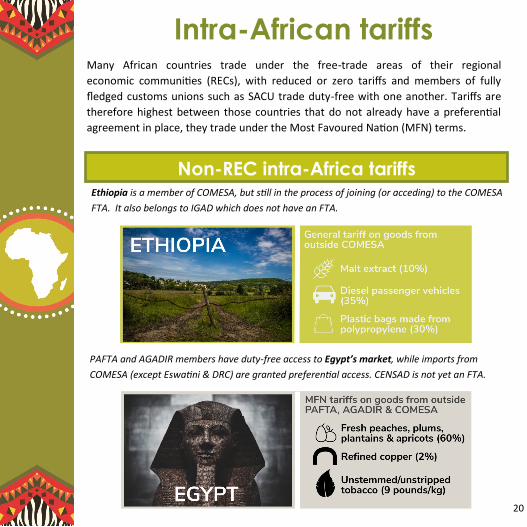
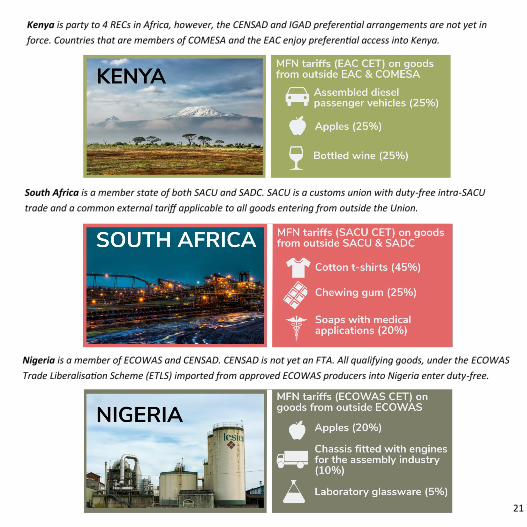
Intra-African tariffs Many African countries trade under the free-trade areas of their regional
economic communities (RECs), with reduced or zero tariffs and members of fully
fledged customs unions such as SACU trade duty-free with one another. Tariffs are
therefore highest between those countries that do not already have a preferential
agreement in place, they trade under the Most Favoured Nation (MFN) terms.
PAFTA and AGADIR members have duty-free access to Egypt’s market, while imports from
COMESA (except Eswatini & DRC) are granted preferential access. CENSAD is not yet an FTA.
Non-REC intra-Africa tariffs Ethiopia is a member of COMESA, but still in the process of joining (or acceding) to the COMESA
FTA. It also belongs to IGAD which does not have an FTA.
21
Nigeria is a member of ECOWAS and CENSAD. CENSAD is not yet an FTA. All qualifying goods, under the ECOWAS
Trade Liberalisation Scheme (ETLS) imported from approved ECOWAS producers into Nigeria enter duty-free.
South Africa is a member state of both SACU and SADC. SACU is a customs union with duty-free intra-SACU
trade and a common external tariff applicable to all goods entering from outside the Union.
Kenya is party to 4 RECs in Africa, however, the CENSAD and IGAD preferential arrangements are not yet in
force. Countries that are members of COMESA and the EAC enjoy preferential access into Kenya.
22
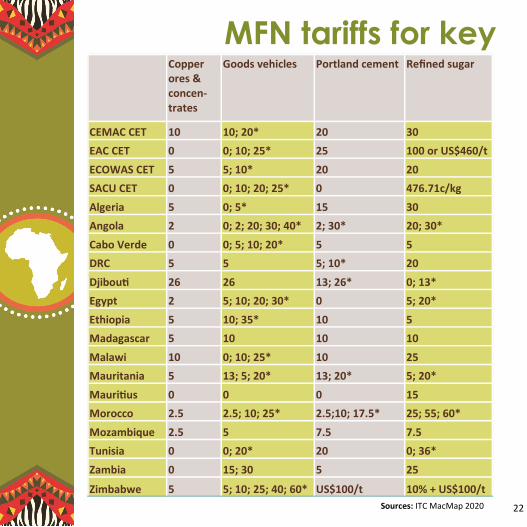
Sources: ITC MacMap 2020
MFN tariffs for key Copper
ores & concen-trates
Goods vehicles Portland cement Refined sugar
CEMAC CET 10 10; 20* 20 30
EAC CET 0 0; 10; 25* 25 100 or US$460/t
ECOWAS CET 5 5; 10* 20 20
SACU CET 0 0; 10; 20; 25* 0 476.71c/kg
Algeria 5 0; 5* 15 30
Angola 2 0; 2; 20; 30; 40* 2; 30* 20; 30*
Cabo Verde 0 0; 5; 10; 20* 5 5
DRC 5 5 5; 10* 20
Djibouti 26 26 13; 26* 0; 13*
Egypt 2 5; 10; 20; 30* 0 5; 20*
Ethiopia 5 10; 35* 10 5
Madagascar 5 10 10 10
Malawi 10 0; 10; 25* 10 25
Mauritania 5 13; 5; 20* 13; 20* 5; 20*
Mauritius 0 0 0 15
Morocco 2.5 2.5; 10; 25* 2.5;10; 17.5* 25; 55; 60*
Mozambique 2.5 5 7.5 7.5
Tunisia 0 0; 20* 20 0; 36*
Zambia 0 15; 30 5 25
Zimbabwe 5 5; 10; 25; 40; 60* US$100/t 10% + US$100/t
23
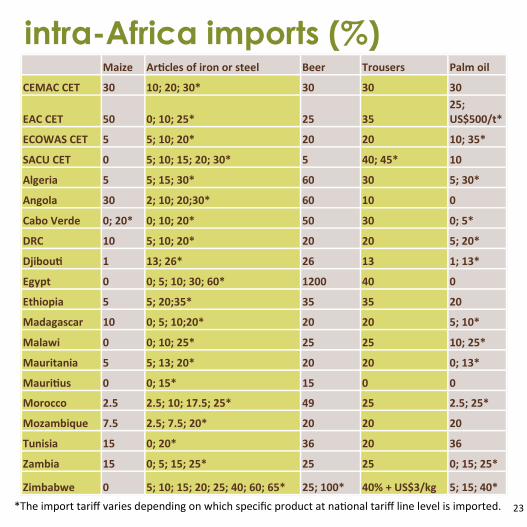
intra-Africa imports (%) Maize Articles of iron or steel Beer Trousers Palm oil
CEMAC CET 30 10; 20; 30* 30 30 30
EAC CET 50 0; 10; 25* 25 35 25; US$500/t*
ECOWAS CET 5 5; 10; 20* 20 20 10; 35*
SACU CET 0 5; 10; 15; 20; 30* 5 40; 45* 10
Algeria 5 5; 15; 30* 60 30 5; 30*
Angola 30 2; 10; 20;30* 60 10 0
Cabo Verde 0; 20* 0; 10; 20* 50 30 0; 5*
DRC 10 5; 10; 20* 20 20 5; 20*
Djibouti 1 13; 26* 26 13 1; 13*
Egypt 0 0; 5; 10; 30; 60* 1200 40 0
Ethiopia 5 5; 20;35* 35 35 20
Madagascar 10 0; 5; 10;20* 20 20 5; 10*
Malawi 0 0; 10; 25* 25 25 10; 25*
Mauritania 5 5; 13; 20* 20 20 0; 13*
Mauritius 0 0; 15* 15 0 0
Morocco 2.5 2.5; 10; 17.5; 25* 49 25 2.5; 25*
Mozambique 7.5 2.5; 7.5; 20* 20 20 20
Tunisia 15 0; 20* 36 20 36
Zambia 15 0; 5; 15; 25* 25 25 0; 15; 25*
Zimbabwe 0 5; 10; 15; 20; 25; 40; 60; 65* 25; 100* 40% + US$3/kg 5; 15; 40*
*The import tariff varies depending on which specific product at national tariff line level is imported.
24
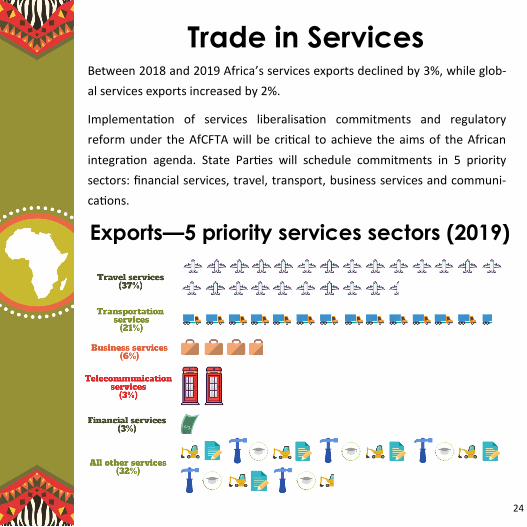
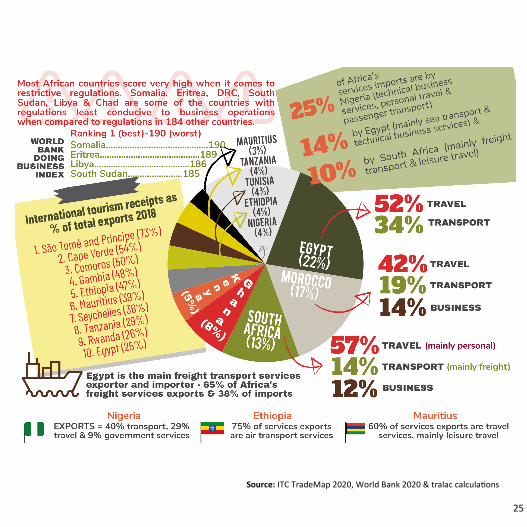
Trade in Services Between 2018 and 2019 Africa’s services exports declined by 3%, while glob-
al services exports increased by 2%.
Implementation of services liberalisation commitments and regulatory
reform under the AfCFTA will be critical to achieve the aims of the African
integration agenda. State Parties will schedule commitments in 5 priority
sectors: financial services, travel, transport, business services and communi-
cations.
Exports—5 priority services sectors (2019)
25
Source: ITC TradeMap 2020, World Bank 2020 & tralac calculations
26
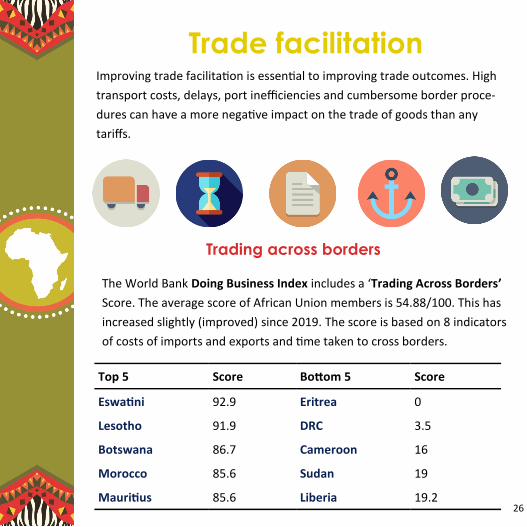
Trade facilitation
Bottom 5 Score Top 5 Score
Eswatini 92.9 Eritrea 0
Lesotho 91.9 DRC 3.5
Botswana 86.7 Cameroon 16
Morocco 85.6 Sudan 19
Mauritius 85.6 Liberia 19.2
The World Bank Doing Business Index includes a ‘Trading Across Borders’
Score. The average score of African Union members is 54.88/100. This has
increased slightly (improved) since 2019. The score is based on 8 indicators
of costs of imports and exports and time taken to cross borders.
Improving trade facilitation is essential to improving trade outcomes. High
transport costs, delays, port inefficiencies and cumbersome border proce-
dures can have a more negative impact on the trade of goods than any
tariffs.
Trading across borders
27
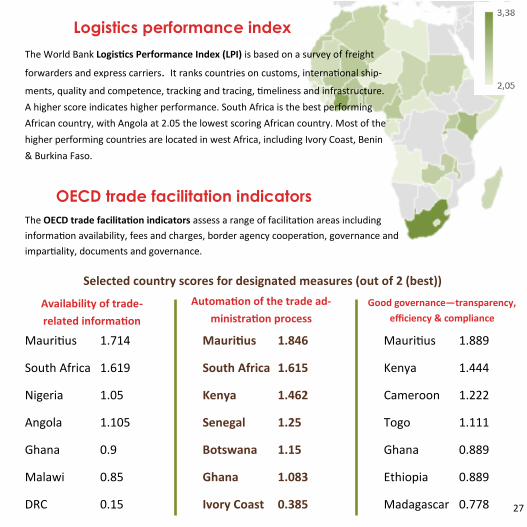
The World Bank Logistics Performance Index (LPI) is based on a survey of freight
forwarders and express carriers. It ranks countries on customs, international ship-
ments, quality and competence, tracking and tracing, timeliness and infrastructure.
A higher score indicates higher performance. South Africa is the best performing
African country, with Angola at 2.05 the lowest scoring African country. Most of the
higher performing countries are located in west Africa, including Ivory Coast, Benin
& Burkina Faso.
OECD trade facilitation indicators
Selected country scores for designated measures (out of 2 (best))
The OECD trade facilitation indicators assess a range of facilitation areas including
information availability, fees and charges, border agency cooperation, governance and
impartiality, documents and governance.
Logistics performance index
Availability of trade-
related information
Automation of the trade ad-
ministration process
Good governance—transparency,
efficiency & compliance
Mauritius 1.714
South Africa 1.619
Nigeria 1.05
Angola 1.105
Ghana 0.9
Malawi 0.85
DRC 0.15
Mauritius 1.846
South Africa 1.615
Kenya 1.462
Senegal 1.25
Botswana 1.15
Ghana 1.083
Ivory Coast 0.385
Mauritius 1.889
Kenya 1.444
Cameroon 1.222
Togo 1.111
Ghana 0.889
Ethiopia 0.889
Madagascar 0.778
28
About tralac
www.tralac.org | [email protected] | @tradelawcentre | Copyright © tralac, 2020
(Trade Law Centre) tralac is a public benefit organisation based in South Africa. We develop technical expertise and capacity in trade governance across Africa.
We are committed to the principles of rules-based governance at the national, regional and international levels. We believe that better governance and strong institutions are essential elements for inclusive and sustainable growth. tralac’s activities are anchored on three pillars.
Readers are encouraged to quote and reproduce this material for educational, non-
profit purposes, provided the source is acknowledged. All views and opinions expressed
remain solely those of the authors and do not purport to reflect the views of tralac. Icons from freepik & smashicons at flaticon.com


