

Gradstein F. M., Ludden, J. N., et al., 1992Proceedings of the Ocean Drilling Program, Scientific Results, Vol. 123
8. GEOCHEMISTRY OF SEDIMENTS IN THE ARGO ABYSSAL PLAIN AT SITE 765:A CONTINENTAL MARGIN REFERENCE SECTION FOR SEDIMENT RECYCLING
IN SUBDUCTION ZONES
Terry Plank2 and John N. Ludden3
ABSTRACT
Drilling at Site 765 in the Argo Abyssal Plain sampled sediments and oceanic crust adjacent to the Australian margin. Someday, this site will be consumed in the Java Trench. An intensive analytical program was conducted to establish this site as ageochemical reference section forcrustal recycling calculations. About 150 sediment samples from Site 765 were analyzed for majorand trace elements. Downhole trends in the sediment analyses agree well with trends in sediment mineralogy, as well as in Al andK logs. The primary signal in the geochemical variability is dilution of a detrital component by both biogenic silica and calciumcarbonate. Although significant variations in the nonbiogenic component occur through time, its overall character is similar to nearbyCanning Basin shales, which are typical of average post-Archean Australian shales (PAAS). The bulk composition of the hole iscalculated using core descriptions to weight the analyses appropriately. However, a remarkably accurate estimate of the bulkcomposition of the hole can be made simply from PAAS and the average calcium carbonate and aluminum contents of the hole.Most elements can be estimated within 30% in this way. This means that estimating the bulk composition of other sections dominatedby detrital and biogenic components may require little analytical effort: calcium carbonate contents, average Al contents, and averageshale values can be taken from core descriptions, geochemical logs, and the literature, respectively. Some of the geochemicalsystematics developed at Site 765 can be extrapolated along the entire Sunda Trench. However, results are general, and Site 765should serve as a useful reference for estimating the compositions of other continental margin sections approaching trenches aroundthe world (e.g., outboard of the Lesser Antilles, Aegean, and Eolian arcs).
INTRODUCTION
The extent to which the continental crust is recycled back intothe mantle via sediment subduction is crucial to our understandingof how Earth's mantle and crust evolved. Primarily, two lines ofevidence support sediment subduction. One is based on seismicsurveys and drilling that show an absence of accreted sedimentsin some forearcs (e.g., in the Marianas: Hussong, Uyeda, et al.,1982; Guatemala: Moore, Backman, et al., 1982; and Peru: Warsiet al., 1983). Even where well-developed accretionary wedgesoccur, often evidence indicates that some sediment is also beingsubducted beneath décollement structures in the wedge (as in theLesser Antilles: Westbrook et al., 1988) or in grabens developedin the bending plate (as for the Nazca Plate approaching thePeru-Chile Trench: Schweller et al., 1981). Thus, ample geophys-ical evidence exists to show that sediment is subducted, at leastbeneath some forearcs.
A second line of evidence for sediment subduction comes fromthe isotope 10Be. An isotope strongly enriched in soils and marineclays, 10Be is found in measurable quantities in arc volcanics, butnot in volcanics from other tectonic settings (Tera et al., 1986).This means that some surface sediments are taken as far as the siteof arc magma genesis (-120 km deep). The factors that lead tosediment subduction in some situations, and not others, are stillpoorly understood (a modern twist on an old soliloquy providesa recent discussion of the various models; Von Huene, 1986).
The issue of how much sediment gets subducted to great depthsremains open. Arc magmas incorporate some quantity of sediment
1 Gradstein, F. M., Ludden, J. N., et al., 1992. Proc. ODP, Sci. Results, 123:College Station, TX (Ocean Drilling Program).
2 Lamont-Doherty Geological Observatory and Department of GeologicalSciences of Columbia University, Palisades, NY 10964, U.S.A.
3 Département de Géologie, Université de Montreal, C.P. 6128 Succ. A, Mon-treal, Quebec, H3C 3J7, Canada.
and provide our best means for estimating the fluxes involved.However, these calculations require knowledge of the geochemi-cal characteristics of both the influx (sediment and crust ap-proaching trenches) and the output (arc volcanics). Although afairly comprehensive global data base exists of the geochemicalcomposition of arc volcanics, a method has yet to be developedfor estimating the composition of the diverse sediment sectionsapproaching trenches. A considerable amount of geochemicaldata exist for marine sediments. Most chemical analyses of sedi-ments, however, consist of a few elements specific to oceano-graphic problems, and not necessarily solid earth ones. These dataprovide a first-order understanding of the systematics of sedimentcompositions, but do not constrain well what compositions areappropriate for individual subduction zones. Estimates of sedi-ment compositions outboard of trenches usually are based onanalyses of a few surface sediments, whole-ocean averages, oraverage "pelagic sediment." These estimates need to be refined.For example, elements that are used as tracers for sediment in-fluxes to arc magma sources (e.g., K2O; Karig and Kay, 1980)may vary considerably in "pelagic sediments," on the order of alligneous rocks on the face of Earth. This is because sedimentsrepresent mixtures of biogenic carbonate or silica, which aredevoid of most trace elements, and continental detritus or Fe-Mnoxides, which are rich in many trace metals. Thus, although ratiosof certain elements and isotopic compositions of sediments arefairly well constrained, the actual element abundances may varyenormously. Ultimately, it is concentration data, not element orisotopic ratios, that are necessary for answering the question ofhow much!
Here, we discuss the geochemistry of the sedimentary sectionof Site 765, drilled during Leg 123 in the Argo Abyssal Plain,south of Java. These sediments may someday be consumed in theSunda Trench. Full characterization of potential crustal fluxesinto the Sunda Trench should include other sedimentary compo-nents that may be added to Site 765 as it drifts northward: volcanicash derived from the arc itself and clastic material derived from
167

T. PLANK, J. N. LUDDEN
the Ganges-Brahmaputra river system via the Nicobar Fan. Inaddition to sedimentary components, the chemical additions to thebasaltic substrate via seawater alteration constitutes another crus-tal component. Gillis et al. (this volume) present some preliminaryconclusions regarding the geochemical fluxes involved duringalteration of the basaltic crust at Site 765.
Although the data presented here have obvious bearing onproblems specific to the Sunda Arc as well as to the sedimen-tological history of the Australian margin, the thrust of this studyis more general: to provide a reference data set for sedimentsubduction globally. Indeed, Site 765 represents an end-memberof sorts. The site is situated adjacent to a passive margin, and sorepresents the crust first formed when an ocean basin opens, andthe last consumed when an ocean basin disappears down a sub-duction zone. The sediments that have accumulated at Site 765are dominated by detrital material derived from the Australiancontinent. Thus, Site 765 should serve as a reference site for othersubduction zones proximal to continental sediment sources (e.g.,the Lesser Antilles, the American, and the Eolian/Aegean arcs).We hope to provide here a methodology for constraining sedimentinflux to this class of subduction zones, and in doing so, to beginto answer the question of how much?
First, we present a geochemical stratigraphy of Site 765 sedi-ments, attempt to tie the geochemical variability to the lithologicvariability, and briefly speculate about the provenance of thesediments. Next, we devise a method for estimating the bulkcomposition of the entire sediment section. Finally, we discussthe relevance of this site to sedimentary sections globally, as wellas regionally along the Sunda Arc.
GEOLOGIC BACKGROUND
Site 765 is situated in the Argo Abyssal Plain, a triangularregion of some of the oldest crust of the Indian Ocean, sandwichedbetween the northwestern margin of Australia and the Java Trench(see Fig. 1). The crust drilled at Site 765 represents the firstoceanic crust formed during rifting of the Australian margin inthe Earliest Cretaceous. This site is now only 500 km away frombeing consumed at the Sunda Trench, south of Java. The sedimen-tary section that has accumulated is thin for a passive marginsequence owing to the arid climate and low relief of westernAustralia. Although several active and explosive volcanoes arelocated on Java and the Lesser Sunda Islands, Site 765 has yet toenter the region of extensive ash falls determined by Ninkovich(1979). Thus, the ultimate source of much of the sediment at Site765 is the Pilbara and Kimberly blocks of northwestern Australiacraton, which are Archean to Proterozoic in age (Fig. 1). AlthoughSite 765 is at abyssal depths, sedimentation rates have been higherthan typical abyssal rates (see Ludden, Gradstein, et al., 1990),especially during the Neogene (averaging 27 m/m.y.) due to thecontinual supply of material from the Australian Shelf andExmouth Plateau via turbidity flows. Even though well below thecalcite compensation depth, the hole has a high carbonate contentowing to the rapid influx and burial of pelagic carbonates fromthe Australian margin.
At Site 765, roughly 950 m of sediment was cored above thebasaltic basement. The sedimentary section can be divided in two,corresponding grossly to the Cenozoic and Cretaceous sections.The Cenozoic section is dominated by calcareous turbidites, prob-
IIO°EFigure 1. Location map of Site 765 with simplified geology of northwestern Australia. Water depth contoursin meters.
168
GEOCHEMISTRY REFERENCE SECTION FOR SEDIMENT RECYCLING
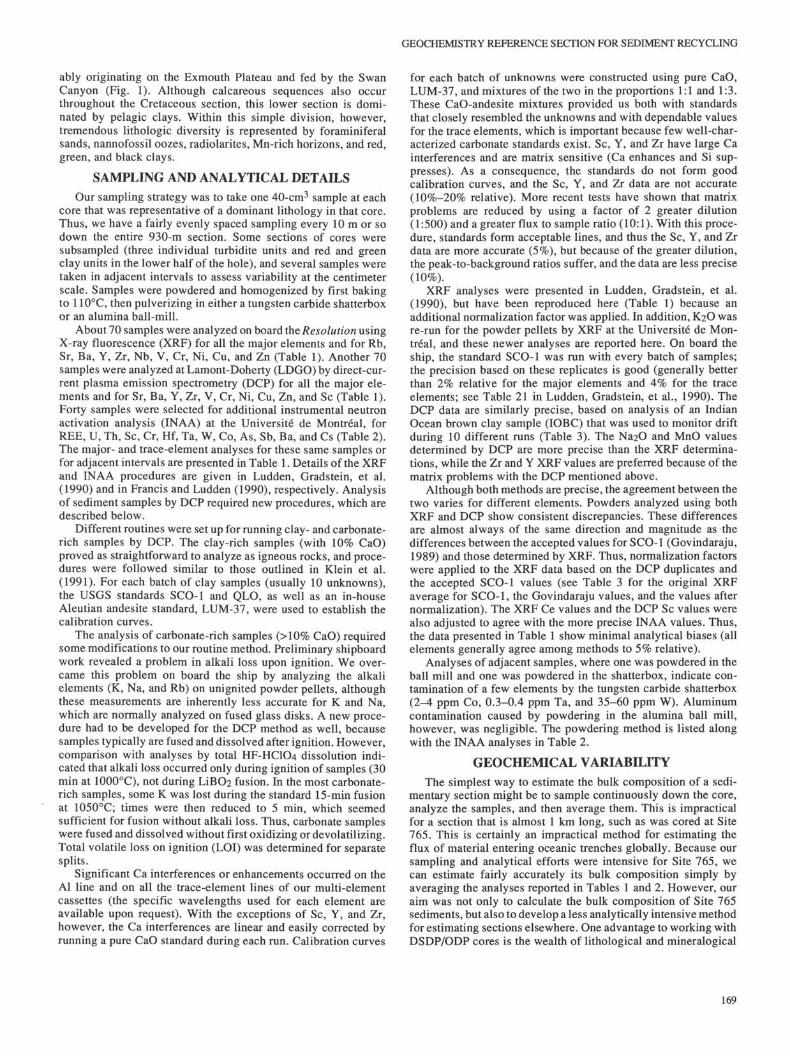
ably originating on the Exmouth Plateau and fed by the SwanCanyon (Fig. 1). Although calcareous sequences also occurthroughout the Cretaceous section, this lower section is domi-nated by pelagic clays. Within this simple division, however,tremendous lithologic diversity is represented by foraminiferalsands, nannofossil oozes, radiolarites, Mn-rich horizons, and red,green, and black clays.
SAMPLING AND ANALYTICAL DETAILSOur sampling strategy was to take one 40-cm3 sample at each
core that was representative of a dominant lithology in that core.Thus, we have a fairly evenly spaced sampling every 10 m or sodown the entire 930-m section. Some sections of cores weresubsampled (three individual turbidite units and red and greenclay units in the lower half of the hole), and several samples weretaken in adjacent intervals to assess variability at the centimeterscale. Samples were powdered and homogenized by first bakingto 110°C, then pulverizing in either a tungsten carbide shatterboxor an alumina ball-mill.
About 70 samples were analyzed on board the Resolution usingX-ray fluorescence (XRF) for all the major elements and for Rb,Sr, Ba, Y, Zr, Nb, V, Cr, Ni, Cu, and Zn (Table 1). Another 70samples were analyzed at Lamont-Doherty (LDGO) by direct-cur-rent plasma emission spectrometry (DCP) for all the major ele-ments and for Sr, Ba, Y, Zr, V, Cr, Ni, Cu, Zn, and Sc (Table 1).Forty samples were selected for additional instrumental neutronactivation analysis (INAA) at the Université de Montreal, forREE, U, Th, Sc, Cr, Hf, Ta, W, Co, As, Sb, Ba, and Cs (Table 2).The major- and trace-element analyses for these same samples orfor adjacent intervals are presented in Table 1. Details of the XRFand INAA procedures are given in Ludden, Gradstein, et al.(1990) and in Francis and Ludden (1990), respectively. Analysisof sediment samples by DCP required new procedures, which aredescribed below.
Different routines were set up for running clay- and carbonate-rich samples by DCP. The clay-rich samples (with 10% CaO)proved as straightforward to analyze as igneous rocks, and proce-dures were followed similar to those outlined in Klein et al.(1991). For each batch of clay samples (usually 10 unknowns),the USGS standards SCO-1 and QLO, as well as an in-houseAleutian andesite standard, LUM-37, were used to establish thecalibration curves.
The analysis of carbonate-rich samples (>10% CaO) requiredsome modifications to our routine method. Preliminary shipboardwork revealed a problem in alkali loss upon ignition. We over-came this problem on board the ship by analyzing the alkalielements (K, Na, and Rb) on unignited powder pellets, althoughthese measurements are inherently less accurate for K and Na,which are normally analyzed on fused glass disks. A new proce-dure had to be developed for the DCP method as well, becausesamples typically are fused and dissolved after ignition. However,comparison with analyses by total HF-HCIO4 dissolution indi-cated that alkali loss occurred only during ignition of samples (30min at 1000°C), not during LiBθ2 fusion. In the most carbonate-rich samples, some K was lost during the standard 15-min fusionat 1050°C; times were then reduced to 5 min, which seemedsufficient for fusion without alkali loss. Thus, carbonate sampleswere fused and dissolved without first oxidizing or devolatilizing.Total volatile loss on ignition (LOI) was determined for separatesplits.
Significant Ca interferences or enhancements occurred on theAl line and on all the trace-element lines of our multi-elementcassettes (the specific wavelengths used for each element areavailable upon request). With the exceptions of Sc, Y, and Zr,however, the Ca interferences are linear and easily corrected byrunning a pure CaO standard during each run. Calibration curves
for each batch of unknowns were constructed using pure CaO,LUM-37, and mixtures of the two in the proportions 1:1 and 1:3.These CaO-andesite mixtures provided us both with standardsthat closely resembled the unknowns and with dependable valuesfor the trace elements, which is important because few well-char-acterized carbonate standards exist. Sc, Y, and Zr have large Cainterferences and are matrix sensitive (Ca enhances and Si sup-presses). As a consequence, the standards do not form goodcalibration curves, and the Sc, Y, and Zr data are not accurate(10%-20% relative). More recent tests have shown that matrixproblems are reduced by using a factor of 2 greater dilution(1:500) and a greater flux to sample ratio (10:1). With this proce-dure, standards form acceptable lines, and thus the Sc, Y, and Zrdata are more accurate (5%), but because of the greater dilution,the peak-to-background ratios suffer, and the data are less precise(10%).
XRF analyses were presented in Ludden, Gradstein, et al.(1990), but have been reproduced here (Table 1) because anadditional normalization factor was applied. In addition, K2O wasre-run for the powder pellets by XRF at the Université de Mon-treal, and these newer analyses are reported here. On board theship, the standard SCO-1 was run with every batch of samples;the precision based on these replicates is good (generally betterthan 2% relative for the major elements and 4% for the traceelements; see Table 21 in Ludden, Gradstein, et al., 1990). TheDCP data are similarly precise, based on analysis of an IndianOcean brown clay sample (IOBC) that was used to monitor driftduring 10 different runs (Table 3). The Na2θ and MnO valuesdetermined by DCP are more precise than the XRF determina-tions, while the Zr and Y XRF values are preferred because of thematrix problems with the DCP mentioned above.
Although both methods are precise, the agreement between thetwo varies for different elements. Powders analyzed using bothXRF and DCP show consistent discrepancies. These differencesare almost always of the same direction and magnitude as thedifferences between the accepted values for SCO-1 (Govindaraju,1989) and those determined by XRF. Thus, normalization factorswere applied to the XRF data based on the DCP duplicates andthe accepted SCO-1 values (see Table 3 for the original XRFaverage for SCO-1, the Govindaraju values, and the values afternormalization). The XRF Ce values and the DCP Sc values werealso adjusted to agree with the more precise INAA values. Thus,the data presented in Table 1 show minimal analytical biases (allelements generally agree among methods to 5% relative).
Analyses of adjacent samples, where one was powdered in theball mill and one was powdered in the shatterbox, indicate con-tamination of a few elements by the tungsten carbide shatterbox(2-4 ppm Co, 0.3-0.4 ppm Ta, and 35-60 ppm W). Aluminumcontamination caused by powdering in the alumina ball mill,however, was negligible. The powdering method is listed alongwith the INAA analyses in Table 2.
GEOCHEMICAL VARIABILITY
The simplest way to estimate the bulk composition of a sedi-mentary section might be to sample continuously down the core,analyze the samples, and then average them. This is impracticalfor a section that is almost 1 km long, such as was cored at Site765. This is certainly an impractical method for estimating theflux of material entering oceanic trenches globally. Because oursampling and analytical efforts were intensive for Site 765, wecan estimate fairly accurately its bulk composition simply byaveraging the analyses reported in Tables 1 and 2. However, ouraim was not only to calculate the bulk composition of Site 765sediments, but also to develop a less analytically intensive methodfor estimating sections elsewhere. One advantage to working withDSDP/ODP cores is the wealth of lithological and mineralogical
169

Table 1. Analyses of major and trace elements in Site 765 sediments. Table 1 (continued).
© 123-765B
Depth:Color:
Lithology:Method:
SiO2TiO2
AI2O3FeO
MnO
MgO
CaO
Na2OK2O
P2O5LOI
CaC03C (Org)
Nb
ZrY
Sr
Rb
Zn
Cu
Ni
Cr
V
Ce
Ba
Sc
123-765B
Depth:Color:
Lithology:Method:
SiO2TiO2
AI2O3FeO
MnO
MgO
CaO
Na20K2O
P2O5LOI
CaCO3C (Org)
Nb
Zr
Y
Sr
RbZnCuNiCrV
Ce
Ba
Sc
1H-4,48-50
4.98Lt ol grayCc. ooze
XRF
22.71.3016.692.54.1982.01
30.97.67
1.26.16432.5
55.23.63
4.7
57.217.2
195451.371.298.7
47
43.358
22.2671
3H-1,33-3519.13
Lt oliveCc. 00Z3
XRF
14.28.2034.401.56.3451.14
40.16.02
.75
.13437.0070.64
.22
3.3
38.515.5138128.743.162.1
31
31.839
6.2
902
2H-3,94-106
13.24Lt ol grayCc. OOZΘ
XRF
23.80.2955.782.08.5151.53
32.39.27
.98
.15232.2156.06
.51
4.9
79.620.9117141.365.1
110.295
34.552
22.51033
4H-3,145-150
32.95
DCP
41.99.538
11.163.57.1002.05
16.791.671.87.120
19.14
150.917.9531
90.5231.2
143
56.8118
750
9.1
2H-3,123-135
13.53Ol gray
ClayXRF
54.26.725
15.025.63.3303.502.214.012.65.16611.53.42
.82
10.3135.2
26.2204
113.7172.7261.8
130
82.7132
46.21383
4H-6,20-2236.20
Red grayClayXRF
56.28.739
14.785.45
1.2173.28
.83
3.752.42.105
11.152.42
.91
10.2150.4
30.8171
100.6142.0192.6
153
77.6110
55.31609
2H-3,145-150
13.75Ol gray
ClayDCP
59.13.742
16.165.11.1122.98
.63
2.762.76.1409.47
143.028.5
143
85.3283.6
152
80.1145
129515.6
4H-6,23-3036.23
Red grayClayDCP
56.97.704
14.886.35.2653.30
.67
3.612.70.115
10.45
145.328.7
163
44.8385.2
324
71.1209
128216.7
2H-4,7-19
13.87Ol gray
ClayXRF
54.15.695
14.514.86.1312.993.633.902.47.15512.55.41
.98
9.8
139.927.1244
104.2158.0223.3
133
82.7114
56.41328
5H-7,40-4247.50
Lt oliveCc. sand
XRF
14.25.1532.951.24.0801.10
41.55.09
.62
.06637.9074.47
.13
2.5
44.79.9
102222.029.946.7
20
16.926
16.8341
2H-4,31-4314.11
Lt oliveCc. OOZΘ
XRF
14.76.2094.341.46.3791.57
39.29.26
.78
.18736.7767.81
.74
3.4
43.516.7
160932.454.389.9
42
33.549
5.8
791
7H-3,38-4360.78
Lt ol grayCc. ooze
XRF
15.25.2274.561.63.1181.75
39.40.44
.85
.17635.6070.31
.58
3.7
46.914.3196731.444.751.7
29
38.641
16.8482
2H-4,91-103
14.71Lt olive
Cc. OOZΘ
XRF
8.74.0971.61
.90
.265.73
46.80.09
.37
.06440.3381.38
.13
1.3
34.06.8
111712.925.441.0
29
6.6
17
3.7
301
8H-6,85-9075.45
Lt ol grayCc. ooze
XRF
28.55.4038.703.22.1222.46
26.461.401.31.142
27.2546.90
.29
6.2
80.920.7998
61.981.3
102.352
49.865
24.61110
2H-4,131-143
15.11Ol gray
ClayXRF
57.50.781
15.925.25.1253.15
.97
3.972.48.1069.751.00
.67
10.9152.8
25.1154
109.6133.6303.6
97
80.3120
53.91099
9H-6,104-105
85.34Gr gray
Cc. oozeXRF
23.16.3517.322.67.1182.51
30.731.081.23.186
30.6555.31
.66
5.1
62.119.0133053.273.974.0
39
51.660
19.3758
2H-6,138-140
18.18Ol gray
ClayXRF
56.68.746
15.385.51.1633.52
.59
4.232.53.127
10.52.58
.72
10.5143.0
25.2152
107.9156.0250.8
143
76.0101
50.31262
10H-3,145-150
90.85
DCP
22.43.3376.042.22.1841.47
34.74.94
1.13.143
31.13
99.720.21142
51.260.3
30
33.442
689
5.7
2H-6,140-142
18.20Ol gray
ClayDCP
56.89.738
15.785.49.1813.37
.57
4.092.81.1449.93
141.226.3
153
42.7193.4
173
85.0117
131417.7
10H-5,89-9593.29
Ltgy blueClayDCP
56.18.889
18.866.47.0443.98
.36
2.073.29.1387.73
198.533.1
160
118.8172.7
95
116.6142
699
18.2
123-765B
Depth:Color:
Lithology:Method:
SiO2TiO2
AI2O3FeO
MnO
MgO
CaO
Na2OK2O
P2O5LOI
CaCO3C (Org)
Nb
Zr
Y
Sr
RbZnCu
Ni
Cr
V
Cθ
Ba
Sc
123-765B
Depth:Color:
Lithology:Method:
SiO2TiO2
AI2O3FeO
MnO
MgO
CaO
Na2OK2O
P2O5LOI
CaCO3C (Org)
Nb
Zr
Y
Sr
RbZnCu
Ni
Cr
V
Cβ
Ba
S c
11H-2,40-4497.90
Lt ol grayCc. ooze
XRF
23.07.3386.552.39.1031.88
33.40.64
1.34.18730.1
61.89.15
4.7
80.019.0
122948.360.258.0
36
44.058
20.1597
15H-3,32-44
137.82Gy olive
ClayXRF
53.89.971
19.077.45.0394.07
.59
1.783.45.1398.561.17
.29
13.1190.4
28.3222
147.8140.7324.9
86
127.3134
69.8810
12H-4,44-48
110.54Lt ol grayCc. coze
XRF
16.17.2594.991.78.1501.32
39.98.35
.85
.15834
69.81.04
4.1
62.216.0
133631.935.148.6
26
35.542
14.1546
15H-5,23-27
140.73Gr gray
Cc. clayXRF
35.56.596
11.824.72.0512.59
20.68.56
2.52.112
20.8036.49
.31
8.1
115.819.6
112899.271.533.6
35
73.985
43.4351
12H-6,105-110
114.15Ol gray
ClayXRF
56.42.967
19.166.93.0483.64
.52
1.263.07.171
7.8
.50
.27
13.8208.9
32.2206
133.1125.7101.2
56
113.3118
65.3820
15H-5,49-54
140.99Lt ol grayCc. ooze
XRF
58.81.19
5.5
70.915.8
132557.753.942.6
2251.7
5625.5633
13H-2,138-143
118.08Lt ol grayCc. OOZΘ
XRF
20.29.3356.792.50.1021.79
34.49.77
1.23.20131.5
60.89.31
5.1
74.715.1
150648.351.552.8
47
49.553
25.5378
15H-5,116-121
141.66Lt gr grayCc. ooze
XRF
21.69.3597.912.80.0841.64
32.88.65
1.29.113
30.6058.48
.11
5.9
73.614.8130655.951.564.5
26
45.656
33.0591
14H-4,83-87
130.13Lt ol grayCc. OOZΘ
XRF
20.93.3497.502.73.0951.65
34.36.27
1.37.13730.6
62.31.12
5.6
70.414.2
134254.448.454.4
24
47.053
23.0513
15H-7,52-56
144.02Lt ol grayCc. sand
XRF
24.42.3417.052.53.0741.44
32.30.62
1.31.123
29.8057.48
.13
5.5
96.916.0
114349.247.064.4
25
42.751
26.7490
15H-2,76-88
136.76Lt ol grayCc. sand
XRF
22.80.3285.812.48.0671.68
34.17.75
1.17.156
30.5960.00
.30
4.4
88.017.7
202445.845.270.5
36
61.563
20.7289
16H-1,42-46
144.62Lt ol grayCc. sand
XRF
25.16.3346.662.43.0821.43
32.62.46
1.23.106
29.5057.23
.13
5.5
94.015.2113046.745.661.4
21
41.550
28.5462
15H-2,88-100136.88Ol gray
ClayXRF
54.56.971
19.427.51.0393.60
.41
1.893.18.1598.26
.50
.29
13.5199.2
30.1214
139.8117.3260.3
63
125.8150
66.2748
16H-1,42-46
144.62Lt ol grayCc. sand
DCP
24.44.3436.772.49.0831.29
32.251.091.15.113
30.26
97.615.61107
49.049.4
25
43.656
435
6.3
15H-2,115-127
137.15Lt ol grayCc. ooze
XRF
18.50.2946.342.41.1491.48
36.00.66
1.31.109
32.7363.47
.05
4.5
66.117.2140348.846.437.2
18
36.744
22.5687
16H-1,42-46
144.62Lt ol grayCc. sand
DCP
24.20.3306.732.43.0801.26
31.981.101.15.100
29.50
94.815.91106
45.347.3
20
38.646
432
7.1
15H-3,1-13
137.51Lt gr yβl
Cc. OOZΘXRF
21.20.3195.822.46.1301.44
34.84.68
1.25.15931.7
59.64.24
4.6
88.919.8
119245.443.344.6
19
31.146
20.2557
16H-1,42-46
144.62Lt ol grayCc. sand
DCP
24.45.3406.762.50.0841.32
32.841.101.15.100
30.26
99.015.61106
47.448.9
25
48.960
430
7.2
15H-3,20-32
137.70Lt ol grayCc. sand
XRF
14.82.1903.171.25.094
.92
41.79.33
.70
.11136.6473.22
.08
2.9
68.612.8104224.929.157.8
17
31.033
12.7316
17H-5,63-65
160.53Lt ol grayCc. sand
XRF
39.75.2002.731.62.048
.48
29.45.50
.95
.07124.2051.98
.08
4.1
112.87.9
782
26.419.850.1
29
9.2
27
15.5251
zr
oFΠ
Z
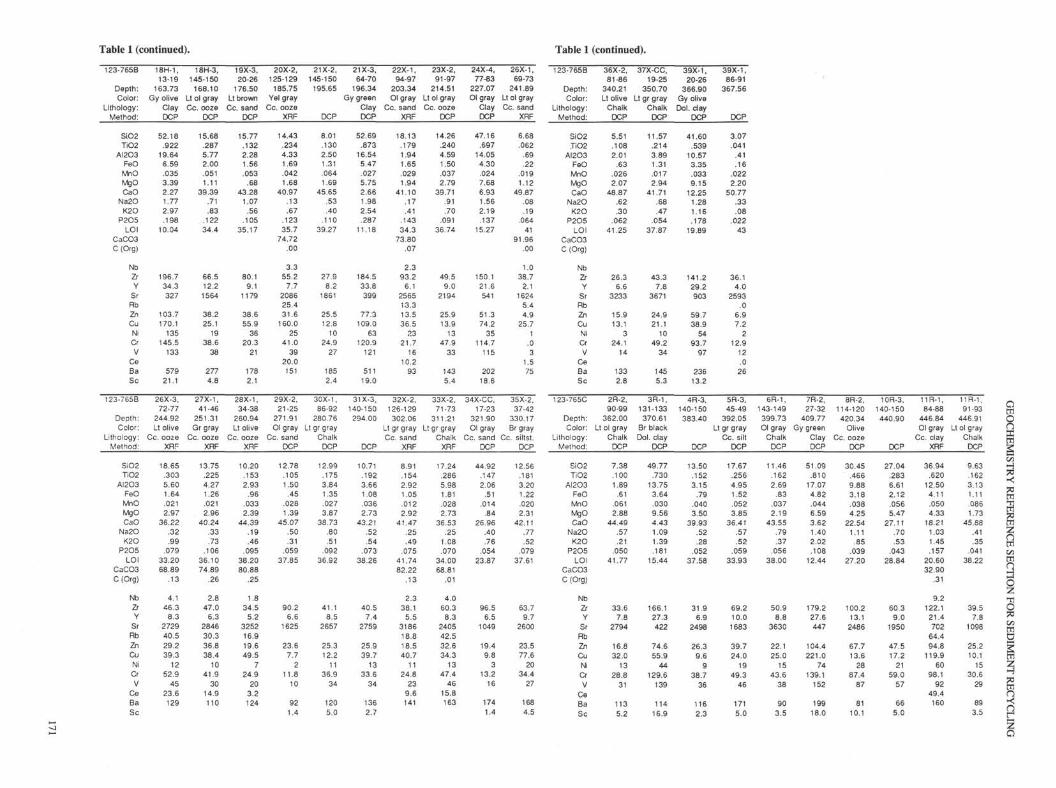
Table 1 (continued). Table 1 (continued).
123-765B
Depth:Color:
Lithology:Method:
SiO2TiO2
AI2O3FeO
MnO
MgO
CaO
Na2OK2O
P2O5LOI
CaC03C (Org)
Nb
Zr
Y
Sr
Rb
Zn
Cu
Ni
Cr
V
Ce
Ba
Sc
123-765B
Depth:Color:
Lithology:Method:
SiO2TiO2
AI2O3FeO
MnO
MgO
CaO
Na2OK2O
P2O5LOI
CaCO3C (Org)
Nb
Zr
Y
Sr
RbZnCu
Ni
Cr
V
Ce
Ba
Sc
18H-1,13-19
163.73Gy olive
ClayDCP
52.18.922
19.646.59.0353.392.271.772.97.198
10.04
196.734.3327
103.7170.1
135
145.5133
579
21.1
26X-3,72-77
244.92Lt olive
Cc. oozeXRF
18.65.3035.601.64.0212.97
36.22.32
.99
.07933.2068.89
.13
4.1
46.38.3
272940.529.239.3
12
52.945
23.6129
18H-3,145-150
168.10Lt ol grayCc. ooze
DCP
15.68.2875.772.00.0511.11
39.39.71
.83
.12234.4
66.512.2
1564
38.225.1
19
38.638
277
4.8
27X-1,41-46
251.31Gr gray
Cc. oozeXRF
13.75.2254.271.26.0212.96
40.24.33
.73
.10636.1074.89
.26
2.8
47.06.3
284630.336.838.4
10
41.930
14.9110
19X-3,20-26
176.50Lt brown
Cc. sandDCP
15.77.1322.281.56.053
.68
43.281.07
.56
.10535.17
80.19.1
1179
38.655.9
36
20.321
178
2.1
28X-1,34-38
260.94Lt olive
Cc. oozeXRF
10.20.1532.93
.96
.0332.39
44.39.19
.46
.09538.2080.88
.25
1.8
34.55.2
325216.919.649.5
7
24.920
3.2
124
20X-2,125-129
185.75Yel gray
Cc. oozeXRF
14.43.2344.331.69.0421.68
40.97.13
.67
.12335.7
74.72.00
3.3
55.27.7
208625.431.6
160.025
41.039
20.0151
29X-2,21-25
271.91Ol gray
Cc. sandDCP
12.78.1051.50
.45
.0281.39
45.07.50
.31
.05937.85
90.26.6
1625
23.67.7
2
11.810
92
1.4
21X-2,145-150
195.65
DCP
8.01.1302.501.31.0641.69
45.65.53
.40
.11039.27
27.98.2
1861
25.512.8
10
24.927
185
2.4
30X-1,86-92
280.76Lt gr gray
ChalkDCP
12.99.1753.841.35.0273.87
38.73.80
.51
.09236.92
41.18.5
2657
25.312.2
11
36.934
120
5.0
21X-3,64-70
196.34Gy green
ClayDCP
52.69.873
16.545.47.0275.752.661.982.54.287
11.18
184.533.8399
77:3109.0
63
120.9121
511
19.0
31X-3,140-150
294.00
DCP
10.71.1923.661.08.0362.73
43.21.52
.54
.07338.26
40.57.4
2759
25.939.7
13
33.634
136
2.7
22X-1,94-97
203.34Olgray
Cc. sandXRF
18.13.1791.941.65.0291.94
41.10.17
.41
.14334.3
73.80.07
2.3
93.26.1
256513.313.536.5
23
21.716
10.29 3
32X-2,126-129
302.06Lt gr grayCc. sand
XRF
8.91.1542.921.05.0122.92
41.47.25
.49
.07541.7482.22
.13
2.3
38.15.5
318618.818.540.7
11
24.823
9.6
141
23X-2,91-97
214.51Lt ol grayCc. ooze
DCP
14.26.2404.591.50.0372.79
39.71.91
.70
.09136.74
49.59.0
2194
25.913.9
13
47.933
143
5.4
33X-2,71-73
311.2.1Lt gr gray
ChalkXRF
17.24.2865.981.81.0282.73
36.53.25
1.08.070
34.0068.81
.01
4.0
60.38.3
240542.532.634.3
13
47.446
15.8163
24X-4,77-83
227.07Ol gray
ClayDCP
47.16.697
14.054.30.0247.686.931.562.19.137
15.27
150.121.6541
51.374.2
35
114.7115
202
18.6
34X-CC,17-23
321.90Ol gray
Cc. sandDCP
44.92.1472.06
.51
.014.84
26.96.40
.76
.05423.87
96.56.5
1049
19.49.8
3
13.216
174
1.4
26X-1,69-73
241.89Lt ol grayCc. sand
XRF
6.68.062
.69
.22
.0191.12
49.87.08
.19
.06441
91.96.00
1.0
38.72.1
16245.4
4.9
25.71
.0
3
1.5
75
35X-2,37-42
330.17Br gray
Cc. siltst.DCP
12.56.1813.201.22.0202.31
42.11.77
.52
.07937.61
63.79.7
2600
23.577.6
2034.4
27
168
4.5
123-765B
Depth:Color:
Lithology:Method:
SiO2JiO2
AI2O3FeO
MnO
MgO
CaO
Na2OK2O
P2O5LOI
CaCO3C (Org)
Nb
Zr
Y
Sr
Rb
Zn
Cu
Ni
Cr
V
Ce
Ba
Sc
123-765C
Depth:Color:
Lithology:Method:
SiO2TiO2
AI2O3FeO
MnO
MgO
CaO
Na2OK2O
P2O5LOI
CaCO3C (Org)
Nb
Zr
Y
SrRbZnCu
Ni
Cr
V
Ce
Ba
Sc
36X-2,81-86
340.21Lt olive
ChalkDCP
5.51.1082.01
.63
.0262.07
48.87.62
.30
.06241.25
26.36.6
3233
15.913.1
3
24.114
133
2.8
2R-2,90-99
362.00Lt ol gray
ChalkDCP
7.38.1001.89
.61
.0612.88
44.49.57
.21
.05041.77
33.67.8
2794
16.832.0
13
28.831
113
5.2
37X-CC,19-25
350.70Lt gr gray
ChalkDCP
11.57.2143.891.31.0172.94
41.71.68
.47
.05437.87
43.37.8
3671
24.921.1
10
49.234
145
5.3
3R-1,131-133
370.61Br blackDol. clay
DCP
49.77.730
13.753.64.0309.564.431.091.39.181
15.44
166.127.3422
74.655.9
44
129.6139
114
16.9
39X-1,20-26
366.90Gy olive
Dol. dayDCP
41.60.539
10.573.35.0339.15
12.251.281.16.178
19.89
141.229.2903
59.738.9
54
93.797
236
13.2
4R-3,140-150
383.40
DCP
13.50.1523.15
.79
.0403.50
39.93.52
.28
.05237.58
31.96.9
2498
26.39.6
9
38.736
116
2.3
39X-1,86-91
367.56
DCP
3.07.041
.41
.16
.0222.20
50.77.33
.08
.02243
36.14.0
2593.0
6.9
7.2
2
12.912
.0
26
5R-3,45-49
392.05Lt gr gray
Cc. siltDCP
17.67.2564.951.52.0523.85
36.41.57
.52
.05933.93
69.210.01683
39.724.0
19
49.346
171
5.0
6R-1,143-149
399.73Ol gray
ChalkDCP
11.46.1622.69
.83
.0372.19
43.55.79
.37
.05638.00
50.98.8
3630
22.125.0
15
43.638
90
3.5
7R-2,27-32
409.77Gy green
ClayDCP
51.09.810
17.074.82.0446.593.621.402.02.108
12.44
179.227.6447
104.4221.0
74
139.1152
199
18.0
8R-2,114-120
420.34Olive
Cc. oozeDCP
30.45.4669.883.18.0384.25
22.541.11
.85
.03927.20
100.213.1
2486
67.713.6
28
87.487
81
10.1
10R-3,140-150
440.90
DCP
27.04.2836.612.12.0565.47
27.11.70
.53
.04328.84
60.39.0
1950
47.517.2
21
59.057
66
5.0
11R-1,84-88
446.84Ol gray
Cc. clayXRF
36.94.620
12.504.11.0504.33
18.211.031.45.157
20.6032.90
.31
9.2
122.121.4702
64.494.8
119.960
98.192
49.4160
11R-1,91-93
446.91Lt ol gray
ChalkDCP
9.63.1623.131.11.0861.73
45.88.41
.35
.04138.22
39.57.8
1098
25.210.1
15
30.629
89
3.5
O
o
IST
RY
I;F
ER
E
mCΛW
GSz"iiO73CΛ
mö9
o
XIN
G

Table 1 (continued). Table 1 (continued).
ts> 123-765C
Depth:Color:
Lithology:Method:
SiO2TiO2
AI2O3FeO
MnOMgOCaO
Na2OK2O
P2O5LOI
CaCO3C (Org)
NbZrY
SrRbZnCuNiCrV
CeBaSc
123-765C
Depth:Color:
Lithology:Method:
SiO2TiO2
AI2O3FeOMnOMgOCaO
Na2OK2O
P2O5LOI
CaC03C (Org)
NbZrY
SrRbZnCuNiCrV
CeBaSc
11R-1,93-96
446.93Lt ol gray
ChalkDCP
9.23.1582.991.09.0961.68
46.38.38.34
.04238.37
36.96.8
1069
25.79.713
29.026
973.4
17R-2,66-68
504.56Lt brown
Cc. oozaXRF
25.48.4549.393.61.2481.04
30.37.72.94
.08427.6854.23
.00
5.784.512.9112537.962.935.0
3956.6
8431.8221
11R-1,96-97
446.96Lt ol gray
ChalkDCP
8.97.1562.861.02.1011.66
47.22.36
.32
.04038.5
36.86.5
1066
23.29.6
13
29.528
105
3.3
19R-1,21-27
521.50Lt gr gray
Silty oozeDCP
24.64.2315.872.62.3611.40
32.88.93
.94
.10430.03
60.723.0729
38.669.5
2638.0
57
3876.6
11R-1,97-100446.97
Lt ol grayCc. ooze
XRF
9.83.1583.001.13.0931.73
45.40.17.40
.05138.0481.80
.00
2.437.3
6.1106813.220.123.0
1328.8
2610.0114
20R-1,77-84
531.57Yel brown
ClayDCP
62.30.439
11.928.33.1193.69
.932.732.61.2836.66
86.536.3666
124.6266.6
5752.6
83
7410.2
11R-1,119-123
447.19Lt ol grayCc. ooze
XRF
11.17.1592.54
.99
.1061.84
44.72.20
.37
.08137.8280.72
.09
2.7
49.77.5
158512.319.439.9
14
20.430
11.0105
22R-2,28-32
551.88
11R-1,133-137
447.33Lt ol grayCc. sand
XRF
11.44.1121.32
.73
.0971.46
46.97.12
.31
.05137.4
83.80.04
1.6
43.24.1
14268.5
10.426.5
9
13.020
9.4
116
23R-4,62-69
564.82Gy olive Gy orange
ClayXRF
62.24.601
14.495.43.0593.871.822.282.12.1416.942.42
.04
10.0127.5
26.6374
70.584.982.2128
97.5152
52.3409
ChalkDCP
16.45.2175.482.36.133
.88
38.98.51
.81
.07134.11
47.519.5763
42.925.0
2530.5
59
12195.9
11R-4,61-64
451.11Gy blue
ClayXRF
55.39.977
18.525.77.0675.82
.41
1.291.94.2009.621.08
.18
15.1199.5
37.6386
93.4160.4313.6
101
135.3148
83.9164
24R-1,92-93
570.22Gy brown
ClayXRF
57.271.01815.709.17.0893.72
.67
1.423.78.2856.87
.33
.03
15.9197.3
48.5130
116.3140.3
67.981
68.9113
101.2213
11R-4,61-64
451.11Gy blue
ClayDCP
55.19.998
18.835.84.0615.72
.40
1.351.95.2229.43
181.834.6362
148.4320.2
109
118.0152
154
18.0
24R-1,92-93
570.22Gy brown
ClayDCP
57.161.01615.56
9.18.0953.82
.661.583.90.2876.74
198.450.5136
133.172.8
9275.9133
22223.9
13R-2,61-64
466.71Gy olive
ClayXRF
54.53.905
18.548.54.0492.961.541.722.14.0978.994.08
.00
10.5156.7
18.3452
92.0126.7
70.656
104.1139
52.7226
24R-4,71-72
574.51Br gray
ClayXRF
55.54.940
15.237.38
1.6984.46
.971.823.54.3398.07
.67
.00
13.6160.4
71.0204
104.6149.5165.5
11866.1137
150.72941
14R-1,97-104475.07
Yel brownClayDCP
52.18.919
20.838.74.1033.83
.42
1.702.13.148
9
174.430.0
334
151.6146.1
113
135.6106
132
16.9
25R-1,92-97
579.92Lt brown
Cc. oozeDCP
10.26.1663.521.45.169
.7045.68
.29
.30.085
37.40
3282
15R-1,86-104484.56
Bl gr gray0
DCP
60.99.964
18.265.58.0342.30
.59
1.452.19.243
7.4
188.145.0313
141.1116.0
45
120.3181
442
16.4
25R-2,92-98
581.42Br gray
ClayXRF
55.721.05516.10
8.99.5253.82
.85
1.653.70.2957.30
.42
.03
12.2168.7
60.3161
113.2162.7178.7
10987.5131
107.7822
123-765C
Depth:Color:
Lithology:Method:
SiO2TiO2
AI2O3FβO
MnOMgOCaO
Na2OK2O
P2O5LOI
CaCO3C (Org)
NbZrY
SrRbZnCuNiCrV
CeBaSc
123-765C
Depth:Color:
Lithology:Method:
SiO2TiO2
AI2O3FeOMnOMgOCaO
Na2OK2O
P2O5LOI
CaCO3C (Org)
NbZrY
SrRbZnCuNiCrV
CeBaSc
25R-3,106-111
583.06Br gray
ClayXRF
56.24.962
16.707.66
1.1383.24
.98
1.763.52.3577.46
.50
.03
15.4175.3
71.7176
108.8165.4183.1
136
78.7134
153.82235
29R-5,70-74
623.10Lt brown
ClayDCP
58.99.884
17.347.20.1272.77
.642.124.25.1025.60
146.424.7166
135.2129.0
8175.5118
23320.5
25R-3,106-111
583.06Br gray
ClayDCP
56.58.958
16.767.70
1.1813.36
.981.703.74.3536.69
175.770.4181
165.1202.1
13883.5147
209023.2
29R-5,124-129
623.64Lt brownCc. clay
DCP
55.04.791
16.816.57.1662.603.892.113.91.1208.00
144.231.4207
112.9122.1
7773.1109
136421.6
26R-4,22-28
593.02Brown
ClayXRF
55.501.00215.06
7.35.1063.713.431.633.51.2768.434.83
.02
14.1176.6
59.1147
100.4127.2105.2
7981.4
9398.2204
30R-2,16-22
627.56Gy brown
Clayst.XRF
59.79.968
17.517.09
1.5422.95
.792.243.84.1233.15
.67
.03
13.2145.3
27.1207
112.1141.8142.4
7965.3120
126.01135
26R-4,42-51
593.22Br gray
ClayDCP
56.801.05816.92
7.721.077
3.59.59
1.683.66.111
6.8
170.326.8145
128.6143.1
9972.9121
165122.5
30R-2,16-22
627.56Gy brown
Clayst.DCP
57.82.937
17.136.85
1.5362.89
.782.033.84.1226.07
145.230.6210
140.8157.1
7969.4130
114321.9
27R-2,34-40
599.34Br grayClayst.
XRF
57.161.03616.60
7.341.898
3.17.52
1.724.06.1316.36
.25
.01
14.4169.1
25.1229
109.7135.7151.5
102
60.9127
132.42610
30R-3,76-83
629.66Brown
Clayst.DCP
59.21.873
17.636.55.1992.58
.70
2.403.86.0995.90
134.221.3212
121.1113.1
67
72.6114
233
19.3
28R-1,55-58
607.55Br gray
28R-3,45-53
610.45
29R-3,76-80
620.16Gy green Gy blue/gr
Clayst. Cc. ClaystXRF
58.06.976
17.187.56.8662.84
.471.774.10.0996.08
.17
.01
13.4157.0
19.3169
115.8165.0142.3
9574.8136
122.3871
30R-4,98-102631.38Brown
Clayst.XRF
59.08.878
16.987.29.1482.62
.712.323.66.0986.21
.17
.05
10.6131.6
19.3227
110.9135.4
97.074
64.3108
92.7232
XRF
45.78.712
12.195.80.1082.53
13.201.693.00.109
14.8822.24
.11
10.1115.7
23.7289
86.8116.1
49.670
55.787
69.61834
32R-1,40-45
645.40Yel brown
Clayst.DCP
63.32.849
14.046.14.1042.90
.682.543.61.0975.71
131.326.4262
112.4146.8
7767.4
91
19916.9
Clayst.XRF
56.62.841
16.225.88.1062.703.542.153.93.106
7.95.33
.06
11.8142.3
21.3172
120.0149.5257.2
8171.1132
89.3539
33R-2,117-124
657.37Gr gray
ClayDCP
62.66.706
14.127.31.1002.73
.832.572.56.1056.30
97.019.9201
94.237.5
3970.5137
81114.9
29R-5,2-6
622.42Lt brown
ClayDCP
57.941.11415.95
8.69.1193.49
.59
1.984.11.117
5.9
172.628.7
129
123.582.4
92
96.9108
221
21.8
34R-3,115-125
668.55
29R-5,26-30
622.66Lt brown
ClayDCP
58.01.964
16.728.10.1313.28
.64
2.094.14.115
5.8
163.428.8
148
128.4130.9
85
82.7104
218
22.1
35R-3,24-29
677.34Lt brown Gy blue/grCc. clay
DCP
61.99.2765.172.07.5011.05
12.411.09
.95.085
13.97
44.613.4185
34.468.2
1537.0
53
20986.0
Clayst.XRF
68.61.740
12.714.83.0402.86
.681.852.13.1325.41
.33
.13
14.0134.4
25.1123
76.4125.0327.5
9155.1113
115.8940
H
r
r
a2

Table 1 (continued). Table 1 (continued).
123-765C
Depth:Color:
Lithology:Method:
35R-3,86-90
677.96Black
37R-3,40-43
696.40Ol gray
SIO2TiO2
AI2O3FeOMnOMgOCaO
Na2OK2O
P2O5LOI
CaCO3C (Org)
NbZrY
SrRbZnCuNiCrV
CeBaSc
SiO2TiO2
AI2O3FeOMnOMgOCaO
Na2OK2O
P2O5LOI
CaCO3C (Org)
NbZrY
SrRbZnCuNiCrV
CeBaSc
Siltst. Cc. ClaystXRFXRF
39R-3.101-105715.71Ol grayClayst.
XRF
39R-3,140-150716.10
DCP
40R-3, 42R-2,104-109 41-43724.94 741.71
Br black Gy greenClayst. Clayst.
XRF XRF
44R-2,38-42
760.38OlgrayClayst.
DCP
44R-2,73-77
760.73Ol grayClayst.
DCP
44R-2,95-99
760.95Ol grayClayst.
DCP
80.64.2824.881.72.019
.892.911.16
.74.064
6.74.66
.67
3.2.0
11.288
31.342.835.0
1840.3
4212.4389
43.10.4807.574.57.5771.92
19.661.181.45.140
19.3534.65
.04
7.085.930.1249
47.299.4
104.270
34.265
63.63560
65.71.831
12.447.22.1802.951.071.752.49.1655.191.00
.04
11.3126.728.8138
76.8126.1119.0
7345.2120
111.0613
52.63.5529.145.06.2792.17
11.441.401.82.160
13.51
95.925.9198
105.8121.9
7050.1
79
222312.4
66.79.799
11.587.90.0503.05
.701.582.19.1105.24
.50
.22
12.5138.421.7
9869.4
102.6242.1
7144.9220
72.8153
75.27.5519.414.90.1411.92
.581.241.66.1004.23
.58
.15
7.4100.420.2117
61.477.381.1
3038.3
8760.81927
64.74.835
13.227.49.2932.69
.691.582.68.1975.6
138.331.2100
186.4210.8
9761.7
145
41817.0
67.24.764
12.806.70.0602.51
.461.532.54.1015.3
123.020.788
83.1183.1
3859.0140
48615.4
65.31.672
12.696.52
1.5052.33
.671.532.24.128
6.4
117.924.699
84.3126.2
6355.3130
81815.0
123-765C 44R-4, 45R-2, 47R-5, 50R-1, 51R-1,55-59 70-75 46-55 110-113 84-86
Depth: 763.55 770.40 793.86 816.70 825.84Color: Ol gray Dusky red Gy brown Brown Dk gray
Lithology: Clayst. Clayst. Clayst. Clayst. Clayst.Method: XRF XRF DCP XRF XRF
52R-2,110-118837.10
Gy olive
53R-1, 54R-3,66-72 140-150
844.76 857.90Brown Pink gray
55R-4,2-8
867.52Br gray
Clayst. Rad clayst Rad ooze Rad claystDCP DCP DCP DCP
69.14.700
12.096.55.1402.25
.641.422.18.0894.801.08
.29
10.8136.2
17.698
71.2110.8179.8
5049.8129
67.8492
71.91.670
10.955.83.0402.19
.651.351.91.1544.34
.67
.09
9.9122.527.2122
65.155.6
200.643
56.2120
63.71797
69.02.973
11.846.09.0512.69
.751.372.21.1084.90
122.122.6
95
98.5613.2
5046.3149
51014.4
70.15.7599.348.42.0802.63
.621.311.95.0994.64
.58
.01
11.3126.725.1
9154.490.887.7
4333.5
6578.81257
74.89.7749.055.02.0602.35
.561.241.96.1004.00
.42
.18
10.4
97.221.4
7654.174.1
111.934
29.599
67.2467
71.44.5248.775.67
1.3892.381.021.142.20.2705.20
81.728.9127
57.679.6101
36.884
286012.3
73.39.5548.586.59.2032.45
.751.161.97.1564.20
101.926.5113
80.5127.9
5331.9
49
268815.6
81.08.3155.183.21.0521.36
.49
.941.16.1153.74
61.718.2238
66.8109.4
6325.2
40
966911.3
59.86.3937.192.42
1.5362.07
11.70.99
1.07.174
12.60
130.742.2274
99.9805.9
8826.3130
51859.6
44R-2,119-123761.19Ol grayClayst.
DCP
67.25.730
12.946.53.0662.44
.491.552.51.1005.4
120.919.7
94
89.0176.8
3759.3136
74115.6
57R-1,111-117882.81Brown
Clayst.DCP
72.49.5159.036.00.6442.501.041.231.63.2124.70
134.637.7190
88.685.3
5226.1
45
596111.4
123-765C 58R-4, 59R-4, 60R-5, 60R-5, 61R-4, 61R-5, 61R-5, 62R-3, 62R-3. 62R-4,67-71 39-45 120-123 120-123 92-94 81-85 81-85 73-79 80-84 19-21
Depth: 896.37 902.79 914.70 917.00 922.32 923.71 923.71 930.13 930.20 931.09Color: Brown Gy red Brown Brown Brown Gy brown Gy brown Gy brown Gy brown Gy brown
Lithology: Clayst. Clayst. Ash Ash Ash Cc.Clayst Cc.Clayst Clayst. Clayst. Clayst.Method: XRF DCP DCP XRF XRF XRF DCP DCP XRF DCP
SiO2TiO2
AI2O3FeOMnOMgOCaO
Na2OK2O
P2O5LOI
CaCO3C (Org)
NbZrY
SrRbZnCuNiCrV
CeBaSc
74.20.5438.695.87.2122.48
.681.221.55.1564.41
.33
.01
11.0111.331.9143
48.8114.256.3
5822.7
3196.33870
69.68.537
12.085.54.0432.85
.921.391.83.131
5
84.821.4135
71.8115.6
3931.9
70
284512.8
62.84.235
19.151.11.1085.891.452.37
.56.0756.22
168.08.6136
158.432.7225
18.6528
3507.3
10.7182.7
7.81506.7
191.730.1215
13.3590
17.0241
56.30.865
13.584.24.1134.036.281.652.12.145
10.679.58
.02
90.6432.6
48.3138
46.8230.7
21.7100
14.72297
178.4293
45.56.6878.356.95
1.6272.23
15.35.81
2.28.118
16.0527.32
.00
9.7127.630.6130
54.7102.2141.4
7416.7
9581.4207
44.92.6808.396.88
1.5571.90
15.52.92
2.40.115
18.33
138.731.4129
92.1129.5
6724.7
74
22314.3
65.81.814
10.907.98
2.2572.60
.761.223.06.1724.43
142.230.4139
160.9176.1
14539.6129
188316.3
65.65.829
10.468.00
2.3252.70
.861.173.11.2424.66
.50
.00
13.8179.744.0139
83.3137.1168.4
11424.2138
86.71492
60.25.814
10.4814.46.0922.921.201.193.37.4374.80
143.055.4
82
123.633.8150
38.0490
13516.4
Oxides in wt%; elements in ppm. Abbrev: light (It), dark (dk), olive (ol), gray (gy), green (gr), brown (br), black (bl),yellow (yell), calcareous (cc), claystone (clayst), siltstone (siltst), dolomitic (dol), radiolarian (rad).
O
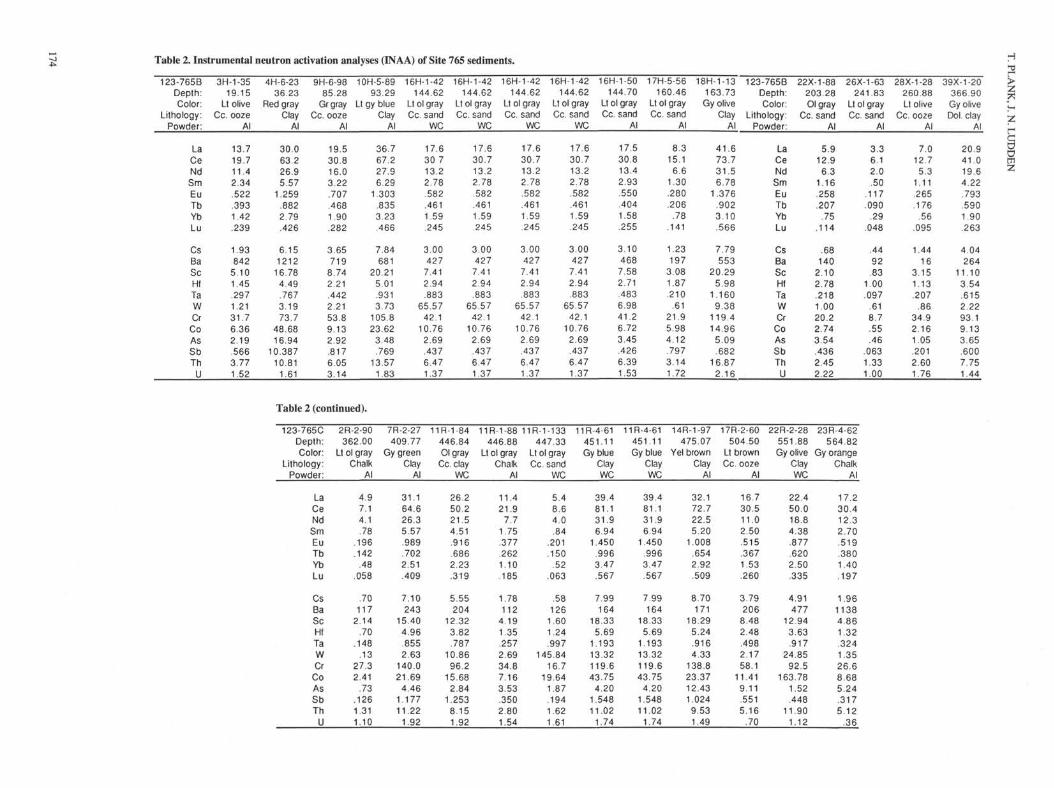
Table 2. Instrumental neutron activation analyses (EVAA) of Site 765 sediments.
123-765BDepth:Color:
Lithology:Powder:
LaCeNdSmEuTbYbLu
CsBaScHfTaWCr
CoAsSbTh
U
3H-1-3519.15
Lt oliveCc. ooze
Al
13.719.711.42.34.522.3931.42.239
1.93842
5.101.45.2971.2131.76.362.19.5663.771.52
4H-6-2336.23
Red grayClay
Al
30.063.226.95.57
1.259.8822.79.426
6.151212
16.784.49.7673.1973.7
48.6816.94
10.38710.81
1.61
9H-6-9885.28
Gr grayCc. ooze
Al
19.530.816.03.22.707.4681.90.282
3.65719
8.742.21.4422.2153.89.132.92.8176.053.14
10H-5-8993.29
Lt gy blueClay
Al
36.767.227.96.29
1.303.8353.23.466
7.84681
20.215.01.9313.73
105.823.623.48.769
13.571.83
16H-1-42144.62
Lt ol grayCc. sand
we17.630 713.22.78.582.4611.59.245
3.00427
7.412.94.883
65.5742.1
10.762.69.4376.471.37
16H-1-42144.62
Lt ol grayCc. sand
we17.630.713.22.78.582.4611.59.245
3.00427
7.412.94.883
65.5742.1
10.762.69.4376.471.37
16H-1-42144.62
Lt ol grayCc. sand
we17.630.713.22.78.582.4611.59.245
3.00427
7.412.94.883
65.5742.1
10.762.69.4376.471.37
16H-1-42144.62
Lt ol grayCc. sand
we17.630.713.22.78.582.4611.59.245
3.004277.412.94.883
65.5742.1
10.762.69.4376.471.37
16H-1-50144.70
Lt ol grayCc. sand
Al
17.530.813.42.93.550.4041.58.255
3.104687.582.71.4836.9841.26.723.45.4266.391.53
17H-5-56160.46
Lt ol grayCc. sand
Al
8.315.16.6
1.30.280.206
.78.141
1.23197
3.081.87.210
.6121 95.984.12.7973.141.72
18H-1-13163.73Gy olive
ClayAl
41.673.731.56.78
1.376.9023.10.566
7.79553
20.295.98
1.1609.38
119.414.965.09.682
16.872.16
123-765BDepth:Color:
Lithology:Powder:
LaCeNdSmEuTbYbLu
CsBaScHfTaWCr
CoAsSbThU
22X-1-88203.28Ol gray
Cc. sandAl
5.912.96.3
1.16.258.207
.75.114
.68140
2.102.78.2181.0020.22.743.54.4362.452.22
26X-1-63241.83
Lt ol grayCc. sand
Al
3.36.12.0.50
.117
.090.29
.048
.4492.83
1.00.097
.618.7.55.46
.0631.331.00
28X-1-28260.88Lt olive
Cc. oozeAl
7.012.75.3
1.11.265.176
.56.095
1.4416
3.151.13.207
.8634.92.161.05.2012.601.76
39X-1-20366.90Gy oliveDol. clay
Al
20.941.019.64.22.793.5901.90.263
4.04264
11.103.54.6152.2293.19.133.65.6007.751.44
T. PLA
1
•
§
z
Table 2 (continued).
123-765CDepth:Color:
Lithology:Powder:
LaCeNdSmEuTbYbLu
CsBaScHfTaWCr
CoAsSbTh
U
2R-2-90362.00
Lt ol grayChalk
Al
4.97.14.1.78
.196
.142.48
.058
.70117
2.14.70
.148.13
27.32.41
.73.1261.311.10
7R-2-27409.77
Gy greenClay
Al
31.164.626.35.57.989.7022.51.409
7.10243
15.404.96.8552.63
140.021.69
4.461.17711.22
1.92
11R-1-84446.84Ol gray
Cc. clay
we26.250.221.54.51.916.6862.23.319
5.55204
12.323.82.787
10.8696.2
15.682.84
1.2538.151.92
11R-1-88446.88
Lt ol grayChalk
Al
11.421.9
7.71.75.377.2621.10.185
1.78112
4.191.35.2572.6934.87.163.53.3502.801.54
11R-1-133447.33
Lt ol grayCc. sand
we5.48.64.0.84
.201
.150.52
.063
.58126
1.601.24.997
145.8416.7
19.641.87.1941.621.61
11R-4-61451.11Gy blue
Clay
we39.481.131.96.94
1.450.9963.47.567
7.99164
18.335.69
1.19313.32119.643.75
4.201.54811.02
1.74
11R-4-61451.11Gy blue
Clay
we39.481.131.96.94
1.450.9963.47.567
7.99164
18.335.69
1.19313.32119.643.75
4.201.54811.02
1.74
14R-1-97475.07
Yel brownClay
Al
32.172.722.55.20
1.008.6542.92.509
8.70171
18.295.24.9164.33
138.823.3712.431.0249.531.49
17R-2-60504.50
Lt brownCc.ooze
Al
16.730.511.02.50.515.3671.53.260
3.79206
8.482.48.4982.1758.1
11.419.11.5515.16
.70
22R-2-28551.88Gy olive
Clay
we22.450.018.84.38.877.6202.50.335
4.91477
12.943.63.917
24.8592.5
163.781.52.448
11.901.12
23R-4-62564.82
Gy orangeChalk
Al
17.230.412.32.70.519.3801.40.1.97
1.9611384.861.32.3241.3526.68.685.24.3175.12
.36
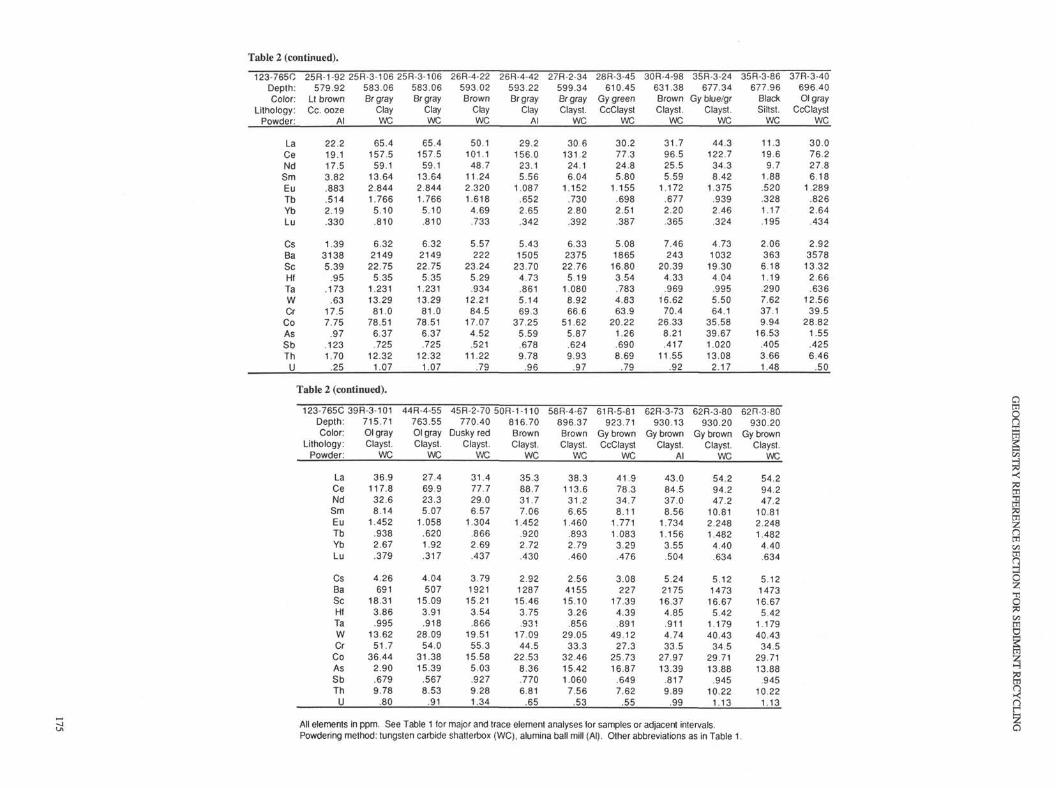
Table 2 (continued).
123-7650Depth:Color:
Lithology:Powder:
LaCeNdSmEuTbYbLu
CsBaScHfTaWCr
CoAsSbThU
25R-1-92579.92
Lt brownCc. ooze
Al
22.219.117.53.82.883.5142.19.330
1.3931385.39
.95.173
.6317.57.75
.97.1231.70
.25
25R-3-106 25R-3-106583.06Br gray
ClayWC
65.4157.559.1
13.642.8441.7665.10.810
6.322149
22.755.35
1.23113.2981.0
78.516.37.725
12.321.07
Table 2 (continued).
123-765CDepth:Color:
Lithology:Powder:
LaCeNdSmEuTbYbLu
CsBaScHfTaWCr
CoAsSbThU
39R-3-101715.71Ol grayClayst.
WC
36.9117.832.68.14
1.452.9382.67.379
4.26691
18.313.86.995
13.6251.7
36.442.90.6799.78
.80
583.06Br gray
ClayWC
65.4157.559.1
13.642.8441.7665.10.810
6.322149
22.755.35
1.23113.2981.0
78.516.37.725
12.321.07
44R-4-55763.55Ol grayClayst.
WC
27.469.923.35.07
1.058.6201.92.317
4.04507
15.093.91.918
28.0954.0
31.3815.39
.5678.53
.91
26R-4-22593.02Brown
ClayWC
50.1101.148.7
11.242.3201.6184.69.733
5.57222
23.245.29.934
12.2184.5
17.074.52.521
11.22.79
45R-2-70770.40
Dusky redClayst.
WC
31.477.729.06.57
1.304.8662.69.437
3.791921
15.213.54.866
19.5155.3
15.585.03.9279.281.34
26R-4-42593.22Br gray
ClayAl
29.2156.023.15.56
1.087.6522.65.342
5.431505
23.704.73.8615.1469.3
37.255.59.6789.78
.96
50R-1-110816.70BrownClayst.
WC
35.388.731.77.06
1.452.9202.72.430
2.921287
15.463.75.931
17.0944.5
22.538.36.7706.81
.65
27R-2-34599.34Br grayClayst.
WC
306131.224.16.04
1.152.7302.80.392
6.332375
22.765.19
1.0808.9266.6
51.625.87.6249.93
.97
58R-4-67896.37BrownClayst.
WC
38.3113.631.26.65
1.460.8932.79.460
2.56415515.103.26.856
29.0533.3
32.4615.421.0607.56
.53
28R-3-45610.45
Gy greenCcClayst
WC
30.277.324.85.80
1.155.6982.51.387
5.081865
16.803.54.7834.8363.9
20.221.26.6908.69
.79
61R-5-81923.71
Gy brownCcClayst
WC
41.978.334.78.11
1.7711.0833.29.476
3.08227
17.394.39.891
49.1227.3
25.7316.87
.6497.62
.55
30R-4-98631.38BrownClayst.
WC
31.796.525.55.59
1.172.6772.20.365
7.46243
20.394.33.969
16.6270.4
26.338.21.417
11.55.92
62R-3-73930.13
Gy brownClayst.
Al
43.084.537.08.56
1.7341.1563.55.504
5.24217516.374.85.9114.7433.5
27.9713.39
.8179.89
.99
35R-3-24677.34
Gy blue/grClayst.
WC
44.3122.734.38.42
1.375.9392.46.324
4.73103219.304.04.9955.5064.1
35.5839.671.02013.082.17
62R-3-80930.20
Gy brownClayst.
WC
54.294.247.2
10.812.2481.4824.40.634
5.121473
16.675.42
1.17940.43
34.529.7113.88
.94510.22
1.13
35R-3-86677.96
BlackSiltst.
WC
11.319.69.7
1.88.520.3281.17.195
2.06363
6.181.19.2907.6237.19.94
16.53.4053.661.48
62R-3-80930.20
Gy brownClayst.
WC
54.294.247.2
10.812.2481.4824.40.634
5.12147316.675.42
1.17940.43
34.529.7113.88
.94510.22
1.13
37R-3-40696.40Ol gray
CcClaystWC
30.076.227.86.18
1.289.8262.64.434
2.92357813.322.66.636
12.5639.5
28.821.55.4256.46
.50
All elements in ppm. See Table 1 for major and trace element analyses for samples or adjacent intervals.Powdering method: tungsten carbide shatterbox (WC), alumina ball mill (Al). Other abbreviations as in Table 1.

T. PLANK, J. N. LUDDEN
Table 3. Precision and accuracy of DCP and XRF analyses.
SiO2
TiO2
AI2O3
FeOMnOMgOCaO
Na2OK 2 O
P2O5LOI
Total
NbZrY
SrRbZnCu
NiCrV
CeBaSc
IOBCDCP
n = 10
52.33.864
18.7111.61
2.083.382.034.092.931.179.65
99.19
1871 7 42 0 4
742 6 63 6 8
892 0 7
3 5 824
%st dev
.27
1.67.77
.721.421.041.861.392.222.863.34
4.644.441.24
4.618.041.202.232.72
1.482.12
SCO-1XRF
68.22.750
15.185.72.0602.982.80.9503.00.210
13.01 7 6
24.01 6 4115107
27.034.064.01 4 4
57.05 4 3
SCO-1AcceptedValues
68.74.688
14.975.63.0583.012.87.9903.03.226
11.2163
26.6178114105
29.327.669.5134
63.35 8 2
SCO-1New
68.22.685
15.185.61.0622.892.71
1.0493.00.239
11.3166
22.8177115107
30.528.174.21 3 4
51.26 1 3
Oxides in wt%; elements in ppm.
data that are routinely reported (smear slides, XRD analyses,visual core descriptions, etc.). If geochemical variability can betied to lithologic variability, then potentially accurate estimatesof sediment sections might be made, based only on published coredescriptions and a few chemical analyses. Thus, an important firststep is to examine the relationship between the geochemical andthe lithological variations in Site 765 sediments.
Dilution
The first-order control for variability of almost all the elementsanalyzed in Site 765 sediments is dilution by calcium carbonate
(cc) (Ludden, Gradstein, et al., 1990). An element such as Al, forinstance, is quantitatively diluted by cc. Figure 2 shows that as ccvaries from 0 to 100 wt%, AI2O3 varies from about 20 to 0 wt%.Cc is present in Site 765 sediments largely as nannoplankton andforaminifer skeletons that were transported to the site via turbidityflows. A typical calcareous turbidite consists of a foraminiferalsand at the base (almost 100% cc), and a long interval of feature-less olive nannofossil ooze that grades upward to a white nanno-fossil ooze that is often bioturbated (see Dumoulin et al., thisvolume). Intervals between turbidites typically consist of greenclay, with essentially no cc. Because the cc content may vary from0% to almost 100% in a single turbidite sequence (including theclay-rich interval), the entire compositional range of the hole foran element such as Al can be observed on the centimeter to meterscale of a single graded sequence. Calcareous lithologies are muchless common in the Cretaceous section, and so a first-order depthvariation in most elements is lower concentrations in the Cenozoicsection from dilution by calcareous turbidites and an increase withdepth from the predominance of clay-rich lithologies.
A few elements (Sr, U, Ba, and P) do not show cc dilutionrelationships because they take part in the biologic cycles of theoceans. For example, U and Sr are taken into the carbonate shellsof marine organisms. Ba and P are often enriched below zones ofhigh biological productivity (Schmitz, 1987; Toyoda et al., 1990,and references therein). Mn exhibits a complex distribution thatis not related to cc dilution, but may reflect post-burial mobilityfrom its redox chemistry (Compton, this volume).
Although a large part of the variation in most element concen-trations results from cc dilution, significant variation at low cccontents also exists. Examination of just the low cc samples showsanother dilution effect caused by silica (Fig. 2). Thus, almost allof the AI2O3 variation in Site 765 sediments may be explained bydilution of an end-member with about 20% AI2O3, by cc andsilica. The excess silica reflects either radiolarian-rich intervalsor detrital quartz. Figures 3A and 3C show good agreementbetween Siθ2/Al2θ3 (which is insensitive to cc dilution) andradiolarian abundances in the sediments. The scattered highSi2θ/Al2θ3 values in the upper 500 m of the section mark coarse-grained bases of turbidites, where detrital quartz and heavy min-erals may concentrate (Zr and Ti also may be enriched in these
2 0 -
^ 1 5 -
| •
co 10-O_CM
< 5-I
0
/ 0 20 40 60 80 100
CaCO3 (wt%)
50 60 70 80
SiO2 (wt%)
Figure 2. AI2O3 vs. CaCθ3, and AI2O3 vs. Siθ2 for a subset of low carbonate samples (<6 wt% CaO)
that exhibit dilution effects on Site 765 sediments.
176
GEOCHEMISTRY REFERENCE SECTION FOR SEDIMENT RECYCLING
εQ-a.
03
en
5000-
4000-
3000-
2000-
1000
5"
crçcöO
TO03OC
o<π
< 2 -
AA
A
iA i A
^ ^ é . AA AA A
c.
200 400 600 800 1000
Depth (mbsf)
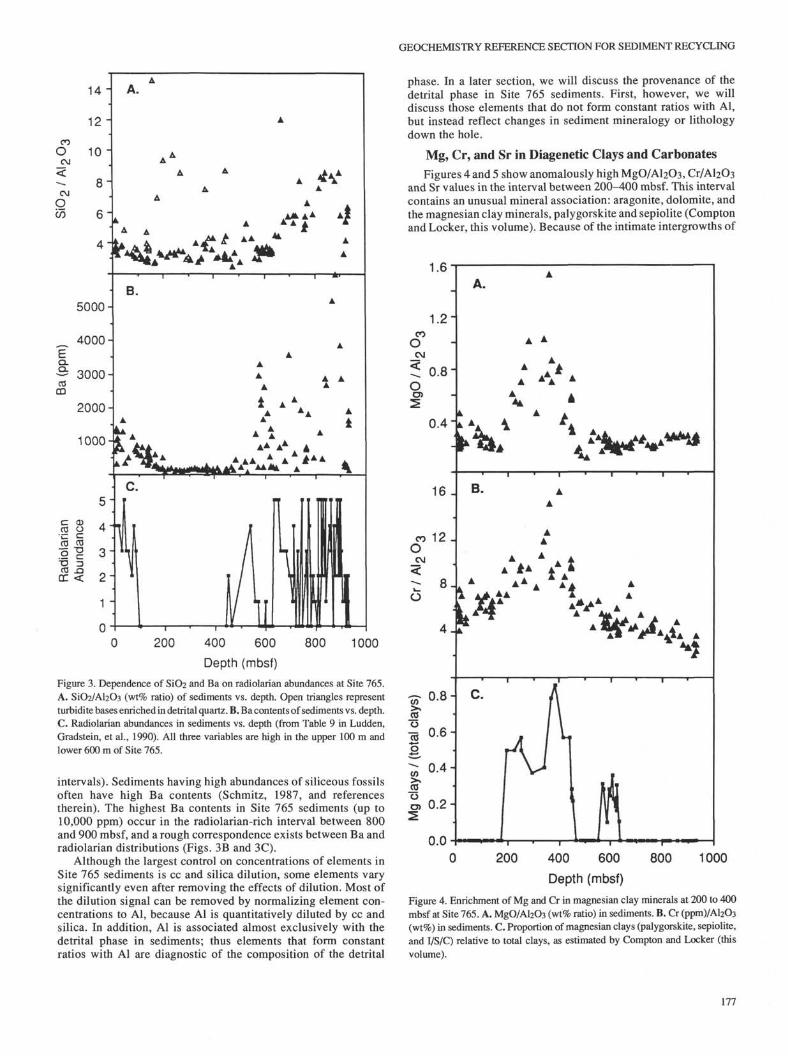
Figure 3. Dependence of Siθ2 and Ba on radiolarian abundances at Site 765.A. Siθ2/Ahθ3 (wt% ratio) of sediments vs. depth. Open triangles representturbidite bases enriched in detrital quartz. B. Ba contents of sediments vs. depth.C. Radiolarian abundances in sediments vs. depth (from Table 9 in Ludden,Gradstein, et al., 1990). All three variables are high in the upper 100 m andlower 600 m of Site 765.
intervals). Sediments having high abundances of siliceous fossilsoften have high Ba contents (Schmitz, 1987, and referencestherein). The highest Ba contents in Site 765 sediments (up to10,000 ppm) occur in the radiolarian-rich interval between 800and 900 mbsf, and a rough correspondence exists between Ba andradiolarian distributions (Figs. 3B and 3C).
Although the largest control on concentrations of elements inSite 765 sediments is cc and silica dilution, some elements varysignificantly even after removing the effects of dilution. Most ofthe dilution signal can be removed by normalizing element con-centrations to Al, because Al is quantitatively diluted by cc andsilica. In addition, Al is associated almost exclusively with thedetrital phase in sediments; thus elements that form constantratios with Al are diagnostic of the composition of the detrital
phase. In a later section, we will discuss the provenance of thedetrital phase in Site 765 sediments. First, however, we willdiscuss those elements that do not form constant ratios with Al,but instead reflect changes in sediment mineralogy or lithologydown the hole.
Mg, Cr, and Sr in Diagenetic Clays and Carbonates
Figures 4 and 5 show anomalously high MgO/Al2θ3,0/AI2O3and Sr values in the interval between 200-400 mbsf. This intervalcontains an unusual mineral association: aragonite, dolomite, andthe magnesian clay minerals, palygorskite and sepiolite (Comptonand Locker, this volume). Because of the intimate intergrowths of
1.6
1.2-CO
O_C\J
<
Oen
0.8-
0.4-
A.
A A
A
AAAA
16 - B.
0.8-
:al c
o
CΛ
oen
0
0
0
. 6 -
. 4 -
•
. 2 -
0.0
200 400 600
Depth (mbsf)
800 1000
Figure 4. Enrichment of Mg and Cr in magnesian clay minerals at 200 to 400mbsf at Site 765. A. MgO/Ahθ3 (wt% ratio) in sediments. B. Cr (ppm)/Ahθ3(wt%) in sediments. C. Proportion of magnesian clays (palygorskite, sepiolite,and I/S/C) relative to total clays, as estimated by Compton and Locker (thisvolume).
177

T. PLANK, J. N. LUDDEN
3000"
è 2000 -CD
1000-
<D
• c
11< <
A. Λ •
A *•
• A A A .
B.
200 400 600
Depth (mbsf)
800 1000
Figure 5. A. Sr contents of Site 765 sediments. B. Aragonite abundances fromCompton and Locker (this volume). Sr is enriched in aragonite relative to claysand calcite.
dolomite and fragile palygorskite fibers, Compton and Locker(this volume) favor a diagenetic origin for the magnesian clayminerals. The bulk composition of the sediments reflects thismineral association: Sr is high because aragonite is enriched in Srover calcite (Figs. 5A, 5B); MgO is high because of the presenceof dolomite and the magnesian clays (Figs. 4A, 4C). Compton andLocker (this volume) suggest that diffusion from seawater sup-plies the Mg required to form the diagenetic dolomite and clayminerals. The high Cr/AhCb values (Fig. 4B) are less easilyexplained; either the source of the sediments in this interval wasenriched in Cr, or the diagenetic reactions that led to the formationof the magnesian clays favored Cr enrichment. We are unawareof any published accounts of Cr-rich varieties of palygorskite orsepiolite.
Potassium and Clay Minerals
K2O/AI2O3 varies by more than a factor of two in Site 765sediments (Fig. 6A), and variations in this ratio appear to reflectvariations in the clay mineralogy (after Compton and Locker, thisvolume). The K2O content of the bulk sediments varies roughlywith the percentage of illite (a high K clay mineral) relative to theK-barren clay minerals, kaolinite and smectite (Figs. 6A, 6B). Thelow K2O/AI2O3 values around 400 m reflect dominance of kao-linite, while the peak around 600 m reflects high illite and K-feld-spar contents.
Iron, Manganese, and Cretaceous Clays
Both FeO/Al2θ3 and Mn/AhCb increase dramatically at about600 mbsf (Figs. 7A, 7B), which corresponds roughly with theCretaceous/Tertiary boundary. The Cretaceous section at Site 765
0.3"
CO
O_CM
5 0.2o
CVJ
0.1 -
0.6-
fSm
ec
+K
aol
II /(
III
0.4-
0.3-
0.2-
0.1-
0.0200 400 600
Depth (mbsf)800 1000
Figure 6. Dependence of K2O content of Site 765 sediments on clay mineral-
ogy. A. K2O/AI2O3 (wt% ratio) of sediments. B. Proportion of illite relative to
sum of illite, kaolinite, and smectite (I/S <10%) from Compton and Locker
(this volume).
is characterized by a decrease in abundance of cc turbidites, adecrease in sedimentation rate, an increase in amount of pelagicclay, and an increase in (volcanogenic) smectite (Ludden, Grad-stein, et al., 1990). Several of these factors may have led to anincrease in the Fe and Mn contents of these sediments. Thesmectite that dominates the lower 600 m is Fe-rich and Al-poorrelative to the detrital illite and kaolinite that dominate the upper600 m (Compton and Locker, this volume). Thus, the increase inabundance of smectite in the lower section is partly responsiblefor the increase in FeO/Al2θ3. The slower sedimentation rates inthe Cretaceous section, in part reflecting a decrease in rapidlydeposited turbidite sequences, favors enrichment and preser-vation of the Fe-Mn oxyhydroxides that constantly rain onto theseafloor. Thus, Cretaceous sediments have a higher hydrogenouscomponent and higher Fe and Mn contents. Finally, FeO and MnOare anomalously high in the clays immediately overlying thebasaltic basement (Figs. 7A, 7B), suggesting a ridge hydrothermalorigin for some of the Fe and Mn.
REE Abundances, Patterns, and Ce Anomalies
Like Fe and Mn, the rare earth elements (REE) increasedramatically in the lower 600 m (Fig. 8A). A higher hydrogenouscomponent in Cretaceous sediments might have led to higher REEcontents because Fe-Mn oxyhydroxide floes scavenge REEs fromthe water column (Aplin, 1984, and references therein) and mayenrich underlying sediments. However, Sm correlates well with
178
0 200 400 600 800 1000
Depth (mbsf)
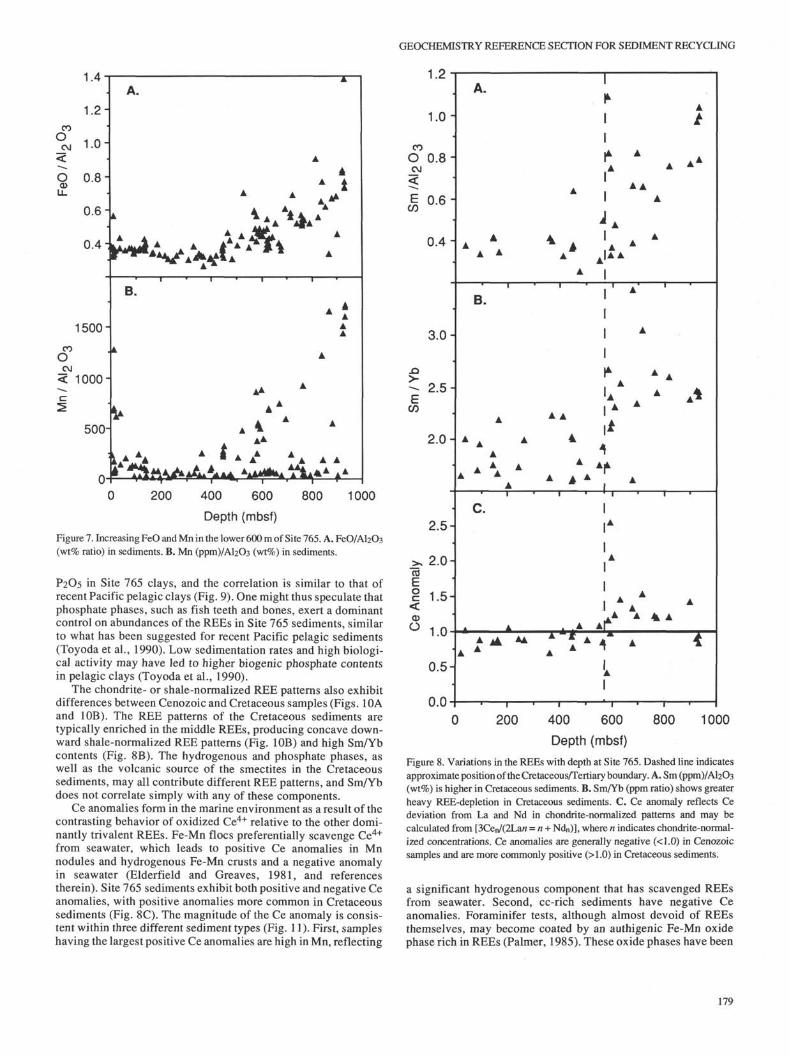
Figure 7. Increasing FeO and Mn in the lower 600 m of Site 765. A. FeO/Ahθ3(wt% ratio) in sediments. B. Mn (ppm)/Ahθ3 (wt%) in sediments.
P2O5 in Site 765 clays, and the correlation is similar to that ofrecent Pacific pelagic clays (Fig. 9). One might thus speculate thatphosphate phases, such as fish teeth and bones, exert a dominantcontrol on abundances of the REEs in Site 765 sediments, similarto what has been suggested for recent Pacific pelagic sediments(Toyoda et al., 1990). Low sedimentation rates and high biologi-cal activity may have led to higher biogenic phosphate contentsin pelagic clays (Toyoda et al., 1990).
The chondrite- or shale-normalized REE patterns also exhibitdifferences between Cenozoic and Cretaceous samples (Figs. 10Aand 10B). The REE patterns of the Cretaceous sediments aretypically enriched in the middle REEs, producing concave down-ward shale-normalized REE patterns (Fig. 10B) and high Sm/Ybcontents (Fig. 8B). The hydrogenous and phosphate phases, aswell as the volcanic source of the smectites in the Cretaceoussediments, may all contribute different REE patterns, and Sm/Ybdoes not correlate simply with any of these components.
Ce anomalies form in the marine environment as a result of thecontrasting behavior of oxidized Ce 4 + relative to the other domi-nantly trivalent REEs. Fe-Mn floes preferentially scavenge Ce 4 +
from seawater, which leads to positive Ce anomalies in Mnnodules and hydrogenous Fe-Mn crusts and a negative anomalyin seawater (Elderfield and Greaves, 1981, and referencestherein). Site 765 sediments exhibit both positive and negative Ceanomalies, with positive anomalies more common in Cretaceoussediments (Fig. 8C). The magnitude of the Ce anomaly is consis-tent within three different sediment types (Fig. 11). First, sampleshaving the largest positive Ce anomalies are high in Mn, reflecting
GEOCHEMISTRY REFERENCE SECTION FOR SEDIMENT RECYCLING
1.2
1.0-
coO 0.8-
<
0.4-
CΛ
3.0-
2.5-
2.0-
2.5-
>, 2.0-co
o 1c 1.5-<CDü 1.0
0.5-
0.0
A.
A Δ
AA
A A '
A A
B.
m A
* AA A
A 1
c.
A 4 A
A * *
0 200 400 600 800 1000
Depth (mbsf)
Figure 8. Variations in the REEs with depth at Site 765. Dashed line indicatesapproximate position of the Cretaceous/Tertiary boundary. A. Sm (ppm)/Ahθ3(wt%) is higher in Cretaceous sediments. B. Sm/Yb (ppm ratio) shows greaterheavy REE-depletion in Cretaceous sediments. C. Ce anomaly reflects Cedeviation from La and Nd in chondrite-normalized patterns and may becalculated from [3Cen/(2La« = n + Ndn)], where n indicates chondrite-normal-ized concentrations. Ce anomalies are generally negative (<l.O) in Cenozoicsamples and are more commonly positive (>l.O) in Cretaceous sediments.
a significant hydrogenous component that has scavenged REEsfrom seawater. Second, cc-rich sediments have negative Ceanomalies. Foraminifer tests, although almost devoid of REEsthemselves, may become coated by an authigenic Fe-Mn oxidephase rich in REEs (Palmer, 1985). These oxide phases have been
179

T. PLANK, J. N. LUDDEN
40
3 0 -
E& 20-
10-
• Pacific pelagic claysO Site 765 Clays
•
0.0 0.2 0.4
P 2 θ 5
0.6
(wt%)
0.8 1.0
Figure 9. Sm and P2O5 in recent Pacific pelagic clays (from Toyoda et al., 1990)and Site 765 clays (<6.0 wt% CaO).
shown to possess negative Ce anomalies inherited from bottomwater (Palmer, 1985). Finally, clay-rich samples have Ce anoma-lies that depend upon their P2O5 contents, showing a relationshipidentical to recent Pacific pelagic sediments (Toyoda et al., 1990).Phosphate phases (such as fish teeth) may have large negative Ceanomalies (Elderfield and Pagett, 1986, and references therein),and so increasing amounts of phosphate may lead to larger nega-tive Ce anomalies.
This analysis of the REEs in Site 765 sediments suggests thatdownhole variations in abundances of REEs and their patterns aredependent upon downhole variations in phosphate, Mn, and ccphases. In general, phases enriched in REEs (clay, phosphate, andMn) dominate the Cretaceous, while REE-poor cc dominates theCenozoic sediments (see Fig. 75 in Ludden, Gradstein, et al.,1990). In detail, however, distribution of the Mn and phosphatephases may be complex (Figs. 7B, 12). Nonetheless, high P2O5contents are typical of the 450- to 600-m interval (Fig. 12). Thisinterval is distinguished by the lowest sedimentation rates in thehole (1-2 m/m.y.), where fish debris may not be overwhelmed byother influxes. Even so, the P2O5 contents in this interval requireless than 1% apatite (with about 40% P2O5), which may explainwhy fish debris was not identified in sediment smear slides.Because fish-bone apatite may contain on the order of 100 timesthe REE contents of shales (Elderfield and Pagett, 1986; Staudigeletal., 1985/86; Toyoda etal., 1990), this seemingly trivial amountbecomes significant.
Although minor phases and lithologies may be important foraffecting downhole variations in certain elements, the aim of thisstudy is to characterize the average composition of Site 765sediments. In this regard, the most volumetrically significantcontrol on element concentrations in Site 765 sediments is dilu-tion of a shalelike phase with cc. For example, although subtledifferences in REE patterns may reflect different mineral phases,all Site 765 sediments, and in fact all marine sediments, have REEpatterns remarkably similar to average shale. This justifies thepractice of normalizing REE to average shales. AlthoughK2O/AI2O3 varies with clay mineralogy (Figs. 6A, 6B), the aver-age value is similar to average shale (around 0.2 for Australianshales; Taylor and McLennan, 1985). In the following section, we
25R-3-106
62R-3-80
7R-2-27
22R-2-289H-6-983H-1-35
17H-5-5628X-1-28
2R-2-90
A. Chondrite Normalized
26R-4-42
58R-4-67
1000
:100
LaCe Nd SmEuGdTb YbLu LaCe Nd SmEuGdTb YbLu
Figure 10. REE patterns in selected Site 765 sediments. Gd has been interpolated between Tb and Sm to illustrate Eu anomalies better. Closed circles indicateCenozoic sediments; open circles represent Cretaceous sediments. A. Chondrite-normalized patterns (to values in Taylor and Gorton, 1977). B. Shale-normalizedpatterns (to PAAS in Taylor and McLennan, 1985).
180

GEOCHEMISTRY REFERENCE SECTION FOR SEDIMENT RECYCLING
>. 2oö
oc:<CD
<•> 1
oMn
O
• Pacific pelagic claysO Site 765 ClaysA Site 765 Cc
•.01 0.1 1
P 2 O 5 (wt%)10
Figure 11. Ce anomalies in Site 765 clays, carbonates (>20% CaO), andMn-rich clays. Carbonates have negative Ce anomalies; Mn-rich clays havepositive anomalies. Other Site 765 clays exhibit a similar relationship betweenCe anomaly and P2O5 content as recent Pacific pelagic clays (Toyoda et al.,1990).
0.0
200 400 600 800 1000
Depth (mbsf)Figure 12. Variation in P2O5 content of Site 765 sediments with depth.
discuss the provenance of this shalelike detrital phase in Site 765sediments.
Provenance of Detrital PhaseSite 765 lies oceanward of the northwestern shelf of Australia,
and thus the likely source of Site 765 sediments is northwesternAustralia. A considerable data base for the sedimentary masseson the Australian continent has been developed overpast decadesby researchers from the Australian National University as a wayof estimating the composition of this exposed continental crust(reviewed in Taylor and McLennan, 1985). Special attention hasbeen paid to the Archean and Archean/Proterozoic boundarysedimentary sequences; thus, a fair amount of data exists forsamples from the Precambrian Pilbara Block of western Australia(see Fig. 1). A more direct source for Site 765 sediments might
be the Phanerozoic rocks of Canning Basin, but these have beenultimately derived from the Archean and Proterozoic blocks ofwestern and central Australia, too (BMR Paleogeographic Group,1990).
Figures 13A through 13D show AI2O3 variation diagrams forSite 765 sediments, along with sediment data from the CanningBasin (Nance and Taylor, 1976), the Pilbara Block (McLennan,1981; McLennan et al., 1983), and the post-Archean AustralianShale (PAAS) average from Taylor and McLennan (1985). ThePilbara Block sediments include both Archean shales from theGeorge and Whim Creek groups, as well as early Proterozoicsediments from the Hamersley Basin. The Archean shales fromthe George and Whim Creek groups are too depleted in Tiθ2 andTh, and too enriched in Ni and Cr, to be an appropriate source forthe Site 765 sediments (Figs. 13A-13D). Furthermore, theArchean shales lack an Eu-anomaly, which is a ubiquitous featurein Site 765 REE patterns (Fig. 10A), and indeed, is the hallmarkof post-Archean sediments (Taylor and McLennan, 1985). Thesecharacteristics of the George and Whim Creek shales are commonto most Archean shales and preclude much of a pure Archeancomponent in the Site 765 sediments. On the other hand, anaverage of three Canning Basin shales (Paleozoic) provides agood fit with the detrital end-member for Site 765 sediments(Figs. 13A-13D) and makes sense geographically (see Fig. 1) asa source for river or wind influxes to the Exmouth Plateau andArgo Abyssal Plain. The Canning Basin average is near the PAAScomposite itself, which is similar to post-Archean shales else-where, owing to the remarkable mixing efficiency of sedimentaryprocesses (Taylor and McLennan, 1985). The early ProterozoicHamersley Basin sediments lie compositionally between the Pa-leozoic Canning Basin shales and the Archean Pilbara shales, butlike the Archean shales, are too Cr-enriched and Tiθ2-depleted tobe a suitable end-member for Site 765 sediments. Thus, despitesignificant exposures of Archean rocks in their presumed source,Site 765 sediments are compositionally like post-Archean shales.The ancient age of the source of Site 765 sediments should bereflected, however, in their compositions of Pb and Nd isotopes.Future isotopic work using these samples should help constrainthe mean age of the source of Site 765 sediments.
For elements that increase down the hole (e.g., REEs, Fe), theCenozoic values are more representative of a purely detrital com-ponent having a composition near PAAS, which is consistent withthe Cenozoic section being dominated by turbidites that quantita-tively deliver continental detrital material to the marine environ-ment. The Cretaceous sediments may be enriched over PAASbecause of additional hydrogenous, volcanic, hydrothermal, orphosphate contributions, as discussed above.
The proximity of active volcanoes of Java and the LesserSunda Islands (Bali, Lombok, Sumbawa, etc.) raises the issue ofthe extent to which arc andesites contributed to the youngest Site765 sediments. Ninkovich (1979) demonstrated that Lesser Sundaash falls extend to only 200 km south of the Sunda Trench. Site765 lies far south of this zone, and indeed, no prominent ash falllayers were cored in the Cenozoic section. However, it is possiblethat a disseminated ash component contributed to Site 765 sedi-ments. Figure 14 shows the K2O and Cr contents of Site 765sediments, modern Indonesian volcanics, and post-Archeanshales. During differentiation of arc magmas, elements incompat-ible in the fractionating mineral assemblage (such as K) increasedramatically, while compatible elements (Cr) decrease dramati-cally. Thus, although arc andesites have high K2O abundances,they are strongly depleted in Cr, unlike marine clays and terrige-nous shales that are enriched in both. These systematics apply tothe compatible element Ni as well, but Ni may be further enrichedin marine sediments from a hydrogenous (Fe-Mn oxide) contribu-tion. The high Cr/K2θ contents throughout the Cenozoic section
181

T. PLANK, J. N. LUDDEN
2.CM
TiO
P
(PP
i
E
IfQ_a.
.cf
'ÉTi—Q.a.
i _
O
-
0.8-
0.4-
10 -
5 •
15
10-
5
-
400-
200-
-
A.
B.
A
A. l
c.
AAA A
D.
A
JàMÅ— i
m
/ ^
A
. A
•^ A
* AA
A. i
A
A
A
i •
Δ ^
A
A
A
A^ Δ
A ^
A(A»>Λ
A PAAS
4w P HB
Δ 3fe,r^A ok A P F )
^ C B O* AP
A
HBO
CB
A PAAS A P
PAAS A °
* A AP
OAP
HBO
1* > / - ^ A
‰Δ^PAASCB
10A I 2 O 3
15(wt%)
20 25
Figure 13. Selected elements vs. AI2O3 in Site 765 sediments (open trianglesCretaceous, closed triangles = Cenozoic), average shales from the Phanero-
zoic Canning basin (CB), the early Proterozoic Hamersley Basin (HB), and theArchean Pilbara Block (AP), and average post-Archean Australian shale(PAAS). A. Tiθ2 vs. AI2O3. B. Sm vs. AI2O3. C. Th vs. AI2O3. D. Cr vs. AI2O3.Data are from Taylor and McLennan (1985); Nance and Taylor (1976);McLennan et al. (1983); McLennan (1981); and Tables 1 and 2.
160
120
Q.Q.
U
PAAS
Arc Andesites
1 2 3 4 5
K 2 O ( w t % )
Figure 14. K2O vs. Cr for Site 765 sediments (triangles), the Canning Basinaverage and PAAS (as in Fig. 13), and andesites from Java and Lesser Sunda(Merbabu volcano, Java, and Batur volcano, Bali). Data for andesites fromWhitford (1975) and Wheller and Varne (1986). Open triangles = anomalouslyhigh Cr sediments in the 200- to 400-m interval at Site 765 (Fig. 4B).
rules out much andesitic ash in Site 765 sediments. As Site 765approaches the Sunda Trench, however, ash may have contributedsignificantly to the upper sedimentary section, and subduction ofthis material leads to interesting speculations about the extent ofcannibalism at arcs (Ben Othman et al., 1989).
CALCULATING A BULK COMPOSITION FOR SITE765 SEDIMENTS
Estimating the bulk composition of Site 765 sediments mightbe as simple as averaging the analyses in Tables 1 and 2. However,this estimate is only as accurate as each sample is representative.Because cc dilution accounts for most of the geochemical varia-bility in Site 765 sediments, this estimate may be refined by takinginto account cc variations. Cc contents are linked to macroscopiclithologies (foraminifer sands and nannofossil oozes); thus, pub-lished core descriptions provide, in effect, continuous downholecc estimates. To determine the bulk composition of the site, weestimated the cc content of each 10-m interval (each core) fromvisual core descriptions, used our analyses to determine the com-position of the noncarbonate fraction, and then diluted this com-position by the estimated cc content. Details of these calculationsare presented next.
The data reported here represent spot analyses that must beweighted by the length of the interval that they represent. Forexample, some sampled clay units are only centimeters thick,while some sampled nannofossil ooze units are meters long. Todetermine the weighting factors, the relative proportions of car-bonate-rich lithologies were estimated for each of the 103 coresfrom the barrel sheets in Ludden, Gradstein, et al. (1990). Becausea sediment described as "nannofossil ooze" is not pure calcite,shipboard CaCθ3 analyses were used to calculate the pure ccfraction for each core. The rest of the core was considered "non-carbonate." Figure 15 presents the downhole variation in thisvalue. This "noncarbonate" factor is simply a way to quantify andsmooth lithologic variations downhole. Moreover, because mostof the geochemical variability is directly linked to carbonatecontent, this value links lithologic and geochemical data.
The data in Table 1 were normalized to a carbonate-free, drybasis (by normalizing by a sum that does not include CaO nor the
182
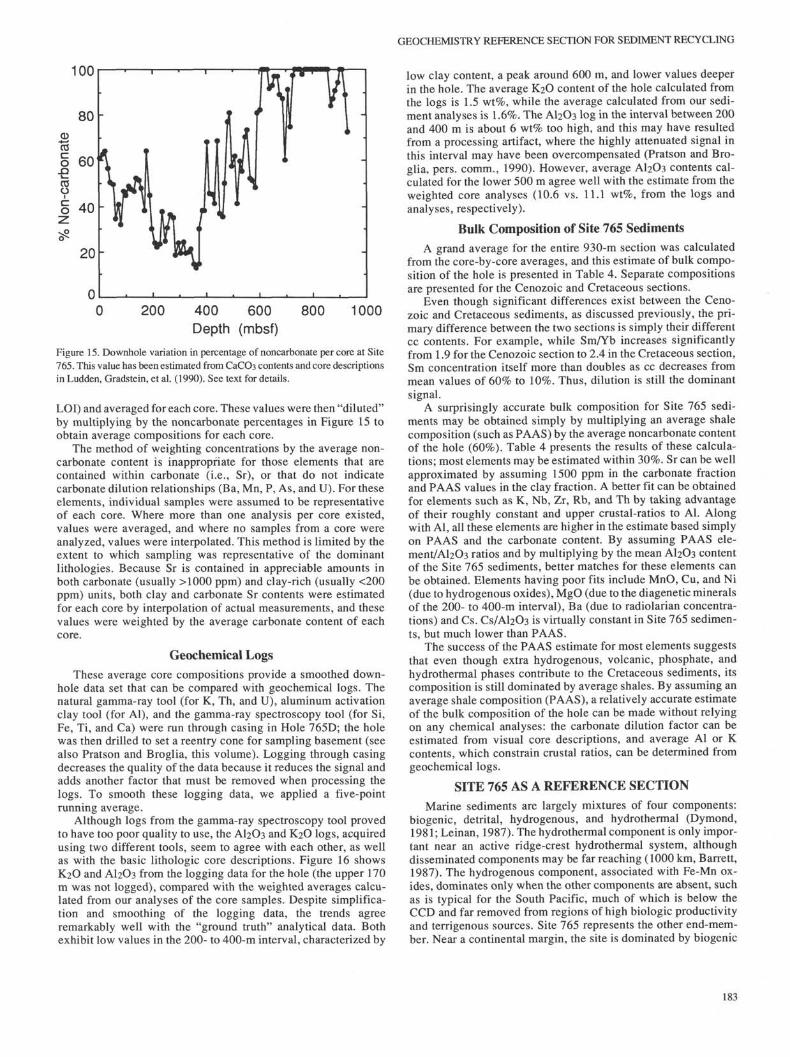
GEOCHEMISTRY REFERENCE SECTION FOR SEDIMENT RECYCLING
100
200 400 600
Depth (mbsf)
800 1000
Figure 15. Downhole variation in percentage of noncarbonate per core at Site765. This value has been estimated from CaCθ3 contents and core descriptionsin Ludden, Gradstein, et al. (1990). See text for details.
LOI) and averaged for each core. These values were then "diluted"by multiplying by the noncarbonate percentages in Figure 15 toobtain average compositions for each core.
The method of weighting concentrations by the average non-carbonate content is inappropriate for those elements that arecontained within carbonate (i.e., Sr), or that do not indicatecarbonate dilution relationships (Ba, Mn, P, As, and U). For theseelements, individual samples were assumed to be representativeof each core. Where more than one analysis per core existed,values were averaged, and where no samples from a core wereanalyzed, values were interpolated. This method is limited by theextent to which sampling was representative of the dominantlithologies. Because Sr is contained in appreciable amounts inboth carbonate (usually >IOOO ppm) and clay-rich (usually <200ppm) units, both clay and carbonate Sr contents were estimatedfor each core by interpolation of actual measurements, and thesevalues were weighted by the average carbonate content of eachcore.
Geochemical Logs
These average core compositions provide a smoothed down-hole data set that can be compared with geochemical logs. Thenatural gamma-ray tool (for K, Th, and U), aluminum activationclay tool (for Al), and the gamma-ray spectroscopy tool (for Si,Fe, Ti, and Ca) were run through casing in Hole 765D; the holewas then drilled to set a reentry cone for sampling basement (seealso Pratson and Broglia, this volume). Logging through casingdecreases the quality of the data because it reduces the signal andadds another factor that must be removed when processing thelogs. To smooth these logging data, we applied a five-pointrunning average.
Although logs from the gamma-ray spectroscopy tool provedto have too poor quality to use, the AI2O3 and K2O logs, acquiredusing two different tools, seem to agree with each other, as wellas with the basic lithologic core descriptions. Figure 16 showsK2O and AI2O3 from the logging data for the hole (the upper 170m was not logged), compared with the weighted averages calcu-lated from our analyses of the core samples. Despite simplifica-tion and smoothing of the logging data, the trends agreeremarkably well with the "ground truth" analytical data. Bothexhibit low values in the 200- to 400-m interval, characterized by
low clay content, a peak around 600 m, and lower values deeperin the hole. The average K2O content of the hole calculated fromthe logs is 1.5 wt%, while the average calculated from our sedi-ment analyses is 1.6%. The AI2O3 log in the interval between 200and 400 m is about 6 wt% too high, and this may have resultedfrom a processing artifact, where the highly attenuated signal inthis interval may have been overcompensated (Pratson and Bro-glia, pers. comm., 1990). However, average AI2O3 contents cal-culated for the lower 500 m agree well with the estimate from theweighted core analyses (10.6 vs. 11.1 wt%, from the logs andanalyses, respectively).
Bulk Composition of Site 765 Sediments
A grand average for the entire 930-m section was calculatedfrom the core-by-core averages, and this estimate of bulk compo-sition of the hole is presented in Table 4. Separate compositionsare presented for the Cenozoic and Cretaceous sections.
Even though significant differences exist between the Ceno-zoic and Cretaceous sediments, as discussed previously, the pri-mary difference between the two sections is simply their differentcc contents. For example, while Sm/Yb increases significantlyfrom 1.9 for the Cenozoic section to 2.4 in the Cretaceous section,Sm concentration itself more than doubles as cc decreases frommean values of 60% to 10%. Thus, dilution is still the dominantsignal.
A surprisingly accurate bulk composition for Site 765 sedi-ments may be obtained simply by multiplying an average shalecomposition (such as PAAS) by the average noncarbonate contentof the hole (60%). Table 4 presents the results of these calcula-tions; most elements may be estimated within 30%. Sr can be wellapproximated by assuming 1500 ppm in the carbonate fractionand PAAS values in the clay fraction. A better fit can be obtainedfor elements such as K, Nb, Zr, Rb, and Th by taking advantageof their roughly constant and upper crustal-ratios to Al. Alongwith Al, all these elements are higher in the estimate based simplyon PAAS and the carbonate content. By assuming PAAS ele-ment/Al2θ3 ratios and by multiplying by the mean AI2O3 contentof the Site 765 sediments, better matches for these elements canbe obtained. Elements having poor fits include MnO, Cu, and Ni(due to hydrogenous oxides), MgO (due to the diagenetic mineralsof the 200- to 400-m interval), Ba (due to radiolarian concentra-tions) and Cs. CS/AI2O3 is virtually constant in Site 765 sedimen-ts, but much lower than PAAS.
The success of the PAAS estimate for most elements suggeststhat even though extra hydrogenous, volcanic, phosphate, andhydrothermal phases contribute to the Cretaceous sediments, itscomposition is still dominated by average shales. By assuming anaverage shale composition (PAAS), a relatively accurate estimateof the bulk composition of the hole can be made without relyingon any chemical analyses: the carbonate dilution factor can beestimated from visual core descriptions, and average Al or Kcontents, which constrain crustal ratios, can be determined fromgeochemical logs.
SITE 765 AS A REFERENCE SECTION
Marine sediments are largely mixtures of four components:biogenic, detrital, hydrogenous, and hydrothermal (Dymond,1981; Leinan, 1987). The hydrothermal component is only impor-tant near an active ridge-crest hydrothermal system, althoughdisseminated components may be far reaching (1000 km, Barrett,1987). The hydrogenous component, associated with Fe-Mn ox-ides, dominates only when the other components are absent, suchas is typical for the South Pacific, much of which is below theCCD and far removed from regions of high biologic productivityand terrigenous sources. Site 765 represents the other end-mem-ber. Near a continental margin, the site is dominated by biogenic
183

T. PLANK, J. N. LUDDEN
| 3
o^ 2
°? 3
LoggingData
l
H 1 1 | » I h
*irVH H
• Core Samples
<
AA*A
A
CM p A é * A
A áU
•
20
15
O
15
LoggingData
1 1
Core Samples A £
co 10O
<
i S' -
* ^ À 4 ^ / 4 A
A
200 400 600 800 1000
Depth (mbsf)
0 200 400 600 800 1000
Depth (mbsf)
Figure 16. Downhole logs for K2O and AI2O3 (from Pratson and Broglia, this volume) compared with weighted analyses of core samples. See text for details ofweighting and data processing. Downhole K2O variations from the two methods agree remarkably well. AI2O3 content agrees well in sediments below 400 mbsf.
and detrital material. This leads directly to the success of thesimple calculation based on PAAS and cc content to describe thebulk composition of Site 765. The large biogenic influx meansthat variations in the other components are overwhelmed bysimple quantitative dilution. However, proximity to a continentalso means that the detrital component is relatively constant aswell, owing to the remarkable homogeneity of mature uppercrustal material. Indeed, McLennan et al. (1990), in a survey ofdeep-sea turbidites, found that passive margin turbidites typicallysample average, old, upper crustal material. These two factors,dilution because of biogenic components and average crustaldetritus, should make calculating sedimentary columns adjacentto continents elsewhere just as simple. Results from Site 765suggest that accurate estimates may be made with little analyticaleffort. Continental margin sections exist outboard of other arcsthan Indonesia (the Antilles, Chile, Alaska, Cascades, Mediter-ranean) and thus make up a significant portion of potentiallysubducted material. In contrast, sedimentary sections in the mid-dle of the Pacific, such as outboard of the Tonga Arc, have beenstarved of biogenic and detrital components and may require acompletely different way to calculate bulk compositions. Futureresearch will be dedicated to establishing another reference sec-tion in the central South Pacific.
Although much of the variation in a sedimentary section proxi-mal to a continental margin will reduce simply to dilution ofaverage crustal shales by biogenic material, this still leads to someinteresting systematics for elements that are important tracers ofcrustal recycling:
1. Alkali elements (K, Rb, Cs). These elements are entirelycoupled to the detrital component and will be quantitativelydiluted by biogenic material. Their ratios may be similar to aver-age crustal shales, although K may vary with clay mineralogy(Fig. 6). Deeply weathered source regions may contribute morekaolinite-rich clays, leading to lower K/Al than average shales.McLennan et al. (1990) also suggested that the alkali elementsmay fractionate from each other during weathering, with low K/Cscontents characteristic of highly weathered sources.
2. Alkaline earth elements (Sr, Ba). In contrast, these elementshave little to do with the detrital component, and thus importantfractionations in alkali/alkaline earth elements occur in the marineenvironment. Sr substitutes for Ca in marine carbonates and maybe present in concentrations up to 3000 ppm in some aragonites.Nonetheless, we have shown that the average Sr content of asedimentary section such as that at Site 765 can be well estimatedsimply by assuming average cc and shale values. Although Ba
184

GEOCHEMISTRY REFERENCE SECTION FOR SEDIMENT RECYCLING
Table 4. Bulk composition of Site 765 sediments.
SiO2
TiO2
AI2O3
F Θ O
MnOMgOCaO
Na2OK 2 O
P 2 O 5
total cc
NbZrY
SrRbZnCu
NiCrV
BaSc
LaCeNd
SmEuTbYbLu
CsHf
Ta-W-
Co*AsSbTb
U
Site 765Ceno
26.8.37
7.4
2.8.112.9
32.2.9
1.3
.13
57.5
5.4931 7
1285485671425366
3197.2
173113
2.8.59.411.5.24
3.32.7.412.3
94.3
.95.81.8
Site 765Crβt
65.6.70
11.26.0.462.65.51.4
2.2
.14
9.8
10.4125
29274
7295
1977145
112191313.8
369331
7.01.44
.912.9.46
4.33.8.744.0
278.0
.78.9
.9
WholeHole
42.5.50
8.9
4.1.252.7
21.41.1
1.6
.14
38.2
7.4106
21871
5872
122545085
9639.9
245620
4.5.94.612.1.33
3.73.1.673.5
215.8
.97.0
1.5
PAAS
64.21.0219.3
6.6.112.21.31.2
3.8
.16
19.4215
28204163
875156
112153664
16
398233
5.721.12
.792.86
.44
15.35.1
23.5
14.93.2
Calc765
39.66.63
11.934.10
.071.39
21.39.76
2.34.10
12.0133
17699101
5432356995
4 1 010
245120
3.54.69.49
1.77.27
9.53.2
14.5
9.22.0
Calcfrom Al
.47
8.90
(from cc)
1.74
8.999
(from cc)75
52
8
7.12.4
6.9
% diff
-7-7
0
0-73-49
0-30
6
-26
21-7
-20-2031
-25-74-35
412
-57
-24
-2-10
-1-22-26-21-14-17
90
-25
-30
-231
* Samples powdered in WC excluded from estimate for these elements.PAAS from Taylor and McLennan (1985), rβnormalized to 100%.
exhibits complex behavior in the marine environment, Ba con-tents may be enormously high (10,000 ppm levels) in siliceousoozes. A rough association exists between Ba and radiolarianabundances in Site 765 sediments (Figs. 3B and 3C). This asso-ciation may result from barite nucleation on decaying siliceousskeletons in the water column (Bishop, 1988). Predominance ofsiliceous organisms is a characteristic of regions of high produc-tivity maintained by active upwelling, such as in equatorial re-gions. Thus, Ba has been used as a paleoproductivity indicator, aswell as an equatorial reference frame for charting plate motions(Schmitz, 1987).
3. REEs. The REEs typically display post-Archean shale pat-terns and are quantitatively diluted by cc and silica. REEs maybecome enriched, however, by phosphate or Fe-Mn oxide phases.Positive Ce anomalies are characteristic of sediments rich inFe-Mn oxides, while negative Ce anomalies are characteristic ofsediments rich in biogenic cc or phosphate. A few arc volcanicspossess negative Ce anomalies (Heming and Rankin, 1979),which might have been inherited from REE-rich phosphates.
4. High field-strength elements (HFSE; Nb, Ta, Hf, Zr). Theseelements, like the alkalis, are completely coupled to the detritalcomponent, although they may become enriched in turbidite sandsfrom heavy mineral concentrations. The high concentrations ofHFSE in sediments and the notoriously low concentrations in arcvolcanics provide convincing evidence against bulk assimilationof sediment in subduction zones. The transfer of material from the
subducting slab to the asthenosphere beneath arcs must be oneselective to certain elements (Morris and Hart, 1983).
5. Parent/daughter ratios. Although carbonate dilution has hada dramatic effect on concentrations of elements, the ratios ofseveral elements remain relatively constant throughout Site 765sediments, especially in the Cenozoic sequence. Indeed, we tookadvantage of the constant and upper crustal ratios for severalelements to refine our estimate of the bulk composition of Site765 sediments. For example, the Sm/Nd ratio is remarkably con-stant in Site 765 sediments, even though Sm concentrations mayvary by a factor of 20 because of cc dilution. Important radioactiveparent/daughter ratios, however, will vary significantly with car-bonate content. The most obvious is Rb/Sr, which decreasessignificantly in carbonate-rich lithologies as a result of bothdilution of Rb and incorporation of Sr in marine carbonates. TheU/Th ratio will vary in an inverse way, because Th is quantita-tively diluted, while U is somewhat taken up in carbonates (BenOthman et al., 1989). Thus, first-order variations in these importantparent-daughter ratios may also be controlled by carbonate content.
SEDIMENT SUBDUCTION ALONG THE SUNDATRENCH
Although not the specific aim of this study, these data for Site765 sediments have obvious applications to sediment recycling atthe Sunda Arc. Geophysical observations along the Sunda Trenchare ambiguous regarding structural evidence for sediment subduc-
185

T. PLANK, J. N. LUDDEN
tion. A large gradient in sediment thickness occurs along theSunda Trench (Fig. 17). In the northwest, south of Sumatra, theremay be as much as 5 km of sediment, much of which is beingaccreted in the forearc (Moore et al., 1980). Farther east, south ofJava, only a thin veneer of sediment approaches the trench: aslittle as 200 m in places (Moore et al., 1980). Available seismicdata, however, show little resolvable structure within the JavaTrench slope and thus leave open the question of sediment accre-tion (Curray et al., 1977).
The isotope 10Be was measured in samples from 10 volcanoeson Java and on Bali, and abundances were indistinguishable fromlavas in other tectonic settings (Tera et al., 1986). A lack of 10Beenrichment in Indonesian volcanics does not prove that sedimentswere not subducted beneath Java. Because 10Be has such a shorthalf-life (about 1.5 m.y.), it is present only in Neogene sediments,and the absence of 10Be in Java volcanics might simply mean thatNeogene sediments were not subducted and erupted within 10m.y. (the time over which 10Be decays). It is entirely possible thatolder sediments are being subducted. Whitford and Jezek (1982)suggested that sediments were incorporated in the source of Javamagmas, based on the radiogenic Pb isotopic compositions andsteep 207Pb/204Pb vs. 206Pb/204Pb trend defined by Java volcanics.These data have long served as one of the classic examples forsediment incorporation, even though no sediment data were avail-able at the time Whitford and Jezek (1982) formed their model.However, new Pb isotopic data for piston core samples of sedi-
ments outboard of Java overlap with the volcanics (Ben Othmanet al., 1989) and provide new support for the original interpreta-tion. Thus, the most compelling argument for subduction comesfrom Pb isotopic data.
Some data exist with which to extrapolate the lithologic andgeochemical stratigraphies developed at Site 765 regionally alongthe Sunda Arc. Several holes that penetrated basement were drilledduring DSDP Legs 22 and 27, and although recovery was poor(often less than 20%), data from these holes do provide a means ofestimating the lithologic sections around the Sunda Trench (seeFig. 17). These holes include two around the Australian margin(Sites 261 and 260), two farther west in the Wharton Basin (Sites212 and 213), and one just south of the Sunda Trench (Site 211).From descriptions in the Initial Reports volumes of these cruises,it appears that calcareous turbidites from the Australian marginextend as far north as Site 261 and as far west as Site 212 in theWharton Basin. Site 213 contains little carbonate, but has accumu-lated siliceous oozes since the Miocene. An extensive section ofSite 211 is composed of clastic turbidites of the Nicobar Fan.
A small amount of geochemical data has been published forsediments from Sites 261 and 260 (largely major elements; Cook,1974), Sites 211 through 213 (transition metals; Pimm, 1974), andfor a few piston cores outboard of the Sunda Trench (trace ele-ments and isotopes; Ben Othman et al., 1989; see Fig. 17). Be-cause no shared set of elements exists, one finds it difficult to drawmany regional conclusions. Future research will include isotopic
10°N
-\ 10°S
80°E 100 110° 120° 130c40°
Figure 17. Location map of other DSDP and ODP holes (closed circles) throughout the region outboard of the SundaTrench. Water depth in meters. Open circles are piston cores V34-47, V34-45, V28-341, and V28-343 from BenOthman et al. (1989) that are discussed in the text (other piston cores from Ben Othman et al., 1989, are on the northside of the Sunda Trench and are not discussed here).
186
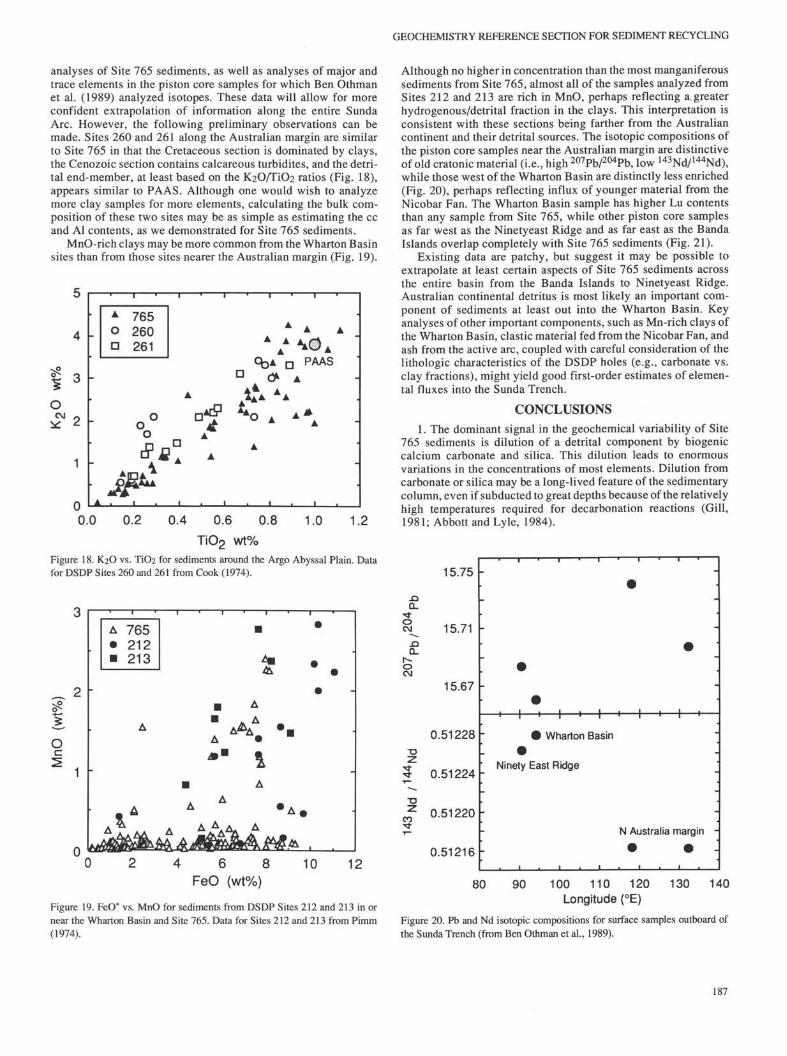
GEOCHEMISTRY REFERENCE SECTION FOR SEDIMENT RECYCLING
analyses of Site 765 sediments, as well as analyses of major andtrace elements in the piston core samples for which Ben Othmanet al. (1989) analyzed isotopes. These data will allow for moreconfident extrapolation of information along the entire SundaArc. However, the following preliminary observations can bemade. Sites 260 and 261 along the Australian margin are similarto Site 765 in that the Cretaceous section is dominated by clays,the Cenozoic section contains calcareous turbidites, and the detri-tal end-member, at least based on the K2θ/Tiθ2 ratios (Fig. 18),appears similar to PAAS. Although one would wish to analyzemore clay samples for more elements, calculating the bulk com-position of these two sites may be as simple as estimating the ccand Al contents, as we demonstrated for Site 765 sediments.
MnO-rich clays may be more common from the Wharton Basinsites than from those sites nearer the Australian margin (Fig. 19).
O
A
oD
765260261 A ^ ^ A
Cfc>A D PAASU O A
A .
0.0 0.2 0.4 0.6 0.8 1.0 1.2
TiO2 wt%Figure 18. K2O vs. Tiθ2 for sediments around the Argo Abyssal Plain. Datafor DSDP Sites 260 and 261 from Cook (1974).
2 -
O
1 "
A••
ML
765212213
mm
•
•
toCL
A
A
#
-
8 10 12FeO (wt%)
Figure 19. FeO* vs. MnO for sediments from DSDP Sites 212 and 213 in ornear the Wharton Basin and Site 765. Data for Sites 212 and 213 from Pimm(1974).
Although no higher in concentration than the most manganiferoussediments from Site 765, almost all of the samples analyzed fromSites 212 and 213 are rich in MnO, perhaps reflecting a. greaterhydrogenous/detrital fraction in the clays. This interpretation isconsistent with these sections being farther from the Australiancontinent and their detrital sources. The isotopic compositions ofthe piston core samples near the Australian margin are distinctiveof old cratonic material (i.e., high ^ P b / ^ P b , low 1 4 3 Nd/ 1 4 4 Nd),while those west of the Wharton Basin are distinctly less enriched(Fig. 20), perhaps reflecting influx of younger material from theNicobar Fan. The Wharton Basin sample has higher Lu contentsthan any sample from Site 765, while other piston core samplesas far west as the Ninetyeast Ridge and as far east as the BandaIslands overlap completely with Site 765 sediments (Fig. 21).
Existing data are patchy, but suggest it may be possible toextrapolate at least certain aspects of Site 765 sediments acrossthe entire basin from the Banda Islands to Ninetyeast Ridge.Australian continental detritus is most likely an important com-ponent of sediments at least out into the Wharton Basin. Keyanalyses of other important components, such as Mn-rich clays ofthe Wharton Basin, clastic material fed from the Nicobar Fan, andash from the active arc, coupled with careful consideration of thelithologic characteristics of the DSDP holes (e.g., carbonate vs.clay fractions), might yield good first-order estimates of elemen-tal fluxes into the Sunda Trench.
CONCLUSIONS
1. The dominant signal in the geochemical variability of Site765 sediments is dilution of a detrital component by biogeniccalcium carbonate and silica. This dilution leads to enormousvariations in the concentrations of most elements. Dilution fromcarbonate or silica may be a long-lived feature of the sedimentarycolumn, even if subducted to great depths because of the relativelyhigh temperatures required for decarbonation reactions (Gill,1981; Abbott and Lyle, 1984).
Q_^ J •
oCVJ
JOQ_
h~oCO
CO
15.75
15.71
15.67
0.51228
0.51224
0.51220
0.51216
H—i—I—i—h
0 Wharton Basin
Ninety East Ridge
N Australia margin -•80 90 100 110 120 130 140
Longitude (°E)
Figure 20. Pb and Nd isotopic compositions for surface samples outboard ofthe Sunda Trench (from Ben Othman et al., 1989).
187

T. PLANK, J. N. LUDDEN
α.Q.
1 0 -
5"
Δ Indonesia Piston Cores
° 765 Cenozoic
• 765 CretaceousA
WB
Δ 90E
Ban AAP
0.0 0.2 0.8 1.00.4 0.6
Lu (ppm)Figure 21. Sm and Lu concentrations for Site 765 sediments and the four piston
core samples shown in Figure 20 from the Banda region (BAN), Argo Abyssal
Plain (AAP), Ninetyeast Ridge (90E), and Wharton Basin (WB).
2. Significant differences occur between Cenozoic and Creta-ceous clays, involving increases in Fe, Ti, Mn, Ba, REEs, changesin REE patterns, and development of positive Ce anomalies downthe section. These variations may result from increases in hy-drogenous, hydrothermal, phosphate, and/or volcanic phases dur-ing the Cretaceous. Although important for identifying changesin the provenance, sediment supply, or rate with time, these phasesled to small deviations from the average composition of the hole,which is dominated by dilution of an average shale composition.
3. The K2O and AI2O3 downhole logs correspond well with"ground truth" chemical analyses. The bulk composition of thehole can be calculated by using the visual core descriptions toweight the individual analyses over appropriate intervals. Thiscomposition, however, agrees remarkably well (to 30% for mostelements) with an estimate based simply on average Australianshales and the average cc and AI2O3 contents of the hole. Thisresult suggests that estimating other sections dominated by car-bonate and continental detritus may require minimal analyticaleffort. Ideally, only core descriptions and logging data shouldprovide estimates of cc and Al contents that are accurate enoughto characterize a site.
4. Although Site 765 is an important reference section forsedimentary columns along the Sunda Arc, our results are moregeneral. Site 765 sediments are well described by dilution ofaverage shale by biogenic phases, and because average shalecompositions are remarkably similar around the world, resultsfrom Site 765 are general, not restricted to provenances or pro-cesses about the Indonesian region. Site 765 should thus serve asa useful reference for calculating other continental margin sec-tions approaching trenches around the world (e.g., the Antilles,Americas, Mediterranean). A recent study by Hay et al. (1988)about global distribution of sediments on the ocean floor esti-mated that roughly 40% of ocean sediments is calcium carbonateand roughly 45% is terrigenous detrital material. Therefore, Site765 sediments, dominated by cc and terrigenous detritus, is repre-sentative of a large part of the global marine sedimentary reservoir.
ACKNOWLEDGMENTS
We thank Ginger Eberhart, Gilles Gauthier, and BettinaDomeyer for technical assistance with the DCP, INAA, and XRFanalyses, respectively. Scott McLennan kindly provided unpub-
lished data and a preprint. We thank Charlie Langmuir for helpfuldiscussions and support, and S. M. McLennan and C. R. Czernafor useful reviews. Mitch Lyle and John Compton are especiallyappreciated for making themselves available for an onslaught ofquestions. T. Plank gratefully acknowledges financial supportfrom USSAC and from a JOI/USSAC Graduate Fellowship.
REFERENCES
Abbott, D., and Lyle, M., 1984. Age of oceanic plates at subduction andvolatile recycling. Geophys. Res. Lett., 11:951-954.
Aplin, A. C , 1984. Rare earth element geochemistry of Central Pacificferromanganese encrustations. Earth Planet. Sci. Lett., 71:13-22.
Barrett, T., Taylor, P. N., and Lugowski, J., 1987. Metalliferous sedimentsfrom DSDP Leg 92: the East Pacific Rise transect. Geochim. Cosmo-chim. Acta, 51:2241-2253.
Ben Othman, D., White, W. M., and Patchett, J., 1989. The geochemistryof marine sediments, island arc magma genesis and crust-mantlerecycling. Earth Planet. Sci. Lett., 94:1-21.
Bishop, J.K.B., 1988. The barite-opal organic carbon association inoceanic particulate matter. Nature, 332:341-343.
BMR Paleogeographic Group, 1990. Australia: Evolution of a Conti-nent: Canberra (Australian Govt. Publ. Serv.).
Cook, P. J., 1974. Major and trace element geochemistry of sedimentsfrom DSDP, Leg 27, Sites 259-263, eastern Indian Ocean. In Veevers,J. J., Heirtzler, J. R., et al., Init. Repts. DSDP, 27: Washington (U.S.Govt. Printing Office), 481^98.
Curray, J. R., Shor, G. G., Raitt, R. W., and Henry, M., 1977. Seismicrefraction and reflection studies of crustal structure of the EasternSunda and Western Banda arcs. /. Geophys. Res., 82:2479-2489.
Dymond, J., 1981. The geochemistry of Nazca Plate sediments: an evalu-ation of hydrothermal, biogenic, detrital, and hydrogenous sources. InKulm, L. D., Dymond, J., Dasch, D. M., and Hussong, D. M. (Eds.),Nazca Plate: Crustal Formation and Andean Convergence. Geol. Soc.Am. Mem., 154:133-174.
Elderfield, H., and Greaves, M. J., 1981. Negative cerium anomalies inthe rare earth element patterns of oceanic ferromanganese nodules.Earth Planet. Sci. Lett., 55:163-170.
Elderfield, H., and Pagett, R., 1986. Rare earth elements in ichtyholiths:variations with redox conditions and depositional environment. Sci.Total Environ., 49:175-197.
Francis, D., and Ludden, J. N., 1990. The mantle source for olivinenephelinite, basanite and alkali olivine basalt at Fort Selkirk, Yukon,Canada./. Petrol., 31:371^00.
Gill, J. B., 1981. Orogenic Andesites and Plate Tectonics: New York(Springer-Verlag).
Govindaraju, K., 1989. 1989 compilation of working values and sampledescription for 272 geostandards. Spec. Iss. Geostds. Newsl., 13:1—113.
Hay, W. M., Sloan, J. L., and Wold, C. N., 1988. Mass/age distributionand composition of sediments on the ocean floor and the global rateof sediment subduction./. Geophys. Res., 93:14933-14940.
Heming, R. F., and Rankin, P. C , 1979. Ce-anomalous lavas from Rabaulcaldera, Papua New Guinea. Geochim. Cosmochim. Acta, 43:1351-1355.
Hussong, D. M., Uyeda, S., et al., 1981. /n/r. Repts. DSDP, 60: Washing-ton (U.S. Govt. Printing Office).
Karig, D. E., and Kay, R. W., 1981. Fate of sediments on the descendingplate at convergent margins. Philos. Trans. R. Soc. London, 301:233-251.
Klein, E. M., Langmuir, C. H., and Staudigel, H. S., 1991. Geochemistryof basalts from the SE Indian Ridge, 115°-138°. /. Geophys. Res.,96:2089-2108.
Leinen, M., 1987. The origin of paleochemical signatures in North Pacificpelagic clays: partitioning experiments. Geochim. Cosmochim. Acta,51:305-319.
Ludden, J. N., Gradstein, F. M., et al., 1990. Proc. ODP, Init. Repts., 123:College Station, TX (Ocean Drilling Program).
McLennan, S. M., 1981. Trace element geochemistry of sedimentaryrocks: implications for the composition and evolution of the continen-tal crust [Ph.D. dissert.]. Australian National Univ., Canberra.
188
GEOCHEMISTRY REFERENCE SECTION FOR SEDIMENT RECYCLING
McLennan, S. M., Taylor, S. R., and Eriksson, K. A., 1983. Geochemistryof Archean shales from the Pilbara Supergroup, Western Australia.Geochim. Cosmochim. Acta, 47:1211-1222.
McLennan, S. M., Taylor, S. R., McCulloch, M. T., and Maynard, J. B.,1990. Geochemical and Nd-Sr isotopic composition of deep-sea tur-bidites: crustal evolution and plate tectonic associations. Geochim.Cosmochim. Acta, 54:2015-2050.
Moore, G. F., Curray, J. R., Moore, D. G., and Karig, D. E., 1980.Variations in geologic structure along the Sunda fore arc, northeasternIndian Ocean. In Hayes, D. E. (Ed.), The Tectonic and GeologicEvolution of Southeast Asian Seas and Islands. Am. Geophys. Union,145-160.
Morris, J. D., and Hart, S. R., 1983. Isotopic and incompatible elementconstraints on the genesis of island arc volcanics from Cold Bay andAmak islands, Aleutians, and implications for mantle structure. Geo-chim. Cosmochim. Ada, 47:2015-2030.
Nance, W. B., and Taylor, S. R., 1976. Rare earth element patterns andcrustal evolution. I. Australian post-Archean sedimentary rocks. Geo-chim. Cosmochim. Ada, 40:1539-1551.
Ninkovich, D., 1979. Distribution, age and chemical composition oftephra layers in deep-sea sediments off western Indonesia. / . Vol-canol. Geotherm. Res., 5:67-86.
Palmer, M. R., 1985. Rare earth elements in foraminifera tests. EarthPlanet. Sci. Lett., 73:285-298.
Pimm, A. C , 1974. Mineralization and trace element variaitons in deep-sea pelagic sediments of the Wharton basin, Indian Ocean. In von derBorch, C. C , Sclater, J. G., et al., Init. Repts. DSDP, 22: Washington(U.S. Govt. Printing Office), 469-476.
Schmitz, B., 1987. Barium, equatorial high productivity, and the north-ward wandering of the Indian continent. Paleoceanography, 2:63-77.
Schweller, W. J., Kulm, L. D., and Prince, R. A., 1981. Tectonics,structure, and sedimentary framework of the Peru-Chile Trench. Mem.Geol. Soc. Am., 154:323-349.
Staudigel, H., Doyle, P., and Zindler, A., 1985. Sr and Nd isotopicsystematics in fish teeth. Earth Planet. Sci. Lett., 76:45-46.
Taylor, S. R., and Gorton, M. P., 1977. Geochemical application of sparksource mass spectrometry. HI. Element sensitivity, precision andaccuracy. Geochim. Cosmochim. Acta, 41:1375-1380.
Taylor, S. R., and McLennan, S. M., 1985. The Continental Crust: ItsComposition and Evolution: Oxford (Blackwell Scientific).
Tera, F., Brown, L., Morris, J., Sacks, I. S., Klein, J., and Middleton, R.,1986. Sediment incorporation in island-arc magmas: inferences fromlOBe. Geochim. Cosmochim. Acta, 50:535-550.
Toyoda, K., Nakamura, Y., and Masuda, A., 1990. Rare earth elementsof Pacific pelagic sediments. Geochim. Cosmochim. Acta, 54:1093-1103.
von Huene, R., 1986. To accrete or not to accrete, that is the question.Geol. Rundsch., 75:1-15.
Warsi, W.E.K., Hilde, T.W.C., and Searle, R. C , 1983. Convergencestructures of the Peru Trench between 10°S and 14°S. In Hilde,T.W.C., and Uyeda, S. (Eds.), Convergence andSubduction. Tectono-physics, 99:313-329.
Watkins, J. S., Moore, J. C , et al., 1982. Init. Repts. DSDP, 66: Wash-ington (U.S. Govt. Printing Office).
Westbrook, G. K., Ladd, J. W., Buhl, P., Bangs, N., and Tiley, G. J., 1988.Cross section of an accretionary wedge: Barbados Ridge complex.Geology, 16:631-635.
Wheller, G. E., and Varne, R., 1986. Genesis of dacitic magmatism atBatur volcano, Bali, Indonesia: implications for origins of stratovol-cano calderas. J. Volcanol. Geotherm. Res., 28:363-378.
Whitford, D. J., 1975. Geochemistry and petrology of volcanic rocks fromthe Sunda arc, Indonesia [Ph.D. dissert.]. Australian National Univ.,Canberra.
Whitford, D. J., and Jezek, P. A., 1982. Isotopic constraints on the roleof subducted sialic material in Indonesian island-arc magmatism.Geol. Soc. Am. Bull., 93:504-513.
Date of initial receipt: 19 July 1990Date of acceptance: 16 August 1991Ms 123B-158
189


