
Advances in Physics Theories and Applications www.iiste.org
ISSN 2224-719X (Paper) ISSN 2225-0638 (Online)
Vol.29, 2014
23
A 32 Channel Modular Multi-Input Data Acquisition System for
Industrial Process Gamma Tomography (KAU-MIDAS-I)
Mohammed S. Aljohani
Department of Nuclear Engineering, Faculty of Engineering, King Abdulaziz University
P.O. Box 80204, Jeddah 21589, Saudi Arabia
Email of Corresponding Author: [email protected]
Abstract
This paper presents a nuclear instrumentation systems and Data Acquisition Software for acquiring and logging
data from Scintillation Detectors used in a Computerized Gamma Tomography Unit. The System, hereafter,
referred as ‘KAU-MIDAS-I’ is the first version of a 32 Channel Modular Data Acquisition System capable of
counting pulses from up to 32 NaI(TI) Scintillation Detectors at the same time which makes it very flexible, cost
effective and compact. The System is cased in standard 19” Industrial Racks to enable easy mounting and
mobility. KAU-MIDAS-I is designed especially for easiness to use with tomography applications providing
synchronization options with motion control systems of a typical scanning machine. Apart from this, KAU-
MIDAS-I can be used for tracer applications and various other nuclear radiation detection systems where in
NaI(TI) Scintillation detectors are used. The system is very compact with all the necessary devices and
instruments like HV Power Supply, Preamplifier, Amplifier, Single Channel Analyzer etc. for a single detector
on a single board instead of having a number of different modules for a single Channel. This saves a lot of space
and turns it into a portable and mobile system.
1. INTRODUCTION
The previous electronic systems used for Gamma CT with NaI detectors are Modular Systems in which the HV
Supply, Pre Amplifiers, Amplifiers, Single Channel Analyzers (SCA), Timers/Scalers etc. are bought and wired
to each other. This way, these systems are bulky and big [1,10]. Gamma photons randomly emitted from the
source and entering the detector crystal produces a light pulse, which is sensed and amplified by a
photomultiplier tube integrated with the detector. The biasing of the cathodes of the detectors (1000 Volts) is
provided by two high voltage power supplies (Canberra, Model 3002D). The voltage pulses are amplified using
timing filter amplifiers (Canberra 2111). The proposed system here is a completely integrated system which
making it modular as well as compact.
The other system available is the integrated system from Para Electronics, India. The proposed system has a
count Synchronisation accuracy in nano seconds where as the System of Para Electronics has Micro Seconds
accuracy. Other than that, the proposed system supports standalone operation and has an offline memory of 1
MB with features such as counter overflow handling which are not available in the previous integrated systems.
The amplifiers accept positive or negative current pulses from the detectors and deliver output pulses in the
range of ± 5V range. They have independent adjustments for the differential and integral time constants in their
RC-CR circuits. These controls enable one to shorten the tail of the signal pulse and to choose suitable
amplitude, respectively. The power to the amplifiers is fed by NIM/BIN power supplies (Canberra 2000).
The signals from the amplifiers are fed to discriminators to eliminate undesired secondary emissions. The
threshold for the discriminators is continuously adjustable from 15 mV to 1 V either by a potentiometer on the
front panel or by software control. A threshold voltage of 45 mV was found to be adequate for removing most of
the secondary emissions. Thus, the discriminator produces a logic pulse corresponding only to those photons
depositing their full energy in the detector.

Advances in Physics Theories and Applications www.iiste.org
ISSN 2224-719X (Paper) ISSN 2225-0638 (Online)
Vol.29, 2014
24
The logic pulses are counted directly using a multi channel 24 bit scalar (binary counter). The scalar also carries
a temporary buffer corresponding to each channel for storing the accumulated counts. A function generator
inputs a sine wave at a known frequency to one of the channels of the scalar as a reference input for error
control. A list sequencing crate controller with 8K FIFO (first in - first out) memory serves as a buffer when the
contents of the scalar are emptied at user specified sampling rates. When the FIFO memory is half full a
CAMAC (Computer Automated Measurement and Control) crate controller transfers its contents to the host
computer hard disk via a GPIB (General Purpose Interface Bus (IEEE 488)). The transfer from the scalar buffer
to the FIFO memory and then to the computer memory followed to the hard disk proceeds in parallel with no
data loss. The crate has a data bus that provides a pathway between the modules and a host computer. The crate
has a number of stations in which different modules (such as scalars, discriminators etc.) can be inserted. The
last two stations of the crate are meant for crate controllers whose purpose is to issue commands to the modules
and also transfer information between the modules and the host computer.
The system is very compact as the HV Power Supply, Amplifier and SCA are all combined into a single plug-in
module. The position of the PPMs can be interchanged .It permits to replace in case of any faults in the PPM
Modules. There is only a single cable for Power and Signal between the PPMs and Voltage Dividers which
makes wiring very easy and makes the cable management very easy in case of moving systems in Tomography
applications. A modular system with 1 Channel up to 32 Channels can be used. This helps in cost reduction as
the application with 1-8 eight detectors require 1 PPS along with MCCPU Module which will address their
requirement and applications with 9-16 detectors require two PPS along with MCCPU Modules and so on up to
32 detectors. The system can be used in Standalone mode with internal memories. This stores the acquired data
without the help of a PC. The data thus stored can be later transferred to a PC. The system is housed in a
standard 19” Rack which makes it an industry standard. The system can be moved on wheels and therefore it is a
mobile/portable system.
The distance between the voltage divider and PPM should be less than 15 meters to avoid data loss. This is a
limitation of single cable for both power and signal. The entire system had to be designed and developed from
scratch and thus consumed lot of time instead of purchasing and integrating the standard components available in
the market. The counter used is a 16bit counter and hence has a count limit of 216. Hence the dwell time should
be limited so that the counter value doesn’t over flow above this value. Only the LLD value of the discriminator
can be adjusted from the front panel of the system and the window can only be adjusted from inside the PCB.
This system is specially designed by considering requirements for tomography applications. Detectors are moved
around the scanning object by an electro-mechanical system in tomography applications. A synchronization
interface is provided between the motion controller of the tomography system and the data acquisition system to
correlate the data and the position of the system. Fig. 1 shows the pictorial representation of the complete system
from mechanical structure to the PC.
Figure 1. Pictorial Representation of the Complete Gamma CT Scanner

Advances in Physics Theories and Applications www.iiste.org
ISSN 2224-719X (Paper) ISSN 2225-0638 (Online)
Vol.29, 2014
25
The hardware supports two interfaces - TTL and 24V. This helps to directly connect PLC and other 24V
controllers directly to the data acquisition system. User could select the type of application i.e. tomography or
tracer, from the DAQ software on the PC.
The KAU-MIDAS-I System can be divided into three main Units as shown below. The block diagram of the data
acquisition system is illustrated in Fig. 2. The specialty of the system is that there is only single BNC cable
between Voltage Divided and KAU-MIDAS-I for both Power and Signal. Though there is restriction of length of
cable, such a configuration is very helpful for many applications where long cables are not required between
detector and Data Acquisition Systems.
Figure 2. Block Diagram of the Data Acquisition System
Pulse Processing System (PPS)
Pulse Processing System (PPS) is a very important building block of KAU-MIDAS-I. Each PPS is
capable of taking inputs from 8 NaI(TI) Scintillation Detectors. A typical Pulse Processing System is composed
of the following components:
• 1 Power Supply
• 8 Pulse Processing Modules (PPM)
• 1 DAQ Interface Module
Fig.3 shows the front view of a single PPS and the different cards it holds. Height of the PPS Sub rack
is 4U and the width is 84 HP. The positions of PPMs are interchangeable where as the position of DAQ I/f
Module and Power Supply modules are to be kept the same.

Advances in Physics Theories and Applications www.iiste.org
ISSN 2224-719X (Paper) ISSN 2225-0638 (Online)
Vol.29, 2014
26
Figure 3. Front View of a Pulse Processing System (PPS)
The power supply module has been designed to provide sufficient current to all other modules. The output
voltage is +5V and ±15V DC. Test points are available on the front panel for measurement. LED indicators are
also provided.
Pulse Processing Module includes a High Voltage Generation Circuit. Users can vary the HV values as per the
detector and PMT requirements between 0V to 1kV through a dial on the front panel. HV Supply is taken out to
the Voltage Divider by a BNC connector and pulses from detectors pulses are decoupled by capacitor and fed
into the low noise preamplifier circuit.
The output of the preamplifier is then fed into the amplifier. The gain of amplifier can be doubled by removing
the gain selection jumper available on PCB inside the PPM. Fine gain control on front panel varies the gain by a
factor of 2.
Spectroscopy Amplifier
Spectroscopy Amplifier is the very important part of the Pulse Processing Module (PPM). Fig. 4 below shows
the block diagram of spectroscopy amplifier.
Figure 4. Block Diagram of Spectroscopy Amplifier
Spectroscopy Amplifier is designed around standard monolithic Operational Amplifiers (OpAmps). It accepts
input pulses from preamplifier normally in nuclear instrumentation systems.
The amplifier has an input impedance of 1kΩ and it accepts positive voltage pulses with fast rise time (<500
nSec) and slow fall times (>40 µsec). Overall nominal gain of the amplifier is around 50.

Advances in Physics Theories and Applications www.iiste.org
ISSN 2224-719X (Paper) ISSN 2225-0638 (Online)
Vol.29, 2014
27
Pulse shaping is done by using active filter to provide nearly Gaussian positive unipolar output pulse. Time
constant of the amplifier output is around 2.3 µsec. The active pole-zero cancellation can be adjusted to match
preamplifiers with decay times >40 µsec. Normally, preamplifier pulses should have a rise time of 0.25 µsec to
properly match the amplifier filter network and a decay time greater than 40 µsec for proper pole-zero
cancellation. Otherwise, a bipolar pulse would be generated.
Single Channel Analyzer (SCA)
Single Channel Analyzer is basically a modified discriminator / comparator circuit that generates a TTL
compatible pulse corresponding to an input pulse that lies between base line (E) level and base line plus window
(E + ∆E) level. The block diagram of Single Channel Analyzer is illustrated in the Fig. 5 below:
Figure 5. Block Diagram of Single Channel Analyzer (SCA)
There is no output pulse for those input pulses, which are below or above this E + ∆E band. This is known as
differential discrimination. This is clearly explained in the Fig. 6 below.
Figure 6. Input & Output Waveforms for SCA

Advances in Physics Theories and Applications www.iiste.org
ISSN 2224-719X (Paper) ISSN 2225-0638 (Online)
Vol.29, 2014
28
For unipolar positive input pulses having same shapes, output pulse timing corresponds to time the time duration
in which the height of the input pulse and peak falls within the discrimination band selected. Output pulse thus
maintains time relation with the input pulse and hence this type of SCA is known as Time Single Channel
Analyzer (TSCA). Pulses falling between window widths (channel) are only presented at its output for counting
purposes.
Operation of TSCA is illustrated by Block Diagram. It should be noted that TSCA accepts unipolar positive
pulses and bipolar pulses with leading positive portion. Input pulse is DC coupled to the input stage of the TSCA
and any DC voltage offset in the input pulse will propagate through and will be added or subtracted from
baseline (E) setting and thereby cause inaccuracy. Hence, input DC level should be ideally close to Zero level for
faithful presentation of Baseline (E) settings.
Input stage is a biased amplifier with a gain of 0.5. Input pulse at (a) is shifted by E/2 from zero line and is given
at (b). Output of biased amplifier (b) is fed to Lower Level Discriminator (LLD), Upper Level Discriminator
(ULD) and Time Pick Off Discriminator (TPD).
In TPD, the signal is time differentiated. For bipolar pulses, an additional Pole-Zero cancellation network is
added to cancel third pole. TPD output is a 1 to 0 transition when input pulse has reached the peak value.
One shot Q output is inverted and given as TTL output pulse. However, firing of this One Shot 1 is only allowed
when the input pulse height is between the height interval of E and E + ∆E. The single channel operation is
realized if Q output of D flip flop is set to high level. This is achieved if D flip flop has been set by one shot 2
pulse as a result of LLD output and not yet reset by ULD output, which is inverted and fed to D type flip flop
CLR input, indicating that the input pulse being analyzed is higher than E + ∆E. However, in the absence of
ULD output pulse, D type flip flop would remain to the high state and allow One Shot 1 to generated pulse. One
Shot 1 pulse is then used to bring Q of D type flip flop back to ‘0’ state as it is used as a clock pulse to transfer D
value (0 State) to output. TSCA appears as output pulse when one Shot 2 output is inverted.
TSCA thus produces a TTL level output pulse with ‘0’ state less than 0.5 Volts and 1 state greater than 2.5 volts
when input pulse is above base line E level and below base line plus window, E + ∆E setting. Baseline is
adjustable from 0.2 volts to 10 volts by graduated heliport dial mounted on front panel. Window width is
adjustable from 20mv to 2 volts by a potentiometer on the PCB. The only restriction for the input pulse is that it
should be a positive leading edge unipolar or bipolar pulse and it should have negligible DC offset associated
with it.
HV Power Supply, Preamplifier, Amplifier and TSCA are all incorporated on a single PCB, operating on ±15
Volts available from Power Supply Module. Most of the controls are available on the front panel for easy
operation.
High Voltage Power Supply
The high voltage power supply used here is a driven type circuit. Fig. 7 shown below shows the block diagram
of the High Voltage Power Supply. A 15 VDC supply is used for generating the high voltage. A complimentary
square wave generating IC along with a couple of transistors feed an alternating voltage at primary coil of step
up transformer. The secondary side of the transformer is connected to a diode based voltage doubler circuit. The
part of the output DC voltage is taken as feedback to error amplifier. The output of this error amplifier is
connected to center tap of primary side of transformer inturn controls the dc voltage on the center tap of primary
of high voltage transformer.

Advances in Physics Theories and Applications www.iiste.org
ISSN 2224-719X (Paper) ISSN 2225-0638 (Online)
Vol.29, 2014
29
Figure 7. Block Diagram of High Voltage Power Supply Circuitry
The other input of error amplifier is connected to the DC variable reference voltage, which is generated by the
zener diode. The output of zener reference is fed to the potentiometer (mounted on front panel). This
potentiometer serves as a control to set different output high voltage values. This potentiometer is a 10 turn
heliport with calibrated dial. The output voltage is settable between 0 to +1000 volts for full scale of the dial.
DAQ Interface Module
Output of each PPM is routed through the DAQ Interface Unit of the corresponding PPS. Actually, this
module acts as a link between PPS and 32 Channel DAQ (MCCPU Module). For a fill fledged System there will
be 4 PPS with 8 PPMs, 1 DAQ Interface Module and 1 Power Supply Module each thus completing the
requisites for 32 Channels. SCA outputs are simultaneously given to monoshot to increase pulse width. Visual
indicators (LEDs) are driven by output of monoshot .
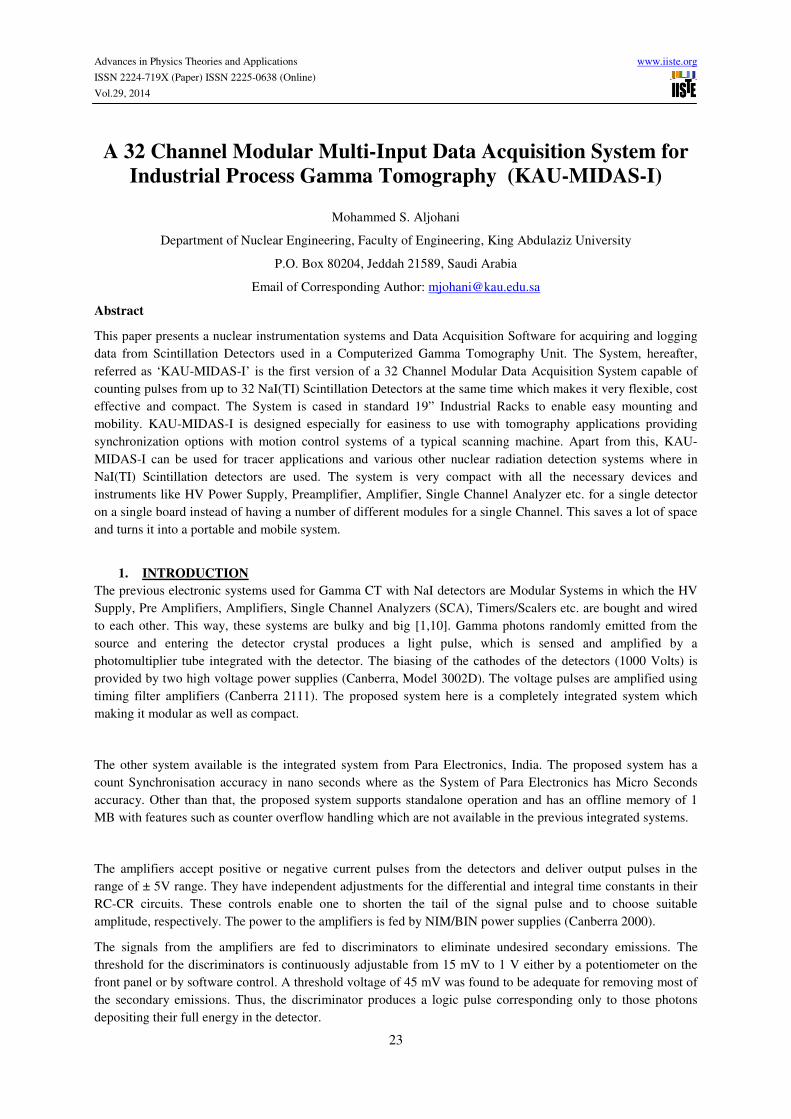
Specifications
The specifications of different functional components of the System are furnished below in Table 1.
Advances in Physics Theories and Applications www.iiste.org
ISSN 2224-719X (Paper) ISSN 2225-0638 (Online)
Vol.29, 2014
30
Table 1. Specifications of Different Functional Components of the System
MCCPU
This part of the system is designed for Tomography and Cross co-relation applications based on tracer
studies. This system supports 32 Scintillation Detectors. PC based application software captures the data over
USB from the hardware.
The system is specially designed to support motion controllers in tomography applications,
along with other standard applications like tracer experiments.
In some experiments where dwell time is large, total experiment continues for hours. In such
cases, PC remains idle for most of the time. ‘Stand-alone operation’ feature lets the system operate without a PC,
Power Supply Module
Input 230V, 50 Hz, 1ϕ Mains Supply
Output +5 VDC regulated
±15 VDC regulated
Mechanical Height 4U, 19” Rack
HV Supply
Range 0-1000V adjustable through 10 turn pot
Amplifier
Input Preamplifier Signal from NaI(TI) detector
Rise Time 100 nSec
Fall Time 30 µSec
Amplitude of Input Pulse 100 – 200 mV
Polarity Output Positive
Shaping 1 µS near Gaussian
Gain x50 Overall
Baseline Restoration Available
Single Channel Analyzer
Input 0 to +10V pulse internally connected
Threshold Upto 10V settable through heliport
Window 0 to 2V settable through internal pot.
Output TTL pulse with around 1 µSec
Window/Threshold mode selection is possible through Jumper (JP) on PCB

Advances in Physics Theories and Applications www.iiste.org
ISSN 2224-719X (Paper) ISSN 2225-0638 (Online)
Vol.29, 2014
31
once it is configured and acquisition is started. The system stores all the data to internal memory in this mode.
Data could be loaded to a PC when data acquisition is finished since the memory is non-volatile the data resides
in the system until it is over written in the next stand-alone operation.
The fig. 8 below shows the block diagram of the MCCPU Module.
Figure 8. Block Diagram of MCCPU Module
2. OPERATION OF THE SYSTEM
The Fig. 9 below shows the front view of the complete KAU-MIDAS-I. Outputs from the PPS racks are fed to
this system which counts the TTL pulses on each channel as configured by the DAQ software on PC. 32
channels from the four PPS racks enter the four connectors on back side. The counts acquired could be either
streamed to the DAQ software on the PC or it could be saved to on board memory (up to 2Mb) and retrieved
later to the PC. A character display on front panel displays the status of the system. USB port (Type B) is
provided on the front panel for communication with the PC. Terminal for interface with the motion controller
system is provided on the back side of this unit.

Advances in Physics Theories and Applications www.iiste.org
ISSN 2224-719X (Paper) ISSN 2225-0638 (Online)
Vol.29, 2014
32
Figure 9. Front View of KAU-MIDAS-I
a. Specifications
The Technical Specifications of the MCCPU Module which acts as the interface between PC and PPS is
furnished below in Table. 2
Table 2. Specifications of MCCPU Module
No. of Input Channels 32 each independently selectable TTL Channels
Count Limit/Channel 65535
Dwell Time Range 10 ms – 1000 s *
Max. Data Block Size 255
Max. Data Block Count 232
Motion Control Interface Available in TTL and HTL Versions
PC Interface USB
Standalone Operation Available (2 Mbytes on board Memory)
Power Supply 5 – 5.5V, 300 mA
* Max. dwell time is limited by the count limit. It should be limited as 1000s in PC Software. Hardware
Limit is 232
ms.

Advances in Physics Theories and Applications www.iiste.org
ISSN 2224-719X (Paper) ISSN 2225-0638 (Online)
Vol.29, 2014
33
3. DATA ACQUISITION SOFTWARE
The Fig. 10 below is the screen shot of KAU-DAQ-1 Data Acquisition Software – Control Mode. The software
is designed and developed to configure and operate the System and acquire the date from MCCPU module
online or offline via USB interface. When the device is connected to the system Software will automatically
detect the System.
Figure 10. Screenshot of Data Acquisition Software – Control Mode
Device status is shown on bottom status bar. If the device is not connected some software functions will be
inactive. The inactive features are indicated by button with gray colour and active features are indicated by
button with blue colour as shown in the above picture.
The Buttons are the control buttons used for start and stop of the system and save the data to the hard disk of the
computer. The data from the inbuilt memory of the system can be loaded to the computer using load button.
Before operating the system should be configured properly. It is done by selecting the configuration tab on the
top of the window. Once the configure tab is selected, configuration pan will be appeared. Here, the system can
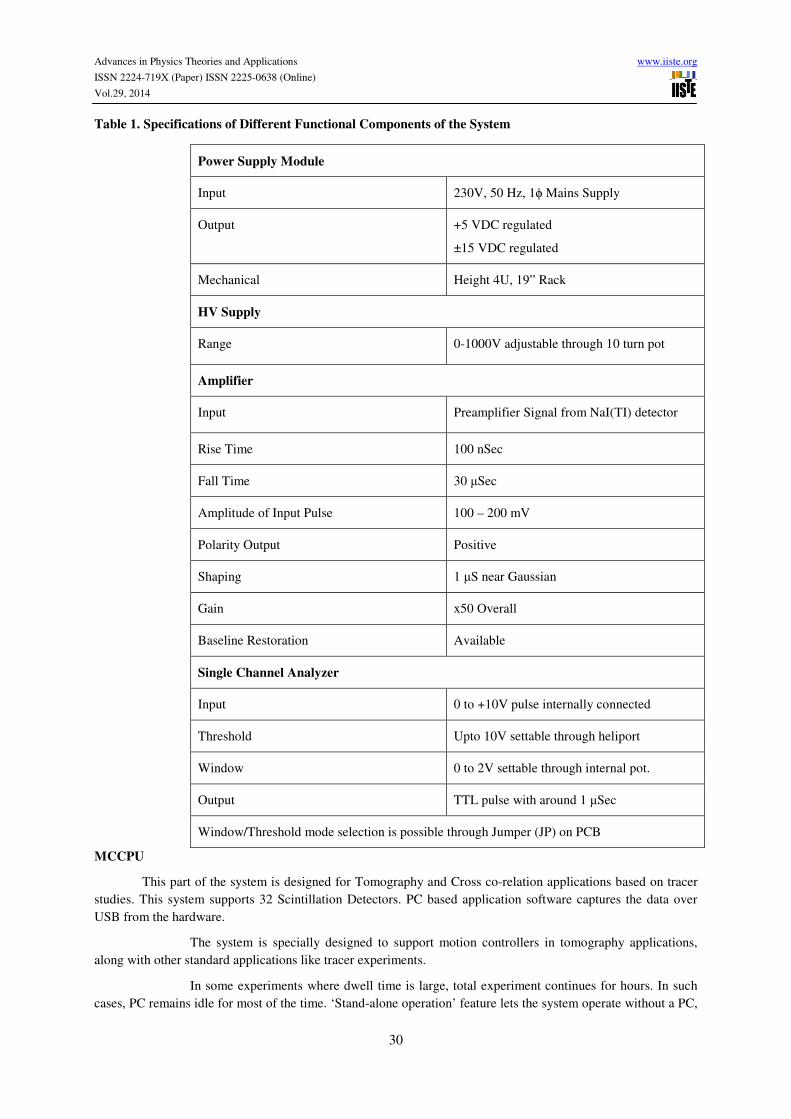
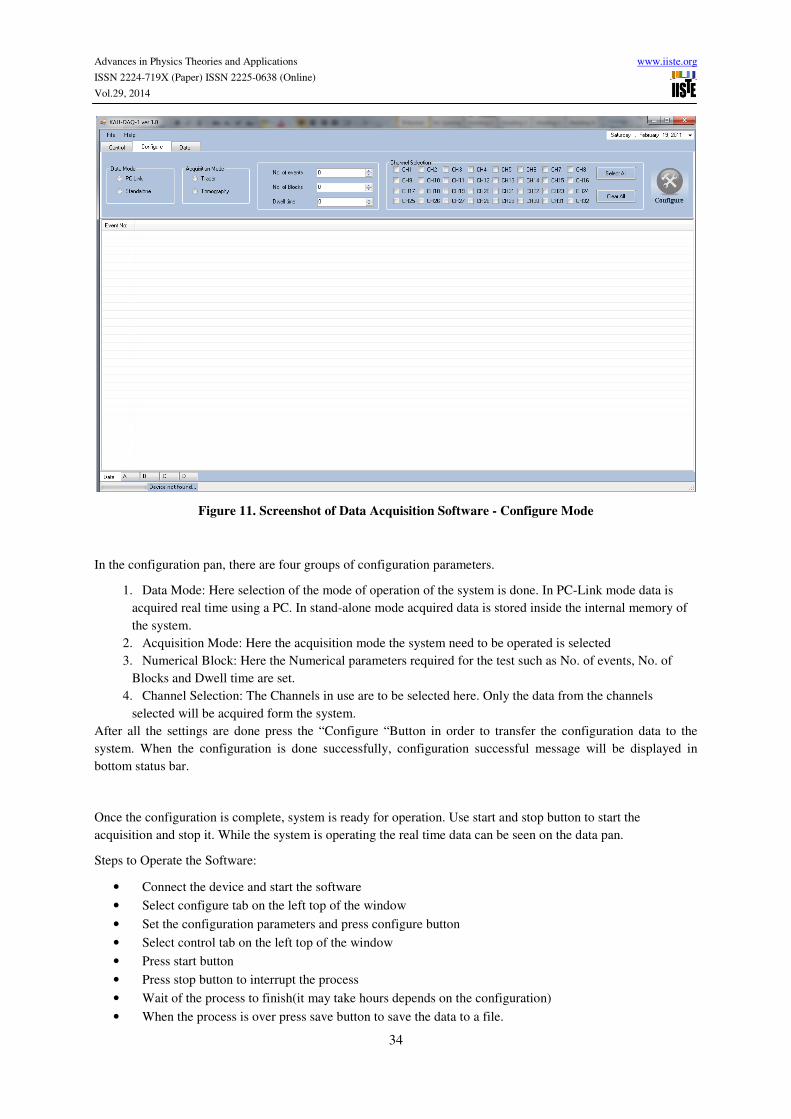
be configured with a few mouse clicks. The Fig. 11 shows the Screenshot of the software in Configure Mode.
Advances in Physics Theories and Applications www.iiste.org
ISSN 2224-719X (Paper) ISSN 2225-0638 (Online)
Vol.29, 2014
34
Figure 11. Screenshot of Data Acquisition Software - Configure Mode
In the configuration pan, there are four groups of configuration parameters.
1. Data Mode: Here selection of the mode of operation of the system is done. In PC-Link mode data is
acquired real time using a PC. In stand-alone mode acquired data is stored inside the internal memory of
the system.
2. Acquisition Mode: Here the acquisition mode the system need to be operated is selected
3. Numerical Block: Here the Numerical parameters required for the test such as No. of events, No. of
Blocks and Dwell time are set.
4. Channel Selection: The Channels in use are to be selected here. Only the data from the channels
selected will be acquired form the system.
After all the settings are done press the “Configure “Button in order to transfer the configuration data to the
system. When the configuration is done successfully, configuration successful message will be displayed in
bottom status bar.
Once the configuration is complete, system is ready for operation. Use start and stop button to start the
acquisition and stop it. While the system is operating the real time data can be seen on the data pan.
Steps to Operate the Software:
• Connect the device and start the software
• Select configure tab on the left top of the window
• Set the configuration parameters and press configure button
• Select control tab on the left top of the window
• Press start button
• Press stop button to interrupt the process
• Wait of the process to finish(it may take hours depends on the configuration)
• When the process is over press save button to save the data to a file.

Advances in Physics Theories and Applications www.iiste.org
ISSN 2224-719X (Paper) ISSN 2225-0638 (Online)
Vol.29, 2014
35
4. RESULTS & ANALYSIS
Fig. 12 shows the output of the Preamplifier as monitored on a digital oscilloscope when a 3 µCi Cs-137 source
was monitored using a NaI(TI) detector. The curve shows a negative pulse because the voltage is monitored in
terms of a dip in the applied HV. The small overshoot after the negative pulse is due to the time constant in the
amplifier circuit.
Figure 12. Output of Preamplifier
Fig. 13 shows the output of the Amplifier as monitored on a digital oscilloscope when a 3 µCi Cs-137 source
was monitored using a NaI(TI) detector. The Gaussian shape to the curve is obtained after a series of pulse
shaping techniques applied on the output of the Preamplifier.
Figure 13. Output of Spectroscopy Amplifier
Fig. 14 shows the output of the Single Channel Analyzer (SCA) as monitored on a digital oscilloscope when a 3
µCi Cs-137 source was monitored using a NaI(TI) detector. SCA generated 5 V Pulses according to the Gaussian
pulses received from the amplifier.

Advances in Physics Theories and Applications www.iiste.org
ISSN 2224-719X (Paper) ISSN 2225-0638 (Online)
Vol.29, 2014
36
Figure 14. Output of SCA
5. CONCLUSIONS & RECOMMENDATIONS
The component mounting technology used in the PPM can be changed from Through Hole (THT) to Surface
Mount (SMD) so that the size of the module can be reduced much more.
The counting and processing unit is based on 16 bit counters which limit the maximum count in an event to
65535. This could be improved by using counters with more counting capacity.
‘Window Adjust’ function in the PPM card is implemented on the PCB and is currently factory set. This can be
brought to the front panel so that user can change the window width.
Analog controls of the PPM cards can be replaced by digital controls so that parameters for each card could be
set from a single user panel in the PPS.
CPU Memory capacity of 2Mb could be improved (100Mb etc) by using memory card by buffering counts and
saving to card during dwell time so that very long experiments can be conducted without using PC.
REFERENCES
1. J.S. Charlton (Ed), Radioisotope techniques for problem-solving in industrial plants, Leonard Hill (1986).
2. P. Zhu, P. Duvauchelle, G. Peix and D. Babot, X-ray Compton backscattering techniques for process
tomography: imaging and characterization of materials, Meas. Sci. Technol. 7 (1996) 281.
3. R. Cesareo and S. Mascaienhas. A new tomogaphic device based on the detection of fluorescent X-rays, Nucl.
Instr. Meth. A277 (1989) 669.
4. D.J. Parker and P.A. McNeill, Positron emission tomography for process applications, Meas. Sci. Technol. 7,
No. 3 (1996) 287.
5. H. Stitt and K. James, Process tomography and particle tracking: research and commercial diagnostic tool
Proceedings of the 3rd World congress on industrial process tomography, Banff, Canada, 2-5 September
(2003) 2.
6. A Kantzas, L Wright N. Kalogerakis, Quantification of channelling in polyethylene resin fluid beds using x-
ray computer assisted tomography (CAT), Chem. Eng. Sci. 52 No. 13 (1997) 2023-2035.
7. GA. Johansen and P. Jackson, Radioisotope gauges for industrial process measurements, John Wiley & Sons,
Ltd. (2004).
8. RP. Gardner, R.H. Bean and J.K. Ferrell, On the gamma-ray one-shot-collimator measurement of two-phase-
flow void fractions, Nucl. Appl. Technol. 8 (1970) 88.
9. MW. Darwood, M. Davies, D. Godden P. Jackson, K James & E.H. Stitt, Development and implementation of
X-ray tomography for field applications, Proceedings of the 3rd World congress on industrial process
tomography, Banff, Canada, 2-5 September (2003) 207.
10. J. Abdullah, G.H.P. Mohamad, MA. Hamzah, M.S.M. Yusof, M.F.A. Rahman,F. Ismail and RM.Zain,
Development of a portable computed tomographic scanner for on-line imaging of industrial piping systems
Proceedings of the 5th National seminar on non-destructive testing, Shah Alam, Malaysia 1-3 October
(2003).

Advances in Physics Theories and Applications www.iiste.org
ISSN 2224-719X (Paper) ISSN 2225-0638 (Online)
Vol.29, 2014
37
11. C. Boyer and B. Fanget, Measurement of liquid flow distribution in trickle bed reactor of large diameter with
a new gamma-ray tomographic system Chem. Eng. Sci 57, (2002) 1079.
12. B.S. Kumar, D. Moslemian and M.P. Dudukovic, A gamma-ray tomographic scanner or imaging of void
distribution in two phase flow systems, Flow Meas. Instrum 6, No.1, (1995) 61.
13. F. Natterer, The mathematics of computerized tomography, John Wiley & Sons (1986).
14. GA. Johansen, T. Frystein, B.T. Hjertalier and O. Olsen, A dual sensor flow imaging tomographic system,
Meas. Sci. Technol, 7 (1996) 297.
15. MS.A. Abouelwafa and EJM. Kendall, The measurement of component ratios in multiphase systems using
gamma-ray attenuation J. Phys. E: Sci. Instrum. 13 (1980) 341.
16. V. L. Giavitis, J. S. Watt, L. J. Muldoon and E. M. Cochrane, Long-term trial of a dual energy gamma-ray
transmission gauge determining the ash content of washed coking coal on a conveyer belt, Nucl. Geophys.
1, No. 2 (1987) 111.
17. GA. Johansen and P. Jackson, Salinity independent measurement of gas volume fraction in oil/gas/water pipe
flow, Appl Rad. Isotop., 53, (2%) 595.


