

http://www.bio-protocol.org/e1519 Vol 5, Iss 13, Jul 05, 2015
A Chemical Genetic Screening Procedure for Arabidopsis thaliana Seedlings Marta Bjornson1, 2, Xingshun Song3, Abhaya Dandekar1, Annaliese Franz4, Georgia Drakakaki1
and Katayoon Dehesh2*
1Department of Plant Sciences, University of California, Davis, USA; 2Department of Plant
Sciences, University of California, Davis, USA; 3College of Life Science, Northeast Forestry
University, Harbin, China; 4Department of Chemistry, University of California, Davis, USA *For correspondence: [email protected]
[Abstract] Unbiased screening approaches are powerful tools enabling identification of novel
players in biological processes. Chemical genetic screening refers to the technique of using a
reporter response, such as expression of luciferase driven by a promoter of interest, to
discover small molecules that affect a given process when applied to plants. These chemicals
then act as tools for identification of regulatory components that could not otherwise be
detected by forward genetic screens due to gene family redundancy or mutant lethality. This protocol describes a chemical genetic screen using Arabidopsis thaliana seedlings,
which has led to recognition of novel players in the plant general stress response.
Materials and Reagents
1. Reporter line seeds (this protocol was developed using luciferase under control of a
minimal promoter containing four copies of the rapid stress response element -
4xRSRE:LUCIFERASE)
2. Murashige and Skoog basal medium (Sigma-Aldrich, catalog number: M0404)
3. Phytoagar (PlantMedia, catalog number: 40100072-2)
4. Sterile disposable reagent reservoir (Corning, catalog number: 07-200-128)
5. Bleach (Clorox concentrated, 8.25% sodium hypochlorite)
6. Hydrochloric acid (HCl)
7. Chemical library (source may vary)
8. Potassium luciferin (Gold Biotechnology, model: LUCK-1G)
9. ¼ strength MS media (see Recipes)
10. 1 mM luciferin (see Recipes)
Equipment
1. Micropore surgical tape (3M, model: 1530-0)
2. 1.5 ml tubes (SealRite, catalog number: 1615-5500)
3. 96 well plates with lid: Flat bottom, sterile but not tissue culture treated (SARSTEDT
AG, catalog number: 82.1571.001)
Copyright © 2015 The Authors; exclusive licensee Bio-protocol LLC. 1

http://www.bio-protocol.org/e1519 Vol 5, Iss 13, Jul 05, 2015 4. Filter paper (here used Whatman 1440 125, pore size does not matter)
5. Toothpicks
6. Laminar flow hood or biosafety cabinet (here used SterilGARD ii, the Baker Company)
7. Chemical fume hood (here used St. Charles)
8. Vacuum chamber
9. Multichannel pipette (2-20 and 20-200 µl) (Rainin)
10. Temperature-controlled growth cabinet (here used Conviron, model: GR48)
11. Charge-Couple Device camera (CCD camera; Andor DU434-BV CCD)
12. Dehesh lab Perl scripts
(http://www-plb.ucdavis.edu/labs/dehesh/dehesh-lab-code.html)
Software
1. ANDOR Solis analysis software (Andor technology, v15,
http://www.andor.com/scientific-software)
2. ImageJ image analysis software (http://imagej.nih.gov/ij/)
Procedure A. Preparation
1. To synchronize germination and improve developmental consistency among seedlings,
pre-select the larger and more uniformly sized seeds from selected Arabidopsis
thaliana (Arabidopsis) reporter line by pouring seeds several times along a sheet of
paper. The smallest seeds tend to stick to paper via electrostatic forces and can easily
be discarded.
Note: Using seeds harvested at the same time, from plants grown under the same
conditions, will also improve seedling uniformity.
2. Autoclave filter paper, toothpicks, and filter tips for 200 µl pipet. Surface-sterilize
size-selected seeds:
a. Aliquot approximately 50-100 µl size-selected seeds in 1.5 ml tube with
chlorine-resistant label.
b. In chemical fume hood, place open 1.5 ml tubes in rack in vacuum chamber with
beaker containing ~100 ml bleach.
c. Add 3 ml HCl to beaker and close vacuum chamber.
d. Apply vacuum for 5-10 sec to seal chamber.
e. After 2.5-3 h, open chamber (still in fume hood) and close lid of 1.5 ml tubes.
3. Prepare solid ¼ strength MS media according to the recipe below.
Note: This protocol is for seeds grown on solid media, but similar screens have been
performed on plants grown in liquid media.
Copyright © 2015 The Authors; exclusive licensee Bio-protocol LLC. 2

http://www.bio-protocol.org/e1519 Vol 5, Iss 13, Jul 05, 2015 B. Plating seeds
1. “Pour” MS media into 96-well plates. Inside sterile hood, pour molten media into sterile
reagent reservoir. Set multichannel pipet at desired volume + 10% (for 100 µl, set at
110). Draw media up from reservoir and eject into 96-well plate 1 row at a time.
Notes:
a. Bubbles in the wells make plating seeds difficult. To minimize the incidence of
bubbles and mis-filled wells, (a) touch the pipet tips to the corner between bottom
and side of well before ejecting and (b) do not eject the media fully, only to the first
stop of the multichannel pipet. This results in some media remaining in pipet tips,
but greatly reduces bubbles.
b. If you do not work quickly enough, media may solidify in the reservoir or pipet tips.
To avoid this we recommend starting with >65 °C media. If it becomes a problem,
simply eject and replace tips or reservoir.
2. Pour sterilized seeds onto filter paper. Using moistened tip of sterile toothpick, pick up
and place one seed per well of the 96-well plate.
Note: This allows a second opportunity for seed size selection. We observe significant
differences between responses of border wells, at the edge of the plate, and internal
wells. You should test for this difference and if necessary do not apply treatments or
measure border wells. If border wells will not be measured then place any remaining
smaller seeds in these, using uniformly larger seeds for internal wells.
3. Tape edges of 96-well plates with micropore surgical tape to maintain sterility and
humidity.
C. Seedling growth
1. Stratify seeds for 3-5 days in the dark at 4 °C.
2. Grow seedlings under typical Arabidopsis plate growth conditions (22-24 °C under 16
h light (60-80 µE) /8 h dark).
3. Six days after placing under light, seedlings should have expanded cotyledons and
two visible true leaves, ready for treatment with luciferin (Figure 2A). To reduce
background it is best to proceed with luciferin treatment 18-24 h before imaging.
Note: We apply luciferin via spray, with detergent (see Recipes). To reduce false
positives/negatives one must ensure uniform substrate availability by saturating all
wells. In screening we achieved this uniformity by spraying twice from approximately 6
inches above the plate for each of left and right sides of the plate, followed by three
sprays from approximately 9 inches above the plate tracking from left to right.
D. Imaging
1. At seven days post-stratification, move plates from growth chamber to the lab bench
several hours prior to imaging.
Note: In the case of 4xRSRE:LUCIFERASE-expressing seedlings, plates were moved
Copyright © 2015 The Authors; exclusive licensee Bio-protocol LLC. 3
http://www.bio-protocol.org/e1519 Vol 5, Iss 13, Jul 05, 2015 at 8 am, four hours before imaging at noon. This was done to minimize modulation of
physiological responses, and by extension luciferase activity, associated with
changing plant environment. The time interval between moving and imaging may vary
depending on the nature of the experiment, but beginning imaging at the same time
throughout screen is advisable due to possible interaction with circadian-regulated
processes.
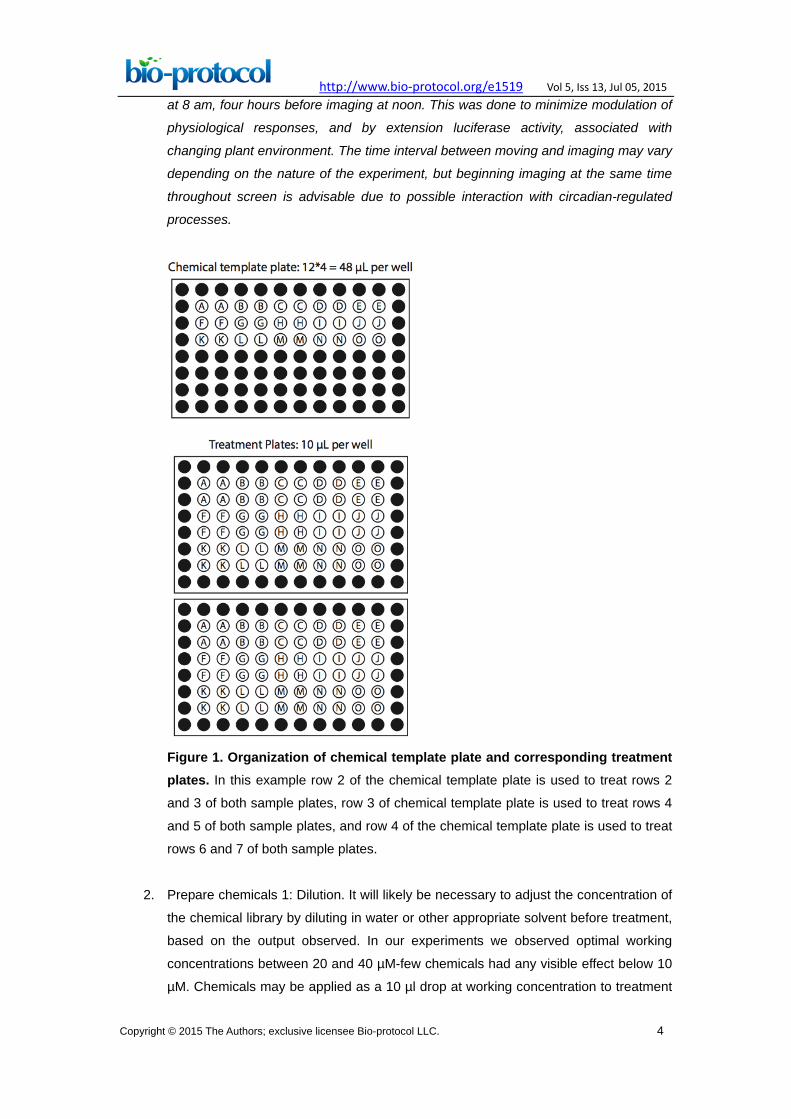
Figure 1. Organization of chemical template plate and corresponding treatment plates. In this example row 2 of the chemical template plate is used to treat rows 2
and 3 of both sample plates, row 3 of chemical template plate is used to treat rows 4
and 5 of both sample plates, and row 4 of the chemical template plate is used to treat
rows 6 and 7 of both sample plates.
2. Prepare chemicals 1: Dilution. It will likely be necessary to adjust the concentration of
the chemical library by diluting in water or other appropriate solvent before treatment,
based on the output observed. In our experiments we observed optimal working
concentrations between 20 and 40 µM-few chemicals had any visible effect below 10
µM. Chemicals may be applied as a 10 µl drop at working concentration to treatment
Copyright © 2015 The Authors; exclusive licensee Bio-protocol LLC. 4

http://www.bio-protocol.org/e1519 Vol 5, Iss 13, Jul 05, 2015 wells; dilute each chemical to produce a total volume sufficient for 12 µl per well to
account for pipetting errors.
Note: Some chemical solvents, such as dimethyl sulfoxide (DMSO), may affect the
output signal. Prior to a large-scale screen, one should check for solvent effects at
desired dilution level. We recommend a “diluted solvent” negative control, in addition
to a no treatment control and where possible a positive control, on each plate.
3. Prepare chemicals 2: Template plate. Prepare a chemical template plate on ice, with
working concentration of chemicals in the same arrangement as they will be applied to
treatment plate. We recommend applying each chemical to at least 8 replicate wells.
This should yield at least 6 suitable seedlings to measure response. If replicate wells
are placed in columns, one row on the chemical template plate may apply to multiple
rows on the treatment plate (Figure 1).
Notes:
a. If border wells will not be assayed this must be reflected in the chemical template
plate.
b. The number of seedlings devoted to each chemical treatment should be
determined by variability in the system of interest and practical constraints, i.e. the
number of chemicals to be tested.
Figure 2. Representative 96-well plates. (A) 7-day old seedlings. Note the set of four
wells boxed in red, reflecting two of the potential issues in plating. This set of wells
shows poor germination resulting in plants too small for reliable analysis, and two
seedlings erroneously germinated in one well (marked with *), eliminating them for
analysis. Panel (B) shows multichannel pipet chemical application.
4. Treat seedlings by transferring chemicals from template to treatment plate using
multichannel pipette. It is important to not disturb the seedlings-if seedlings are
wounded by a pipet tip it may change how chemicals are perceived and thus their
response. We recommend touching the pipet tips to well sides away from seedlings,
as close to agar as possible in order to minimize splashing or chemical adhesion to the
side of the well (Figure 2B). Once all chemicals have been applied gently rock the
plate for ~5 sec to ensure even chemical distribution in wells.
Copyright © 2015 The Authors; exclusive licensee Bio-protocol LLC. 5
http://www.bio-protocol.org/e1519 Vol 5, Iss 13, Jul 05, 2015 Note: In this screening technique, it is not defined how the plant takes up the chemical.
The chemical droplet may be taken up from the surface of the agar through the
hypocotyl/cotyledon/leaves, in which case the working concentration is perceived.
Alternatively, the chemical may be taken up through the roots after chemical diffusion
into media. In this case, the media itself further dilutes the chemical and the perceived
concentration may be as little as 1/10 the applied working concentration (10 µl
chemical applied diluted into 100 µl media).
5. Imaging conditions will depend on reporter used, but we recommend imaging for up to
triple the time of typical response, to allow for delayed response as chemical diffuses
through media, etc. We used a 20 h time course of five minute exposures of a CCD
camera within a light-tight box, controlled by the ANDOR Solis v15 image analysis
software (http://www.andor.com/scientific-software).
E. Analysis/re-screening
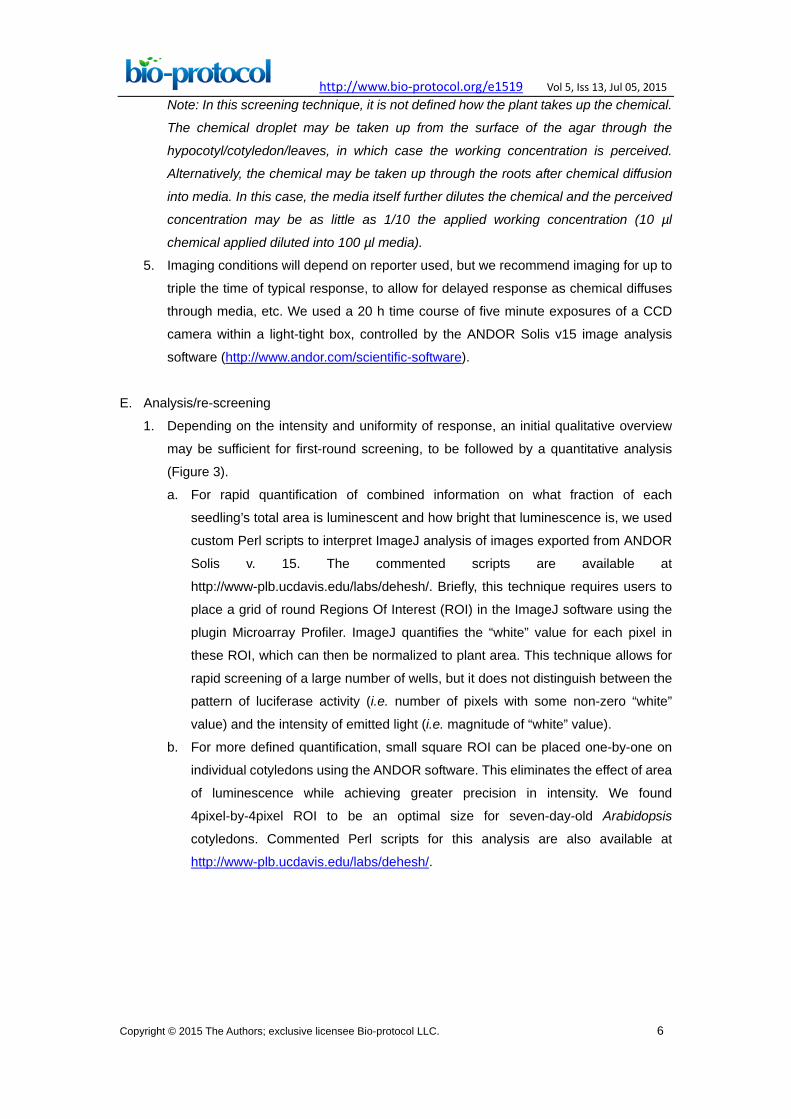
1. Depending on the intensity and uniformity of response, an initial qualitative overview
may be sufficient for first-round screening, to be followed by a quantitative analysis
(Figure 3).
a. For rapid quantification of combined information on what fraction of each
seedling’s total area is luminescent and how bright that luminescence is, we used
custom Perl scripts to interpret ImageJ analysis of images exported from ANDOR
Solis v. 15. The commented scripts are available at
http://www-plb.ucdavis.edu/labs/dehesh/. Briefly, this technique requires users to
place a grid of round Regions Of Interest (ROI) in the ImageJ software using the
plugin Microarray Profiler. ImageJ quantifies the “white” value for each pixel in
these ROI, which can then be normalized to plant area. This technique allows for
rapid screening of a large number of wells, but it does not distinguish between the
pattern of luciferase activity (i.e. number of pixels with some non-zero “white”
value) and the intensity of emitted light (i.e. magnitude of “white” value).
b. For more defined quantification, small square ROI can be placed one-by-one on
individual cotyledons using the ANDOR software. This eliminates the effect of area
of luminescence while achieving greater precision in intensity. We found
4pixel-by-4pixel ROI to be an optimal size for seven-day-old Arabidopsis
cotyledons. Commented Perl scripts for this analysis are also available at
http://www-plb.ucdavis.edu/labs/dehesh/.
Copyright © 2015 The Authors; exclusive licensee Bio-protocol LLC. 6
http://www.bio-protocol.org/e1519 Vol 5, Iss 13, Jul 05, 2015
Figure 3. Model data demonstrating two analysis methods. Shown are the same
set of four wounded Arabidopsis seedlings at selected time points up to 6 h. In method
(i), a grid of ROI (red circles) fits over each whole seedling. Luciferase activity is
quantified as a fraction of theoretical maximum (picture at timepoint 0 with contrast
enhanced). In method (ii), square ROI are placed on individual cotyledons, providing
greater precision.
2. Once putative chemical “hits” have been identified via first-round screening, they must
be confirmed in a second and possibly third round. Second round screening should
proceed similarly to first round, with the exception that we recommend at least
doubling or preferably tripling the number of wells devoted to each chemical, followed
by the more carefully defined quantification of response as described in step E1b.
Note: In the first round of screening, we identified approximately 15% of screened
chemicals as putatively affecting 4x RSRE: LUCIFERASE activity. Second round
screening confirmed ~10% of these putative chemicals. These numbers should be
expected to change depending on the output, sensitivity of reporter, and chemical
library selected.
3. Confirmed chemical hits may lead to multiple avenues of experimentation, including
concentration curves to determine active concentration, developmental time course of
chemical effect, analysis of selected chemicals similar in structure or known function,
and/or analysis of chemical effect on plant beyond screen output.
Notes
General screening notes
1. The screen output described here is luminescence from luciferase driven by a
minimal promoter containing four copies of the RSRE, but the screening technique
may be applied to any reporter system, or visible effects on Arabidopsis seedlings.
Simply substitute any pretreatment for luciferin application, necessary imaging
equipment for the CCD camera/ANDOR software, and appropriate image analyses. Copyright © 2015 The Authors; exclusive licensee Bio-protocol LLC. 7

http://www.bio-protocol.org/e1519 Vol 5, Iss 13, Jul 05, 2015 2. This screen is designed to observe the immediate effect of chemical treatment,
avoiding any secondary effects produced during prolonged exposure. However, if
desired, the chemical treatment could be added to molten or solid media before
placing seeds in the individual wells, or at any desired stage of Arabidopsis growth.
3. If adding chemicals early, as well as during pretreatment with luciferin, take care to
minimize contamination risks (i.e. use sterile water, keep containers closed as much
as possible and if necessary work within sterile laminar flow hood). Contamination
may affect the screening output, either directly or through effects on plant fitness.
Recipes
1. ¼ strength MS media
Dissolve 1.11 g MS salts in 1 L milli-Q pure H2O, and adjust pH to 5.7 with NaOH
Measure out 8 g phytoagar into bottle, and pour in pH-adjusted MS solution
Autoclave, liquid cycle, 30 min
Note: Although ¼ strength MS media was used here, ½ MS or other plant growth
media may work as well or better, and should be tested prior to screening.
2. 1 mM luciferin
Prepare 10x (31.824 mg/10 ml) or 100x (318.42 mg/10 ml) stock solution of potassium
luciferin in milli-Q H2O
Dilute down to 1 mM in sterile H2O, add Tween-20 to final concentration of 0.01%
Acknowledgements
This protocol is an expansion of that described in Bjornson et al. (2014). This work was
supported by National Institute of Health (R01GM107311), and National Science
Foundation (IOS-1036491and IOS-1352478), and Agricultural experimental station
(CA-D-PLB-3510-H) grants awarded to KD.
References
1. Benn, G., Wang, C. Q., Hicks, D. R., Stein, J., Guthrie, C. and Dehesh, K. (2014). A key
general stress response motif is regulated non-uniformly by CAMTA transcription
factors. Plant J 80(1): 82-92.
2. Bjornson, M., Benn, G., Song, X., Comai, L., Franz, A. K., Dandekar, A. M., Drakakaki,
G. and Dehesh, K. (2014). Distinct roles for mitogen-activated protein kinase signaling
and CALMODULIN-BINDING TRANSCRIPTIONAL ACTIVATOR3 in regulating the
peak time and amplitude of the plant general stress response. Plant Physiol 166(2):
988-996.
Copyright © 2015 The Authors; exclusive licensee Bio-protocol LLC. 8

http://www.bio-protocol.org/e1519 Vol 5, Iss 13, Jul 05, 2015 3. Drakakaki, G., Robert, S., Szatmari, A. M., Brown, M. Q., Nagawa, S., Van Damme, D.,
Leonard, M., Yang, Z., Girke, T., Schmid, S. L., Russinova, E., Friml, J., Raikhel, N. V.
and Hicks, G. R. (2011). Clusters of bioactive compounds target dynamic
endomembrane networks in vivo. Proc Natl Acad Sci U S A 108(43): 17850-17855.
4. Walley, J. W., Coughlan, S., Hudson, M. E., Covington, M. F., Kaspi, R., Banu, G.,
Harmer, S. L. and Dehesh, K. (2007). Mechanical stress induces biotic and abiotic
stress responses via a novel cis-element. PLoS Genet 3(10): 1800-1812.
Copyright © 2015 The Authors; exclusive licensee Bio-protocol LLC. 9


