

P a g e | 1
A Comparative Study of Mono-Crystalline and Poly-Crystalline Silicon Solar
Cells under Different Climatic Conditions of Bangladesh.
A Thesis submitted tothe
Department of Electrical & Electronic Engineering, BRAC University
In partial fulfillment of the requirements forthe
Bachelor of Science degree in Electrical and ElectronicEngineering
AFIFUZAMAN
MAHMUD HOSSAIN
RUBAYET REHAN
August2016

P a g e | 2
Declaration:
We hereby declare that this thesis titled “ Performance analysis of mono-crystallineand
polycrystalline silicon solar cells under different climatic conditions: A
comparativeanalysis” and the work presented in it and submitted to the Department of
Electrical andElectronicsEngineering of BRACUniversity is our own and has been
generated by us as the result ofour own original research. It was not submitted elsewhere
for the award of any other degreeor anyother publication.
Date:
Supervisor
Dr. Md.MosaddequrRahman
Afifuzaman(11221048)
Mahmud Hossain(11221022)
RubayetRehan(11221035)

P a g e | 3
ACKNOWLEDGEMENT
First of all, we want to thank Almighty God without whose consent we believe nothing in
this world is possible. We would like to thank our parents for their constant support for us.
We are extremely grateful to them for their overwhelming love and dedication for us. We
wish to make them happier in the coming years. We would like to thank to our advisor and
supervisorDr. Md. MosaddequrRahmanfor his guidance, supervision, constructive criticism
& valuable advice which helped us to do this thesis. We would like to thank our co-
supervisor MarziaAlam for her utmost support. I would also like to thank the faculty
members and staff of the department, not only for the abundance of academic knowledge
they shared, but also for making us a well-informed human being. Thanks to some of our
friends & classmates for helping us in many ways during the thesis work.
P a g e | 4
ABSTRACT
The objective of our thesis is to analyze the performance of two types of silicon solar panels-
mono-crystalline and polycrystalline under different climatic conditions of Bangladesh.
Temperature, wind speed, solar irradiation affects the performance of solar panel. In our
work different parameters of the solar cells such as open circuit voltage, short circuit current,
series resistance of a photovoltaic cell, maximum power output point, fill factor, maximum
working current, and maximum working voltage have been calculated under different
temperature and illumination conditions. Experiments have been conducted in both indoor
and outdoor. Series resistance was measured in dark condition. It showed an increase in
series resistance for both mono-crystalline and polycrystalline solar panel with the increment
of temperature. Current sensitivity of the panels was measured with the change of
temperature under same illumination condition. Energy was calculated utilizing the data
taken in the month of June-July. It was observed that polycrystalline panel has 4.3% energy
level more than the mono crystalline panel.

P a g e | 5
Table of contents
1.Introduction………………………………………………… 7
1.1 Background………………………………………………………………7 1.2 Motivation………………………………………….............……………8 1.3 Scope of work…………………………………………………………. 8 1.4 Thesis organization……………………………………………………..9
1.4.1 Basic theory of a solar cell……………………………….9 1.4.2 Experimental result and analysis………………………….9 1.4.3 Economic and Future …………………………………10 1.4.4 Conclusion………………………………………………..10
2 Basic theory of solar cell……………………………………11
2.1 Introduction…………………………………………………………………12 2.2 Basic operation of a solar cell ……………………………………………...12
2.3 P-n junction……………………..............13 2.4 Ideal Solar Cell……………………...…13 2.5 Structure and materials of solar cells………………………………………...14
2.6 Types of Solar Cells........................................................................................15 2.6.1 Mono-crystalline silicon solar cell………………………………..15
2.6.2 Poly-crystalline silicon solar cell………………………………….16
2.7 Ideality factor................................................................................................17
2.8 Declination angle calculation........................................................................17
2.9 Difference between mono-crystalline and poly-crystalline silicon solar cell...18
2.10 Electrical equivalent circuit...........................................................................19
2.11 I-V characteristics.......................................................................................20
2.12 Effect of temperature.....................................................................................22
2.12.1Effect of temperature on short circuit current..............................22
2.12.2 Effect of temperature on open circuit voltage.............................22
3. EXPERIMENTAL RESULT AND ANALYSIS...23
3.1 Introduction ………………………………………………......23 3.2 Indoor experiment.....................................................................23 3.3 Effect of illumination on solar panels...........................................24
3.3.1 I-v curve of monocrystalline solar panel at different light conditions..25 3.3.2 I-v curve of polycrystalline solar panel at different light conditions:......27
3.3.2.1.1 Effect of temperature on reverse saturation current (Io)……………..29 3.4 Effect of Temperature on solar panel …………………….....................................32
3.4.1 i-v curve of monocrystalline solar panel at different temperatures........32 3.4.2 I-v curve of polycrystalline solar panel at different temperatures......35
3.5 Sensitivity due to change in temperature...............................................................39 3.5.1 Monocrystalline sensitivity due to change in temperature....................39 3.5.2 Polycrystalline sensitivity due to change in temperature.........................40

P a g e | 6
3.6 Dark Condition.......................................................................................................41 3.6.1 Calculation of Series Resistance (Rs) for polycrystalline.......................42 3.6.2 Calculation of Series Resistance (Rs) for monocrystalline........................48 3.6.3 Analysis of series resistance (Rs) for monocrystalline and polycrystalline....54
3.7 Outdoor experiment..................................................................................................55 3.8 Energy Calculation……………………………………………………………………62 3.9 Comparison between polycrystalline and monocrystalline.........................................62
4. Economics And Future.....................................................................66 4.1 EconomicImportance..................................................................................................66
4.2 Future Works................................................................................................................67
5. Conclusion.................................................................................................68
6.References....................................................................................................69
7.Appendix......................................................................................................70

P a g e | 7
CHAPTER1
INTRODUCTION
1.1 Background:
Solar energy a gift from the nature provided by our very own Solar System’s sun which is
abundantly available and clean. For domestic and industrial applications the heat, light,
electricity etc., are provided by the solar technologies. With the concerned depletion of the
major conventional energy resources such as Coal, Petroleum and Natural gas, coupled with
the environmental degradation caused by the process of harnessing these energy sources, it
has become an important sector to invest in renewable energy resources that would power the
future sufficiently without polluting the environment through greenhouse gas emission. The
Sun’s energy potential is immense, but despite this endless solar energy resource, collecting it
is a challenge mainly due to the limited efficiency of the array cells. The best conversion
efficiency of most commercially available solar cells is in the range 10-20s%[1]. The recent
discovery and development in the technology of solar cells shows significant improvement
but the fact that the maximum solar cell efficiency still yet to meet expectations for which
more and more researches need to be carried out and some are still ongoingprojects are going
on for the improvement of efficiency of Solar energy.
Renewable Energy natural source of energy which keeps on replenished naturally in a
regular time cycle like hydro power, solar energy, wind energy, tidal energy, and biomass
fuels etc. At present the demand for energy is increasing day by day in Bangladesh due to
various reasons such as increasing population, the desire for improving the living standard
and general economic and industrial growth. The power generation system is principally
depended on imported petroleum oil and own natural gas. On the other hand, as the
information about the deposits of fossil fuels in Bangladesh, if they are consumed at the
present rate, the reversed natural gas and coal will deplete by the year 2020 to 2030 according
to BPDB.Sustainable social and economic development depends on ability of power
generation capacity of a country. There is no other way for accelerating development except
to increase the power generation by fuel diversification. Development of Renewable Energy
is one of the important strategies adopted as part of fuel and natural gas diversification.

P a g e | 8
Therefore, the renewable energy can contribute to the delivery of alternative energy to the
users which also comes as cheap as possible and probably the key issue for technological
inventions in solving energy problems in the rural areas.
Both indoor and outdoor experiments has been performed in a controlled environmental
factors for indoors and for outdoors most important factors was not possible to control during
day time with temperature and illumination, obtaining the relationship of the panel
parameters.
1.2 Motivation
Power crisis a major issue the world is trying to deal with. All the traditional power energy
sources like fossil fuel are becoming limited day by day and also expensive too. So, the
solution is alternative source of energy that is solar energy which is clean and emission free.
Solar energy is plentiful and has greatest availability compared to other energy sources.
Bangladesh is a developing country and for the growth and advancement energy and power is
essential. A poor country like Bangladesh the power or energy should be cost effective. Solar
is the solution of this not only that the rural and remote areas where there is still no electricity
solar can be the solar is blessings for then.Due to the geographical location of our country, we
get sun approximately 300 days a year. Compared to many other countries like many parts of
Russia, Canada, Sweden and Norway, we are in a much better location for proper utilizing
solar energy.
Considering economical, environmental and easier implementation, we were motivated to
working on it. We strongly believe that in the coming future, Bangladesh and other countries
will be benefited from the solar energy and other renewable sources of energy.
1.3 Scope of work
This thesis work represents the variation or relationship between parameters, that is Isc (short
circuit current), Voc (open circuit voltage),Rs(series resistance), and Pmax (maximum power
output) of the two types of solar cell, with temperature and illumination Multimeter has been
used to measure the temperature, Voltage and current of both the panels which was recorded
using video camera for all parameters at a time. RTC circuits keeps the track of the real time
P a g e | 9
and date of the measured data and relay is used for switching purpose, for taking data
between the two panels respectively within a given time interval. Analysis has been done by
MATLAB simulation after getting the curves obtained from the experimental data which
eventually help us to come up with conclusion after comprises.
1.4 Thesis organization:
This thesis is organized and arranged in such a way or order in, so that everyone can
understand it easily that is why the simplest explanations and experiments are described and
explained using short summary at start, and then eventually we move towards the important
factors that needs to be explained. Calculations from the environment or the factors or
parameters are well elaborated, before approaching towards modeling of the PV cell. Basic
properties and theories of the solar cell are described well enough, from there we come out
with the procedure of caring out the indoor analysis, and the experiments are explained step
by step along including diagrams. The content of the chapters in this paper are explained
below:
1.4.1 Basic theory of solar cell:
This chapter basically discuss about the structure, operation of a solar cell, including the
properties, characteristics and differences between mono-crystalline and poly-crystalline
silicon solar cells. The discussion is followed by the explanation of the existing simple
electrical model of a solar cell.
1.4.2 Experimental result and analysis.
The chapter starts with a brief introduction of the indoors and out door experiment and how
the system is used to examine several parameters of the solar panel. The block diagrams,
along with the circuit setup diagram, explain the experiments conducted. The results are
described by the graphs obtained from the MATLAB simulation of the experimental data.
This chapter basically gives the overview, how the various parameters (Isc, Voc, Pmax, and
Rs) behave when temperature changes, and we also calculated the value of the ideality factor
of the panel’s indoor and outdoor conditions. All these values played a vital role in our

P a g e | 10
analytical calculation of the energy extracted from the panels.
1.4.3 Economicand future
We have discussed about economical prospective and future work that can be done inlarger
scale using the data.
1.4.4 Conclusion:
The last chapter discuss about the efficient output from the solar cell that varies with season
according to the climatic condition of Dhaka city, and later gives an conclusion on the works
we have done up to date.

P a g e | 11
CHAPTER 2
Background and overview
2.1 Introduction
In 1839 Becquerel first discovered that sunlight could be converted directly into
electricity,when he observed the photo galvanic effect. But the first solar cell, was developed
by Chapin, Fuller and Pearson, revealed in 1954. It had an efficiency of 6% only. In 1956, the
invention of 10% efficient silicon solar cell was discovered. Only two years later, the first
solar cells wereused on the Vanguard I orbiting satellite. Since then, the use of solar
electricity (also known as photovoltaic) is going on increasing year by year and some have
been in continuousoutdoor operation on Earth or in space for over 30 years.
2.2 Solar cell
Figure-the crystalline silicon based solar cell
Solar cell like the crystalline silicon based solar cell shown in above is a solid state
semiconductor p-n junction device that converts sunlight into direct-current electricity
through the principle of photo-voltaic effect. The first conventional photovoltaic cells were
produced in the late 1950s, and were principally deployed to provide electrical power for
orbital satellites. During this initial deployment, excessive cost of manufacturing and poor

P a g e | 12
efficiency of solar modules were some of the major challenges that limit their
competitiveness as a major source for meeting the increasing energy demand that has
continued till now. However, recent improvements in design, manufacturing, performance,
reduced cost and quality of solar cells and modules have not only opened up the doors for
their deployments in applications like powering remote terrestrial applications, rural
electrification projects, battery charging for navigational aids, water pumping,
telecommunications equipment and critical military installations, but has also propelled solar
power system as a competitive means to meeting the ever increasing power need for the
world economy.
2.3 P-N Junction
Figure- PN junction
Solar cell is simply a PN junction device, like a diode that is forward biased with a photo-
voltage. Based on this simple definition, it’s necessary to review how the PN-junction of a
semiconductor diode functions. PN junction is formed when a P-type and an N-type
semiconductors are interfaced together. The PN-Junction is the region or a boundary that is
formed by doping or by epitaxial growth of a layer of crystal doped with one type of dopant
on top of a layer of crystal. A dopant is a material (Impurity) that is purposely introduced or
mixed into an extremely pure (Intrinsic or un-doped - Crystal Silicon for example)
semiconductor material for the purpose of changing or optimizing its electrical properties for
specific application. A dopant could be n-type or p-type material. Thus, a P-type Doping is
the introduction of impurity atoms with one less valence electron- (Like Boron) than silicon

P a g e | 13
(acceptor impurities), resulting in excess positive charge carriers (holes). Whereas, an N-type
doping is the introduction of impurity atoms with one more valence electron (like
Phosphorous) than silicon (donor impurities), resulting in excess negative charge carriers
(electrons).
2.4 Ideal Solar Cell
When a solar cell is illuminated by sun-lightphotons energy of the incident light is converted
to direct current electricity through the process of photovoltaic effect of the solar cell.
Incident light causes electron-hole pairs to be generated in the semiconductor and the
concentration of minor electrons increases (electrons in the p-type region and holes in the n-
type region) in the depletion region. This increase in the concentration of minority carriers
results in the flow of the minority carriers across the depletion region into the quasi-neutral
regions. These photo-generated carriers cause the flow of photo-generated current, I-photons.
When the junction is in the open-circuit condition, no net current can flow inside the p-n
junction, thus the current resulting from the flux of photo generated and thermally-generated
carriers is balanced by the opposite recombinationcurrent.
Figure- Solar cell is illuminated by sun-light

P a g e | 14
2.5 Material and structure of solar cell
Solar cells consist of a top and bottom metallic grid, which collect the diffused charger
carriers and collects the cell to the load. A thin layer of anti-reflective coating covers the top
side of the cell do decrease the reflection of light from the cell. To protect the cells from outer
environment a glass sheet is spread above it. A variety of materials and processes can
potentially satisfy the requirements for photovoltaic energy conversion, but in practice nearly
all photovoltaic energy conversion uses semiconductor materials in the form of a p-
n junction.[2]
Figure 4-Structure of Solar Cell[2]

P a g e | 15
2.6 Types of Solar Cells
Solar cells can be classified according to semiconductor materials of the cell, thecrystalline
structure of the material, and the number of junctions of the cell. There are anytypes of solar
cells according to the crystalline structure of the material but our analysis was with only two
types of solar cells. They are
1. Single-crystalline or mono crystalline cells.
2. Multi-crystalline or polycrystalline cells.
2.6.1 Mono-crystalline Solar cell
Fig Mono-crystalline cells
Mono-crystalline cells are the most important type, since they have the highest conversion
efficiency, and the base material, Mono-crystalline solar cells are made from so-called single
crystalline solar cells and easily recognizable from its color and its uniform look, is already
well known in the field of semiconductor production. To achieve its highest possible
performance and cost effective the four side of its cells are cut to make cylindrical. From
which cylindrical wafers can be obtained. The wafers produced in this way, then,
undergoesseveral production steps.
1. Grinding and cleaning
2. Doping
3. Metallization
4. Antireflection coating

P a g e | 16
2.6.2 Poly-crystalline CellsSolar cell
Poly-crystalline solar cells are also known as multi-crystalline solar cells. The manufacturing
process for mono-crystalline silicon is highly energy-intensive and also very expensive. Poly-
Si develops, when a silicon melt is cooled down slowly and controlled. Poly-crystalline
silicon are melted and poured into square mold, which is cooled and cut into perfectly square
wafers. The wafers are not uniform for that they also differ in color deep and light blue.
Figure-Poly-crystalline solar cells

P a g e | 17
2.7 Ideality factor
The ideality factor is a measure of how closely the panel follows the ideal diode equation.
The derivation of the simple diode equation uses certain assumption about the cell. In
practice, there are second order effects so that the diode does not follow the simple diode
equation and the ideality factor provides a way of describing them. In case of solar cells it
follow as it is. Using practical data’s we came up with lots of I-V characteristics curve which
follows the ideality factoring.
Equation for n,
;
2.8 Declination angle calculation
We need to consider thedeclination angle. It can be elaborate as the angle of deviation along
the sun directly above the equator, δ .When we take direction in account if angles towards
the north along the equator are considered to be positive and the south negative. At any given
time of the year, n, the declination can be found from
Since the sun is directly overhead on the first day of summer at solar noon on the Tropic of
Cancer. It can be describe in form of equation where Ø represents the latitude, or angular
distance from the equator. Another parameter is zenith angle which becomes zero when the
declination and the latitude are equal,this is only true at latitude during solar noon. This
equation is mainly used to locate the position of the sun. So by using this equation we find
the zenith angle.
P a g e | 18
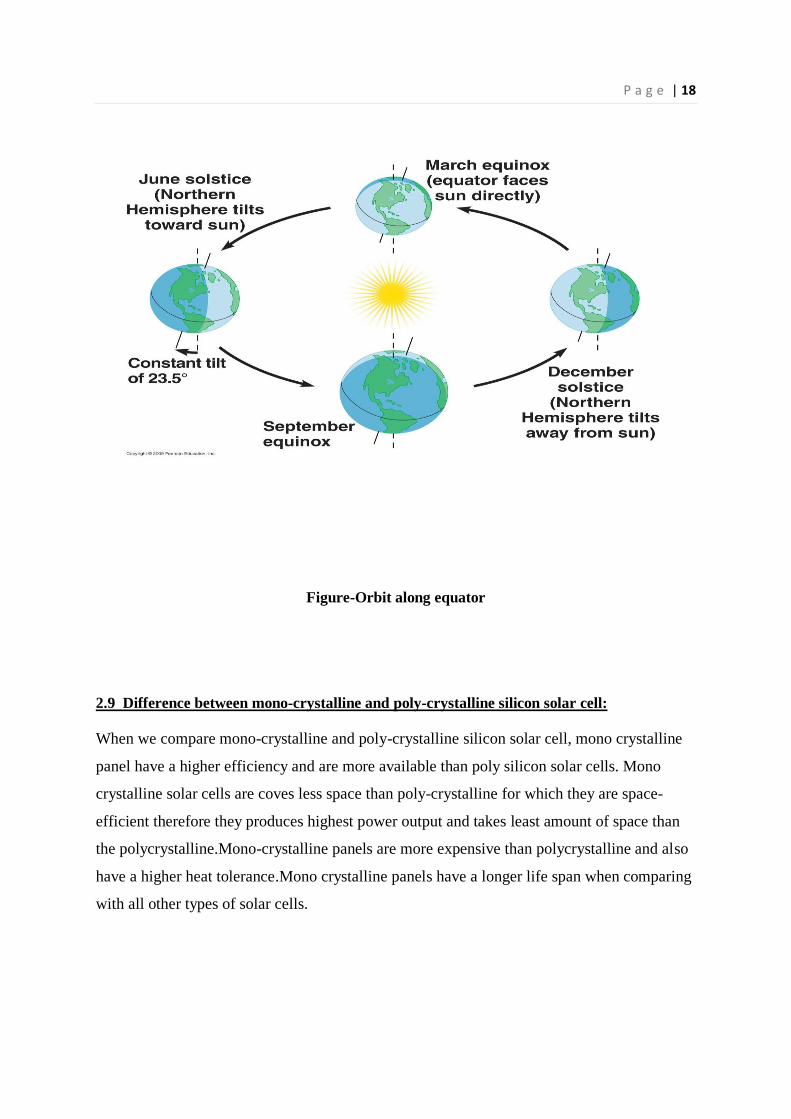
Figure-Orbit along equator
2.9 Difference between mono-crystalline and poly-crystalline silicon solar cell:
When we compare mono-crystalline and poly-crystalline silicon solar cell, mono crystalline
panel have a higher efficiency and are more available than poly silicon solar cells. Mono
crystalline solar cells are coves less space than poly-crystalline for which they are space-
efficient therefore they produces highest power output and takes least amount of space than
the polycrystalline.Mono-crystalline panels are more expensive than polycrystalline and also
have a higher heat tolerance.Mono crystalline panels have a longer life span when comparing
with all other types of solar cells.
P a g e | 19
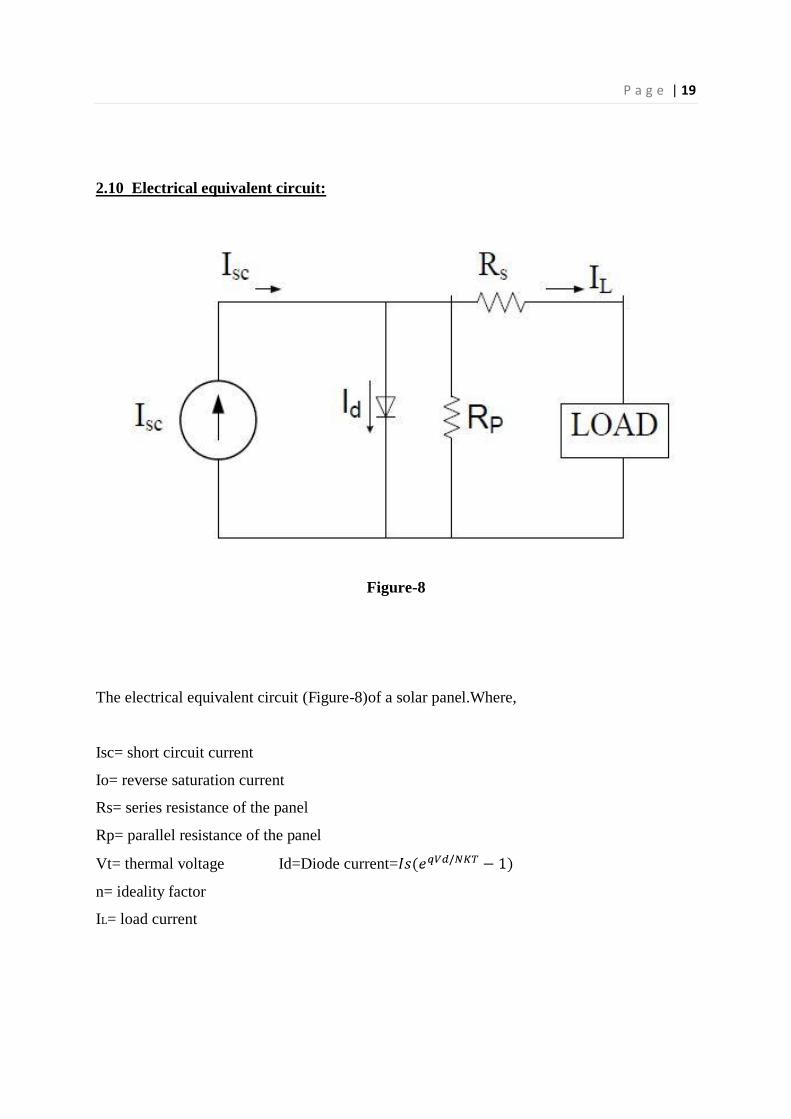
2.10 Electrical equivalent circuit:
Figure-8
The electrical equivalent circuit (Figure-8)of a solar panel.Where,
Isc= short circuit current
Io= reverse saturation current
Rs= series resistance of the panel
Rp= parallel resistance of the panel
Vt= thermal voltage Id=Diode current=
n= ideality factor
IL= load current

P a g e | 20
2.11 I-V Characteristics
Figure-9
Current–voltage (I–V) curves are obtained by exposing the cell to a constant level of light,
while maintaining a constant cell temperature, varying the resistance of the load, and
measuring the produced current. The I–V curve typically passes through two points:
• Short-circuit current (ISC): ISC is the current produced when the positive and negative
terminals of the cell are short-circuited, and the voltage between the terminals is zero, which
corresponds to zero load resistance.
• Open-circuit voltage (VOC): VOC is the voltage across the positive and negative terminals
under open-circuit conditions, when the current is zero, which corresponds to infinite load
resistance.
The cell may be operated over a wide range of voltages and currents. By varying the load
resistance from zero (a short circuit) to infinity (an open circuit), the MPP of the cell can be
determined. On the I–V curve, the maximum power point (Pm) occurs when the product of
current and voltage is maximum. No power is produced at the short-circuit current with no
voltage, or at the open-circuit voltage with no current. Therefore, MPP is somewhere between

P a g e | 21
these two points. Maximum power is generated at about the “knee” of the curve. This point
represents the maximum efficiency of the solar device in converting sunlight into electricity.
If the cell’s terminals are connected to a variable resistance R, the operating point is
determined by the intersection of the I–V characteristic of the solar cell and the load I–V
characteristic curves. For a resistive load, the load characteristic is a straight line with a slope
of I/V = 1/R. It should be pointed out that the power delivered to the load depends on the
resistance value of the load. However, if the load resistance is small, the cell operates in the
MNregion of the curve, where the cell behaves as a constant current source, almost equal to
the short-circuit current. On the other hand, if the load resistance is large, the cell operates on
the PS region of the curve, where the cell behaves more similar to a constant voltage source,
which is almost equal to the open-circuit voltage.

P a g e | 22
2.12 Effect of temperature:
2.12.1Effect of temperature on short circuit current (Isc):
While caring out our experiment in indoor condition we observed certain changes on short
circuit current (Isc) due to the effect of temperature. The relationship that we obtained from
the experiment in indoor condition for mono-crystalline silicon solar panel is Isc=
0.0011*T+0.084 therefore the temperature coefficient is 0.0011A/K.
correspondinglypolycrystalline it is Isc=0.00096*T+0.12 so the temperature coefficient for
polycrystalline silicon solar cell is 0.00096A/K.
2.12.2 Effect of temperature on the open circuit voltage (VOC)
The open circuit voltage decreases with temperature and which has been justified that
Voc= - 0.0018*T + 1.1 for one cell of mono-crystalline solar cell and Voc= - 0.0017*T+0.12
for one cell of poly crystalline-silicon solar cell. It had been justified while caring out indoor
experiment but theoretically we have seen that that the Voc it is different for both mono-
crystalline silicon solar and poly-crystalline that 2mV/ºC for both of them but our indoor
analysis came out with different values that the temperature coefficient is 1.8mV/ºC for mono
crystalline and 1.7mV/ºC poly-crystalline.

P a g e | 23
CHAPTER 3
EXPERIMENTAL RESULT AND ANALYSIS
3.1 Introduction
Our objective is to analyze the characteristics of silicon solar cells under different conditions.
The output voltage and current of a solar cell is affected by many factors. To understand the
change of output current and voltage of a silicon solar module we first conducted indoor
experiments. Our initial aim was to understand how the current and voltage change with the
change of load, for which we studied the i-v curve of a solar panel. Under direct sunlight in
outdoor environment there are many parameters due to which the results of experiments
change. So to avoid that we started with indoor experiment where we can observe the
behavior of a solar panel in a controlled environment and adjust both the temperature and the
illumination of light according to our needs. For our thesis we considered two different types
of solar panels. Polycrystalline and monocrystalline. There are different parameters to judge
the performance of a solar panel. Such parameters are open circuit voltage-Voc, short circuit
current-Isc, series resistance of a photovoltaic cell-Rs, maximum power output point- Pmax.
The temperature coefficients of these parameters are very essential to know the behavior of
the panel, then we can figure it out how it is changing with temperature, and affecting on the
output power of the panel, and how much of energy these can provide.
3.2 Indoor experiments
By using a box designed to simulate sun we experimented with both monocrystalline and
polycrystalline panels. To find the voltage and current reading we used a variable load. By
changing the load from maximum to zero we achieved the desired values of current and
voltage. At first we kept the temperature fixed and for a fixed temperature measured the
changing current and voltage by varying the load.

P a g e | 24
Figure- Circuit diagram of the experimental setup
We used different numbers of bulbs to simulate sunlight at different time points of the day.
To emulate the radiation at midday when illumination is at the highest we used light from ten
100watt bulbs. We decreased the number of bulbs gradually to get multiple readings under
different illumination conditions. Then we conducted the same routine for different
temperature each time keeping the temperature constant.
Figure- Block diagram of the circuit used for indoor experiment.

P a g e | 25
The result of this experiments was corresponding voltage and current readings for load
change. By plotting this values we got the i-v characteristics curve for both mono and
polycrystalline solar panel. The curves obtained through this experiment are given in the
upcoming pages. Here we kept the temperature constant and varied the illumination by
conducting the experiment under 2lights, 4lights, 6lights, 8lights, 10lights.
3.3 Effect of illumination on solar panels
The intensity of Illumination greatly affects the output of solar panel. It is perhaps the most
significant parameter for power generation of a solar module. To understand the effect of
illumination we need to observe the change in voltage and current due to change in
illumination at a fixed temperature.
3.3.1 I-v curve of monocrystalline solar panel at different light conditions
Figure- curve of monocrystalline at 45°C in different light conditions.

P a g e | 26
Figure- curve of monocrystalline at 40°C in different light conditions.
Figure- curve of monocrystalline at 35°C in different light conditions.
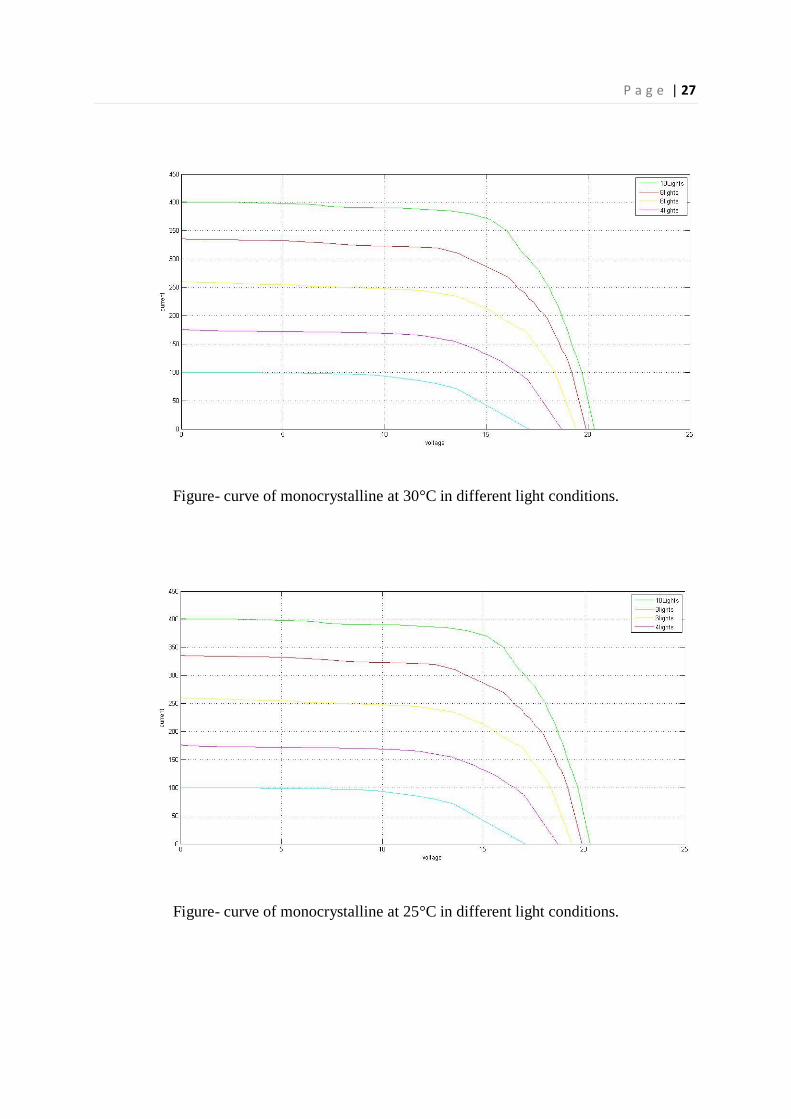
P a g e | 27
Figure- curve of monocrystalline at 30°C in different light conditions.
Figure- curve of monocrystalline at 25°C in different light conditions.

P a g e | 28
From the curves above we can clearly see that the change in illumination has a great change
in the i-v curve. The slope for high intensity of illumination is greater which means that the
rate of current dropping with changing load is greater at the maximum power point. As the
illumination decrease the rate of drop in current with increasing load decrease.
A significant point of this experiment was to observe the change in maximum voltage and
current due to change of illumination. From the data we generated we can clearly observe that
the effect of illumination is greater on current output of the solar panel then on the voltage
that is generated. On the other hand the voltage change is quite settle with the change of
illumination.
3.3.2 I-v curve of polycrystalline solar panel at different light conditions:
Figure i-v curve for polycrystalline at 45°C in different light condition
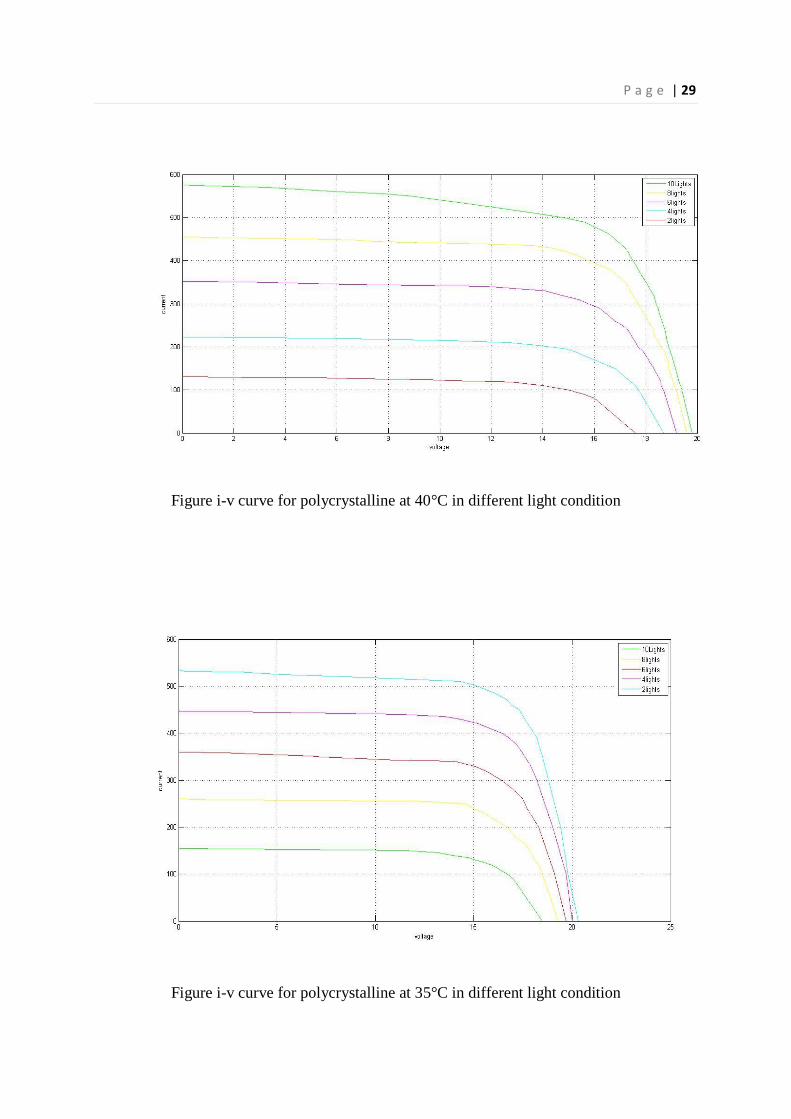
P a g e | 29
Figure i-v curve for polycrystalline at 40°C in different light condition
Figure i-v curve for polycrystalline at 35°C in different light condition

P a g e | 30
Figure i-v curve for polycrystalline at 30°C in different light condition
Figure i-v curve for polycrystalline at 25°C in different light condition

P a g e | 31
For polycrystalline we can observe the same kind of behavior. Current drop after maximum
power point is greater at high illumination condition then in low light environments.
Also the change of current in polycrystalline is greater for change in illumination than
voltage. Voltage has little change for the change of illumination. But the rise of current is
much more for a fixed temperature.

P a g e | 32
3.4Effect of Temperature on solar panel:
With the change of temperature the output current and voltage changes due to the
characteristics of the solar panel. The panel has silicon diode cells that are connected
with metal conductors. As a result the panel displays some unique characteristics. To
observe the change of Voc, Isc, and series resistance we need to conduct an
experiment where we can achieve the i-v carves at different temperatures in a fixed
illumination. To achieve that we again used the sun simulator. Data from the
experiments are plotted to analyze the results.
3.4.1 I-v curve of monocrystalline solar panel at different temperatures:
Figure i-v curve for monocrystalline under two filament bulbs

P a g e | 33
Figure i-v curve for monocrystalline under four filament bulbs
Figure i-v curve for monocrystalline under six filament bulbs

P a g e | 34
Figure i-v curve for monocrystalline under eight filament bulbs
Figure i-v curve for monocrystalline under ten filament bulbs

P a g e | 35
From the plots above we can observe that under fixed amount of illumination, as the
temperature of the panel is increased the open circuit voltage of the panel decreased and the
short circuit current increases. This is because like all other semiconductor devices, silicon
solar cells are sensitive to temperature. Increases in temperature reduce the band gap of a
semiconductor, thereby affecting most of the semiconductor material parameters. The
decrease in the band gap of a semiconductor with increasing temperature can be viewed as
increasing the energy of the electrons in the material. Lower energy is therefore needed to
break the bond. In the bond model of a semiconductor band gap, reduction in the bond energy
also reduces the band gap. Therefore increasing the temperature reduces the band gap. In a
solar cell, the parameter most affected by an increase in temperature is the open-circuit
voltage. The impact of increasing temperature clearly evident in the resulting curves of our
experiments. The open-circuit voltage decreases with temperature because of the temperature
dependence of Io.
3.4.2 I-v curve of polycrystalline solar panel at different temperatures:
Figure i-v curve for monocrystalline under tow filament bulbs

P a g e | 36
Figure i-v curve for monocrystalline under four filament bulbs
Figure i-v curve for monocrystalline under six filament bulbs

P a g e | 37
Figure i-v curve for monocrystalline under eight filament bulbs
Figure i-v curve for monocrystalline under ten filament bulbs

P a g e | 38
As we explained for monocrystalline, the same behavior is observed from polycrystalline at
different temperatures. The open circuit voltage decreases due to increase in temperature and
the short circuit current increases for the same reasons. But at low level of illumination the
behavior is less evident for both polycrystalline and monocrystalline.
P a g e | 39
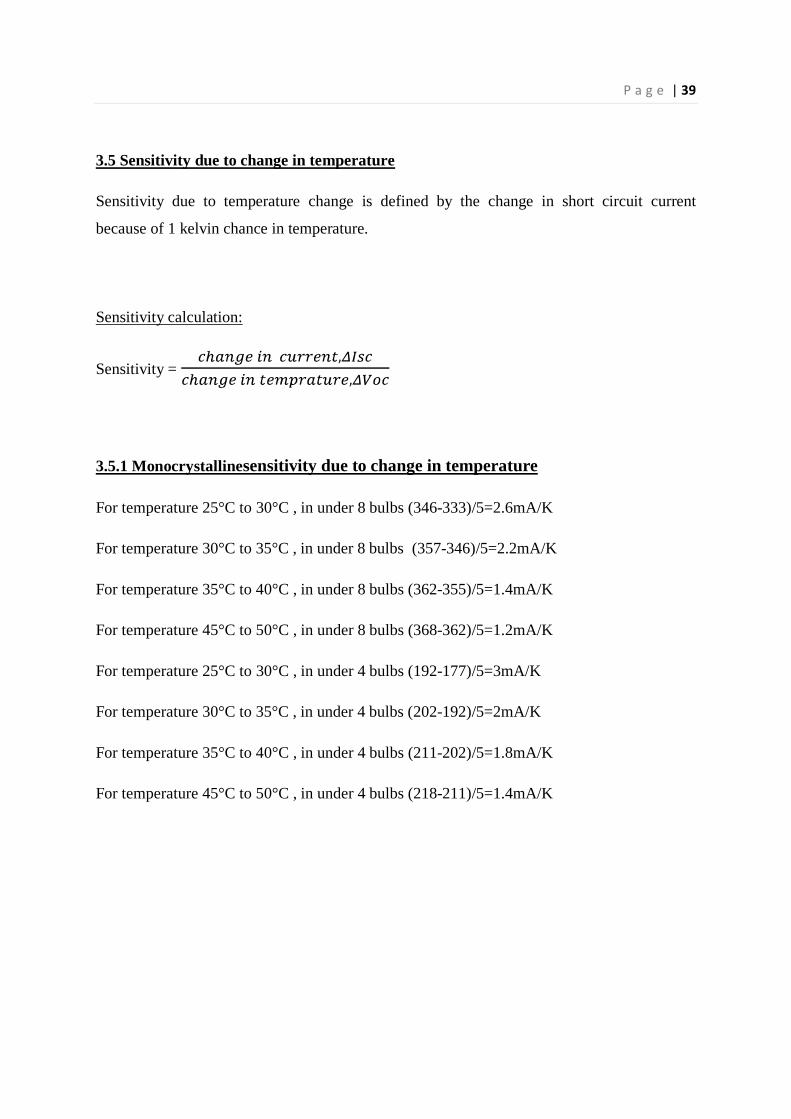
3.5 Sensitivity due to change in temperature
Sensitivity due to temperature change is defined by the change in short circuit current
because of 1 kelvin chance in temperature.
Sensitivity calculation:
Sensitivity =
3.5.1 Monocrystallinesensitivity due to change in temperature
For temperature 25°C to 30°C , in under 8 bulbs (346-333)/5=2.6mA/K
For temperature 30°C to 35°C , in under 8 bulbs (357-346)/5=2.2mA/K
For temperature 35°C to 40°C , in under 8 bulbs (362-355)/5=1.4mA/K
For temperature 45°C to 50°C , in under 8 bulbs (368-362)/5=1.2mA/K
For temperature 25°C to 30°C , in under 4 bulbs (192-177)/5=3mA/K
For temperature 30°C to 35°C , in under 4 bulbs (202-192)/5=2mA/K
For temperature 35°C to 40°C , in under 4 bulbs (211-202)/5=1.8mA/K
For temperature 45°C to 50°C , in under 4 bulbs (218-211)/5=1.4mA/K

P a g e | 40
3.5.2 Polycrystallinesensitivity due to change in temperature
For temperature 25°C to 30°C , in under 8 bulbs (437-422)/5=3mA/K
For temperature 30°C to 35°C , in under 8 bulbs (450-437)/5=2.6mA/K
For temperature 40°C to 45°C , in under 8 bulbs (455-450)/5=1mA/K
For temperature 45°C to 50°C , in under 8 bulbs (458-455)/5=0.6mA/K
For temperature 25°C to 30°C , in under 4 bulbs (224-192)/5=6.4mA/K
For temperature 35°C to 40°C , in under 4 bulbs (262-240)/5=4.4mA/K
For temperature 40°C to 45°C , in under 4 bulbs (280-262)/5=3.6mA/K
For temperature 45°C to 50°C , in under 4 bulbs (292-280)/5=2.4mA/K
From the above calculations we can conclude that the sensitivity of the solar panel changes
with temperature. At higher temperature the sensitivity gradually decreases. SO at a very high
temperature the solar module will be less sensitive to farther change in temperature.
Also at high illumination the sensitivity for both polycrystalline and monocrystalline is less
than sensitivity at low level of illumination. SO we can say that if illumination increases the
sensitivity decreases. And at higher temperature the sensitivity is less than at low
temperature.

P a g e | 41
3.6 Dark Condition
The experiment in dark condition was done in lab environment. We used the sun simulator
as a closed box to create the dark conditions required to conduct the experiment. Our
objective with this experiment was to find out the reverse current. To find the reverse current
a voltage had to be passed through the solar panel. We used a DC source to generate this
voltage. Using the DC generator we varied the voltage through the panel and measured the
current passing. This current is the reverse current flowing thronging the panel due to voltage
difference provided externally. Our aim was to calculate the series resistance of the panel and
also observe the effect of temperature on the series resistance (Rs).
Circuit for dark condition experiment.

P a g e | 42
3.6.1 Calculation of Series Resistance (Rs) for polycrystalline
Using the plot generated by the
Figure: Series resistance measuring curve at 25°C
For 25 degree Celsius, Series resistance (Rs)= Ω
P a g e | 43
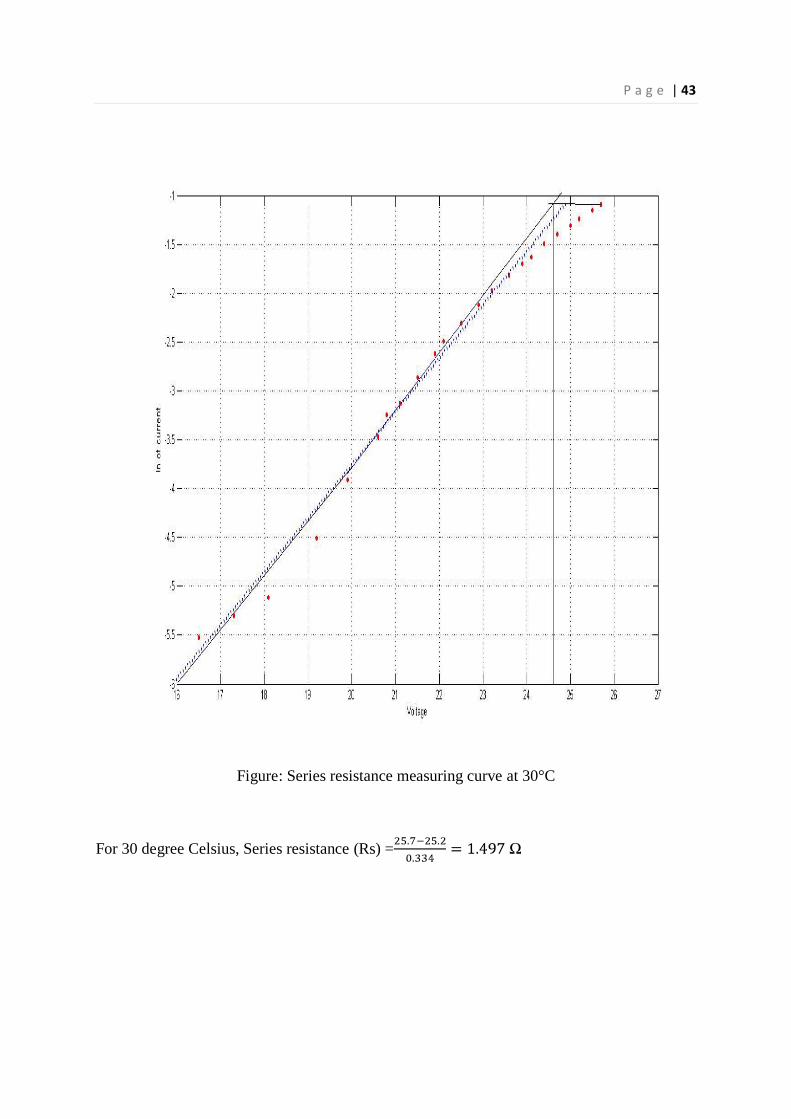
Figure: Series resistance measuring curve at 30°C
For 30 degree Celsius, Series resistance (Rs) = Ω

P a g e | 44
Figure: Series resistance measuring curve at 35°C
For 35 degree Celsius, Series resistance (Rs) = Ω
P a g e | 45
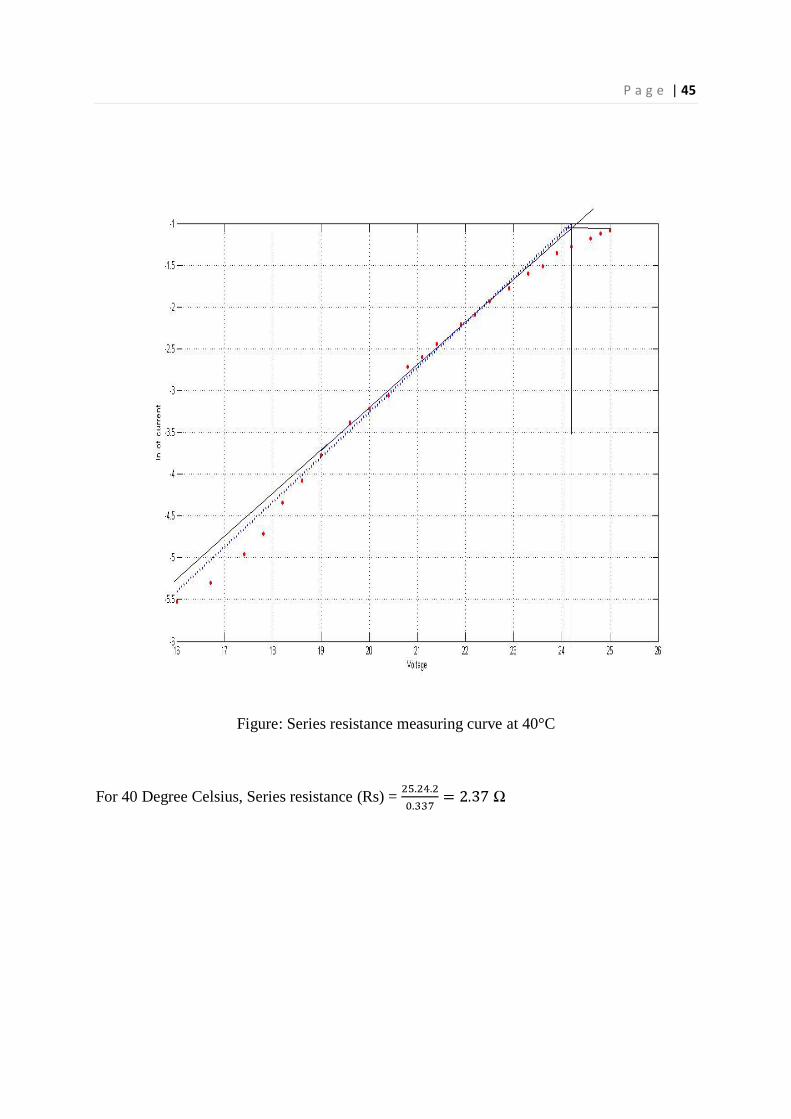
Figure: Series resistance measuring curve at 40°C
For 40 Degree Celsius, Series resistance (Rs) = Ω
P a g e | 46
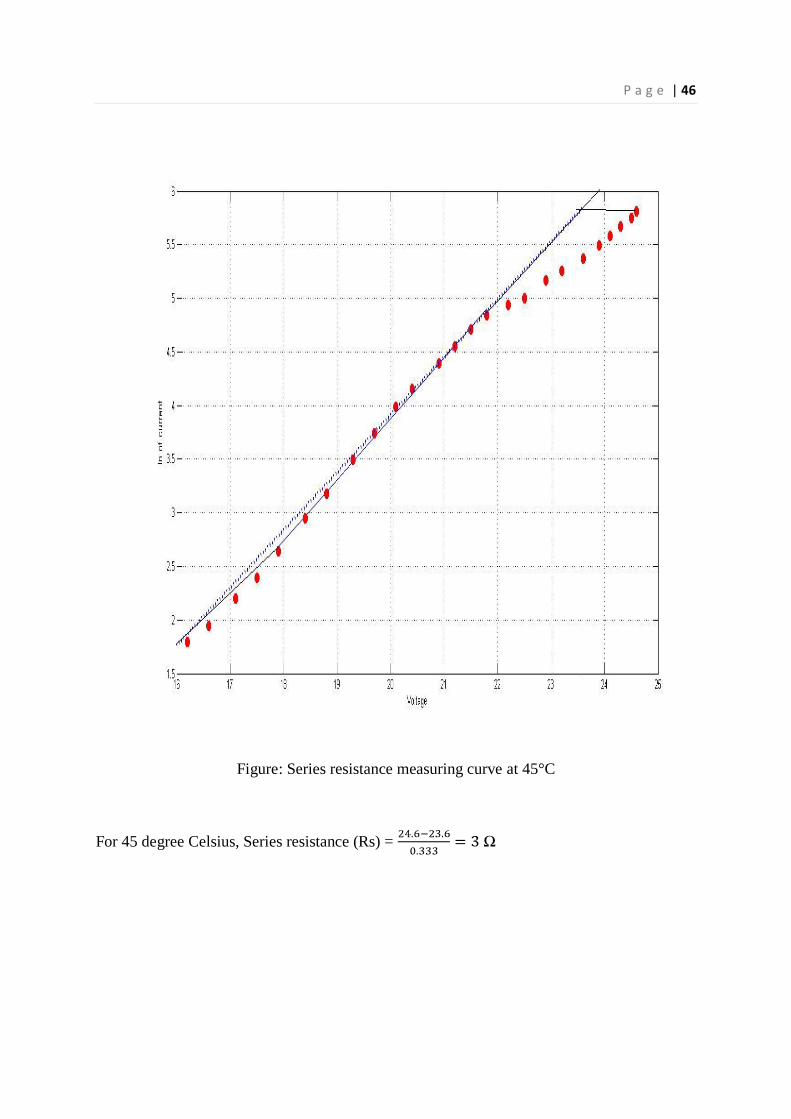
Figure: Series resistance measuring curve at 45°C
For 45 degree Celsius, Series resistance (Rs) = Ω

P a g e | 47
Figure: Series resistance measuring curve at 50°C
For 50 Degree Celsius, Series resistance (Rs) =

P a g e | 48
3.6.2 Calculation of Series Resistance (Rs) for monocrystalline
Figure: Series resistance measuring curve at 25°C
For 25 Degree Celsius, Series Resistance (Rs) =

P a g e | 49
Figure: Series resistance measuring curve at 30°C
For 30 Degree Celsius, Series resistance (Rs) =

P a g e | 50
Figure: Series resistance measuring curve at 35°C
For 35 Degree Celsius, Series resistance (Rs) =
P a g e | 51
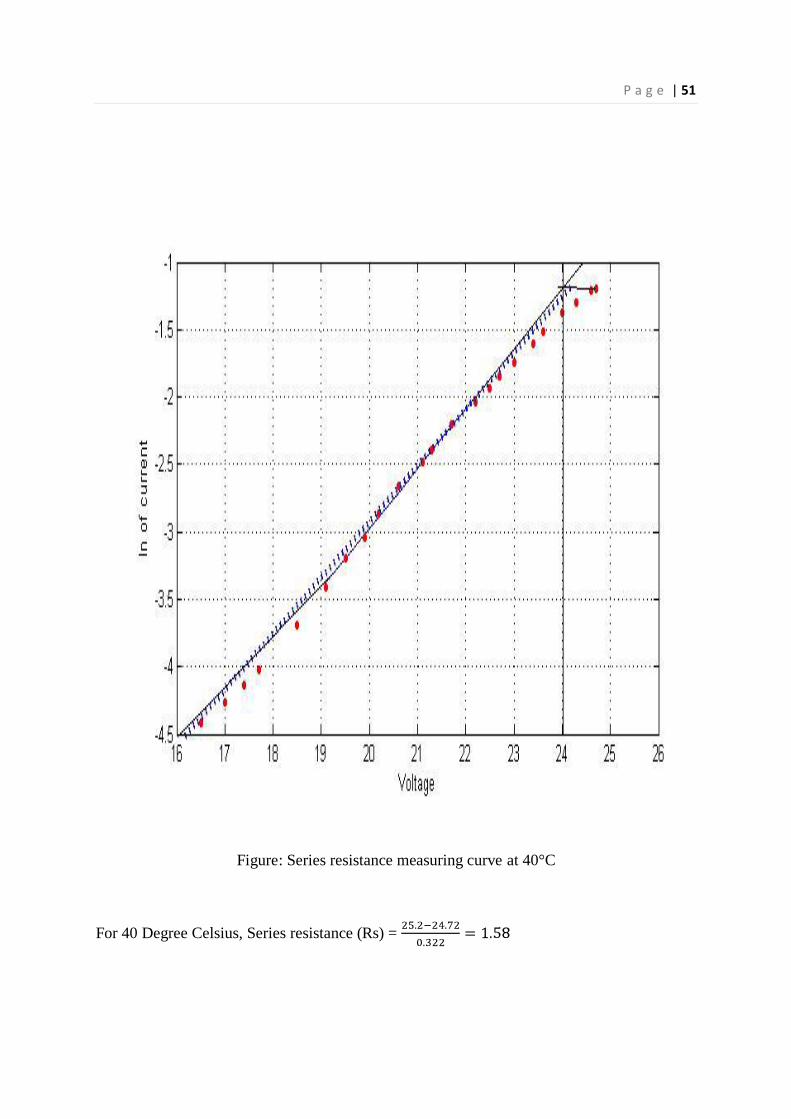
Figure: Series resistance measuring curve at 40°C
For 40 Degree Celsius, Series resistance (Rs) =

P a g e | 52
Figure: Series resistance measuring curve at 45°C
For 45 Degree Celsius, Series resistance (Rs) =
P a g e | 53
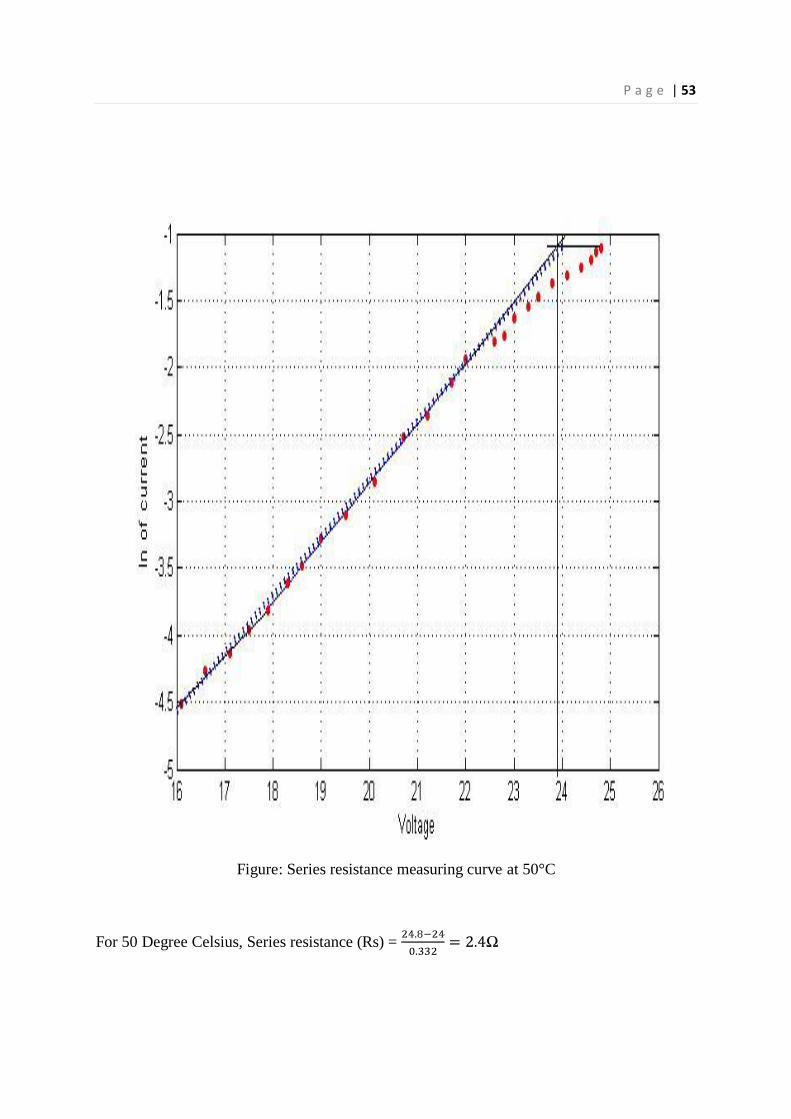
Figure: Series resistance measuring curve at 50°C
For 50 Degree Celsius, Series resistance (Rs) = Ω

P a g e | 54
3.6.3 Analysis of series resistance (Rs) for monocrystalline and polycrystalline
Series resistance for monocrystalline at different temperatures:
Series resistance for polycrystalline at different temperatures:
Materials that are classed as conductors such as metal tend to increase their resistance with an
increase in temperature. However insulators are liable to decrease their resistance with an
increase in temperature. In terms of silicon the convention is that the resistance decrease with
the increase of temperature. But as the temperature is increased the resistance of the solar
panel is increasing as we can observe from the calculation showed above. This characteristics
is due to the metallic connection of cells. As the temperature is increased the series resistance
( Rs) increases as the resistance in the metal connectors increases. This is the reason behind
the decrease in power output in high temperature.
Fill factor: fill factor is an important parameter in determining the quality of a solar panel. It
is the ratio of maximum power and the theoretical power. The equation for fill factor is,
FF= .
Fill factor for monocrystalline in indoor=0.825
Fill factor for polycrystalline in indoor=0.834.
T 25 30 35 40 45 50
Rs 0.99Ω 1.32Ω 1.55Ω 1.58Ω 1.65Ω 2.4Ω
T 25 30 35 40 45 50
Rs 1.467Ω 1.497Ω 1.796Ω 2.37Ω 3Ω 3.3Ω

P a g e | 55
Fill factor for monocrystalline in outdoor=0.846
Fill factor for polycrystalline in outdoor=0.808
3.7Outdoor experiments:
For our outdoor experiments we used the same solar panels that we used for our indoor
experiments. We collected data throughout the day at 30 minutes intervals. We measured the
surface temperature of the panels with all our readings. By varying load from 250Ω load to
0Ω we took the reading of the current and voltage along with the open circuit voltage and
short circuit current values. By plotting this values in MATLAB we got i-v characteristics
curves in practical situations.
i-v characteristics carves for monocrystalline on various days:
Figure: i-v curve of monocrystalline on 2nd
June

P a g e | 56
Figure: i-v curve of monocrystalline on 4thJune
Figure: i-v curve of monocrystalline on 8thJune
P a g e | 57
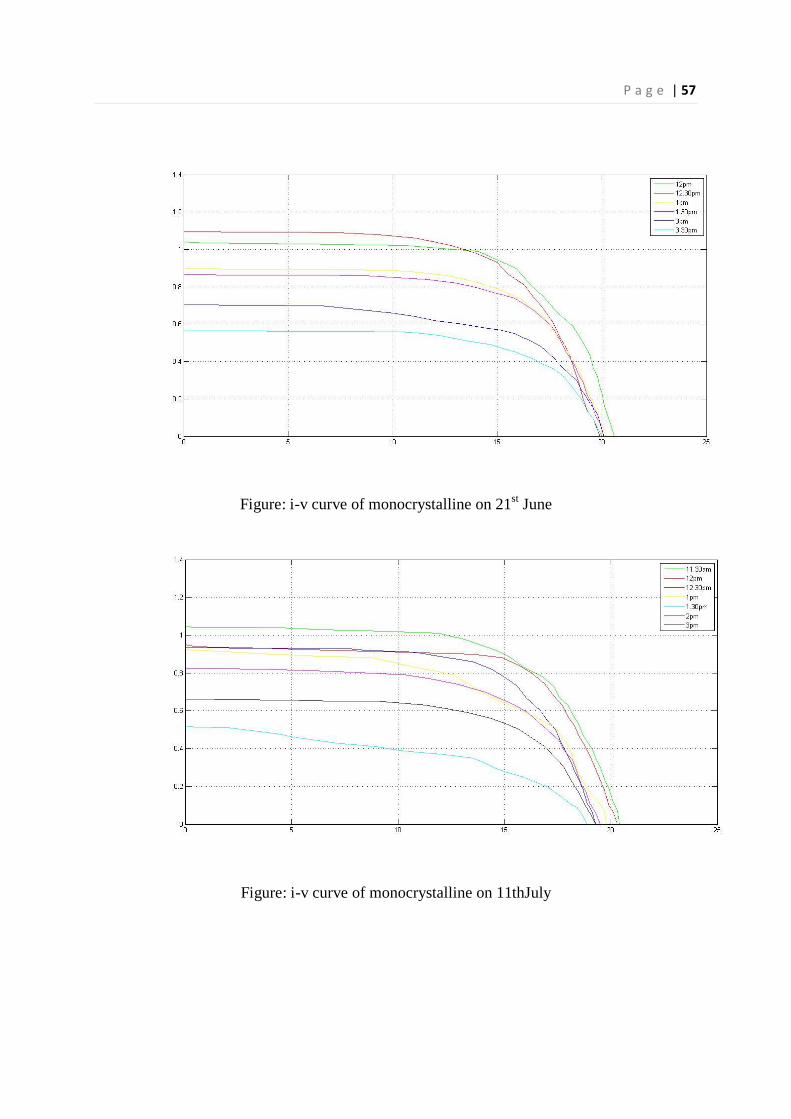
Figure: i-v curve of monocrystalline on 21st June
Figure: i-v curve of monocrystalline on 11thJuly

P a g e | 58
Figure: i-v curve of monocrystalline on 17th July
i-v characteristics carves for polycrystalline on various days:
Figure: i-v characteristics carves for polycrystalline on 2nd
June

P a g e | 59
Figure: i-v characteristics carves for polycrystalline on 4nd
June
Figure: i-v characteristics carves for polycrystalline on 8thJune
P a g e | 60
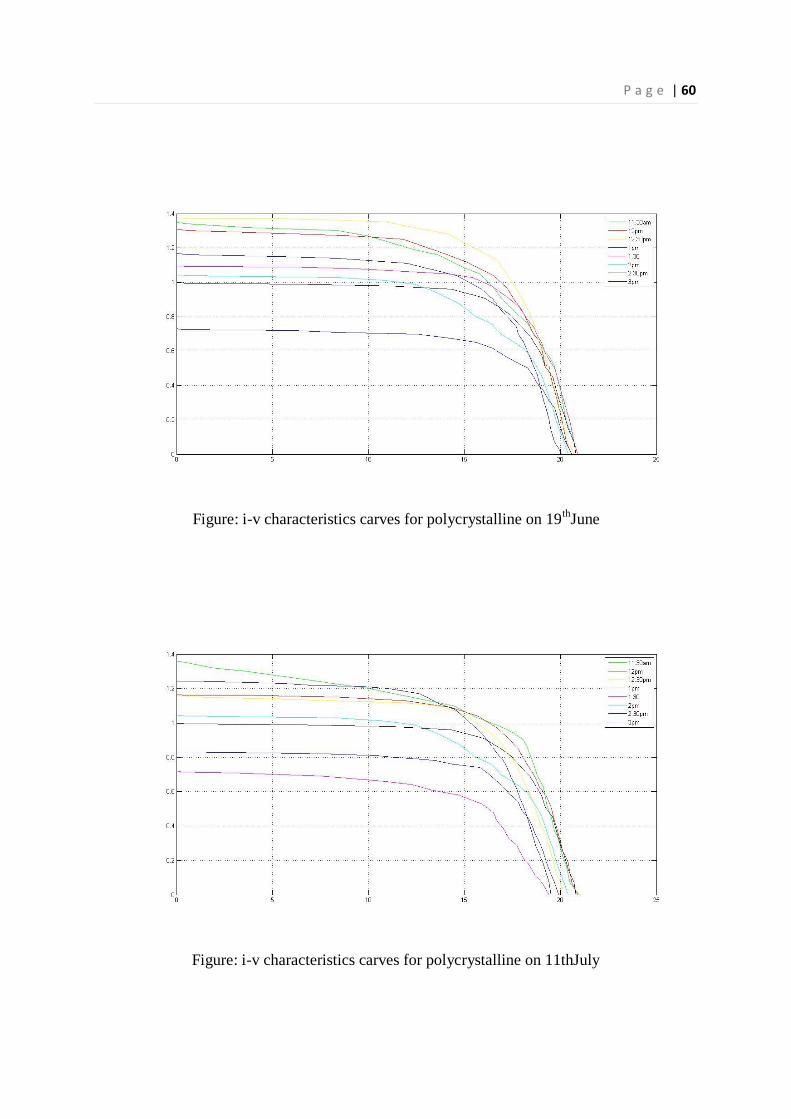
Figure: i-v characteristics carves for polycrystalline on 19th
June
Figure: i-v characteristics carves for polycrystalline on 11thJuly

P a g e | 61
Figure: i-v characteristic curves for polycrystalline on 17th
July.
In terms of outdoor experiments it is difficult to get data at a constant time interval due to the
interference of clouds. Sunlight passing through clouds don’t have the proper intensity of
illumination to provide a strong current and voltage reading.
3.8Energy Calculation:
For calculating energy, the maximum power for every time interval was summed up and the
result was multiplied with the constant time interval. In our experiment, the time interval was
30 minutes.
The equation for calculating energy= (Pmax1+Pmax2+……..+Pmaxn)∆t
In 8th
June for monocrystalline the energy= (11.79+11.7+11.4+11.28+6.82+6.66)*0.5
=30 watt hour
In 8th
June for monocrystalline the energy= (14.7+11.46+14.70+14.79+10.032+10.43)*0.5
=39 watt hour
P a g e | 62
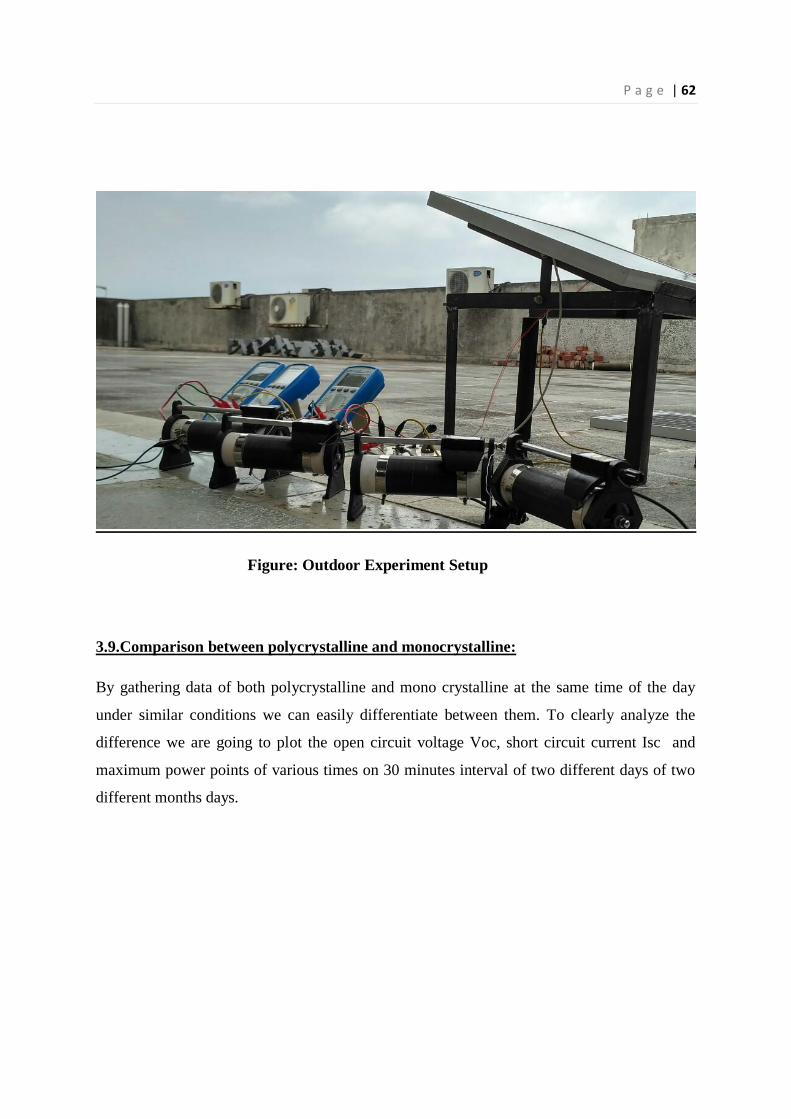
Figure: Outdoor Experiment Setup
3.9.Comparison between polycrystalline and monocrystalline:
By gathering data of both polycrystalline and mono crystalline at the same time of the day
under similar conditions we can easily differentiate between them. To clearly analyze the
difference we are going to plot the open circuit voltage Voc, short circuit current Isc and
maximum power points of various times on 30 minutes interval of two different days of two
different months days.

P a g e | 63
Time against open circuit voltage:
Figure: time against Voc for 19th
June
Figure: time against Voc for 11th
July

P a g e | 64
Time against short circuit current:
Figure: time against Isc for19th
June
Figure: Time against Isc for 11th
July
P a g e | 65
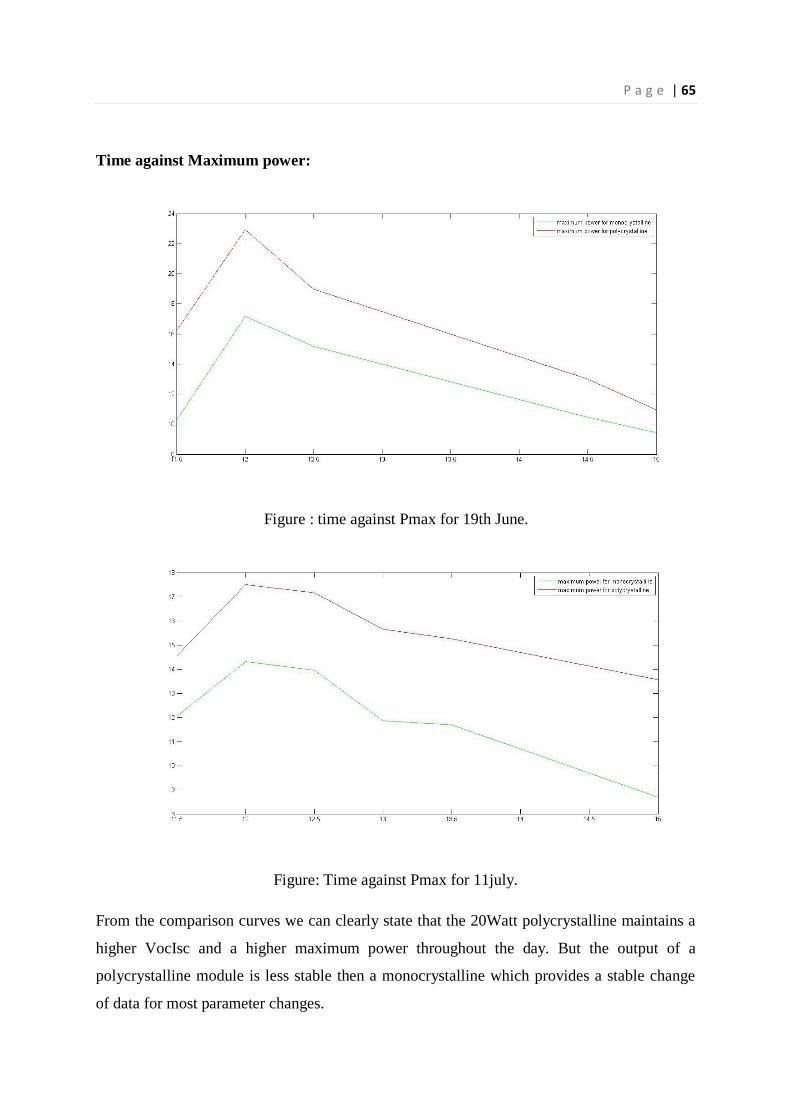
Time against Maximum power:
Figure : time against Pmax for 19th June.
Figure: Time against Pmax for 11july.
From the comparison curves we can clearly state that the 20Watt polycrystalline maintains a
higher VocIsc and a higher maximum power throughout the day. But the output of a
polycrystalline module is less stable then a monocrystalline which provides a stable change
of data for most parameter changes.

P a g e | 66
CHAPTER 4
Economics and Future
4.1 Economic Importance
Bangladesh is a developing country of the third world. However the development of our
country is slower than expectation. The main reason behind this phenomenon is the growth of
population. With the increase of population the demand for every element is increasing.
Specialists in various fields are working on technologies through which they can meet the
demands. The same goes for electricity. The demand for electricity is increasing day by day.
In order to meet that, the grids are not sufficient. Energies from other fields are required to
fulfill their needs. Solar energy can serve this purpose greatly. As it is a huge source and the
energy is never ending, people can use the energy. Solar cells convert the sunlight to
electrical energy and supply to various devices. However due to comparatively low efficiency
people do not prefer solar cells for their regular use. If we think of the cost of solar panels,
then we can say that they are comparatively more efficient in the long run. Because solar
panels have warranty over 20 years and they cost only once which is a little high. On the
other hand bills are paid every month for AC electricity. The bill is not fixed in every month.
The amount varies according to the use. If we accumulate the bills of 20 years of a specific
institution, we can see that solar panels are much cheaper than AC electricity. They last long
and serve constantly in every purpose. Though the efficiency is slightly on the lower side, the
cost can match up with that problem saving a lot of money which can be used in other fields
to develop the overall condition of the country. Also in rural areas there are a lot of load
shedding for which people have to suffer but still they have to pay bills for electricity. If they
use solar panels, they will get constant supply of electricity and will not have to worry about
load shedding.

P a g e | 67
4.2 Future works
Currently, Bangladesh is going through a major electricity crisis. Government is taking
various projects on implementing solar panels to provide a secondary method to provide
electricity. But for the time being, all the projects are collecting solar energy and storing them
to a DC battery instead of using the energy to support a locality through grid. In many
developed countries, solar arrays are connected to grids and from there; the energy is
distributed to the neighborhood. This technology is yet to come to our country.
These results can provide a further analysis for how to deal with the parameters in order to
implement in the projects in larger scale. With the consideration of cost and sustainability,
solar energy has a very huge role to play in this field.

P a g e | 68
CHAPTER 5
Conclusion
We have presented detailed solar photovoltaic power system data’s starting withthe solar cell
device physics and its principle of operation, to solar cell efficiency. The experiments that we
carried out to calculate the parameters affecting the solar cells, after finding the parameters
theoretically we see that that there are other factor affecting as well. The energy calculations
for indoor is quite relevant but for outdoor it is little bit higher than the theoretical value
which is due to errors due to external factors other than temperature and illumination. we
have selected this project to know about solar power generation systems, the working
principles of power generation and inversion, how each and every equipment works and
wehave done that with success but with some environmental errors which cannot be altered
humanly. The primary goal of thesis isachieved. But we have faced some problems too. Some
of the goals we had targeted are notachieved.
One of the factors that affect most while caring out outdoor experiment is shading. Ideally
solar panels should be located such that there will never be shadows on them because a
shadow on even a small part of the panel can have a surprisingly large effect on the output.
The cells within a panel are normally all wired in series and the shaded cells affect the current
flow of the whole panel. But there can be situations where it cannot be avoided, and thus the
effects of partial shading should be considered while caring out experiments.

P a g e | 69
CHAPTER 6
REFERENCES
1. Green, Martin A. Solar Cells; Operating Principles, Technology, and System
Applications, Prentice-Hall Inc, 1982 pp xii and pp 62-184
2. Roger A. Messenger and Jerry Ventre, “The Sun”, Photovoltaic Systems Engineering,
second edition, CRC Press , Boca Raton, Florida, 2003, pp.21-30
3. Energy Harvesting: Solar, Wind, and Ocean Energy Conversion Systems
AlirezaKhaligh, Omer C. Onar
4. IMPROVING THE EFFICIENCY OF SOLAR POTOVOLTAIC POWER SYSTEM
Henry A. Aribisala, 2013
5. An analytical method to extract the physical parameters of solar cell
H.Saleem, IEEE electron deivce letters (volume 30, issue 4), March 2009.
6. Solar Electricity Handbook-2014 Edition: a simple Practical Guide to Solar Energy,
MichealBoxwell.
7. Solar Electricity Basics, Dan Chiras
8. Photovoltaic Desigh and Installation,Ryan Mayfield.
9. PV Modules With variable Ideality Factors,GeorgieHristovYordanov.IEEE,june
2012,page 2362-2367.
P a g e | 70
CHAPTER 7
APPENDIX
Indoor Experiments:
For Fixed Light:
Monocrystalline 2 lights:
v25=[14.4 13.7 12.7 11.6 8.5 4.3 0.6 0]
i25=[0 72 80 85 89 91 92 92.5]
plot(v25,i25,'g');hold on;
v30=[17.1 13.6 13.1 12.5 11.7 10.8 9.7 8.9 7.9 6.9 5.1 2.8 0.1 0];
i30=[0 70 75 80 85 90 95 96 97 98 99 99.5 99.8 100];
plot(v30,i30,'y');
V35=[17.1 14.3 14.1 13.7 13.4 12.9 12.4 11.9 11.1 10.2 5.7 3.5 0.1 0];
I35=[0 70 75 80 85 90 95 100 105 109 111 112 113 114];
plot(V35,I35,'r');
v40=[16.66 13.74 13.55 13.24 12.88 12.36 11.71 11.01 9.81 7.73 5.97 3.55 0.13 0];
i40=[0 71 75 80 85 90 95 100 105 109 110 111 112 112.5];
plot(v40,i40,'m');grid on;
v45=[16.20 13.24 12.72 11.61 10.34 9.07 7.84 5.60 3.15 0.12 0];
i45=[0 70 80 90 100 105 108 110 111 111.5 112];
plot(v45,i45,'c');hold on;gridon;xlabel('voltage'),ylabel('current');
legend('25 degree','30 degree','35 degree','40degree','45 degree');

P a g e | 71
Monocrystalline 4 lights:
v25=[19.3 17.7 17.4 17.1 16.7 16.3 15.8 15.0 14.2 13.4 12.7 12.1 9.5 7.6 5.6 4.4 0.3 0];
i25=[0 90 100 110 120 130 140 150 160 170 175 180 185 187 189 190 191 192];
plot(v25,i25,'g');hold on;
v30=[18.7 17.0 16.9 16.6 16.3 16.1 15.9 15.7 15.4 15.1 14.8 14.6 14.2 13.8 13.4 12.6 11.8
10.7 9.5 8.7 7.0 5.0 2.4 1.2 0.1 0 ];
i30=[0 89 90 100 105 110 115 120 125 130 135 140 145 150 155 160 165 168 169 170 171
172 173 174 175 177];
plot(v30,i30,'y')
V35=[18.5 16.9 16.8 16.6 16.4 16.3 16.2 16.0 15.8 15.6 15.4 15.2 15.0 14.7 14.4 14.1 13.7
13.2 12.7 12.2 11.6 10.8 8.3 5.6 1.6 0.1 0];
I35=[0 86 90 100 105 110 115 120 125 130 135 140 145 150 155 160 165 170 175 180 185
190 195 198 200 201 202];
plot(V35,I35,'r');hold on;
v40=[18.16 16.87 16.66 16.39 16.17 16.04 15.90 15.70 15.57 15.35 15.13 14.85 14.67 14.32
14.02 13.72 13.43 13.09 12.62 12.07 11.52 10.95 9.36 6.30 4.18 1.86 0.39 0];
i40=[0 89 100 110 115 120 125 130 135 140 145 150 155 160 165 170 175 180 185 190 195
200 204 206 208 210 210.5 211];
plot(v40,i40,'m');hold on;
v45=[17.63 16.15 16.07 15.79 15.48 15.16 14.75 14.34 13.79 13.15 12.39 11.36 9.97 6.23
3.13 0.22 0];
i45=[0 87 90 100 110 120 130 140 150 160 170 180 190 192 194 195 196];
plot(v45,i45,'c');grid on;xlabel('voltage'),ylabel('current');
legend('25 degree','30 degree','35 degree','40degree','45 degree');

P a g e | 72
Monocrystalline 6 lights:
v25=[19.9 18.9 18.8 18.6 18.4 18.2 18.0 17.8 17.5 17.2 16.8 16.4 16.0 15.5 14.9 14.1 13.2
12.1 9.0 7.7 6.7 5.2 3.2 0.4 0]
i25=[0 95 100 110 120 130 140 150 160 170 180 190 200 210 220 230 240 250 252 254 256
258 260 261 262]
plot(v25,i25,'g');hold on;
v30=[19.4 18.4 18.3 18.2 18.1 18.0 17.9 17.8 17.7 17.6 17.5 17.4 17.3 17.2 17.1 17.0 16.8
16.5 16.3 16.0 15.8 15.6 15.4 15.1 14.8 14.5 14.2 13.9 13.5 12.6 11.7 8.1 6.3 5.5 3.2 2.9 2.2
0.2 0];
i30=[0 98 105 110 115 120 125 130 135 140 145 150 155 160 165 170 175 180 185 190 195
200 205 210 215 220 225 230 235 240 245 250 252 254 256 257 258 259 260];
plot(v30,i30,'y');
V35=[19.0 18.2 18.1 17.9 17.8 17.7 17.6 17.5 17.4 17.3 17.2 17.2 17.1 17.0 16.9 16.7 16.6
16.5 16.3 16.1 15.9 15.7 15.5 15.3 15.1 14.9 14.7 14.4 14.1 13.7 13.2 12.8 12.4 11.7 11.1
10.1 8.8 3.6 0.2 0];
I35=[0 94 100 110 120 125 130 135 140 145 150 155 160 165 170 175 180 185 190 195 200
205 210 215 220 225 230 235 240 245 250 255 260 265 270 275 278 280 281 284];
plot(V35,I35,'r');hold on;
v40=[18.72 17.87 17.80 17.66 17.49 17.35 17.17 16.99 16.81 16.57 16.29 15.97 15.69 15.43
15.00 14.66 14.08 13.40 12.65 11.69 10.39 8.98 6.34 3.68 2.03 0.22 0];
i40=[0 94 100 110 120 130 140 150 160 170 180 190 200 210 220 230 240 250 260 270 280
282 284 286 287 288 290];
plot(v40,i40,'m');hold on;
v45=[18.31 17.56 17.46 17.32 17.21 17.03 16.90 16.74 16.56 16.32 16.05 15.80 15.61 15.27
15.08 14.70 14.04 13.54 12.76 11.88 10.70 9.68 7.32 4.67 0.23 0];

P a g e | 73
i45=[0 90 100 110 120 130 140 150 160 170 180 190 200 210 220 230 240 250 260 270 280
285 288 290 291 292];
plot(v45,i45,'c');grid on;xlabel('voltage'),ylabel('current');
legend('25 degree','30 degree','35 degree','40degree','45 degree');
Monocrystalline 8 lights:
v25=[20.4 19.7 19.6 19.5 19.3 19.2 19.1 18.9 18.8 18.7 18.5 18.4 18.2 18.0 17.7 17.5 17.2
17.0 16.6 16.3 15.9 15.5 15.1 14.5 12.5 10.3 8.7 7.5 5.9 4.4 3.0 0.6 0]
i25=[0 101 110 120 130 140 150 160 170 170 180 190 200 210 220 230 240 250 260 270
280 290 300 310 320 322 324 324 326 328 330 331 333]
plot(v25,i25,'g');hold on;
v30=[19.9 19.2 19.1 19.0 18.9 18.7 18.6 18.5 18.4 18.3 18.2 18.1 18.0 17.8 17.6 17.5 17.4
17.3 17.1 16.9 16.7 16.5 16.4 16.3 16.0 15.4 14.8 14.2 13.6 12.6 10.9 8.8 8.0 7.2 6.3 5.1 3.7
1.9 0.4 0];
i30=[0 100 110 120 130 140 150 159 164 172 180 187 196 203 210 215 220 225 230 240
245 250 255 260 270 280 290 300 310 320 322 324 326 328 330 332 333 334 335 336];
plot(v30,i30,'y')
V35=[19.4 18.8 18.8 18.7 18.6 18.5 18.4 18.3 18.2 18.1 18.0 18.0 17.9 17.9 17.8 17.8 17.7
17.6 17.5 17.4 17.3 17.2 17.1 17.0 16.9 16.8 16.7 16.6 16.5 16.4 16.3 16.1 15.9 15.7 15.5
15.3 15.1 14.9 14.6 14.3 14.0 13.8 13.4 13.1 12.8 12.4 11.9 10.3 7.4 4.7 2.8 0.3 0];
I35=[0 98 100 110 120 130 140 150 160 165 170 175 180 185 190 195 200 205 210 215 220
225 230 235 240 245 250 255 260 265 270 275 280 285 290 295 300 305 310 315 320 325
330 335 340 345 350 355 360 362 364 365 367];
plot(V35,I35,'r');hold on;
v40=[19.23 18.59 18.55 18.47 18.37 18.27 18.20 18.07 17.94 17.83 17.73 17.60 17.43 17.26
17.14 16.98 16.81 16.61 16.45 16.24 16.11 15.86 15.59 15.19 14.81 14.44 13.91 13.27 12.56
11.77 10.08 8.37 6.59 2.90 0.34 0];

P a g e | 74
i40=[0 94 100 110 120 130 140 150 160 170 180 190 200 210 220 230 240 250 260 270 280
290 300 310 320 330 340 350 360 370 375 378 380 381 381.5 382];
plot(v40,i40,'m');hold on;
v45=[18.75 18.23 18.20 18.11 18.02 17.93 17.82 17.72 17.64 17.53 17.40 17.29 17.15 16.98
16.84 16.78 16.65 16.48 16.24 16.08 15.89 15.55 15.30 15.05 14.82 14.42 14.04 13.54 12.68
11.55 10.04 8.23 6.61 5.61 3.81 1.56 0.36 0]
i45=[0 95 100 110 120 130 140 150 160 170 180 190 200 210 220 230 240 250 260 270 280
290 300 310 320 330 340 350 360 370 378 380 382 384 386 390 391 392]
plot(v45,i45,'c');grid on;xlabel('voltage'),ylabel('current');
legend('25 degree','30 degree','35 degree','40degree','45 degree');
Monocrystalline 10 lights:
v30=[20.3 19.7 19.6 19.5 19.4 19.3 19.2 19.1 19.0 18.9 18.8 18.7 18.6 18.5 18.3 18.2 18.1
17.9 17.7 17.6 17.3 17.1 16.8 16.6 16.4 16.2 16.0 15.6 15.2 14.2 13.2 10.7 8.2 7.3 6.8 6.1 4.2
2.4 0.5 0];
i30=[0 101 110 120 130 140 150 160 172 184 190 200 210 220 231 240 250 260 271 280
290 300 310 320 330 340 350 360 370 380 385 390 391 393 395 397 399 400 400.5 401];
plot(v30,i30,'g');hold on;
V35= [19.9 19.2 19.2 19.1 19.1 19.1 19.0 18.9 18.8 18.7 18.6 18.6 18.6 18.5 18.5 18.4 18.4
18.3 18.2 18.1 18.1 18.0 18.0 18.0 17.9 17.8 17.8 17.7 17.6 17.5 17.4 17.3 17.2 17.1 17.0
16.9 16.8 16.7 16.6 16.5 16.4 16.2 16.1 16.0 15.9 15.8 15.7 15.4 15.1 14.8 14.5 14.2 13.9
13.7 13.2 12.8 12.4 11.8 9.5 5.5 3.5 0.3 0];
I35=[0 98 100 110 120 130 140 150 160 170 180 185 190 195 200 205 210 215 220 225 230
235 240 250 255 260 265 270 275 280 285 290 295 300 305 310 315 320 325 330 335 340
345 350 355 360 365 370 375 380 385 390 395 400 405 410 415 420 425 430 432 434 439];
plot(V35,I35,'y');hold on;

P a g e | 75
v40=[19.43 18.96 18.92 18.79 18.64 18.56 18.47 18.38 18.27 18.19 18.09 18.00 17.91 17.80
17.62 17.57 17.52 17.44 17.32 17.22 17.10 16.96 16.77 16.65 16.45 16.15 15.88 15.60 15.33
15.04 14.61 13.89 13.51 12.67 11.38 10.22 7.49 6.31 4.83 2.29 0.44 0];
i40=[0 98 100 120 140 150 160 170 180 190 200 210 220 230 240 250 260 270 280 290 300
310 320 330 340 350 360 370 380 390 400 410 420 430 438 440 442 444 446 448 450 451];
plot(v40,i40,'r');hold on;
v45=[19.06 18.53 18.49 18.43 18.37 18.29 18.21 18.14 18.07 17.96 17.90 17.86 17.80 17.72
17.66 17.55 17.42 17.37 17.30 17.23 17.14 16.98 16.80 16.68 16.48 16.30 16.19 15.94 15.75
15.37 14.99 14.75 14.44 13.93 13.66 13.08 12.40 9.44 8.08 6.90 5.45 3.13 0.53 0];
i45=[0 96 100 110 120 130 140 150 160 170 180 190 200 210 220 230 240 250 260 270 280
290 300 310 320 330 340 350 360 370 380 390 400 410 420 430 440 442 445 447 449 451
452 453];
plot(v45,i45,'m');grid on;xlabel('voltage'),ylabel('current');
legend('30 degree','35 degree','40degree','45 degree');
Polycrystalline 2 lights:
v25=[17.5 13.7 13.2 12.8 11.6 8.5 7.1 4.3 0.3 0];
i25=[0 70 75 80 85 88 90 91 91.5 92];
plot(v25,i25,'g');hold on;
v30=[18.7 16.5 16.3 16.0 15.7 15.2 14.6 13.7 12.4 10.7 8.6 7.9 6.3 4.7 3.9 2.0 0.10 0];
i30=[0 85 90 95 100 105 110 115 120 122 123 124 125 126 127 128 129 129.5];
plot(v30,i30,'y');hold on;
v35=[18.5 17.0 16.7 16.3 16.1 15.9 15.5 15.1 14.7 13.9 13.2 11.5 0.09 0]
i35=[0 90 100 110 115 120 125 130 135 140 145 150 155 156]
plot(v35,i35,'r');hold on;
v40=[17.6 16.0 15.8 15.6 15.3 15.0 14.5 14.0 13.3 12.8 12.2 10.4 9.5 6.8 5.2 3.1 1.5 0.5 0];
i40=[0 81 85 90 95 100 105 110 115 118 120 122 124 126 128 129 130 130.5 131];
P a g e | 76
plot(v40,i40,'m');grid on;
v45=[17.4 15.7 15.4 14.8 14.1 13.4 12.8 11.4 10.6 9.7 7.0 4.4 0.2 0]
i45=[0 80 90 100 110 115 120 122 125 127 129 130 131 132]
plot(v45,i45,'c');grid on;xlabel('voltage'),ylabel('current');
legend('25 degree','30 degree','35 degree','40degree','45 degree');
Polycrystalline 4 lights:
v30=[19.6 18.7 18.7 18.6 18.5 18.4 18.3 18.2 18.1 18.0 17.9 17.8 17.7 17.5 17.3 17.2 17.0
16.8 16.5 16.3 16.0 15.7 15.3 14.6 14.0 13.1 10.7 8.7 4.9 2.5 0.2 0];
i30=[0 96 100 105 110 115 120 125 130 135 140 145 150 155 160 165 170 175 180 185 190
195 200 205 210 215 218 220 221 222 223 224];
plot(v30,i30,'g');hold on;
v35=[19.3 18.5 18.4 18.3 18.1 18.0 17.8 17.7 17.4 17.1 16.9 16.7 16.3 15.9 15.5 15.0 14.6
13.9 13.5 13.1 12.6 11.9 5.6 3.1 1.9 0.9 0.1 0]
i35=[0 100 110 120 130 140 150 160 170 180 190 200 210 220 230 240 250 251 252 253
254 255 256 257 258 259 260 262]
plot(v35,i35,'y');hold on
v40=[18.7 17.8 17.7 17.6 17.5 17.4 17.3 17.2 17.1 17.0 16.9 16.8 16.6 16.4 16.2 16.0 15.8
15.6 15.4 15.2 14.9 14.3 13.5 12.7 10.4 7.5 5.3 2.8 0.4 0];
i40=[0 92 100 110 115 120 125 130 135 140 145 150 155 160 165 170 175 180 185 190 195
200 205 210 215 218 220 221 222 223];
plot(v40,i40,'r');hold on;
v45=[18.3 17.5 17.2 16.9 16.4 16.0 15.6 15.1 14.5 13.8 12.2 8.8 6.4 3.2 0.5 0]
i45=[0 90 110 130 150 170 180 190 200 210 220 223 225 227 229 230]
plot(v45,i45,'m');hold on;gridon;xlabel('voltage'),ylabel('current');
legend('30 degree','35 degree','40degree','45 degree');

P a g e | 77
Polycrystalline 6 lights:
v25=[20.4 19.7 19.6 19.5 19.4 19.3 19.1 18.9 18.7 18.5 18.3 18.1 17.9 17.7 17.5 17.2 16.9
16.6 16.3 15.9 15.5 15.0 14.5 14.0 13.3 12.5 11.2 10.3 8.7 7.5 6.9 5.5 4.9 3.8 2.2 0.6 0];
i25=[0 102 110 120 130 140 150 160 170 180 190 200 210 220 230 240 250 260 270 280
290 300 310 315 320 321 322 323 324 325 326 327 328 329 330 331 332];
plot(v25,i25,'g');hold on;grid on;
v30=[20.1 19.6 19.6 19.6 19.5 19.4 19.36 19.28 19.20 19.1 19.0 18.9 18.8 18.6 18.5 18.4
18.2 18.0 17.8 17.6 17.4 17.2 16.8 16.6 16.3 16.0 15.7 15.4 15.2 14.7 13.7 12.7 11.4 9.3 6.6
4.4 2.6 1.6 0.4 0];
i30=[0 98 100 110 120 130 140 150 160 170 180 190 200 210 220 230 240 250 260 270 280
290 300 310 315 320 325 330 335 340 345 347 349 350 351 352 353 354 355 356];
plot(v30,i30,'y');hold on;
v35=[19.7 19.1 18.7 18.3 18.0 17.7 17.5 17.0 16.4 15.6 15.0 14.0 11.0 9.3 7.3 6.7 4.4 2.3
0.02 0]
i35=[0 0100 150 200 220 240 0260 280 300 320 330 340 343 346 349 351 355 358 359 360]
plot(v35,i35,'r');hold on;
v40=[19.2 18.7 18.6 18.6 18.5 18.4 18.3 18.2 18.1 18.0 17.9 17.7 17.6 17.5 17.4 17.3 17.1
16.8 16.6 16.4 16.2 15.8 15.4 14.7 14.1 11.8 6.5 2.5 0.3 0];
i40=[0 98 110 120 130 140 150 160 170 180 190 200 210 220 230 240 250 260 270 280 290
300 310 320 330 340 345 350 351 352];
plot(v40,i40,'m');hold on;
v45=[18.8 18.3 17.9 17.7 17.5 17.3 17.0 16.7 16.4 16.1 15.8 15.4 15.0 14.5 13.8 10.1 6.2 4.6
0.4 0]
i45=[0 95 150 170 190 210 230 250 260 270 290 300 310 320 330 340 350 353 356 360]

P a g e | 78
length(v45)
length(i45)
plot(v45,i45,'c');hold on;gridon;xlabel('voltage'),ylabel('current');
legend('25 degree','30 degree','35 degree','40degree','45 degree');
Polycrystalline 8 lights:
v30=[20.4 20.0 19.9 19.9 19.8 19.8 19.8 19.7 19.6 19.5 19.4 19.3 19.2 19.1 19.0 18.9 18.8
18.7 18.6 18.5 18.4 18.3 18.1 18.0 17.8 17.6 17.3 17.1 16.5 15.8 14.9 14.6 13.5 12.2 7.3 6.6
5.7 4.4 3.1 2.3 1.0 0.3];
i30=[0 100 110 120 130 140 150 160 170 180 190 200 210 220 230 240 250 260 270 280
290 300 310 320 330 340 350 360 370 380 390 400 405 410 415 420 423 426 429 432 435
437];
plot(v30,i30,'g');hold on;
v35=[20.0 19.7 19.0 18.2 17.9 17.6 17.2 16.8 16.4 15.8 15.2 14.3 13.5 11.3 6.7 2.8 0.05 0];
i35=[0 100 200 300 330 350 375 390 400 410 420 430 435 440 443 445 446 450];
plot(v35,i35,'y');hold on;
v40=[19.6 19.2 19.1 19.0 18.9 18.89 18.84 18.78 18.73 18.6 18.5 18.4 18.3 18.3 18.2 18.1
18.0 17.9 17.8 17.7 17.6 17.5 17.4 17.3 17.2 17.0 16.8 16.6 16.2 15.8 15.4 14.9 14.3 13.6
12.2 10.8 8.6 7.5 6.6 4.8 1.8 0.30 0];
i40=[0 98 110 130 150 160 170 180 190 200 210 220 230 240 250 260 270 280 290 300 310
320 330 340 350 360 370 380 390 400 410 420 430 435 438 440 442 444 448 450 452 454
455];
plot(v40,i40,'r');
v45=[18.8 18.7 18.4 18.1 17.8 17.4 17.1 16.9 16.6 16.2 15.8 15.4 15.1 14.6 14.0 12.4 7.4 5.2
3.7 0.4 0];

P a g e | 79
i45=[0 98 150 200 250 300 330 350 370 390 400 410 420 430 440 450 455 458 460 461
463];
plot(v45,i45,'m');grid on;xlabel('voltage'),ylabel('current');
legend('30 degree','35 degree','40degree','45 degree');
Polycrystalline 10 lights:
V30=[20.7 20.2 20.1 20.0 19.9 19.8 19.7 19.6 19.5 19.5 19.5 19.4 19.4 19.3 19.2 19.2 19.1
19.0 18.9 18.8 18.7 18.6 18.5 18.4 18.3 18.2 18.1 18.0 17.8 17.6 17.4 17.1 16.8 16.4 16.1
15.3 14.1 13.3 12.5 11.8 11.0 10.6 7.9 4.8 2.3 0.4];
I30=[0 101 110 120 160 180 200 220 230 240 250 260 270 280 290 300 310 320 330 340
350 360 370 380 390 400 410 420 430 440 450 460 470 480 490 500 510 520 525 530 535
538 541 545 548 552];
plot(V30,I30,'g');hold on;
v35=[20.3 19.8 19.4 18.8 18.5 18.3 18.2 17.9 17.6 17.3 16.9 16.7 16.3 15.8 15.2 14.3 11.8
8.5 5.3 3.1 0.3 0];
i35=[0 100 200 300 350 375 390 410 430 450 460 470 480 490 500 510 515 520 525 530
531 535];
plot(v35,i35,'y');hold on;
v40=[19.8 19.4 19.4 19.3 19.2 19.1 19.0 18.9 18.8 18.79 18.74 18.69 18.63 18.58 18.52
18.47 18.41 18.36 18.30 18.2 18.1 18.0 17.9 17.8 17.7 17.6 17.5 17.4 17.3 17.2 17.0 16.8
16.6 16.3 15.9 15.6 14.8 13.7 12.5 11.3 10.0 8.9 7.8 6.1 4.5 3.3 0.5 0];
i40=[0 99 100 120 140 160 180 200 220 230 240 250 260 270 280 290 300 310 320 330 340
350 360 370 380 390 400 410 420 430 440 450 460 470 480 490 500 510 520 530 540 550
555 560 565 570 575 576];
plot(v40,i40,'r');hold on;
v45=[19.3 19.0 18.4 18.1 17.9 17.6 17.4 17.2 17.0 16.7 16.5 16.2 16.0 15.8 15.5 15.1 14.7
14.2 13.5 12.4 10.7 7.5 5.3 3.2 0.4 0]

P a g e | 80
i45=[0 100 200 250 300 350 370 390 410 430 440 450 460 470 480 490 500 510 520 530
540 550 560 565 570 574]
plot(v45,i45,'m');grid on;xlabel('voltage'),ylabel('current');
legend('25 degree','30 degree','35 degree','40degree','45 degree');
For fixed temperature:
Monocrystalline 25 degree Celsius:
v2=[14.4 13.7 12.7 11.6 8.5 4.3 0.6 0]
i2=[0 72 80 85 89 91 92 92.5]
plot(v2,i2,'g');hold on;
v4=[19.3 17.7 17.4 17.1 16.7 16.3 15.8 15.0 14.2 13.4 12.7 12.1 9.5 7.6 5.6 4.4 0.3 0]
i4=[0 90 100 110 120 130 140 150 160 170 175 180 185 187 189 190 191 192]
plot(v4,i4,'r');hold on;
v6=[19.9 18.9 18.8 18.6 18.4 18.2 18.0 17.8 17.5 17.2 16.8 16.4 16.0 15.5 14.9 14.1 13.2
12.1 9.0 7.7 6.7 5.2 3.2 0.4 0]
i6=[0 95 100 110 120 130 140 150 160 170 180 190 200 210 220 230 240 250 252 254 256
258 260 261 262]
plot(v6,i6,'y');hold on;
v8=[20.4 19.7 19.6 19.5 19.3 19.2 19.1 18.9 18.8 18.7 18.5 18.4 18.2 18.0 17.7 17.5 17.2
17.0 16.6 16.3 15.9 15.5 15.1 14.5 12.5 10.3 8.7 7.5 5.9 4.4 3.0 0.6 0]
i8=[0 101 110 120 130 140 150 160 170 170 180 190 200 210 220 230 240 250 260 270 280
290 300 310 320 322 324 324 326 328 330 331 333]
plot(v8,i8,'m');grid on;gridon;xlabel('voltage'),ylabel('current');
legend('10Lights','8lights','6lights','4lights','2lights');

P a g e | 81
Monocrystalline 30 degree Celsius:
v1=[20.3 19.7 19.6 19.5 19.4 19.3 19.2 19.1 19.0 18.9 18.8 18.7 18.6 18.5 18.3 18.2 18.1
17.9 17.7 17.6 17.3 17.1 16.8 16.6 16.4 16.2 16.0 15.6 15.2 14.2 13.2 10.7 8.2 7.3 6.8 6.1 4.2
2.4 0.5 0];
i1=[0 101 110 120 130 140 150 160 172 184 190 200 210 220 231 240 250 260 271 280 290
300 310 320 330 340 350 360 370 380 385 390 391 393 395 397 399 400 400.5 401];
plot(v1,i1,'g');hold on;
v2=[19.9 19.2 19.1 19.0 18.9 18.7 18.6 18.5 18.4 18.3 18.2 18.1 18.0 17.8 17.6 17.5 17.4
17.3 17.1 16.9 16.7 16.5 16.4 16.3 16.0 15.4 14.8 14.2 13.6 12.6 10.9 8.8 8.0 7.2 6.3 5.1 3.7
1.9 0.4 0];
i2=[0 100 110 120 130 140 150 159 164 172 180 187 196 203 210 215 220 225 230 240 245
250 255 260 270 280 290 300 310 320 322 324 326 328 330 332 333 334 335 336];
plot(v2,i2,'r')
v3=[19.4 18.4 18.3 18.2 18.1 18.0 17.9 17.8 17.7 17.6 17.5 17.4 17.3 17.2 17.1 17.0 16.8
16.5 16.3 16.0 15.8 15.6 15.4 15.1 14.8 14.5 14.2 13.9 13.5 12.6 11.7 8.1 6.3 5.5 3.2 2.9 2.2
0.2 0];
i3=[0 98 105 110 115 120 125 130 135 140 145 150 155 160 165 170 175 180 185 190 195
200 205 210 215 220 225 230 235 240 245 250 252 254 256 257 258 259 260];
plot(v3,i3,'y')
v7=[18.7 17.0 16.9 16.6 16.3 16.1 15.9 15.7 15.4 15.1 14.8 14.6 14.2 13.8 13.4 12.6 11.8
10.7 9.5 8.7 7.0 5.0 2.4 1.2 0.1 0 ];
i7=[0 89 90 100 105 110 115 120 125 130 135 140 145 150 155 160 165 168 169 170 171
172 173 174 175 177];
plot(v7,i7,'m');grid on;xlabel('voltage'),ylabel('current');
legend('10Lights','8lights','6lights','4lights','2lights');
v8=[17.1 13.6 13.1 12.5 11.7 10.8 9.7 8.9 7.9 6.9 5.1 2.8 0.1 0];

P a g e | 82
i8=[0 70 75 80 85 90 95 96 97 98 99 99.5 99.8 100];
plot(v8,i8,'c')
grid on;
Monocrystalline 35 degree Celsius:
V10= [19.9 19.2 19.2 19.1 19.1 19.1 19.0 18.9 18.8 18.7 18.6 18.6 18.6 18.5 18.5 18.4 18.4
18.3 18.2 18.1 18.1 18.0 18.0 18.0 17.9 17.8 17.8 17.7 17.6 17.5 17.4 17.3 17.2 17.1 17.0
16.9 16.8 16.7 16.6 16.5 16.4 16.2 16.1 16.0 15.9 15.8 15.7 15.4 15.1 14.8 14.5 14.2 13.9
13.7 13.2 12.8 12.4 11.8 9.5 5.5 3.5 0.3 0];
I10=[0 98 100 110 120 130 140 150 160 170 180 185 190 195 200 205 210 215 220 225 230
235 240 250 255 260 265 270 275 280 285 290 295 300 305 310 315 320 325 330 335 340
345 350 355 360 365 370 375 380 385 390 395 400 405 410 415 420 425 430 432 434 439];
plot(V10,I10,'g');hold on;
V8=[19.4 18.8 18.8 18.7 18.6 18.5 18.4 18.3 18.2 18.1 18.0 18.0 17.9 17.9 17.8 17.8 17.7
17.6 17.5 17.4 17.3 17.2 17.1 17.0 16.9 16.8 16.7 16.6 16.5 16.4 16.3 16.1 15.9 15.7 15.5
15.3 15.1 14.9 14.6 14.3 14.0 13.8 13.4 13.1 12.8 12.4 11.9 10.3 7.4 4.7 2.8 0.3 0];
I8=[0 98 100 110 120 130 140 150 160 165 170 175 180 185 190 195 200 205 210 215 220
225 230 235 240 245 250 255 260 265 270 275 280 285 290 295 300 305 310 315 320 325
330 335 340 345 350 355 360 362 364 365 367];
plot(V8,I8,'r');hold on;
V6=[19.0 18.2 18.1 17.9 17.8 17.7 17.6 17.5 17.4 17.3 17.2 17.2 17.1 17.0 16.9 16.7 16.6
16.5 16.3 16.1 15.9 15.7 15.5 15.3 15.1 14.9 14.7 14.4 14.1 13.7 13.2 12.8 12.4 11.7 11.1
10.1 8.8 3.6 0.2 0];
I6=[0 94 100 110 120 125 130 135 140 145 150 155 160 165 170 175 180 185 190 195 200
205 210 215 220 225 230 235 240 245 250 255 260 265 270 275 278 280 281 284];
plot(V6,I6,'y');hold on;
V4=[18.5 16.9 16.8 16.6 16.4 16.3 16.2 16.0 15.8 15.6 15.4 15.2 15.0 14.7 14.4 14.1 13.7
13.2 12.7 12.2 11.6 10.8 8.3 5.6 1.6 0.1 0];

P a g e | 83
I4=[0 86 90 100 105 110 115 120 125 130 135 140 145 150 155 160 165 170 175 180 185
190 195 198 200 201 202];
plot(V4,I4,'m');hold on;
V2=[17.1 14.3 14.1 13.7 13.4 12.9 12.4 11.9 11.1 10.2 5.7 3.5 0.1 0];
I2=[0 70 75 80 85 90 95 100 105 109 111 112 113 114];
plot(V2,I2,'c');hold on;
gridon;xlabel('voltage'),ylabel('current');
legend('10Lights','8lights','6lights','4lights','2lights');
Monocrystalline 40 degree Celsius:
v10=[19.43 18.96 18.92 18.79 18.64 18.56 18.47 18.38 18.27 18.19 18.09 18.00 17.91 17.80
17.62 17.57 17.52 17.44 17.32 17.22 17.10 16.96 16.77 16.65 16.45 16.15 15.88 15.60 15.33
15.04 14.61 13.89 13.51 12.67 11.38 10.22 7.49 6.31 4.83 2.29 0.44 0];
i10=[0 98 100 120 140 150 160 170 180 190 200 210 220 230 240 250 260 270 280 290 300
310 320 330 340 350 360 370 380 390 400 410 420 430 438 440 442 444 446 448 450 451];
plot(v10,i10,'g');hold on;
v8=[19.23 18.59 18.55 18.47 18.37 18.27 18.20 18.07 17.94 17.83 17.73 17.60 17.43 17.26
17.14 16.98 16.81 16.61 16.45 16.24 16.11 15.86 15.59 15.19 14.81 14.44 13.91 13.27 12.56
11.77 10.08 8.37 6.59 2.90 0.34 0];
i8=[0 94 100 110 120 130 140 150 160 170 180 190 200 210 220 230 240 250 260 270 280
290 300 310 320 330 340 350 360 370 375 378 380 381 381.5 382];
plot(v8,i8,'y');hold on;
v6=[18.72 17.87 17.80 17.66 17.49 17.35 17.17 16.99 16.81 16.57 16.29 15.97 15.69 15.43
15.00 14.66 14.08 13.40 12.65 11.69 10.39 8.98 6.34 3.68 2.03 0.22 0];
i6=[0 94 100 110 120 130 140 150 160 170 180 190 200 210 220 230 240 250 260 270 280
282 284 286 287 288 290];
plot(v6,i6,'r');hold on;

P a g e | 84
v4=[18.16 16.87 16.66 16.39 16.17 16.04 15.90 15.70 15.57 15.35 15.13 14.85 14.67 14.32
14.02 13.72 13.43 13.09 12.62 12.07 11.52 10.95 9.36 6.30 4.18 1.86 0.39 0];
i4=[0 89 100 110 115 120 125 130 135 140 145 150 155 160 165 170 175 180 185 190 195
200 204 206 208 210 210.5 211];
plot(v4,i4,'m');hold on;
v2=[16.66 13.74 13.55 13.24 12.88 12.36 11.71 11.01 9.81 7.73 5.97 3.55 0.13 0];
i2=[0 71 75 80 85 90 95 100 105 109 110 111 112 112.5];
plot(v2,i2,'c');grid on;
xlabel('voltage'),ylabel('current');
legend('10Lights','8lights','6lights','4lights','2lights');
Monocrystalline 45 degree Celsius:
v2=[16.20 13.24 12.72 11.61 10.34 9.07 7.84 5.60 3.15 0.12 0];
i2=[0 70 80 90 100 105 108 110 111 111.5 112];
plot(v2,i2,'g');hold on;
v4=[17.63 16.15 16.07 15.79 15.48 15.16 14.75 14.34 13.79 13.15 12.39 11.36 9.97 6.23
3.13 0.22 0];
i4=[0 87 90 100 110 120 130 140 150 160 170 180 190 192 194 195 196];
plot(v4,i4,'y')
v6=[18.31 17.56 17.46 17.32 17.21 17.03 16.90 16.74 16.56 16.32 16.05 15.80 15.61 15.27
15.08 14.70 14.04 13.54 12.76 11.88 10.70 9.68 7.32 4.67 0.23 0];
i6=[0 90 100 110 120 130 140 150 160 170 180 190 200 210 220 230 240 250 260 270 280
285 288 290 291 292];
plot(v6,i6,'r')

P a g e | 85
v8=[18.75 18.23 18.20 18.11 18.02 17.93 17.82 17.72 17.64 17.53 17.40 17.29 17.15 16.98
16.84 16.78 16.65 16.48 16.24 16.08 15.89 15.55 15.30 15.05 14.82 14.42 14.04 13.54 12.68
11.55 10.04 8.23 6.61 5.61 3.81 1.56 0.36 0]
i8=[0 95 100 110 120 130 140 150 160 170 180 190 200 210 220 230 240 250 260 270 280
290 300 310 320 330 340 350 360 370 378 380 382 384 386 390 391 392]
plot(v8,i8,'m')
v10=[19.06 18.53 18.49 18.43 18.37 18.29 18.21 18.14 18.07 17.96 17.90 17.86 17.80 17.72
17.66 17.55 17.42 17.37 17.30 17.23 17.14 16.98 16.80 16.68 16.48 16.30 16.19 15.94 15.75
15.37 14.99 14.75 14.44 13.93 13.66 13.08 12.40 9.44 8.08 6.90 5.45 3.13 0.53 0];
i10=[0 96 100 110 120 130 140 150 160 170 180 190 200 210 220 230 240 250 260 270 280
290 300 310 320 330 340 350 360 370 380 390 400 410 420 430 440 442 445 447 449 451
452 453];
plot(v10,i10,'c')
gridon;xlabel('voltage'),ylabel('current');
legend('10Lights','8lights','6lights','4lights','2lights');
Polycrystalline 25 degree Celsius:
v2=[17.5 13.7 13.2 12.8 11.6 8.5 7.1 4.3 0.3 0];
i2=[0 70 75 80 85 88 90 91 91.5 92];
plot(v2,i2,'g');hold on;
v4=[19.3 17.7 17.6 17.4 17.3 17.1 16.9 16.7 16.5 16.3 16.0 15.8 15.6 15.0 14.6 14.2 13.8
13.4 12.7 11.8 10.8 10.1 9.6 8.5 6.6 4.8 2.2 0.3 0];
i4=[0 90 95 100 105 110 115 120 125 130 135 140 145 150 155 160 165 170 175 180 182
184 186 188 189 190 190.5 191 192];
plot(v4,i4,'y');hold on;

P a g e | 86
v8=[20.4 19.7 19.6 19.5 19.4 19.3 19.1 18.9 18.7 18.5 18.3 18.1 17.9 17.7 17.5 17.2 16.9
16.6 16.3 15.9 15.5 15.0 14.5 14.0 13.3 12.5 11.2 10.3 8.7 7.5 6.9 5.5 4.9 3.8 2.2 0.6 0];
i8=[0 102 110 120 130 140 150 160 170 180 190 200 210 220 230 240 250 260 270 280 290
300 310 315 320 321 322 323 324 325 326 327 328 329 330 331 332];
plot(v8,i8,'r');hold on;gridon;xlabel('voltage'),ylabel('current');
legend('10Lights','8lights','6lights','4lights','2lights');
Polycrystalline 30 degree Celsius:
V1=[20.7 20.2 20.1 20.0 19.9 19.8 19.7 19.6 19.5 19.5 19.5 19.4 19.4 19.3 19.2 19.2 19.1
19.0 18.9 18.8 18.7 18.6 18.5 18.4 18.3 18.2 18.1 18.0 17.8 17.6 17.4 17.1 16.8 16.4 16.1
15.3 14.1 13.3 12.5 11.8 11.0 10.6 7.9 4.8 2.3 0.4];
I1=[0 101 110 120 160 180 200 220 230 240 250 260 270 280 290 300 310 320 330 340 350
360 370 380 390 400 410 420 430 440 450 460 470 480 490 500 510 520 525 530 535 538
541 545 548 552];
plot(V1,I1,'g');hold on;
v2=[20.4 20.0 19.9 19.9 19.8 19.8 19.8 19.7 19.6 19.5 19.4 19.3 19.2 19.1 19.0 18.9 18.8
18.7 18.6 18.5 18.4 18.3 18.1 18.0 17.8 17.6 17.3 17.1 16.5 15.8 14.9 14.6 13.5 12.2 7.3 6.6
5.7 4.4 3.1 2.3 1.0 0.3];
i2=[0 100 110 120 130 140 150 160 170 180 190 200 210 220 230 240 250 260 270 280 290
300 310 320 330 340 350 360 370 380 390 400 405 410 415 420 423 426 429 432 435 437];
plot(v2,i2,'y');hold on;
v3=[20.1 19.6 19.6 19.6 19.5 19.4 19.36 19.28 19.20 19.1 19.0 18.9 18.8 18.6 18.5 18.4 18.2
18.0 17.8 17.6 17.4 17.2 16.8 16.6 16.3 16.0 15.7 15.4 15.2 14.7 13.7 12.7 11.4 9.3 6.6 4.4
2.6 1.6 0.4 0];
i3=[0 98 100 110 120 130 140 150 160 170 180 190 200 210 220 230 240 250 260 270 280
290 300 310 315 320 325 330 335 340 345 347 349 350 351 352 353 354 355 356];
plot(v3,i3,'m');hold on;

P a g e | 87
v4=[19.6 18.7 18.7 18.6 18.5 18.4 18.3 18.2 18.1 18.0 17.9 17.8 17.7 17.5 17.3 17.2 17.0
16.8 16.5 16.3 16.0 15.7 15.3 14.6 14.0 13.1 10.7 8.7 4.9 2.5 0.2 0];
i4=[0 96 100 105 110 115 120 125 130 135 140 145 150 155 160 165 170 175 180 185 190
195 200 205 210 215 218 220 221 222 223 224];
plot(v4,i4,'c');hold on;
v5=[18.7 16.5 16.3 16.0 15.7 15.2 14.6 13.7 12.4 10.7 8.6 7.9 6.3 4.7 3.9 2.0 0.10 0];
i5=[0 85 90 95 100 105 110 115 120 122 123 124 125 126 127 128 129 129.5];
plot(v5,i5,'r');hold on;
gridon;xlabel('voltage'),ylabel('current');
legend('10Lights','8lights','6lights','4lights','2lights');
Polycrystalline 35 degree Celsius:
v2=[18.5 17.0 16.7 16.3 16.1 15.9 15.5 15.1 14.7 13.9 13.2 11.5 0.09 0]
i2=[0 90 100 110 115 120 125 130 135 140 145 150 155 156]
plot(v2,i2,'g');hold on;
v4=[19.3 18.5 18.4 18.3 18.1 18.0 17.8 17.7 17.4 17.1 16.9 16.7 16.3 15.9 15.5 15.0 14.6
13.9 13.5 13.1 12.6 11.9 5.6 3.1 1.9 0.9 0.1 0]
i4=[0 100 110 120 130 140 150 160 170 180 190 200 210 220 230 240 250 251 252 253 254
255 256 257 258 259 260 262]
plot(v4,i4,'y');hold on;
v6=[19.7 19.1 18.7 18.3 18.0 17.7 17.5 17.0 16.4 15.6 15.0 14.0 11.0 9.3 7.3 6.7 4.4 2.3 0.02
0]
i6=[0 0100 150 200 220 240 0260 280 300 320 330 340 343 346 349 351 355 358 359 360]
plot(v6,i6,'r');hold on;
v8=[20.0 19.7 19.0 18.2 17.9 17.6 17.2 16.8 16.4 15.8 15.2 14.3 13.5 11.3 6.7 2.8 0.05 0]
i8=[0 100 200 300 330 350 375 390 400 410 420 430 435 440 443 445 446 450]
plot(v8,i8,'m');hold on;

P a g e | 88
v10=[20.3 19.8 19.4 18.8 18.5 18.3 18.2 17.9 17.6 17.3 16.9 16.7 16.3 15.8 15.2 14.3 11.8
8.5 5.3 3.1 0.3 0];
i10=[0 100 200 300 350 375 390 410 430 450 460 470 480 490 500 510 515 520 525 530
531 535];
plot(v10,i10,'c');hold on;gridon;xlabel('voltage'),ylabel('current');
legend('10Lights','8lights','6lights','4lights','2lights');
Polycrystalline 40 degree Celsius:
v10=[19.8 19.4 19.4 19.3 19.2 19.1 19.0 18.9 18.8 18.79 18.74 18.69 18.63 18.58 18.52
18.47 18.41 18.36 18.30 18.2 18.1 18.0 17.9 17.8 17.7 17.6 17.5 17.4 17.3 17.2 17.0 16.8
16.6 16.3 15.9 15.6 14.8 13.7 12.5 11.3 10.0 8.9 7.8 6.1 4.5 3.3 0.5 0];
i10=[0 99 100 120 140 160 180 200 220 230 240 250 260 270 280 290 300 310 320 330 340
350 360 370 380 390 400 410 420 430 440 450 460 470 480 490 500 510 520 530 540 550
555 560 565 570 575 576];
plot(v10,i10,'g');hold on;
v8=[19.6 19.2 19.1 19.0 18.9 18.89 18.84 18.78 18.73 18.6 18.5 18.4 18.3 18.3 18.2 18.1
18.0 17.9 17.8 17.7 17.6 17.5 17.4 17.3 17.2 17.0 16.8 16.6 16.2 15.8 15.4 14.9 14.3 13.6
12.2 10.8 8.6 7.5 6.6 4.8 1.8 0.30 0];
i8=[0 98 110 130 150 160 170 180 190 200 210 220 230 240 250 260 270 280 290 300 310
320 330 340 350 360 370 380 390 400 410 420 430 435 438 440 442 444 448 450 452 454
455];
plot(v8,i8,'y');hold on;
v6=[19.2 18.7 18.6 18.6 18.5 18.4 18.3 18.2 18.1 18.0 17.9 17.7 17.6 17.5 17.4 17.3 17.1
16.8 16.6 16.4 16.2 15.8 15.4 14.7 14.1 11.8 6.5 2.5 0.3 0];
i6=[0 98 110 120 130 140 150 160 170 180 190 200 210 220 230 240 250 260 270 280 290
300 310 320 330 340 345 350 351 352];
plot(v6,i6,'m');hold on;
P a g e | 89
v4=[18.7 17.8 17.7 17.6 17.5 17.4 17.3 17.2 17.1 17.0 16.9 16.8 16.6 16.4 16.2 16.0 15.8
15.6 15.4 15.2 14.9 14.3 13.5 12.7 10.4 7.5 5.3 2.8 0.4 0];
i4=[0 92 100 110 115 120 125 130 135 140 145 150 155 160 165 170 175 180 185 190 195
200 205 210 215 218 220 221 222 223];
plot(v4,i4,'c');hold on;
v2=[17.6 16.0 15.8 15.6 15.3 15.0 14.5 14.0 13.3 12.8 12.2 10.4 9.5 6.8 5.2 3.1 1.5 0.5 0];
i2=[0 81 85 90 95 100 105 110 115 118 120 122 124 126 128 129 130 130.5 131];
plot(v2,i2,'r');grid on;xlabel('voltage'),ylabel('current');
legend('10Lights','8lights','6lights','4lights','2lights');
Polycrystalline 45 degree Celsius:
v2=[17.4 15.7 15.4 14.8 14.1 13.4 12.8 11.4 10.6 9.7 7.0 4.4 0.2 0]
i2=[0 80 90 100 110 115 120 122 125 127 129 130 131 132]
length(v2)
length(i2)
plot(v2,i2,'g');grid on;hold on;
v4=[18.3 17.5 17.2 16.9 16.4 16.0 15.6 15.1 14.5 13.8 12.2 8.8 6.4 3.2 0.5 0]
i4=[0 90 110 130 150 170 180 190 200 210 220 223 225 227 229 230]
length(v4)
length(i4)
plot(v4,i4,'y');grid on;hold on;
v6=[18.8 18.3 17.9 17.7 17.5 17.3 17.0 16.7 16.4 16.1 15.8 15.4 15.0 14.5 13.8 10.1 6.2 4.6
0.4 0]
i6=[0 95 150 170 190 210 230 250 260 270 290 300 310 320 330 340 350 353 356 360]
length(v6)
length(i6)

P a g e | 90
plot(v6,i6,'r');grid on;hold on;
v8=[18.8 18.7 18.4 18.1 17.8 17.4 17.1 16.9 16.6 16.2 15.8 15.4 15.1 14.6 14.0 12.4 7.4 5.2
3.7 0.4 0]
i8=[0 98 150 200 250 300 330 350 370 390 400 410 420 430 440 450 455 458 460 461 463]
length(v8)
length(i8)
plot(v8,i8,'m'); grid on;hold on;
v10=[19.3 19.0 18.4 18.1 17.9 17.6 17.4 17.2 17.0 16.7 16.5 16.2 16.0 15.8 15.5 15.1 14.7
14.2 13.5 12.4 10.7 7.5 5.3 3.2 0.4 0]
i10=[0 100 200 250 300 350 370 390 410 430 440 450 460 470 480 490 500 510 520 530
540 550 560 565 570 574]
length(v10)
length(i10)
plot(v10,i10,'c');grid on;holdon;xlabel('voltage'),ylabel('current');
legend('10Lights','8lights','6lights','4lights','2lights');

P a g e | 91
Outdoor Experiments:
Monocrystaline:
%day 2, june 6th, MONO, temp=34
V1130=[20.3 20.2 19.9 19.7 19.5 19.3 18.9 18.6 18.2 17.9 17.3 16.6
15.4 14.4 12.7 12.0 10.7 9.6 7.5 3.6 0.3 0];
I1130=[0 0.08 0.14 0.20 0.26 0.31 0.37 0.44 0.50 0.56 0.62 0.71 0.76
0.79 0.83 0.84 0.85 0.86 0.87 0.88 0.882 0.885];
plot(V1130,I1130,'r');hold on;
grid on;
p1130=times(V1130,I1130)
%day 2, june 6th, MONO, temp=37
V1200=[19.7 19.5 19.2 19.0 18.8 18.6 18.4 18.2 17.8 17.5 17.2 16.8
16.5 15.7 15.0 14.6 12.6 10.8 9.6 5.7 0.3 0];
I1200=[0 0.08 0.16 0.22 0.27 0.33 0.37 0.43 0.51 0.55 0.58 0.60 0.65
0.73 0.76 0.80 0.84 0.87 0.88 0.89 0.895 0.90];
plot(V1200,I1200,'b');
p1200=times(V1130,I1130)
%day 2, june 6th, MONO, temp=39
V1230=[19.6 19.4 19.0 18.7 18.4 18.1 17.8 17.6 17.3 17.0 16.7 16.4
16.0 15.6 14.8 14.1 13.5 12.5 11.2 10.0 7.4 2.9 0.1 0];
I1230=[0 0.07 0.20 0.28 0.35 0.42 0.48 0.52 0.56 0.59 0.64 0.67 0.70
0.73 0.77 0.80 0.81 0.83 0.85 0.86 0.87 0.872 0.873 0.874];
plot(V1230,I1230,'g');
p1230=times(V1230,I1230)
%day 2, june 6th, MONO, temp=34
V0100=[19.8 19.6 19.4 19.2 19.0 18.7 18.3 18.0 17.7 17.3 17.0 16.3
15.8 15.2 14.7 14.3 13.4 12.9 11.1 10.2 9.2 6.9 3.3 0.2 0];
I0100=[0 0.07 0.14 0.21 0.26 0.32 0.41 0.47 0.52 0.57 0.61 0.68 0.71
0.73 0.76 0.78 0.80 0.82 0.84 0.85 0.86 0.864 0.870 0.872 0.875];
plot(V0100,I0100,'m');
p0100=times(V0100,I0100)
%day 2, june 6th, MONO, temp=37
V0200=[20.1 19.4 18.7 17.9 17.6 17.3 16.9 16.1 15.4 14.9 14.2 13.3
12.7 11.9 11.0 10.1 8.4 4.1 0.3 0];
I0200=[0 0.07 .14 0.24 0.30 0.34 0.37 0.40 0.43 0.45 0.48 0.51 0.52
0.53 0.54 0.55 0.56 0.562 0.564 0.565];
plot(V0200,I0200,'y');
p0200=times(V0200,I0200)

P a g e | 92
%day 2, june 6th, MONO, temp=
V0300=[19.8 19.6 19.2 18.7 18.3 17.9 17.3 16.8 15.6 14.8 13.9 11.7
10.2 9.2 5.4 0.2 0];
I0300=[0 0.06 0.14 0.22 0.27 0.31 0.35 0.39 0.42 0.45 0.47 0.49 0.50
0.51 0.52 0.524 0.525];
plot(V0300,I0300,'c');
p0300=times(V0300,I0300)
gridon;legend('11.30','12pm','12.30pm','1pm','3pm','3.30pm');
%day 6,mono,temp=38
v1200=[20.6 20.4 20.3 20.1 20.0 19.9 19.8 19.6 19.4 19.0 18.6 17.9
17.2 16.6 15.9 14.1 10.6 5.7 1.0 0]
i1200=[0 0.07 0.10 0.17 0.23 0.26 0.32 0.36 0.44 0.52 0.59 0.66 0.75
0.81 0.90 0.99 1.02 1.03 1.035 1.04]
plot(v1200,i1200,'g');
gridon;hold on;
%day 6,mono,temp=46
v1230=[19.9 19.6 19.3 19.1 18.9 18.7 18.5 18.2 18.0 17.7 17.4 17.1
16.7 16.3 15.5 15.0 14.0 12.8 11.1 9.3 7.4 4.8 3.0 0.6 0]
i1230=[0 0.09 0.14 0.20 0.29 0.35 0.43 0.49 0.53 0.60 0.65 0.70 0.75
0.81 0.87 0.93 0.98 1.02 1.06 1.08 1.090 1.092 1.093 1.094 1.095]
plot(v1230,i1230,'r');
%day 6,mono,temp=41
v0100=[20.2 19.8 19.6 19.4 19.2 18.9 18.7 18.5 18.3 18.0 17.6 17.3
16.7 16.2 15.0 13.8 12.6 11.8 10.9 9.7 7.7 6.4 4.3 2.8 0.7 0]
i0100=[0 0.11 0.17 0.22 0.27 0.36 0.39 0.42 0.48 0.51 0.58 0.63 0.68
0.73 0.79 0.83 0.86 0.87 0.88 0.890 0.892 0.893 0.894 0.895 0.897
0.9]
plot(v0100,i0100,'y');
%day 6,mono,temp=39
v0130=[20.1 19.9 19.7 19.5 19.3 19.1 18.9 18.7 18.3 18.0 17.6 16.8
16.4 15.8 14.8 13.9 13.0 11.7 8.7 6.2 2.6 0.5 0]
i0130=[0 0.07 0.11 0.18 0.22 0.29 0.33 0.38 0.45 0.52 0.59 0.67 0.70
0.74 0.77 0.80 0.82 0.84 0.860 0.862 0.863 0.864 0.865]
plot(v0130,i0130,'m')
%day 6,mono,temp=37
v0300=[20.1 19.8 19.6 19.4 19.2 19.0 18.8 18.5 18.1 17.7 17.1 16.6
16.2 15.8 15.1 14.4 13.3 12.0 11.1 10.0 8.2 6.6 3.1 0.3 0]
i0300=[0 0.12 0.15 0.18 0.22 0.25 0.30 0.33 0.37 0.42 0.48 0.51 0.53
0.55 0.57 0.58 0.60 0.62 0.64 0.66 0.68 0.70 0.702 0.703 0.705]
plot(v0300,i0300,'b');grid on
%day 6,mono,temp=38
v0330=[20.0 19.6 19.4 19.2 19.0 18.8 18.6 18.4 18.1 17.7 17.1 16.8
15.9 15.3 14.7 13.5 12.2 11.4 10.4 7.8 5.3 2.6 0.4 0]

P a g e | 93
i0330=[0 0.09 0.12 0.16 0.20 0.23 0.26 0.29 0.33 0.36 0.39 0.41 0.45
0.47 0.49 0.51 0.54 0.55 0.560 0.561 0.562 0.563 0.564 0.565]
plot(v0330,i0330,'c');grid on;
legend('12pm','12.30pm','1pm','1.30pm','3pm','3.30pm');
%day 7,mono, temp=41
v1130=[20.4 20.3 20.1 19.9 19.7 19.5 19.3 19.1 18.7 18.5 18.2 18.0
17.6 17.3 16.8 15.9 15.3 14.6 13.1 11.9 9.3 6.5 4.5 2.3 0.5 0]
i1130=[0 0.07 0.12 0.19 0.24 0.30 0.35 0.40 0.47 0.53 0.58 0.63 0.67
0.73 0.78 0.83 0.88 0.92 0.98 1.01 1.02 1.03 1.040 1.042 1.043
1.045]
plot(v1130,i1130,'g');hold on;
%day 7,mono, temp=45.
v1200=[20.3 20.1 19.9 19.7 19.5 19.3 19.1 18.9 18.7 18.5 18.3 18.0
17.7 17.3 16.9 16.3 15.7 14.9 13.5 10.3 6.7 3.7 0.5 0]
i1200=[0 0.07 0.10 0.18 0.23 0.29 0.34 0.39 0.43 0.47 0.52 0.57 0.63
0.68 0.74 0.80 0.84 0.88 0.90 0.91 0.92 0.93 0.94 0.95]
plot(v1200,i1200,'r');grid on
%day 7,mono, temp=56.
v1230=[19.3 19.1 18.9 18.7 18.5 18.3 18.1 17.8 17.6 17.4 17.0 16.7
16.0 15.6 15.1 14.4 13.5 11.9 10.8 8.4 7.5 3.5 0.6 0]
i1230=[0 0.07 0.11 0.18 0.24 0.28 0.34 0.40 0.45 0.50 0.55 0.60 0.67
0.73 0.77 0.82 0.86 0.89 0.91 0.92 0.930 0.932 0.933 0.935]
plot(v1230,i1230,'b');grid on
%day 7,mono, temp=49.
v0100=[19.8 19.7 19.4 19.0 18.6 18.4 18.2 18.0 17.6 17.4 16.9 15.7
14.4 13.3 12.6 10.8 8.8 6.3 4.0 2.4 0.5 0]
i0100=[0 0.07 0.12 0.17 0.24 0.29 0.36 0.42 0.48 0.51 0.54 0.61 0.67
0.74 0.79 0.83 0.88 0.89 0.90 0.91 0.920 0.922]
plot(v0100,i0100,'y');grid on
%day 7,mono, temp=49.
v0130=[18.9 18.6 18.4 18.2 17.5 17.0 16.5 15.9 15.0 14.5 14.0 13.5
12.0 11.1 10.1 9.0 7.1 5.1 4.3 2.0 0.5 0]
i0130=[0 0.06 0.09 0.10 0.16 0.20 0.22 0.25 0.28 0.30 0.33 0.35 0.37
0.38 0.39 0.41 0.43 0.46 0.48 0.510 0.515 0.52]
plot(v0130,i0130,'c');grid on
%day 7,mono, temp=47.
v0200=[19.5 19.3 19.0 18.8 18.6 18.2 17.8 17.6 17.0 16.6 16.1 15.3
14.1 12.8 11.5 10.3 8.7 6.7 3.6 1.5 0.3 0]
i0200=[0 0.06 0.11 0.18 0.21 0.34 0.39 0.44 0.50 0.54 0.59 0.64 0.70
0.74 0.77 0.79 0.80 0.81 0.820 0.822 0.823 0.824]
plot(v0200,i0200,'m');grid on
%day 7, mono, temp=47
v0300=[19.3 19.0 18.8 18.5 18.3 18.0 17.8 17.6 17.3 16.9 15.7 15.1
14.4 13.3 12.4 11.3 10.2 9.0 7.0 4.8 2.2 0.5 0]

P a g e | 94
i0300=[0 0.06 0.10 0.17 0.20 0.26 0.30 0.33 0.36 0.41 0.50 0.53 0.56
0.59 0.61 0.63 0.64 0.650 0.652 0.656 0.660 0.662 0.663]
plot(v0300,i0300,'k');grid on
legend('11.30am','12pm','12.30pm','1pm','1.30pm','2pm','3pm');
%11th july, mono, temp=37
v1130=[22.1 22.0 21.8 21.6 21.4 21.2 21.0 20.4 20.1 19.5 19.0 18.5
17.4 15.7 14.1 12.7 11.1 9.6 7.2 6.0 4.0 0.8 0]
i1130=[0 0.08 0.14 0.21 0.24 0.27 0.31 0.37 0.43 0.46 0.50 0.54 0.59
0.65 0.68 0.70 0.71 0.720 0.725 0.730 0.733 0.734 0.735]
plot(v1130,i1130,'g');hold on;
%11th,mono,temp=35
v1200=[21.9 21.6 21.5 21.4 21.2 20.8 20.5 20.2 19.9 19.4 18.9 18.2
17.2 16.2 14.5 11.0 9.2 4.3 0.8 0]
i1200=[0 0.06 0.11 0.18 0.21 0.33 0.44 0.53 0.63 0.72 0.81 0.92 0.99
1.06 1.11 1.16 1.17 1.175 1.18 1.19]
plot(v1200,i1200,'b'),
%11th, mono,temp=39
v1230=[21.5 21.0 20.7 20.3 20.0 19.7 19.4 19.0 18.2 16.3 13.6 10.3
6.3 1.6 0.7 0]
i1230=[0 0.07 0.19 0.37 0.44 0.51 0.58 0.67 0.77 0.93 1.02 1.06 1.07
1.074 1.075 1.08]
plot(v1230,i1230,'y');
%11th, mono,temp=40
v0230=[20.1 19.9 19.7 19.4 19.2 18.7 18.3 17.8 16.8 15.4 13.4 11.3
9.6 4.6 0.7 0]
i0230=[0 0.08 0.13 0.20 0.26 0.37 0.43 0.51 0.61 0.68 0.73 0.75
0.760 0.765 0.768 0.769]
plot(v0230,i0230,'c');
%11th, mono,temp=39
v0300=[20.1 19.9 19.8 19.3 19.1 18.6 18.2 17.8 17.2 16.8 15.2 13.3
11.3 8.5 3.5 0.5 0]
i0300=[0 0.09 0.15 0.25 0.30 0.37 0.43 0.48 0.53 0.55 0.62 0.67 0.70
0.71 0.715 0.717 0.718]
plot(v0300,i0300,'m');grid on
legend('11.30am','12pm','12.30pm','2.30pm','3pm');

P a g e | 95
Polycrystalline:
%day 2,4th june,POLY, temp=34
V1130=[20.0 19.9 19.7 19.5 19.3 19.1 18.8 18.6 18.3 18.0 17.7 17.4
17.3 16.6 16.0 15.4 14.3 12.3 9.0 4.5 0.4 0]
I1130=[0 0.06 0.14 0.23 0.31 0.38 0.48 0.54 0.60 0.65 0.68 0.74 0.78
0.84 0.91 0.96 1.00 1.04 1.05 1.052 1.053 1.055]
plot(V1130,I1130,'g');
gridon;hold on
p1130=times(V1130,I1130)
%day 2, june 4th, POLY, temp=38
V1200=[19.7 19.5 19.3 19.1 18.9 18.7 18.5 18.3 18.0 17.7 17.4 17.2
16.8 16.4 15.7 15.0 14.4 12.6 10.8 9.6 5.7 0.3 0];
I1200=[0 0.08 0.14 0.21 0.27 0.31 0.35 0.38 0.45 0.51 0.56 0.58 0.62
0.67 0.73 0.76 0.79 0.85 0.87 0.88 0.89 0.895 0.90];
plot(V1200,I1200,'r');
grid on;
p1200=times(V1200,I1200)
%day 2, june 4th, POLY, temp=40, the cloud interfered throughout
this
%experiment
V1230=[20.3 20.4 20.2 20.0 19.8 19.5 19.0 18.8 18.4 18.2 18.0 17.8
17.3 16.7 15.6 11.4 8.0 4.7 0.3 0];
I1230=[0 0.07 0.14 0.21 0.31 0.38 0.42 0.44 0.51 0.66 0.70 0.77 0.85
0.88 0.91 0.93 0.95 0.97 0.99 1.03];
plot(V1230,I1230,'y');
grid on;
p1230=times(V1230,I1230)
%day 2, june 4th, POLY, temp=41
V0100=[20.9 20.8 20.6 20.4 20.2 19.9 19.4 19.3 19.1 18.9 18.5 18.0
17.2 16.8 16.3 15.9 15.0 12.5 11.6 7.9 4.1 0.3 0];
I0100=[0 0.06 0.14 0.22 0.27 0.38 0.46 0.52 0.55 0.59 0.64 0.71 0.79
0.87 0.90 0.93 0.95 0.99 1.00 1.01 1.012 1.013 1.015];
plot(V0100,I0100,'b');
grid on;
p0100=times(V0100,I0100)
%day 2, june 4th, POLY, temp=39
V0200=[19.9 19.7 19.2 18.9 18.7 18.3 17.6 17.1 16.7 15.8 14.7 13.8
12.2 9.3 4.4 0.3 0];
I0200=[0 0.07 0.20 0.30 0.36 0.41 0.51 0.58 0.61 0.66 0.69 0.71 0.72
0.73 0.74 0.742 0.744];
plot(V0200,I0200,'m');
grid on;
p0200=times(V0200,I0200)

P a g e | 96
%day 2, june 4th, POLY, temp=35
V0300=[20.1 20.0 19.7 19.3 19.0 18.8 18.6 18.3 18.0 17.6 17.3 17.0
16.5 16.3 15.2 13.8 11.7 8.7 5.7 0.3 0];
I0300=[0 0.07 0.14 0.26 0.33 0.36 0.40 0.45 0.49 0.52 0.56 0.58 0.61
0.63 0.66 0.67 0.68 0.69 0.70 0.702 0.704];
plot(V0300,I0300,'c');
grid on;
p0300=times(V0300,I0300)
%day4 ,8thjune.
%temprature=36, POLY
V1130=[20.9 20.7 20.6 20.4 20.2 20.0 19.8 19.5 19.3 19.0 18.8 18.5
18.3 17.9 17.4 16.7 14.7 12.7 10.0 7.00 2.30 0.600 0];
I1130=[0 0.07 0.19 0.29 0.39 0.44 0.50 0.58 0.65 0.71 0.75 0.81 0.86
0.90 0.95 1.01 1.06 1.12 1.15 1.16 1.17 1.172 1.19];
grid on;
plot(V1130,I1130,'g');hold on;
p1130=times(V1130,I1130)
%day4 ,8thjune.
%temprature=40 POLY
V1200=[20.9 20.5 20.4 20.2 20.0 19.9 19.6 19.3 19.1 18.8 18.6 17.5
16.6 14.2 10.8 7.40 3.90 0.700 0];
I1200=[0 0.07 0.20 0.30 0.38 0.44 0.53 0.59 0.64 0.69 0.74 0.85 0.91
0.95 0.97 0.98 0.99 0.992 0.995];
plot(V1200,I1200,'r');
grid on;
p1200=times(V1200,I1200)
%day4 ,8thjune.
%temp=38 POLY
V1230=[20.7 20.6 20.2 20.0 19.7 19.6 19.3 19.2 19.0 18.8 18.6 18.2
17.5 16.7 15.6 14.4 11.8 7.6 2.6 0.5 0];
I1230=[0 0.07 0.20 0.30 0.37 0.41 0.48 0.52 0.56 0.60 0.64 0.70 0.74
0.80 0.86 0.90 0.92 0.93 0.932 0.933 0.935];
plot(V1230,I1230,'y');
grid on;
p1230=times(V1230,I1230)
%day4 ,8thjune.
%temp=42 POLY
V0100=[20.3 20.1 19.8 19.7 19.4 19.2 18.9 18.6 18.2 17.6 17.0 15.9
13.1 10.4 5.8 0.9 0];
I0100=[0 0.07 0.16 0.21 0.28 0.36 0.42 0.48 0.52 0.60 0.64 0.70 0.76
0.80 0.81 0.815 0.82];
plot(V0100,I0100,'b');
grid on;
p0100=times(V0100,I0100)

P a g e | 97
%day4 ,8thjune.
%temp=38 POLY
V0130=[20.5 20.3 20.0 19.8 19.6 19.4 19.2 18.9 18.3 18.1 17.8 16.7
15.1 13.4 10.0 5.7 0.7 0];
I0130=[0 0.07 0.17 0.25 0.33 0.37 0.43 0.50 0.57 0.63 0.68 0.74 0.81
0.87 0.89 0.895 0.896 0.898];
plot(V0130,I0130,'m');
grid on;
p0130=times(V0130,I0130)
%day4 ,8thjune.
%temp=38 poly
V0200=[20.7 20.5 20.3 20.1 19.9 19.7 19.6 19.3 18.9 18.6 18.2 17.7
17.0 16.1 14.8 12.6 9.0 5.2 0.9 0];
I0200=[0 0.07 0.21 0.29 0.37 0.40 0.48 0.59 0.64 0.72 0.78 0.85 0.90
0.94 0.96 0.98 0.99 0.991 0.993 0.995];
plot(V0200,I0200,'c');
grid on;
p0200=times(V0200,I0200)
%june 19th,poly, temp=39
v1130=[20.9 20.7 20.5 20.3 20.1 20.0 19.9 19.7 19.4 19.1 18.9 18.6
18.3 17.7 16.9 16.5 15.8 15.1 14.5 13.6 12.4 11.2 10.0 8.4 3.6 2.1
0.6 0]
i1130=[0 0.07 0.14 0.19 0.31 0.39 0.41 0.51 0.57 0.61 0.66 0.70 0.76
0.82 0.91 0.97 1.05 1.08 1.11 1.16 1.19 1.23 1.27 1.30 1.32 1.33
1.34 1.35]
plot(v1130,i1130,'g');hold on;
grid on
p1130=times(v1130,i1130)
%19th june, poly,temp=41
v1200=[20.6 20.3 20.1 19.9 19.7 19.6 19.5 19.4 19.2 19.0 18.9 18.6
18.3 18.0 17.6 17.2 16.5 15.1 13.9 11.8 9.3 6.8 3.8 0.6 0]
i1200=[0 0.07 0.19 0.28 0.37 0.40 0.45 0.51 0.52 0.62 0.66 0.70 0.77
0.84 0.90 0.97 1.04 1.12 1.17 1.25 1.27 1.28 1.29 1.30 1.31]
plot(v1200,i1200,'r');
grid on
p1200=times(v1200,i1200)
%19th june, poly,temp=43
v1230=[20.7 20.3 20.2 20.0 19.9 19.8 19.7 19.6 19.5 19.4 19.3 19.1
18.9 18.7 18.5 18.1 17.5 16.7 14.2 10.9 5.4 0.6 0]
i1230=[0 0.09 0.15 0.21 0.29 0.37 0.39 0.43 0.46 0.50 0.54 0.59 0.65
0.72 0.80 0.89 1.00 1.13 1.28 1.35 1.371 1.372 1.375]
plot(v1230,i1230,'y');
grid on
p1230=times(v1230,i1230)
P a g e | 98
%19th june, poly,temp=40
v0100=[20.1 19.7 19.5 19.4 19.3 19.1 19.0 18.9 18.8 18.6 18.2 18.1
17.8 17.7 17.3 16.9 16.5 15.9 14.6 12.0 8.4 5.3 0.6 0]
i0100=[0 0.07 0.14 0.20 0.25 0.32 0.36 0.42 0.46 0.51 0.62 0.65 0.70
0.74 0.79 0.84 0.90 0.96 1.04 1.11 1.14 1.15 1.16 1.17]
plot(v0100,i0100,'b');
grid on
p0100=times(v0100,i0100)
%19th june, poly,temp=36
v0130=[20.9 20.7 20.5 20.3 20.0 19.9 19.7 19.4 19.2 19.0 18.8 18.6
18.3 17.9 17.4 16.4 15.4 14.1 12.3 9.4 6.1 0.8 0]
i0130=[0 0.07 0.19 0.26 0.38 0.42 0.50 0.55 0.59 0.65 0.69 0.74 0.78
0.85 0.90 0.98 1.03 1.05 1.06 1.08 1.09 1.092 1.095]
plot(v0130,i0130,'m');
grid on
p0130=times(v0130,i0130)
%19th june,poly, temp=42,slight cloud interruption.
v0200=[20.4 20.2 19.8 19.6 19.4 19.2 19.0 18.7 18.3 17.9 16.9 16.4
15.6 14.8 13.6 12.4 10.9 8.4 4.1 0.8 0];
i0200=[0 0.07 0.19 0.27 0.33 0.40 0.46 0.52 0.59 0.63 0.70 0.76 0.80
0.87 0.94 0.99 1.01 1.03 1.035 1.04 1.042];
plot(v0200,i0200,'c');
grid on
p0200=times(v0200,i0200)
%19th june,poly, temp=36
v0230=[20.8 20.7 20.4 20.2 20.0 19.8 19.6 19.2 19.0 18.8 18.4 17.9
17.4 16.9 16.0 14.3 11.2 6.20 0.80 0]
i0230=[0 0.07 0.15 0.23 0.29 0.37 0.45 0.51 0.58 0.62 0.69 0.75 0.81
0.85 0.91 0.96 0.98 0.99 0.995 0.996]
plot(v0230,i0230,'k');
grid on
p0230=times(v0230,i0230)
%19th june,poly, temp=35
v0300=[20.6 20.2 19.9 19.7 19.4 19.1 18.8 18.6 18.3 17.3 16.4 15.6
13.9 12.5 8.3 6.1 0.3 0]
i0300=[0 0.09 0.19 0.27 0.31 0.37 0.41 0.45 0.50 0.56 0.62 0.65 0.68
0.70 0.71 0.720 0.725 0.730]
plot(v0300,i0300);
grid on
p0300=times(v0300,i0300)
%day 7,poly, temp=44.
v1130=[21.0 20.5 20.3 20.1 19.9 19.7 19.5 19.3 19.1 18.8 18.6 18.3
18.1 17.6 16.9 15.7 14.4 10.0 3.6 1.9 0.5 0]
i1130=[0 0.07 0.17 0.23 0.32 0.37 0.46 0.52 0.63 0.69 0.76 0.85 0.90
0.94 0.98 1.03 1.1 1.2 1.30 1.32 1.35 1.36]
plot(v1130,i1130,'g');grid on;hold on;
p1130=times(v1130,i1130)

P a g e | 99
%day 7,poly, temp=43.
v1200=[20.9 20.6 20.4 20.1 19.9 19.7 19.5 19.3 18.9 18.7 18.5 18.1
17.8 17.2 16.7 15.7 14.3 11.9 8.3 3.5 0.6 0]
i1200=[0 0.07 0.19 0.26 0.35 0.43 0.51 0.57 0.63 0.68 0.72 0.79 0.85
0.92 0.97 1.04 1.09 1.13 1.15 1.160 1.162 1.163]
plot(v1200,i1200,'r');grid on
p1200=times(v1200,i1200)
%day 7,poly, temp=48.
v1230=[20.1 20.0 19.8 19.6 19.4 19.2 19.0 18.8 18.6 18.3 17.9 17.5
17.0 16.6 15.4 14.7 13.6 11.6 8.0 5.1 0.8 0]
i1230=[0 0.07 0.12 0.21 0.28 0.36 0.40 0.46 0.54 0.61 0.71 0.79 0.87
0.92 1.02 1.06 1.10 1.12 1.13 1.14 1.15 1.16 ]
plot(v1230,i1230,'y');grid on
p1230=times(v1230,i1230)
%day 7,poly, temp=48.
v0100=[19.5 19.4 19.1 18.9 18.7 18.5 18.3 18.1 17.9 17.7 17.4 17.1
16.8 16.2 15.7 15.2 14.5 13.7 12.7 11.0 9.7 7.0 5.6 2.1 0.8 0]
i0100=[0 0.07 0.18 0.24 0.29 0.37 0.44 0.51 0.56 0.62 0.69 0.77 0.81
0.90 0.96 1.01 1.08 1.11 1.17 1.2 1.21 1.22 1.23 1.240 1.242 1.243]
plot(v0100,i0100,'b');grid on
p0100=times(v0100,i0100)
%day 7, poly, temp=50
v0130=[19.4 19.1 18.9 18.7 18.4 18.1 17.9 17.7 17.3 17.0 16.7 16.5
15.9 14.7 13.3 12.3 10.9 8.7 7.5 5.6 3.0 0.3 0]
i0130=[0 0.06 0.09 0.11 0.17 0.21 0.25 0.29 0.33 0.39 0.43 0.48 0.53
0.58 0.61 0.64 0.66 0.68 0.69 0.70 0.710 0.715 0.72]
plot(v0130,i0130,'m');grid on
p0130=times(v0130,i0130)
%21st june,poly, temp=42,slight cloud interruption.
v0200=[20.4 20.2 19.8 19.6 19.4 19.2 19.0 18.7 18.3 17.9 16.9 16.4
15.6 14.8 13.6 12.4 10.9 8.4 4.1 0.8 0];
i0200=[0 0.07 0.19 0.27 0.33 0.40 0.46 0.52 0.59 0.63 0.70 0.76 0.80
0.87 0.94 0.99 1.01 1.03 1.035 1.04 1.042];
plot(v0200,i0200,'c');
grid on
p0200=times(v0200,i0200)
%21st june,poly, temp=36
v0230=[20.8 20.7 20.4 20.2 20.0 19.8 19.6 19.2 19.0 18.8 18.4 17.9
17.4 16.9 16.0 14.3 11.2 6.20 0.80 0]
i0230=[0 0.07 0.15 0.23 0.29 0.37 0.45 0.51 0.58 0.62 0.69 0.75 0.81
0.85 0.91 0.96 0.98 0.99 0.995 0.996]
plot(v0230,i0230,'k');
grid on
p0230=times(v0230,i0230)
P a g e | 100
%day 7, poly, temp=42
v0300=[19.9 19.7 19.5 19.3 19.1 18.9 18.7 18.5 18.3 18.0 17.8 17.3
17.0 16.6 16.2 15.8 14.4 13.5 12.5 11.4 10.4 7.7 4.7 0.5 0]
i0300=[0 0.07 0.12 0.18 0.25 0.31 0.35 0.41 0.45 0.49 0.54 0.59 0.63
0.67 0.71 0.74 0.76 0.78 0.79 0.8 0.81 0.820 0.825 0.830 0.832]
plot(v0300,i0300);grid on
p0300=times(v0300,i0300)
Voc=[20.0 19.7 20.6 20.9 19.9 20.1];
t=[11.30 12.00 12.30 13.00 14.00 15.00];
plot(t,Voc);grid on;
Voc4=[20.9 20.9 20.7 20.3 20.5 20.7]
t=[11.00 12.00 12.30 13.00 13.30 14.00]
plot(t,Voc4);grid on;
t=[11.30 12.00 12.30 13.00 13.30 14.00 14.30 15.00]
Vsc19=[20.9 20.6 20.7 20.1 20.9 20.4 20.8 20.6]
plot(t,Vsc19)
t=[11.30 12.00 12.30 13.00 14.00 15.00]
Pmax=[14.8 11.5 14.70 14.79 10.43 10.30]
plot(t,Pmax);grid on
t=[11.00 12.00 12.30 13.00 13.30 14.00]
Pmax4=[16.9 15.1 13.4 11.1 12.4 15.3]
plot(t,Pmax4);grid on
t=[11.30 12.00 12.30 13.00 14.00 15.00]
Pmax=[14.8 11.5 14.70 14.79 10.43 10.30]
plot(t,Pmax);grid on
t=[11.30 12.00 12.30 13.00 13.30 14.00 14.30 15.00]
Pmax19=[16.6 17.2 18.9 15.3 16.1 12.9 14.6 10.2]
plot(t,Pmax19)
t=[11.30 12.00 12.30 13.00 14.00 15.00]
Isc=[1.055 0.9 1.03 1.015 0.744 0.704]
plot(t,Isc);grid on
P a g e | 101
t=[11.00 12.00 12.30 13.00 13.30 14.00]
Isc4=[1.19 0.995 0.935 0.82 0.898 0.995]
plot(t,Isc4);grid on;
% 11th, poly, temp=39
v1130=[21.9 21.7 21.4 21.2 21.0 20.8 20.7 20.4 20.1 19.3 18.0 16.1
13.3 10.1 7.9 5.3 2.2 1.1 0.1 0]
i1130=[0 0.07 0.17 0.26 0.31 0.38 0.46 0.54 0.62 0.78 0.90 0.98
1.01 1.02 1.03 1.035 1.04 1.045 1.05 1.052]
plot(v1130,i1130,'g');grid on;hold on
p1130=times(v1130,i1130)
%11th,poly,temp=38
v1200=[22.6 22.4 22.3 22.2 22.1 21.9 21.8 21.7 21.5 21.2 20.8 20.5
20.3 20.1 19.6 19.0 18.2 16.6 14.8 11.8 8.6 4.3 1.9 0.1 0]
i1200=[0 0.08 0.15 0.20 0.26 0.31 0.39 0.45 0.52 0.60 0.68 0.78 0.86
0.96 1.05 1.15 1.26 1.34 1.39 1.41 1.44 1.45 1.46 1.47 1.48]
plot(v1200,i1200,'r');grid on
p1200=times(v1200,i1200)
%11th, poly,temp=40
v1230=[21.5 21.2 21.1 20.7 20.3 20.1 20.0 19.7 19.5 19.2 18.8 17.1
13.7 10.3 3.1 0.9 0]
i1230=[0 0.12 0.18 0.38 0.50 0.57 0.63 0.71 0.78 0.83 0.91 1.11 1.32
1.38 1.410 1.413 1.415]
plot(v1230,i1230,'y');grid on
p1230=times(v1230,i1230)
%11th, poly,temp=38
v0230=[20.3 20.1 19.8 19.6 19.3 19.2 19.0 18.8 18.7 18.4 18.2 17.7
17.0 16.2 15.3 13.9 12.5 9.7 5.5 0.6 0]
i0230=[0 0.06 0.18 0.26 0.36 0.39 0.44 0.48 0.51 0.56 0.61 0.68 0.75
0.79 0.85 0.89 0.90 0.92 0.93 0.935 0.94]
plot(v0230,i0230,'b');grid on
p0230=times(v0230,i0230)
%11th, mono,temp=45
v0300=[20.0 19.7 19.4 18.8 18.6 18.1 17.8 16.9 16.1 14.3 13.4 11.8
9.3 4.4 0.4 0]
i0300=[0 0.06 0.17 0.33 0.40 0.46 0.53 0.63 0.68 0.73 0.77 .80 0.82
0.83 0.84 0.841]
p0300=times(v0300,i0300)
plot(v0300,i0300,'m');grid on
t=[11.30 12.00 12.30 13.00 13.30 14.00 14.30 15.00]
Isc19=[1.35 1.31 1.375 1.17 1.095 1.042 0.996 0.730]
plot(t,Isc19)

P a g e | 102
v=[19.4 19.2 19.0 18.9 18.8 18.7 18.5 18.3 18.1 18.0 17.8 17.5 17.4
17.1 16.8 16.5 16.1 15.5 15.0 14.4 13.9 12.9 11.3 9.6 5.7 1.0 0.7 0]
i=[0 0.06 0.10 0.15 0.20 0.25 0.30 0.35 0.40 0.45 0.50 0.55 0.60
0.65 0.70 0.75 0.81 0.85 0.89 0.91 0.93 0.94 0.95 0.96 0.97 0.98
0.981 0.982]
plot(v,i,'g');grid on;hold on;
p=times(v,i)
vp2=[19.63 19.6 19.3 19.0 18.7 18.6 18.4 18.2 18.0 17.7 17.4 17.1
16.8 15.7 15.2 14.8 14.0 13.8 13.2 12.6 11.6 7.7 3.33 0.8 0]
ip2=[0 0.04 0.10 0.20 0.30 0.35 0.40 0.45 0.51 0.57 0.60 0.66 0.74
0.82 0.84 0.85 0.88 0.89 0.92 0.95 0.99 1.00 1.01 1.015 1.02]
plot(vp2,ip2,'r');grid on;
p2=times(vp2,ip2)
vp3=[19.3 19.1 19.0 18.8 18.6 18.5 18.3 18.1 17.9 17.7 17.5 17.4
17.1 16.7 16.3 15.5 15.1 14.8 13.8 13.1 12.3 10.0 8.1 3.2 0.6 0]
ip3=[0 0.07 0.10 0.20 0.25 0.30 0.35 0.40 0.45 0.51 0.56 0.60 0.65
0.70 0.75 0.81 0.85 0.87 0.90 0.92 0.94 0.95 0.964 0.968 0.970
0.972]
plot(vp3,ip3,'y'),grid on;
p3=times(vp3,ip3)

P a g e | 103
Comparing Energy:
%day 7,mono, temp=45.
v1200=[20.3 20.1 19.9 19.7 19.5 19.3 19.1 18.9 18.7 18.5 18.3 18.0
17.7 17.3 16.9 16.3 15.7 14.9 13.5 10.3 6.7 3.7 0.5 0]
i1200=[0 0.07 0.10 0.18 0.23 0.29 0.34 0.39 0.43 0.47 0.52 0.57 0.63
0.68 0.74 0.80 0.84 0.88 0.90 0.91 0.92 0.93 0.94 0.95]
plot(v1200,i1200,'r');grid on
p1200=times(v1200,i1200)
%day 7,mono, temp=56.
v1230=[19.3 19.1 18.9 18.7 18.5 18.3 18.1 17.8 17.6 17.4 17.0 16.7
16.0 15.6 15.1 14.4 13.5 11.9 10.8 8.4 7.5 3.5 0.6 0]
i1230=[0 0.07 0.11 0.18 0.24 0.28 0.34 0.40 0.45 0.50 0.55 0.60 0.67
0.73 0.77 0.82 0.86 0.89 0.91 0.92 0.930 0.932 0.933 0.935]
plot(v1230,i1230,'b');grid on
p1230=times(v1230,i1230)
%day 7,mono, temp=49.
v0100=[19.8 19.7 19.4 19.0 18.6 18.4 18.2 18.0 17.6 17.4 16.9 15.7
14.4 13.3 12.6 10.8 8.8 6.3 4.0 2.4 0.5 0]
i0100=[0 0.07 0.12 0.17 0.24 0.29 0.36 0.42 0.48 0.51 0.54 0.61 0.67
0.74 0.79 0.83 0.88 0.89 0.90 0.91 0.920 0.922]
plot(v0100,i0100,'y');grid on
p0100=times(v0100,i0100)
%day 7,mono, temp=49.
v0130=[18.9 18.6 18.4 18.2 17.5 17.0 16.5 15.9 15.0 14.5 14.0 13.5
12.0 11.1 10.1 9.0 7.1 5.1 4.3 2.0 0.5 0]
i0130=[0 0.06 0.09 0.10 0.16 0.20 0.22 0.25 0.28 0.30 0.33 0.35 0.37
0.38 0.39 0.41 0.43 0.46 0.48 0.510 0.515 0.52]
plot(v0130,i0130,'c');grid on
p0130=times(v0130,i0130)
%day 6,mono,temp=38
v1200=[20.6 20.4 20.3 20.1 20.0 19.9 19.8 19.6 19.4 19.0 18.6 17.9
17.2 16.6 15.9 14.1 10.6 5.7 1.0 0]
i1200=[0 0.07 0.10 0.17 0.23 0.26 0.32 0.36 0.44 0.52 0.59 0.66 0.75
0.81 0.90 0.99 1.02 1.03 1.035 1.04]
p1200=times(v1200,i1200)
plot(v1200,i1200);
grid on
%day 6,mono,temp=46
v1230=[19.9 19.6 19.3 19.1 18.9 18.7 18.5 18.2 18.0 17.7 17.4 17.1
16.7 16.3 15.5 15.0 14.0 12.8 11.1 9.3 7.4 4.8 3.0 0.6 0]
i1230=[0 0.09 0.14 0.20 0.29 0.35 0.43 0.49 0.53 0.60 0.65 0.70 0.75
0.81 0.87 0.93 0.98 1.02 1.06 1.08 1.090 1.092 1.093 1.094 1.095]
p1230=times(v1230,i1230)
plot(v1230,i1230)

P a g e | 104
%day 6,mono,temp=41
v0100=[20.2 19.8 19.6 19.4 19.2 18.9 18.7 18.5 18.3 18.0 17.6 17.3
16.7 16.2 15.0 13.8 12.6 11.8 10.9 9.7 7.7 6.4 4.3 2.8 0.7 0]
i0100=[0 0.11 0.17 0.22 0.27 0.36 0.39 0.42 0.48 0.51 0.58 0.63 0.68
0.73 0.79 0.83 0.86 0.87 0.88 0.890 0.892 0.893 0.894 0.895 0.897
0.9]
p0100=times(v0100,i0100)
plot(v0100,i0100)
%day 6,mono,temp=39
v0130=[20.1 19.9 19.7 19.5 19.3 19.1 18.9 18.7 18.3 18.0 17.6 16.8
16.4 15.8 14.8 13.9 13.0 11.7 8.7 6.2 2.6 0.5 0]
i0130=[0 0.07 0.11 0.18 0.22 0.29 0.33 0.38 0.45 0.52 0.59 0.67 0.70
0.74 0.77 0.80 0.82 0.84 0.860 0.862 0.863 0.864 0.865]
p0130=times(v0130,i0130)
plot(v0130,i0130)
%day 6,mono,temp=38
v1200=[20.6 20.4 20.3 20.1 20.0 19.9 19.8 19.6 19.4 19.0 18.6 17.9
17.2 16.6 15.9 14.1 10.6 5.7 1.0 0]
i1200=[0 0.07 0.10 0.17 0.23 0.26 0.32 0.36 0.44 0.52 0.59 0.66 0.75
0.81 0.90 0.99 1.02 1.03 1.035 1.04]
p1200=times(v1200,i1200)
plot(v1200,i1200);
grid on
%day 6,mono,temp=46
v1230=[19.9 19.6 19.3 19.1 18.9 18.7 18.5 18.2 18.0 17.7 17.4 17.1
16.7 16.3 15.5 15.0 14.0 12.8 11.1 9.3 7.4 4.8 3.0 0.6 0]
i1230=[0 0.09 0.14 0.20 0.29 0.35 0.43 0.49 0.53 0.60 0.65 0.70 0.75
0.81 0.87 0.93 0.98 1.02 1.06 1.08 1.090 1.092 1.093 1.094 1.095]
p1230=times(v1230,i1230)
plot(v1230,i1230)
%day 6,mono,temp=41
v0100=[20.2 19.8 19.6 19.4 19.2 18.9 18.7 18.5 18.3 18.0 17.6 17.3
16.7 16.2 15.0 13.8 12.6 11.8 10.9 9.7 7.7 6.4 4.3 2.8 0.7 0]
i0100=[0 0.11 0.17 0.22 0.27 0.36 0.39 0.42 0.48 0.51 0.58 0.63 0.68
0.73 0.79 0.83 0.86 0.87 0.88 0.890 0.892 0.893 0.894 0.895 0.897
0.9]
p0100=times(v0100,i0100)
plot(v0100,i0100)
%day 6,mono,temp=39
v0130=[20.1 19.9 19.7 19.5 19.3 19.1 18.9 18.7 18.3 18.0 17.6 16.8
16.4 15.8 14.8 13.9 13.0 11.7 8.7 6.2 2.6 0.5 0]
i0130=[0 0.07 0.11 0.18 0.22 0.29 0.33 0.38 0.45 0.52 0.59 0.67 0.70
0.74 0.77 0.80 0.82 0.84 0.860 0.862 0.863 0.864 0.865]
p0130=times(v0130,i0130)
plot(v0130,i0130)

P a g e | 105
%19th june, poly,temp=41
v1200=[20.6 20.3 20.1 19.9 19.7 19.6 19.5 19.4 19.2 19.0 18.9 18.6
18.3 18.0 17.6 17.2 16.5 15.1 13.9 11.8 9.3 6.8 3.8 0.6 0]
i1200=[0 0.07 0.19 0.28 0.37 0.40 0.45 0.51 0.52 0.62 0.66 0.70 0.77
0.84 0.90 0.97 1.04 1.12 1.17 1.25 1.27 1.28 1.29 1.30 1.31]
plot(v1200,i1200,'r');
grid on
p1200=times(v1200,i1200)
%19th june, poly,temp=43
v1230=[20.7 20.3 20.2 20.0 19.9 19.8 19.7 19.6 19.5 19.4 19.3 19.1
18.9 18.7 18.5 18.1 17.5 16.7 14.2 10.9 5.4 0.6 0]
i1230=[0 0.09 0.15 0.21 0.29 0.37 0.39 0.43 0.46 0.50 0.54 0.59 0.65
0.72 0.80 0.89 1.00 1.13 1.28 1.35 1.371 1.372 1.375]
plot(v1230,i1230,'y');
grid on
p1230=times(v1230,i1230)
%19th june, poly,temp=40
v0100=[20.1 19.7 19.5 19.4 19.3 19.1 19.0 18.9 18.8 18.6 18.2 18.1
17.8 17.7 17.3 16.9 16.5 15.9 14.6 12.0 8.4 5.3 0.6 0]
i0100=[0 0.07 0.14 0.20 0.25 0.32 0.36 0.42 0.46 0.51 0.62 0.65 0.70
0.74 0.79 0.84 0.90 0.96 1.04 1.11 1.14 1.15 1.16 1.17]
plot(v0100,i0100,'b');
grid on
p0100=times(v0100,i0100)
%19th june, poly,temp=36
v0130=[20.9 20.7 20.5 20.3 20.0 19.9 19.7 19.4 19.2 19.0 18.8 18.6
18.3 17.9 17.4 16.4 15.4 14.1 12.3 9.4 6.1 0.8 0]
i0130=[0 0.07 0.19 0.26 0.38 0.42 0.50 0.55 0.59 0.65 0.69 0.74 0.78
0.85 0.90 0.98 1.03 1.05 1.06 1.08 1.09 1.092 1.095]
plot(v0130,i0130,'m');
grid on
p0130=times(v0130,i0130)
%day 7,poly, temp=43.
v1200=[20.9 20.6 20.4 20.1 19.9 19.7 19.5 19.3 18.9 18.7 18.5 18.1
17.8 17.2 16.7 15.7 14.3 11.9 8.3 3.5 0.6 0]
i1200=[0 0.07 0.19 0.26 0.35 0.43 0.51 0.57 0.63 0.68 0.72 0.79 0.85
0.92 0.97 1.04 1.09 1.13 1.15 1.160 1.162 1.163]
plot(v1200,i1200,'r');grid on
p1200=times(v1200,i1200)
%day 7,poly, temp=48.
v1230=[20.1 20.0 19.8 19.6 19.4 19.2 19.0 18.8 18.6 18.3 17.9 17.5
17.0 16.6 15.4 14.7 13.6 11.6 8.0 5.1 0.8 0]
i1230=[0 0.07 0.12 0.21 0.28 0.36 0.40 0.46 0.54 0.61 0.71 0.79 0.87
0.92 1.02 1.06 1.10 1.12 1.13 1.14 1.15 1.16 ]
plot(v1230,i1230,'y');grid on
p1230=times(v1230,i1230)

P a g e | 106
%day 7,poly, temp=48.
v0100=[19.5 19.4 19.1 18.9 18.7 18.5 18.3 18.1 17.9 17.7 17.4 17.1
16.8 16.2 15.7 15.2 14.5 13.7 12.7 11.0 9.7 7.0 5.6 2.1 0.8 0]
i0100=[0 0.07 0.18 0.24 0.29 0.37 0.44 0.51 0.56 0.62 0.69 0.77 0.81
0.90 0.96 1.01 1.08 1.11 1.17 1.2 1.21 1.22 1.23 1.240 1.242 1.243]
plot(v0100,i0100,'b');grid on
p0100=times(v0100,i0100)
%day 7, poly, temp=50
v0130=[19.4 19.1 18.9 18.7 18.4 18.1 17.9 17.7 17.3 17.0 16.7 16.5
15.9 14.7 13.3 12.3 10.9 8.7 7.5 5.6 3.0 0.3 0]
i0130=[0 0.06 0.09 0.11 0.17 0.21 0.25 0.29 0.33 0.39 0.43 0.48 0.53
0.58 0.61 0.64 0.66 0.68 0.69 0.70 0.710 0.715 0.72]
plot(v0130,i0130,'m');grid on
p0130=times(v0130,i0130)


![arXiv:1804.04369v1 [cond-mat.mtrl-sci] 12 Apr 2018 · Necking instabilities, in which tensile (extensional) deformation localizes into a small spatial re- ... crystalline, polycrystalline](https://static.documents.pub/doc/80x56/5b3ee53a7f8b9a91078b72b5/arxiv180404369v1-cond-matmtrl-sci-12-apr-2018-necking-instabilities-in.jpg)


