
S1
SUPPORTING INFORMATION FOR:
A fluorescent light up probe as an inhibitor for
intracellular -tryptase
Qi Wang,‡c Xiuyin Shi,‡d Xiaoxia Zhu,c Martin Ehlersb, Junchen Wu*a and Carsten Schmuck*b
aKey Lab for Advanced Materials and Institute of Fine Chemicals, East China University of
Science and Technology, 200237, China. Fax: (+86) 21 6425 2258; Tel: (+86) 21 6425 3674;
E-mail: [email protected]
bInstitute for Organic Chemistry, University of Duisburg-Essen, Universitatsstrasse 7. Fax:
(+49) 201 183 4259; Tel: (+49) 201 183 3097; E-mail: [email protected]
cCollege of Public Health, Nantong University, 9 Seyuan road, Nantong, 226019, China.
dMedical Laboratory Center, Affiliated Hospital of Nantong University, Nantong, 226019,
China.
‡These authors contributed equally to this work.
Contents
1. General Synthetic Information: .............................................................................................. 2
2. General Procedures for Peptide Synthesis: ............................................................................ 2
3. Synthesis of Inhibitor 1: ......................................................................................................... 3
4. Buffer solution ........................................................................................................................ 5
5. Fluorescence experiments: ..................................................................................................... 6
6. Test for reversibility of enzyme inhibition: ............................................................................ 7
7. Determination of Km for rhSkin β-Tryptase / Tos-Gly-Pro-Arg-AMC: ................................. 8
8.0 Determination of IC50 ........................................................................................................... 9
9.0 Molecular Docking ............................................................................................................. 10
10.0 Cell Experiments .............................................................................................................. 10
Electronic Supplementary Material (ESI) for ChemComm.This journal is © The Royal Society of Chemistry 2014

S2
1. General Synthetic Information:
All solvents were dried and distilled under argon before use. Pyrene-2-carboxylic acid and
rhSkin β-Tryptase /Tos-Gly-Pro-Arg-AMC and Trypsin/Z-Phe-Arg-AMC were obtained from
Aldrich. Trisisopropylsilane (99 %), Fmoc-protected amino acids and PyBOP (95%) were
supplied from Sinopharm Chemical Reagent Co., Ltd. (Shanghai). All melting points were
measured with a Bruker Melting-Point B-450 apparatus with open end glass capillary tube.
The melting points are not corrected. NMR-spectra were recorded at room temperature with a
Bruker DRX 500 spectrometer. All IR spectra were measured on a Jasco FT/IR-430
spectrometer. All mass spectra were recorded with a Bruker BioTOF III spectrometer.
Analytical “High Performance Liquid Chromatography” (HPLC) was done with the following
parameters: Dionex HPLC system: P680 pump, ASI-100 automated sample injector, UVD-
340U UV detector, UltiMate 3000 Column Compartment; Software: Dionex Chromeleon 6.80;
Column: YMC-Pack ODS-A, reversed phase RP18, 150 mm length, 3.0 mm diameter, 5 μm,
12 nm; type: AA12S05-1503QT.
2. General Procedures for Peptide Synthesis:
Fmoc Removal: Fmoc protecting groups were cleaved by treatment with 20% piperidine in
DMF (2×6 mL, 5 min each) under microwave irradiation (20 W, 50±5°C, 5 min). The resin
was washed with DMF (3×8 mL), DCM (3×8 mL) and DMF (3×8 mL) to remove excess
piperidine (each wash ca. 5 min). A positive Kaiser test confirmed the cleavage of the Fmoc
group and the formation of a free amino function in each case.
Standard Fmoc solid phase peptide synthesis techniques (SPPS): Each peptide was
synthesized on Fmoc Rink amide resin (loading 0.84 mmol/g). The reactions were conducted
under microwave irradiation (20 W, 60±5°C, 20 min), after which the resin was washed with
DMF (3×8 mL), DCM (3×8 mL) and DMF (3×8 mL) to remove excess reagents (each wash
ca. 5 min). A negative Kaiser test confirmed the attachment of the protected amino acid.
Cleavage form the Resin: Cleavage of the product from the resin was achieved by treatment
with a mixture of TFA/H2O/triisopropylsilane (95:2.5:2.5) for 3 h. The yellow cleavage
mixture was collected by filtration and the resin was washed twice with pure TFA (6 mL).
The filtrates were combined and concentrated under vacuum to yield an oily residue. The
peptide was precipitated by adding dry diethyl ether to the oil. The precipitate was isolated by
centrifugation. The crude precipitate was dissolved in water (40 mL), acidified with
hydrochloric acid (0.1 N, 5 mL) and lyophilized, yielding the corresponding HCl salts of the
peptides as yellow solids. This step was repeated three times.
S3
The purity of the peptides was checked by HPLC on a RP18-column using water/MeOH (with
0.05% TFA) as the eluent. If necessary, crude peptides were purified by RP18-MPLC using
the same conditions.
The following Fmoc-based amino acids were used: Fmoc-Lys(Boc)-OH, Fmoc-Lys(Fmoc)-
OH, Fmoc-Trp(Boc)-OH, Fmoc-Arg(pbf)-OH.
3. Synthesis of Inhibitor 1:
Rink amide resin (200 mg, 84 μmol/g, 168 μmol, 1 equiv) was weighed into plastic peptide
synthesis vessel and allowed to swell in DCM/DMF (5.0/5.0 mL) for 1.5 h. Then, the Fmoc
protection group was removed by agitation with piperidine (20%) in DMF under microwave
irradiation. After an intensive wash cycle with DMF the following four amino acids and
pyrene-2-carboxylic acid were attached under microwave irradiation following the general
procedure: Fmoc-Lys(Fmoc)-OH (0.504 mmol, 3 equiv), PyBOP (0.504 mmol, 3 equiv) and
DIPEA (1.01 mmol, 6 equiv); and pyrene-2-carboxylic acid (1.01 mmol, 6 equiv), PyBOP
(1.01 mmol, 6 equiv) and DIPEA (2.02 mmol, 12 equiv) in DMF (8.0 mL), respectively. The
product was transferred into a glass peptide synthesis vessel and was cleaved from the solid
support according to the general procedure.
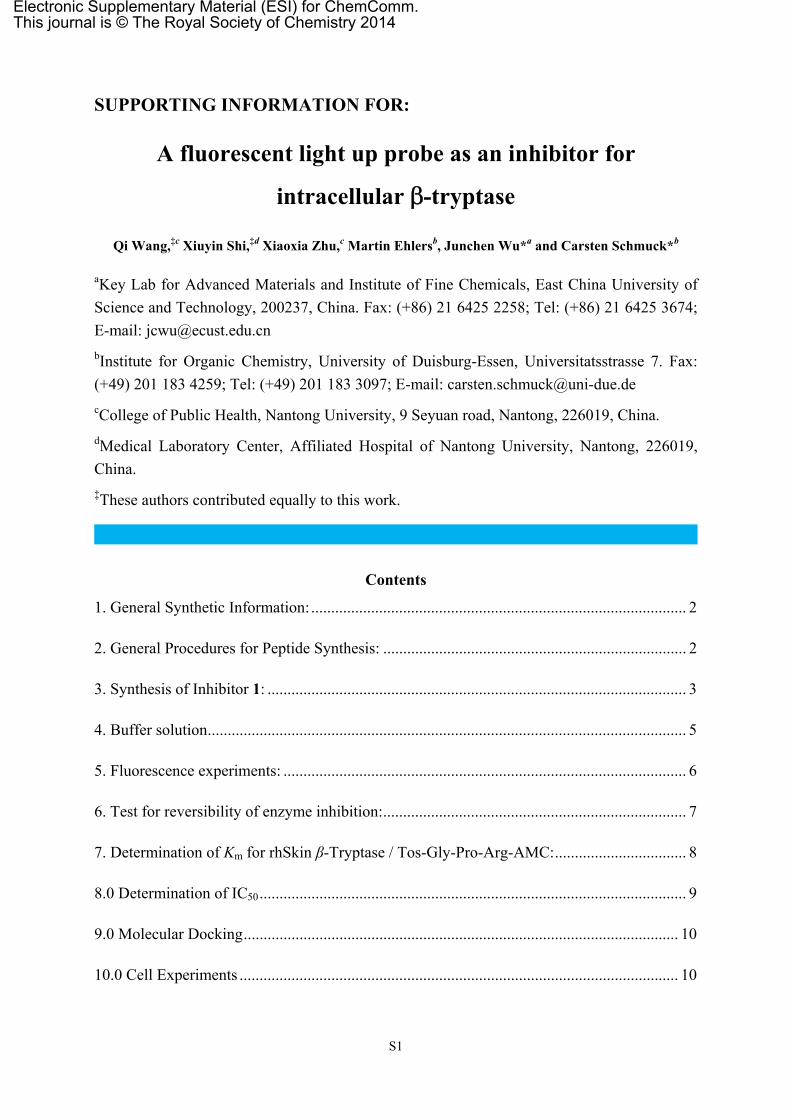
Peptide 1
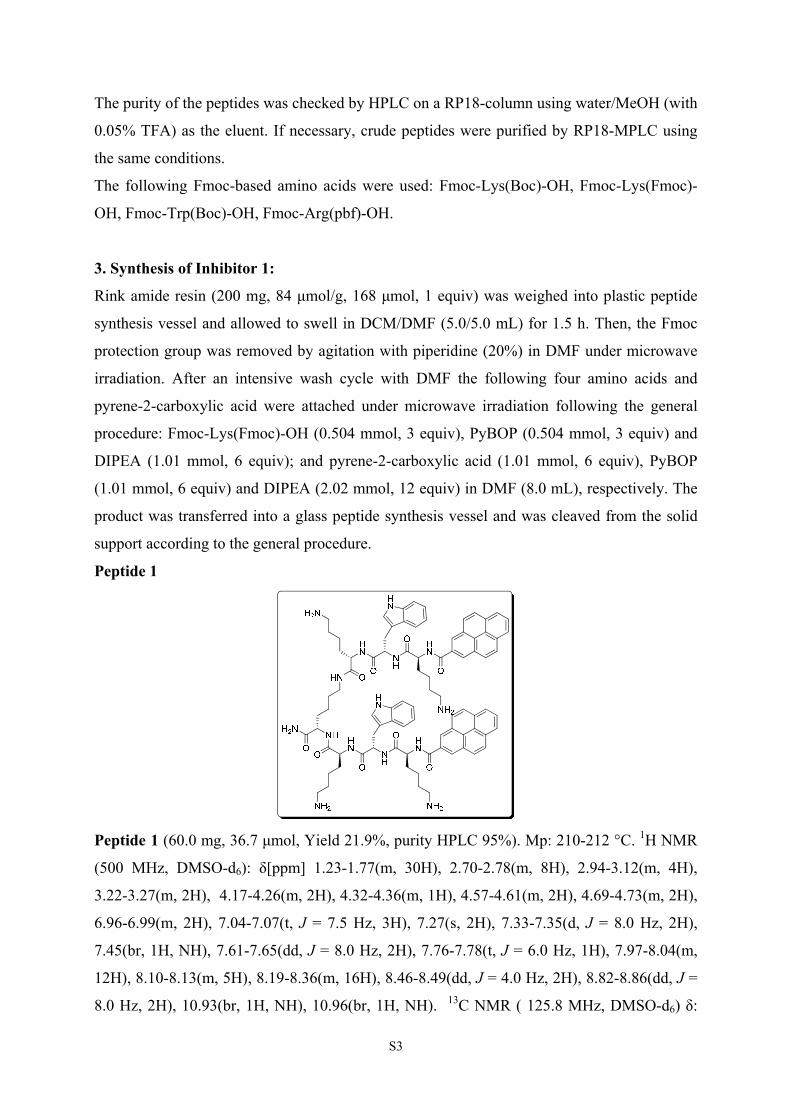
Peptide 1 (60.0 mg, 36.7 μmol, Yield 21.9%, purity HPLC 95%). Mp: 210-212 °C. 1H NMR
(500 MHz, DMSO-d6): δ[ppm] 1.23-1.77(m, 30H), 2.70-2.78(m, 8H), 2.94-3.12(m, 4H),
3.22-3.27(m, 2H), 4.17-4.26(m, 2H), 4.32-4.36(m, 1H), 4.57-4.61(m, 2H), 4.69-4.73(m, 2H),
6.96-6.99(m, 2H), 7.04-7.07(t, J = 7.5 Hz, 3H), 7.27(s, 2H), 7.33-7.35(d, J = 8.0 Hz, 2H),
7.45(br, 1H, NH), 7.61-7.65(dd, J = 8.0 Hz, 2H), 7.76-7.78(t, J = 6.0 Hz, 1H), 7.97-8.04(m,
12H), 8.10-8.13(m, 5H), 8.19-8.36(m, 16H), 8.46-8.49(dd, J = 4.0 Hz, 2H), 8.82-8.86(dd, J =
8.0 Hz, 2H), 10.93(br, 1H, NH), 10.96(br, 1H, NH). 13C NMR ( 125.8 MHz, DMSO-d6) δ:
S4
22.0, 22.2, 22.6, 22.7, 26.5, 26.6, 27.5, 28.8, 31.0, 31.3, 31.6, 31.7, 38.5, 38.6, 52.4, 52.5, 52.7,
53.4, 53.8, 109.8, 109.9, 111.3, 118.2, 118.4, 118.5, 120.8, 123.6, 123.7. 124.3, 124.8, 125.4,
125.5, 125.6, 125.8, 126.6, 127.2, 127.4, 127.8, 128.1, 128.3, 130.2, 130.7, 131.5, 131.6,
136.0, 136.1, 169.1, 171.0, 171.2, 171.5, 171.8, 173.7. FT-IR (pure):ν [cm-1] 3269, 3050,
2933, 1637, 1518, 1236, 849, 742, 645, 621. HRMS-ESI (m/z): calcd for C86H99N15O9
1486.7823, found[M+H] +, 1486.7805.
0,0 5,0 10,0 15,0 20,0 25,0 30,0 35,0 40,0-100
0
125
250
375
500
600 Jc2202c #197 [modified by AK Schmuck] UV_VIS_2mAU
min
1 - 12,231
2 - 12,746
WVL:254 nm
Flow: 0,430 ml/min
H2O: 0,0 %
H2O TFA: 50,0 %
10,0
0,0
MeOH TFA: 50,0 %
90,0
100,0
Peak #2 100% at 12.75 min
-10,0
0,0
10,0
20,0
30,0
40,0
50,0
60,0
249 280 300 320 340 360 380 400
%
nm
276.9
342.1268.4
50% at 12.62 min: 996.64 -50% at 13.00 min: 999.72
-2-116 15 14 13 12 11 10 9 8 7 6 5 4 3 2 1 0 ppm
1.28
1.29
1.31
1.33
1.35
1.36
1.38
1.52
1.54
1.55
1.56
1.58
1.59
1.61
1.62
1.64
1.65
1.66
1.68
1.69
1.70
1.71
2.70
2.71
2.73
2.74
2.75
2.77
2.78
4.70
6.97
6.98
7.04
7.06
7.07
7.27
7.33
7.35
7.61
7.62
7.63
7.97
7.99
8.03
8.04
8.10
8.11
8.12
8.13
8.13
8.20
8.22
8.24
8.24
8.25
8.25
8.27
8.27
8.28
8.32
8.33
8.35
8.36
8.46
8.47
8.48
8.49
10.93
10.96
11.4
519
.18
8.49
2.18
2.09
2.27
2.27
1.04
2.08
2.00
2.10
2.96
1.99
2.11
0.81
2.03
0.94
6.43
5.96
5.24
6.84
2.10
6.70
2.06
1.95
1.95
NAME JC11042011-5EXPNO 1PROCNO 1Date_ 20110412Time 23.00INSTRUM spectPROBHD 5 mm QNP 1H/15PULPROG zg30TD 65536SOLVENT DMSONS 64DS 2SWH 10330.578 HzFIDRES 0.157632 HzAQ 3.1720407 secRG 322.5DW 48.400 usecDE 6.00 usecTE 298.0 KD1 2.00000000 secTD0 1
======== CHANNEL f1 ========NUC1 1HP1 9.50 usecPL1 0.00 dBSFO1 500.2730894 MHzSI 65536SF 500.2700044 MHzWDW EMSSB 0LB 0.10 HzGB 0PC 1.00
H2N
O
NH
O
HN
O
NH
OHN
O
HN O
HN
O
NH
OHN
O
HN
HN
H2N
NH2 NH2
NH2
S5
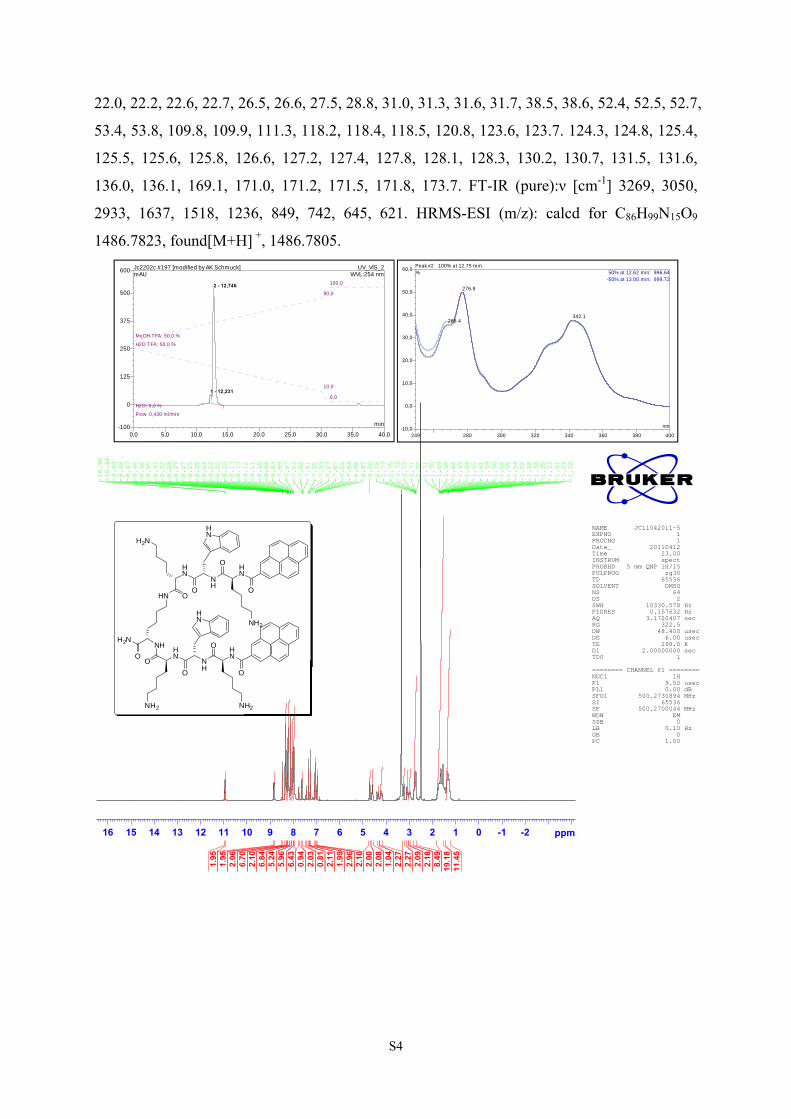
4. Buffer solution
Depending on the enzyme different buffer systems had to be used. The following table lists
the compositions of the buffers used (for 500 mL) and the adjusted pH value:
rhSkin β-Tryptase (pH = 7.4)
Reagent Amount
Trypsin (pH = 7.4)
Reagent Amounr
Tris 50 mM, 3.03 g
NaCl 100 mM, 2.92 g
Heparin 50 µg/mL, 250 µg
Triton-X 0.02%, 100 µL
Dest. H2O 500 mL
Tris 50 mM, 3.03 g
NaCl 100 mM, 2.92 g
EDTA 5 mM, 731 µg
Dest. H2O 500 mL
S6
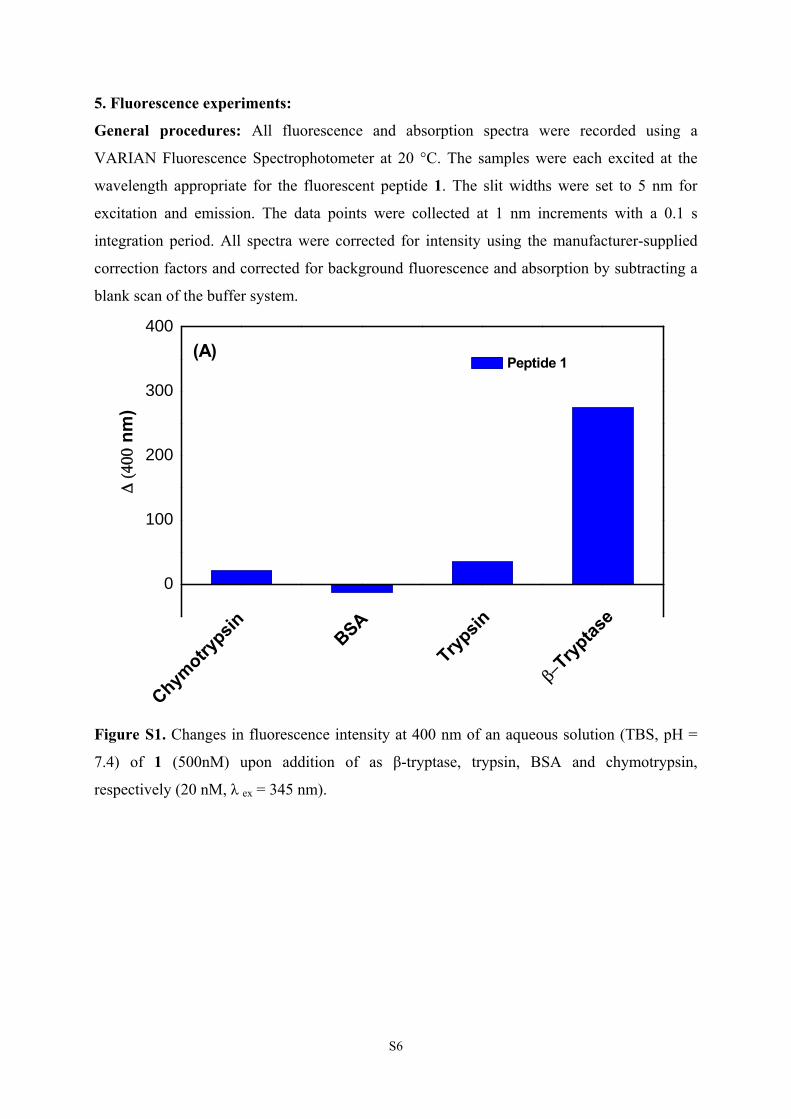
5. Fluorescence experiments:
General procedures: All fluorescence and absorption spectra were recorded using a
VARIAN Fluorescence Spectrophotometer at 20 °C. The samples were each excited at the
wavelength appropriate for the fluorescent peptide 1. The slit widths were set to 5 nm for
excitation and emission. The data points were collected at 1 nm increments with a 0.1 s
integration period. All spectra were corrected for intensity using the manufacturer-supplied
correction factors and corrected for background fluorescence and absorption by subtracting a
blank scan of the buffer system.
0
100
200
300
400
nm
)
Peptide 1
Chymotry
psin
BSA
Trypsi
n
Try
ptase
(A)
Figure S1. Changes in fluorescence intensity at 400 nm of an aqueous solution (TBS, pH =
7.4) of 1 (500nM) upon addition of as β-tryptase, trypsin, BSA and chymotrypsin,
respectively (20 nM, λ ex = 345 nm).

S7
6. Test for reversibility of enzyme inhibition:
The initial rate of the enzymatic reaction was measured at different enzyme concentrations
(rhSkin β-tryptase: 1-10 nM), always with a fixed substrate concentration (Tos-Gly-Pro-Arg-
AMC: 2.0 mM). The concentration of the inhibitor 1 was either 10 µM or 0 (control).
1 2 3 4 5 6 7 8 9 10 11
0
10
20
30
40
50
60
tryptase I = 0 M
tryptase I (peptide 1) = 10 M
V
[Tryptase] / nM
Figure S2. Test for reversible versus irreversible inhibition of the enzyme. Dependence of the
initial reaction rate (V0) on increasing enzyme concentration [E] with or without excess of
inhibitor.

S8
7. Determination of Km for rhSkin β-Tryptase / Tos-Gly-Pro-Arg-AMC:
The Michaelis constant Km for this enzyme/substrate combination was determined
experimentally. Therefore the rate of the enzyme reaction was measured at different substrate
concentrations (0-800 µM), always with a fixed enzyme concentration of tryptase (2.0 nM)
and without inhibitor. The obtained Km-value was 300 µM.
0 200 400 600 800
0
20
40
60
80
100
120
140
160
1/2Vmax
Tryptase HyperbI Fit of Tryptase
V
[S] /
Vmax
Km = 300
Figure S3. Graph of rate against total substrate concentration for a typical tryptase catalyzed
reaction.

S9
8.0 Determination of IC50
Figure S4. Determination of the IC50 values at two different substrate concentrations (50 and
100 M). A change of the IC50 value for different substrate concentrations is an indicator for
competitive inhibition, no change – as in this case - for non-competitive inhibition.

S10
9.0 Molecular Docking
Docking studies were performed using Autodock 4.2 and Autodocktools 4.2. The
coordinate .pdbqt file for β-tryptase and trypsin was prepared from pdb 1A0L by adding polar
hydrogens and Kollman charges using Autodock tools 4.2. A grid box of 86×96×86 Å
centered on the active site of tryptase was determined. Energy minimized pdb-coordinates for
each ligand were obtained with ChemBio3D Ultra 12.0. Gasteiger charges were added, non-
polar hydrogens were merged and rotatable bonds were set using Autodocktools 4.2 to
generate flexible coordinate.pdbqt files for each ligand. The flexible ligand coordinates were
docked into the β-tryptase and trypsin coordinates using Autodock Vina employing a grid box
consisting of 25000000 points. The resulting docking poses were visualized and overlaid with
PyMol.
10.0 Cell Experiments
Cytotoxicity assay: The cytotoxicity on CHMAS cells was studied using a CCK-8 assay.
Briefly, CHMAS cells suspension (50 μL, 6× 10⁴ cells/mL) were seeded onto a 96-well plate
with a cell density of 3 × 10⁴ cells/well. Peptide 1 (50 μL/well) in RPMI 1640 medium was
added at concentrations of 0.5, 1, 1.5 and 2 μM. and the cells were incubated for 24 h at 37 °C
under 5 % CO2. Subsequently, 10 μL of CCK-8 solution were added and the absorbance was
measured 4 h later using a Synergy H4 Hybrid Microplate reader (Biotek, USA) at 450 nm.
The following formula was used to calculate the viability of the cells: Viability (%) = (mean
absorbance value of treatment group - blank) / (mean absorbance value of control - blank) ×
100. Each sample was processed in triplicate and the IC50 value was obtained from the
respective cell viability curves.

S11
0.0 0.5 1.0 1.5 2.00
20
40
60
80
100
120
Cel
l V
iab
ilit
y (%
)
Concentration of Peptide 1 (μM)
CHMAS cell lines
IC50
= 0.7 μM
(A)
Figure S5. Cell survival curve (A) as measured by CCK-8 assay for peptide 1 against
CHMAS cell lines. The cells were seeded at 3 × 10⁴ cells/well on a 96-well plate and
incubated with various concentrations of peptide 1 (0.5-2.0 μM) for 24 h at 37 °C. After this
incubation time, a CCK-8 assay was performed. The data are presented as mean ± SD (n = 5).
Confocal laser scanning microscopy (CLSM) images:
CHMAS cells were cultured in RPMI 1640 supplemented with 10 % heat-inactivated FBS.
Cell culture was maintained at 37 °C in a humidified condition of 95% air and 5% CO2 in
culture medium. The cells were centrifuged to remove the medium and then incubated with
the peptide in RPMI-1640 medium at a final concentration of 10 μM for 30 min at 37 ° C.
Afterwards, the cells were washed with PBS and centrifuged three times to remove the
peptide. Cell images were taken with a confocal laser scanning microscope (CLSM) Nikon
A1 (Japan) with the excitation wavelengths of 404 nm and the emission collected at 410-425
nm.

S12
MTT-assay
The cytotoxicity was measured using the 3-(4, 5-dimethylthiazol-2-yl)-2, 5-
diphenyltetrazolium bromide (MTT) assay with KB cell lines. Cells growing in log phase
were seeded into 96-well cell-culture plate at 3×10⁴ cells/well. A solution of peptide 1 (100.0
μL/well) at concentrations of 1, 10, 20 and 40 μM in RPMI-1640 was added to the wells of
the treatment group. The cells were incubated for 24 h at 37 °C under 5% CO2. A combined
solution of 5 mg/mL MTT/PBS (10 µL/well) was added to each well of the 96-well plate
assay, and the cells incubated for an additional 4 hours. Formazan extraction was performed
with DMSO and its quantity was determined colorimetrically using a Synergy H4 Hybrid
Microplate reader (Biotek, USA), which was used to measure the OD490 nm (absorbance
value). The following formula was used to calculate the viability of cell growth: Viability (%)
= (mean of Absorbance value of treatment group- blank /mean Absorbance value of control-
blank) ×100. Each sample was processed in quintuplicate and the IC50 value was obtained
from the respective cell viability curves.
0 10 20 30 40
0
20
40
60
80
100
120
Cel
l V
iab
ilit
y (%
)
Concentration of Peptide 1 (μM)
IC50 = 5.68 μM
KB cell lines(B)
Figure S6. Cell survival curve (B) as measured by MTT assay for peptide 1 against KB cell
lines. The cells were seeded at 3×10⁴ cells/well on a 96-well plate and incubated with various
concentrations of peptide1 for 24 h at 37 °C. After this incubation time, a MTT assay was
performed. The data are presented as mean ± SD (n = 5).


