
A Land Use Data Base for GTAP
Presented byPresented by Thomas Hertel
B ildi ll b ti k ith N i R k tt B tBuilding on collaborative work with Navin Ramankutty, Brent Sohngen and Huey-Lin Lee

Outline
• Motivation• Key dimensions of the data baseKey dimensions of the data base• Potential uses
R f• References
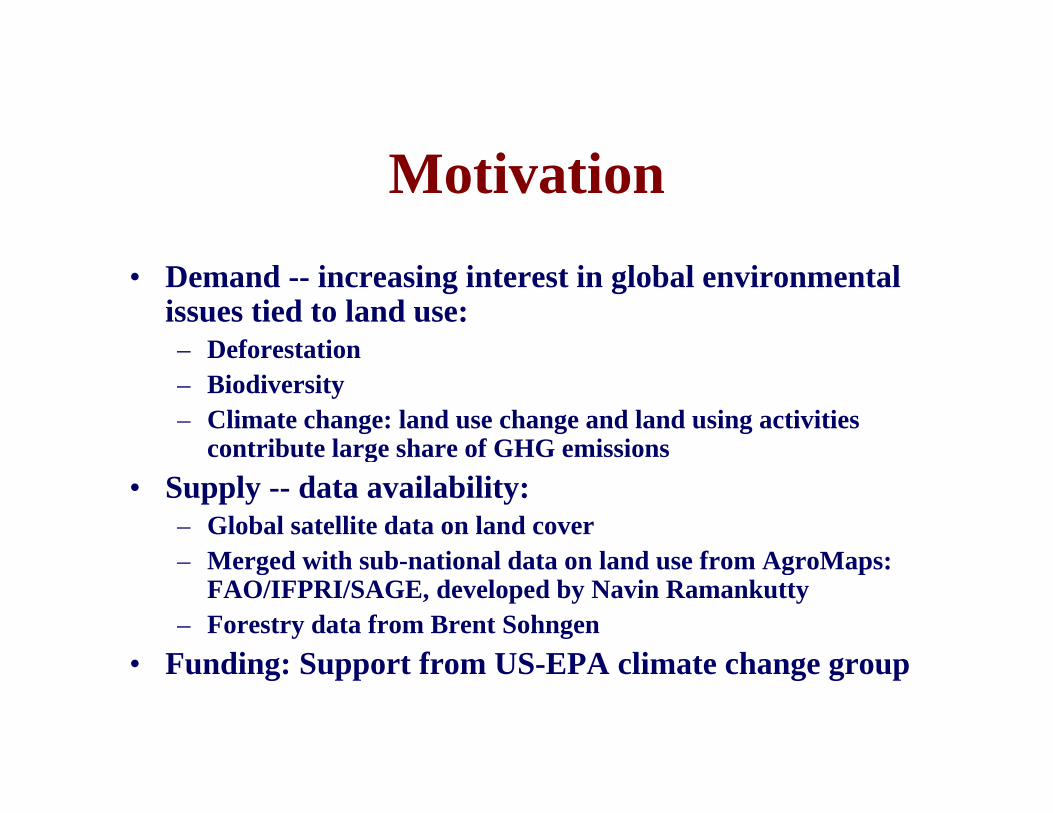
Motivation• Demand -- increasing interest in global environmental
issues tied to land use:– DeforestationDeforestation– Biodiversity– Climate change: land use change and land using activities
contribute large share of GHG emissionsg• Supply -- data availability:
– Global satellite data on land coverMerged with sub national data on land use from AgroMaps:– Merged with sub-national data on land use from AgroMaps: FAO/IFPRI/SAGE, developed by Navin Ramankutty
– Forestry data from Brent Sohngen• Funding: Support from US EPA climate change group• Funding: Support from US-EPA climate change group

Key Features of Data Base
• Built up from 0.5 degree grid cell data (260,000 on the globe)
• Aggregated into Agro-Ecological Zones (AEZs: gg g g g (IIASA/FAO):– Three climatic zones: boreal, temperate, tropical– 6 to 36 LGPs = # days with adequate temperature and soil
i t tmoisture to grow crops• Instead of one land endowment, now many land
endowments (AEZs):t li itl ti l– not explicitly spatial
– these may shift over time with climate change (Darwin et al.), • Land use for 175 FAO crops (Monfreda, Ramankutty
and Foley 2007)and Foley, 2007)

Global Distribution of AEZs

Maize area and yieldMaize area and yield
Source: Monfreda, ,Ramankutty and
Foley, 2007

A li ti (1) GHG iti tiApplications (1): GHG mitigation
• Supplement with data on:Supplement with data on:– GHGs (methane and nitrous oxide from agriculture;
soil and forest carbon sequestration)– PE MACs for individual activities
• Generate regional and global GE MACs for GHG abatement
• Examine competition for land in different AEZs
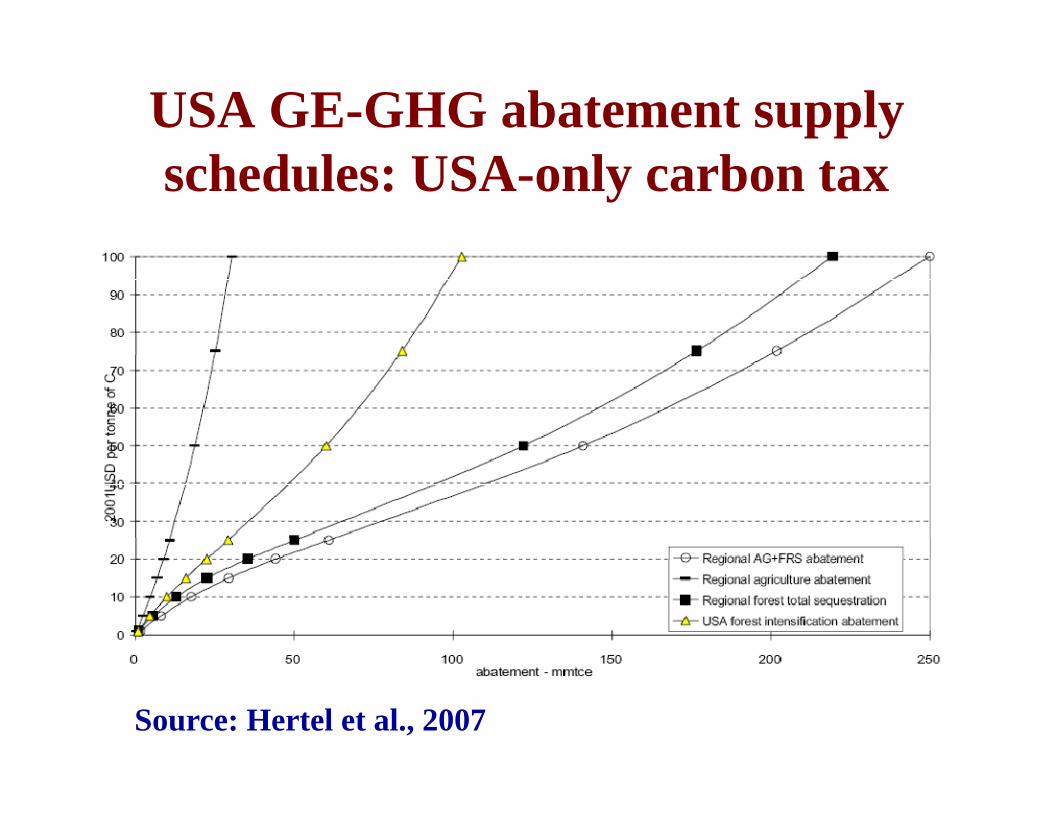
USA GE-GHG abatement supply schedules: USA-only carbon tax
Source: Hertel et al., 2007
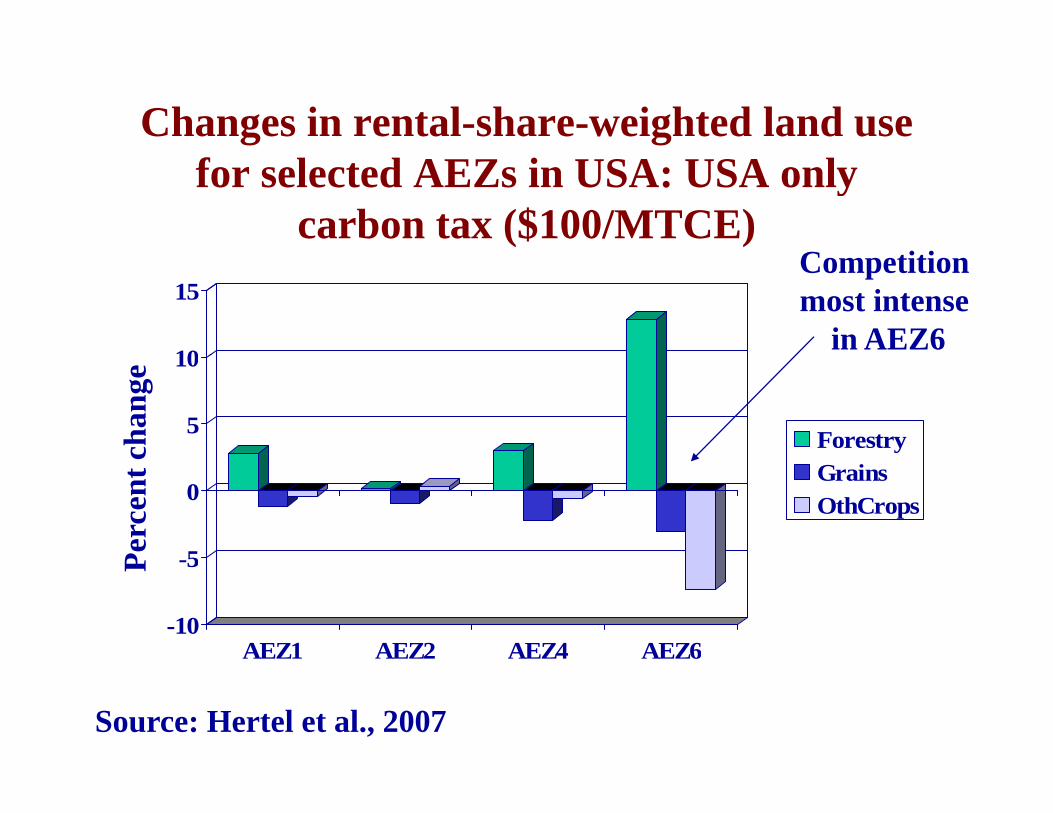
Changes in rental-share-weighted land use for selected AEZs in USA: USA only
carbon tax ($100/MTCE)C titi
10
15Competition most intense
in AEZ6
5
10
Forestrychan
ge
-5
0GrainsOthCrops
Perc
ent c
-10
-5
AEZ1 AEZ2 AEZ4 AEZ6
P
Source: Hertel et al., 2007
Applications (2): Baseline Projections of pp ( ) jLand Use
• Embed in dynamic GTAP model with modifiedEmbed in dynamic GTAP model with modified consumer demands and “intensification” options
• Add investment decision to access new forest lands• Focus on changes in land use (and emissions) as
global pattern of demands changes g p g
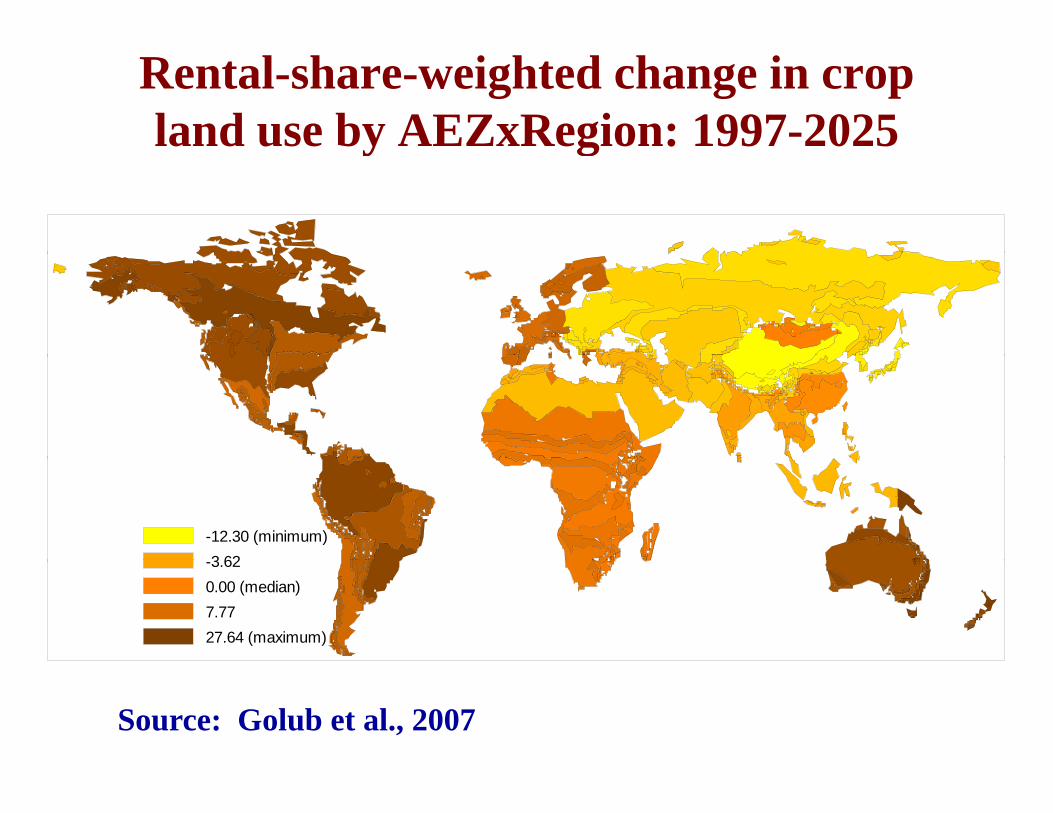
Rental-share-weighted change in crop land use by AEZxRegion: 1997-2025y g
-12.30 (minimum)3 62-3.62
0.00 (median)7.7727.64 (maximum)
Source: Golub et al., 2007

A li ti (3) Bi f l (i )Applications (3): Biofuels (in progress)
• Combine with bio-fuels-enhanced version ofCombine with bio fuels enhanced version of GTAP-E which permits inter-fuel substitution
• Examine impact of subsidies/higher energy prices p g gy pon ethanol and bio-diesel demand
• Model translates increased demand into production of maize, oilseeds or sugar cane
• Land use module predicts which crops will be displaced, where deforestation might occur
• Examine impact on food prices and environmental degradation

F t Di ti d R fFuture Directions and References
• Currently revising GTAP Tech PaperCurrently revising GTAP Tech Paper #25 to reflect new MRF and forestry data bases
• Editing book on this topic:Economic Analysis of Land Use in Global Climate Change
P li P bli h R tl d Edit T H t l StPolicy, Publisher: Routledge, Editors: Tom Hertel, Steven Rose, Richard Tol
• In summary: Lots of potential for basicIn summary: Lots of potential for basic applied research as well as policy applicationspp


