

A revised management cost recovery (levy) framework
for the Commonwealth South Eastern Scalefish and
Shark Fishery (SESSF)
Project report for the Australian Fisheries Management Authority (AFMA)
July 2012
Note: This report is not for further distribution unless
authorised by AFMA’s Executive Manager Fisheries.

A Revised SESSF Levy Framework – Cobalt MRM Report for AFMA
Page | 2
Contents
Project Overview ............................................................................................................... 3
Deliverables ....................................................................................................................... 3
Regulatory Basis for AFMA’s Levy Collection ................................................................ 3
Current SESSF Levy Framework – Problem Analysis ...................................................... 4
Revised SESSF Levy Framework - Design Principles .................................................... 11
Revised Levy - Options ................................................................................................... 11
Additional Issues for Consideration................................................................................. 21
Appendix 1 - SESSF quota species management cost matrix ......................................... 24
Appendix 2 - Example of revised SESSF levy model and explanatory notes ................. 26
Appendix 3 - Summary of Project Consultation .............................................................. 28
Acknowledgements
AFMA staff, and SEMAC and its Levy Working Group members have provided valuable
background information, detailed fishery specific knowledge, and valuable critique of various
options explored during the project.
In particular, an AFMA “focus group” comprising John Garvey, Trent Timiss, Andrew
Powell, Malcolm Southwell, and Brad Milic have all been generous with their time, and
helpful in the development, analysis, and critique of various options.
The project has taken place during a very busy period for all AFMA staff in the lead-up to
their next budget, significant staffing changes in the Fisheries Branch, and the ongoing need
to address various high priority fisheries management issues.
There are also very challenging business circumstances confronting some SESSF fishing
businesses, including recent surrenders of SESSF concessions due to financial hardship. To
their credit, fishing industry members of SEMAC and the Levy Working Group have
remained helpful and constructively engaged with the process to revise the SESSF levy
framework.
For questions about this report please contact either:
Andy Bodsworth,
Director, Cobalt MRM Pty Ltd
Ph: 0439602769
www.cobaltmrm.com.au
Or AFMA’s Senior Manager for the SESSF via 02 62255555.

A Revised SESSF Levy Framework – Cobalt MRM Report for AFMA
Page | 3
Project Overview
AFMA contracted Cobalt Marine Resource Management Pty Ltd (Andy Bodsworth) to
continue work by AFMA, industry, and the SEMAC levy working group to refine the current
SESSF levy framework. A copy of the contract, including details of conditions, services,
deliverables, and fees and allowances is available on AFMA File F2012-0441.
AFMA and SESSF concession holders have recognised that the existing SESSF levy
framework is no longer the most accurate and equitable approach to collecting recoverable
fisheries management costs for these fisheries. This has been further emphasised by
stakeholder correspondence questioning the accuracy and equity of the previous approach;
and a recent Senate disallowance motion for the Levy Regulations (subsequently overturned).
The revised SESSF levy approach must be consistent with AFMA’s 2010 cost recovery
impact statement (CRIS), and relevant legislation and policy. It must accurately attribute
recoverable costs to beneficiaries (i.e. those generating the work/cost), and recover those
costs from those beneficiaries (the User Pays principle).
The new levy approach should also be transparent, and cost effective and efficient to apply.
Where appropriate it will be complemented by a fee for service approach for specified
AFMA services1.
Deliverables
Master excel spreadsheets developed as the basis for calculating levy under the proposed
framework have been provided separately to AFMA. These include the management cost
matrix, and a workbook to calculate the ITQ and Boat SFR components of the SESSF levy.
This report provides a record of the process and key issues considered in developing the
proposed model. It also describes how the model works, and the data inputs.
Electronic files generated during the project, including a large amount of background
material used for analysis, and development of the proposed model, are available on AFMA’s
Fisheries Branch Drive at H:\Southern Fisheries Section\Finance\Levies_ALL Southern
fisheries\2011-12 Levies\Andy Bods\.
Regulatory Basis for AFMA’s Levy Collection
The 1991 Fisheries Administration Act (FAA) requires recovery of AFMA’s fisheries
management costs in accordance with government targets. These targets and broader policy
guidelines are detailed in the Australian Government Department of Finance and
Deregulation (DoF) cost recovery guidelines.
AFMA’s Cost Recovery Impact Statement (CRIS) was revised in 2010 to reflect the most
recent DoF cost recovery policy requirements; and changes to AFMA’s operating
environment and functions since the previous (2004) CRIS.
Principally this includes the 2005 Ministerial Direction to AFMA, refinements to the ESD
objective, and definition of economic efficiency in the Fisheries Management Act 1991
(FMA); and changes to AFMA’s operating structure and processes following the 2007-08
Business Efficiency Review & Cost Reduction Working Group processes.
AFMA’s fisheries management levies are collected on the basis of Fishing Levy Regulations
made each year under the Fishing levy Act 1991 and the FMA. The Levy Regulations
describe the fisheries for which levy is payable, amounts payable for each fishing concession
type, due dates for payment, and relevant supporting information.
1 AFMA’s proposed Fee for Service Policy is currently being finalised.

A Revised SESSF Levy Framework – Cobalt MRM Report for AFMA
Page | 4
Current SESSF Levy Framework – Problem Analysis
The fisheries management and regulatory challenges inherent in developing an accurate and
cost effective levy framework for a relatively complex multi species multi method fishery
like the SESSF are compounded by the current operating environment for AFMA and
commonwealth fisheries. As cost management becomes increasingly critical for fishing
businesses and governments, regulatory activities, like levy collection, are under increasing
scrutiny. Key issues identified during the review of AFMA’s existing levy approach, and in
considering options for a revised approach, are illustrated below (Figure 1).
In addition there are ongoing changes to fishing businesses, including the gear used and its
impact on the broader marine environment; and the composition of target, byproduct, and
bycatch species across fishing businesses within a fishing sector (e.g. Trawl Fisheries); and
across sectors (e.g. GHAT sub-sectors such as Gillnet, Autoline and Dropline).
Under AFMA’s user pays approach, the recoverable costs generated by AFMA’s fishery
management activities must be accurately attributed to the entitlements (e.g. Boat and Quota
SFRs, permits) that use or benefit from those services. Ideally this requires accurate
estimates (or records) of time/activities against the various budget line items (account codes)
that make up the recoverable costs for a fishery. Some of these activity areas (including
various classes of AFMA overheads) will be attributable to several fisheries across a fishery
group (e.g. some or all of the SESSF sectors).
There is potential for this process to be complex, time consuming, and expensive to
administer. The administrative costs of collecting and using such management cost data for
the levy process must also be considered alongside the benefits these data generate.
Applied accurately, consistently, and promptly, the user pays approach can make the
economic and environmental cost and benefits of fishing activity more transparent. This
price signal can be used to improve ESD and industry business efficiency outcomes by:
generating incentives to reduce fishing impacts and costs through improved fishing
practices; and promoting efficient R&D to mitigate fishing impacts/costs;
focusing AFMA and industry on the issues generating most cost, and encouraging
cost benefit appraisal against AFMA’s legislative and policy objectives; and
industry’s business objectives;
providing a clear incentive to maintain stocks at ecologically sustainable and
economically efficient levels (where management costs should also remain more
stable, and at appropriate levels). This is similar to the cost/risk trade-off approach
embedded in the Commonwealth Harvest Strategy Policy.
Detailed awareness of the cost structure of any business, and subsequent cost management is
also a key driver of business profitability. Accurate and reliable cost and activity data can
help AFMA and industry review exactly where time is being spent and costs incurred; and if
activities are delivering on organisational priorities.
This can underpin development of more efficient work processes, encourage collaboration
with industry on cost reduction opportunities, and improve accountability and fiscal
management through improved budgeting (forward estimates), and management of budgets
throughout the year.
At AFMA’s request the review did not further develop options to use a more detailed activity
based costing (ABC) approach to estimate/record management costs against specific projects
and/or beneficiaries. Noting that the level of detail in cost data available to accurately

A Revised SESSF Levy Framework – Cobalt MRM Report for AFMA
Page | 5
estimate and attribute costs is variable across SESSF fisheries, and the relationship between
management activities, costs, and beneficiaries is complicated and dynamic; ABC may prove
to be the most robust and cost effective approach for more complex and higher cost/risk
management activities.
Contemporary time tracking and project management software to enable an ABC approach is
widely available and increasingly user friendly and cost effective. Selective, or agency wide,
adoption of this sort of approach warrants further consideration. Opportunities to use ABC to
inform AFMA’s cost recovery and levy processes have been identified throughout the project
and are noted in this report.
Project Assumptions and Constraints
The project has focused on understanding AFMA’s recoverable fisheries management
costs for SESSF sectors in the context of how these can be more accurately estimated
and aligned with beneficiaries via the ITQ and Boat SFR components of the levy. The
review has not attempted to analyse AFMA’s work processes, or the outcomes of
those in detail2.
The proposed SESSF levy framework is based on costs attributable to industry under
CRIS 2010. If CRIS 2010 changes, the new SESSF levy framework may need to be
updated.
The need to estimate a common management cost per SESSF quota species3 in line
with the transferability of SESSF quota across various fishing methods, the nature of
AFMA’s quota management and licencing systems (e.g. ITQs are not linked to fishing
methods within the SESSF), and the desire to collect a substantial proportion (e.g. 60-
80%) of recoverable management costs via that ITQ levy component, substantially
constrain options for the revised levy framework.
2 Recognising that corporate processes to ensure ‘the right work is being done efficiently” are critically
important to ensuring cost effective and efficient fisheries management that is then cost recovered via the levy
process. 3 This contrasts with the reality that there are substantially different “management costs per species” across
some SESSF fishing methods due to the different ecological footprint of these gears at different effort levels.

A Revised SESSF Levy Framework – Cobalt MRM Report for AFMA
Figure 1: Key issues for consideration in the development of a revised SESSF levy framework
Objective:
Accurate cost estimation &
recovery under user-
pays
Financial management
(estimates & budget
management) Accurately estimating
activities/time against
fisheries/users
Relatively high management
costs for some fisheries
Surrender of Concessions
increasing costs for remaining
fishers
% of costs to ITQs Vs Boat
SFR component (policy, price
signal?) Some
permits/sectors & species are
not levied despite their
costs
All Stakeholders should have
input into the model to be
used
Promote Levy stability across
years
Transparent model needed, consistent levy
design principles
across AFMA
Should GVP be used to
determine levy payable per
species?

A Revised SESSF Levy Framework – Cobalt MRM Report for AFMA
Page 7
The issues outlined in figure 1 are discussed below.
SESSF Levy Issue Relevance
1. Accurate Cost
Estimates for levy
purposes
Efficiently recovering the costs of AFMA’s fisheries management
services from the beneficiaries of those services is a legislative
requirement. Policy guidance is provided in AFMA’s CRIS 2010.
2. Accurate Cost
Attribution
As above. Current budget (cost centre) structures such as the different
fishing methods within the GHAT cost centre complicate this process
(in part because these methods generate different management costs per
species). Availability and accuracy of data to support cost attribution
varies across budgets and fisheries.
3. High Management
Costs in some
Fisheries
Some SESSF fisheries - particularly some GHAT sectors - currently
have relatively high management costs. Industry remains concerned
that these costs are not reducing commensurate with reductions in fleet
sizes, and/or AFMA’s cost management is not responsive enough to
adapt promptly to changing business circumstances.
4. Proportion
recovered via ITQ
Vs Boat SFR
The SEMAC Levy Working Group has recommended a greater
proportion of the recoverable costs be accrued to the ITQ component of
levy. This recognises that quota owners are relatively greater
beneficiaries of fisheries management services and should pay costs
commensurate with their holdings.
5. Levy Stability Levy stability from year to year is important for industry business
planning and management. It is also a sign of an accurate and
equitable cost recovery mechanism (given minor variations in budgets
from year to year). Unexplained significant variations in levy for a
fishery from year to year also reduce AFMA’s efficiency and
effectiveness, and reduce stakeholder confidence in AFMA’s
regulatory performance.
6. Budgets – Forward
Estimates
Recoverable management costs are driven by fishery budgets and
application of AFMA’s CRIS. Accurately forecasting work programs
and resourcing, and AFMA and industry commitment to these priorities
will increase management efficiency and levy stability across years.4
7. Budgets – Fiscal
Management
Strong fiscal management within a financial cycle will improve
AFMA’s efficiency, effectiveness, and standing with stakeholders.
This will also work to improve levy stability across years.
8. Should GVP be
used to calculate
per species costs
AFMA’s previous SESSF levy model used each species’ proportion of
GVP relative to total SESSF trawl GVP to determine the proportion of
total recoverable Tier 2 costs attributable to that species. Whilst
relatively simple and cost effective to apply, this process did not
accurately attribute actual management costs for those species to
beneficiaries. This also meant that an increase in GVP that resulted
from improved product quality, market demand etc translated into
4 Recognising that unforseen management issues will arise, and subsequent management options should be critically
evaluated and accurately costed before implementation.

A Revised SESSF Levy Framework – Cobalt MRM Report for AFMA
Page 8
increased levy even though actual management costs for that species
may not have changed - in this sense it acted more as a tax than an
accurate management cost recovery mechanism.
9. Transparency Recovery of fisheries management costs using a common per species
cost across multiple species and fishing methods, each with differential
environmental impacts and management costs, is complex. For
administrative fairness, and to promote stakeholder engagement and
support, the process to develop the revised levy model and the rationale
for the chosen approach must be clear to stakeholders.
As well as consultation and guidance from SEMAC and the LWG;
broader consultation with all SESSF concession holders for their input
and to facilitate their engagement and understanding is appropriate.
10. Knowledge
Management
A clear understanding of principles underlying the revised levy model,
how the model is structured and key input variables will assist in
implementation and ongoing refinement of the model as the operating
environment for AFMA and Industry evolves. This report is intended
to capture relevant project knowledge, and make it readily accessible to
AFMA staff.
11. Surrender of
Concessions
As fisheries become more efficient and/or business circumstances
become more challenging, surrender of fishing concessions is likely to
continue. Remaining concessions pay relatively more management
costs. This emphasises the need for economically efficient fisheries
management, including strong cost management.
12. Transition from old
to new levy
framework
Whilst the total amount recoverable via the SESSF levy process will
not change under the revised framework (this amount is a function of
the budget and application of the CRIS), there will be some SESSF
concessions paying more, and some paying less under a more accurate
cost attribution model.
Importantly, some concession holders appear to have recently
surrendered concessions due to significant levy variations and for
affordability reasons. Where the new SESSF levy framework results in
substantial changes (without commensurate changes in recoverable
costs), particularly coming after some significant levy increases in
recent years; a process to ensure administrative fairness is
recommended.
Other specific issues and concerns about the existing levy framework have been raised in industry
correspondence to AFMA and SEMAC. Key issues include:
Concerns about the apparent disproportionate levy cost of GHAT Scalefish Hook Boat
SFRs used for small scale manual baiting versus costs for a GHAT auto longline permit;
Concerns about how additional management costs in some GHAT sectors (e.g. Gillnet)
appear to have flowed in to increase levy payable by other GHAT sectors. For example,
why are Scalefish Boat SFRs for fishers targeting relatively small amounts of blue eye via
dropline costing as much as Boat SFRs /permits authorising significantly higher levels of
fishing effort (e.g. auto longline) that are likely to drive higher management costs;

A Revised SESSF Levy Framework – Cobalt MRM Report for AFMA
Page 9
Will South Australian gillnet fishers provided with temporary (12-18months) concessions
to fish via hook methods, as a management response to TEP interactions, be required to
pay a similar levy to other SESSF hook entitlements?
A more strategic context for the SESSF levy review, including how a revised levy approach can
best contribute to AFMA’s Ecosystem Based Fisheries Management (EBFM) objectives in the
medium term, is illustrated below (Figure 2).

A Revised SESSF Levy Framework – Cobalt MRM Report for AFMA
Page 10
Current State 2012:
Target and Byproduct increasingly well
managed under strong policy framework
(i.e. Commonwealth HSP)
Efficiency of management being
addressed/improving & profitability
generally improving (excepting some
externalities)
Bycatch/TEP management and WoG TEP
policy is less developed and is
undermining efficiency
AFMA Levy processes improving (tighter
budgets, more accurate cost estimation &
attribution)
More Efficient State 2015+:
Purer ITQ system (no boat SFR’s??)
Fishing is More Profitable &
Sustainable
Bycatch/TEP management improved
(in part from preceding strong price
signal & strong WoG policy in place)
Improving AFMA & Industry
efficiency/business productivity (e.g. e-
monitoring, fee for service, co-
management)
More Activity Based Costing (tight cost
management, budgeting, more business
intelligence informing productivity
gains)
Functional importance of price signal
reducing over time as best practice
policies in place and AFMA/industry
capability improves
Clear price signal (via Boat SFR levy
component for method based issues) drives
better environmental performance &
improving management efficiency.
Better cost data informs understanding of
costs and potential regulatory and business
efficiencies for AFMA & Industry
Refining the SESSF Levy – Strategic Outlook
User Pays, Price Signals, and the path to more efficient and
effective Ecosystem Based Fisheries Management
Figure 2: schematic of the strategic role of a revised SESSF levy framework

A Revised SESSF Levy Framework – Cobalt MRM Report for AFMA
Page 11
Revised SESSF Levy Framework - Design Principles
Design principles for the new levy model centre on government’s cost recovery requirements
as reflected in AFMA’s CRIS 2010. The User Pays principle is central, and the new levy
model needs a clear link between those AFMA services generating recoverable management
costs and the beneficiaries of those services. It should also encourage strong cost
management.
Further guiding principles for the new SESSF levy model have been developed in
consultation with SEMAC and its levy working group, and AFMA staff:
Recoverable management costs should be attributed to the groups that generate them,
and (where appropriate) should include sectors which currently do not pay levies;
The model should deliver a stable levy rate for an individual concession when all
other factors remain relatively constant (e.g. if management costs are unchanged, then
levy on an individual concession must not change either);
The model should be clear and logical, and cost effective to administer;
Cost increases in one fishery should not flow into other fisheries unless those costs are
also attributable to the other fishery;
The levy approach that informs the model should encourage good budget
management and accountability for both AFMA and Industry;
The basis for management costs and their attribution to fisheries/individuals must be
clear;
A fee for service approach should be used where appropriate.
User pays principle – fee for service
AFMA is also adopting a fee for service approach where services are clearly attributable to a
client, agency, or entitlement holder/fishery. For example data management costs associated
with a report on catch history for a specific entitlement/permit to support the commercial sale
of that entitlement might be recovered on a fee for service basis.
Fee for service can also encourage critical evaluation of a service i.e. is there a net benefit
from the activity; and mitigates the risk of cost shifting to non beneficiaries. It also offers a
clear and timely price signal. This can promote accountability, innovation and collaboration
between AFMA/industry, and underpin productivity increases.
Revised Levy - Options
Under the current SESSF levy framework, total recoverable fisheries management costs are
made up of two components, the ITQ (or Tier 2) component, and the Boat SFR (Tier 1)
component. The ITQ component is intended to capture the majority of recoverable fisheries
management costs (see Figure 4) that are generated under the SESSF fisheries management
system. This recognises that a concession holder with greater quota holdings is a relatively
greater beneficiary of AFMA’s fisheries management services.
Estimating recoverable fisheries management costs is relatively straightforward where there
are a small number of target species and/or fishing methods that are broadly equivalent in
their management costs. Recoverable costs can be aligned relatively easily to these species’
for the ITQ component of a levy, and to the Boat SFRs or permits in use for that fishery.

A Revised SESSF Levy Framework – Cobalt MRM Report for AFMA
Page 12
Developing an accurate levy model for multiple SESSF quota species caught by a range of
fishing methods, all of which have different ecological risk profiles, is more complex. If the
various SESSF sectors (methods) across which quota species are caught were broadly
equivalent in their management costs then a common SESSF “management cost per quota
species” (cents/kg) could be calculated from the combined recoverable costs of all SESSF
cost centres. This would be relatively straightforward, and would generally reflect the user-
pays principle.
In practice, some species are inherently more complex or costly to manage; and various
SESSF sub-sectors (fishing methods) also generate different management costs depending on
the “efficiency” of that fishing method, and of the fishery more broadly (including costs
arising from differential environmental impacts, cross jurisdictional management complexity,
efficiency of research processes, economies of scale for the fishery etc). The definition of
these cost data is also variable across fisheries. This makes it more difficult to analyse real
management costs per species, or costs for a fishery method within a sector such as the
GHAT.
If these extra “method specific” costs are spread across several fisheries, or accrue to the ITQ
component of the levy according to number of SFRs of a species held, irrespective of the
method used to take these species, then there will be some cross subsidisation across those
various SESSF sectors.
Such cost spreading also dilutes the “price signal” that an accurate user pays system
generates. It makes it more difficult for fishers to understand the detailed management costs
for their fisheries, and develop efficiencies to reduce those costs. It also reduces incentives to
reduce costs because these costs are partly subsidised by other sectors.
For example, costs that make up the Commonwealth Trawl Sector (CTS) budget are
relatively clear and linked to only one fishing method; whilst total Gillnet, Hook, and Trap
(GHAT) Fishery costs (expressed as one cost centre/budget) are made up of various costs
incurred in managing those separate fishing methods (e.g. gillnet, dropline, auto longline,
shark trotline etc). Limited activity/cost data for each of these discrete methods makes it
more difficult to separate the total GHAT budget and accurately attribute costs to
beneficiaries in line with user-pays.
It is relatively straightforward to estimate/calculate a “management cost per quota species”
value for species taken in the CTS, or by trawl generally, and then levy CTS operators based
on the quota they own. This is a reasonably accurate and fair method to attribute
management costs to beneficiaries using a common fisheries management “currency” such as
species specific ITQs.
For the various GHAT sectors this management cost attribution is more complicated. These
various fishing methods have differential management costs, and a broader range of
beneficiaries. If the total costs across GHAT sub-sectors are simply lumped together, and
divided and recovered without acknowledging the differential costs between methods, levy
paid in the more efficient GHAT fisheries (or those with less environmental impacts/costs
etc) will be greater than true management costs. These fisheries would be partly subsidising
less efficient fisheries or methods.
Such cross subsidisation will also reduce the incentive for less efficient fisheries to
find/develop management practices that reduce their costs (e.g. mitigation strategies that
reduce bycatch impacts/costs; or via research efficiencies such as moving to stock
assessments every 2 or 3 years where appropriate).

A Revised SESSF Levy Framework – Cobalt MRM Report for AFMA
Page 13
The revised SESSF levy approach must also work with AFMA’s recently upgraded licencing
and quota management systems. In brief, these systems encourage efficient trading of quota
across SESSF sectors. There is no such thing as a method specific SESSF quota SFR/unit, so
there is no practical and cost effective way of accurately linking a species specific quota SFR
(say gummy shark) to a method, such as gillnet or hook.
Therefore it is not feasible to estimate method specific management costs for each of the
SESSF quota species – and then recover those method and species specific management costs
via an ITQ component of the levy.
For example a Gummy Shark quota owner might have a portion of their quota that is
nominated to a gillnet boat, another portion nominated to a trawl boat, and some remaining
“unfished” as a static investment. Amounts of quota nominated to each of these various uses
change over time as quota owners/fishers trade via AFMA’s Gofish quota trading system to
suit their business circumstances.
The alternative to this “method specific management cost per quota species” approach is to
collect a baseline management cost per species that can apply across the multi species, multi
method nature of SESSF fisheries.
To minimise the risk of cross subsidisation (e.g. to ensure that levy payable on Gummy Shark
Quota used by a CTS operator does not also include the additional TEP related costs of the
Gillnet sector) this baseline management cost per species must, as much as possible, reflect
the inherent management complexity/costs for each SESSF quota species.
A matrix to estimate these inherent management costs per SESSF quota species, using
weighted “management cost categories”, has been developed (see management cost matrix at
Appendix 1.).
Where there is a substantial management cost differential between methods, and one sector
catches the majority of the TAC for a species (e.g. GHAT fisheries and Gummy Shark), it is
possible to increase the management cost per SFR to more accurately reflect the method
specific management cost for that species5.
This can be done without having a substantial impact on the levy cost of the ITQs for that
species held in other “non-target” fisheries (e.g. when a small amount of Gummy Shark quota
is held across these other fisheries to cover incidental and small amounts of bycatch).
Where this baseline management cost per species does not recover (via the levy process) the
true costs of a particular fishery/method, the Boat SFR component of the levy must be used to
collect those additional management costs. These extra costs are generally driven by the
broader environmental impacts of a particular fishing method.
Preferred Option:
To minimise the risk of cross subsidisation6, and thus enable a robust baseline “management
cost per quota species,” for all SESSF quota species taken irrespective of method, the
management costs for quota species taken in the CTS can be used. The CTS is a large and
reasonably efficient fishery, and there is reasonable cost data largely quarantined to that
fishery/method.
5 For example, increasing the management cost multiplier for Gummy Shark above the “inherent management
cost” derived from the per species management cost matrix (Appendix 1) can enable a higher proportion of
gummy shark related management costs to be recovered via ITQ holdings rather than Boat SFR levy fees. 6Including the risk that the ITQ based levy for a quota species may include the embedded management costs of
fishing methods that have a higher ecological impact (and management cost) due to fishing for that species.

A Revised SESSF Levy Framework – Cobalt MRM Report for AFMA
Page 14
This CTS derived “management cost per quota species” will not reflect the true management
costs for those various species if they are taken by other fishing methods. This “management
cost differential” will thus need to be recovered via the Boat SFR component. For methods
where the cost differential is high (e.g. Gillnet sector currently) a significant proportion of the
total levy cost could fall on Boat SFRs7.
The process to calculate both the ITQ and Boat SFR/Permit components under the revised
SESSF levy approach is described in table 1 below.
Final Levy Amount Payable
Once AFMA’s budget for each fishery has been developed for the coming financial year, any
over or under collection of levy from the previous year is added or subtracted to make up the
final budget. The ITQ and Boat SFR components of the new levy are then determined (Table
1 below), and the Fisheries Research and Development Corporation (FRDC) GVP based
research levy is added to the per species management levy. This total, and the amount
payable for each Boat SFR or Permit, are added to make up the final levy amount payable per
concession or package of concessions.
7 This will depend on the amount collected for key GHAT target species as described in footnote 6 above.

A Revised SESSF Levy Framework – Cobalt MRM Report for AFMA
Page 15
Table 1: proposed approach to calculate the ITQ and Boat SFR components of the SESSF Levy
SESSF sector Boat SFR component ITQ component
Trawl (CTS)
CVIT, ECDWT
The CTS Boat SFR component is calculated directly
from the CTS budget using costs attributed to the Tier 1
(Boat SFR) component of the CTS budget using generic
Tier 1 & 2 splits (see Table 2).
These total recoverable Tier 1 costs are then divided by
the number of CTS Boat SFRs to get the levy payable
per Boat SFR.
It is likely to be more cost effective and efficient to
aggregate management costs for these minor trawl
sectors into an overall SESSF Trawl Sector Budget
(excluding GAB Trawl).
The trawl manager can then use the best available
cost/activity data to estimate the Boat SFR component
of costs attributable to CVIT and ECDW respectively.
Alternative (if these cost centres are retained) – calculate
Boat SFR levy directly for these separate budgets using
the Tier 1 and 2 splits as for CTS above.
For levy purposes, a baseline or inherent management cost for
each SESSF quota species is estimated from a matrix of
weighted “management cost attributes”. This management cost
score for each quota species is used as the species specific
“management cost multiplier (see Appendix 1).
A “weighted catch value” is then calculated by multiplying the
trawl catch of each species in kg by the management cost
multiplier for each of those species (see Appendix 2.).
Each species’ weighted catch value is then divided by the sum of
all species’ weighted catch value and multiplied by the total
recoverable Tier 2 cost8 for the combined SESSF trawl fisheries
(ECDWT, CVIT, CTS). This gives an amount ($) to be
recovered - representing the species specific proportion of tier 2
costs for each quota species.
This is then divided by the total number of SFRs allocated for
each species to give the levy cost per SFR (cents per SFR) for
each SESSF quota species.
The cents per SFR value is multiplied by the amount of quota
owned of each SESSF quota species to derive the Tier 2 – or
ITQ component – of levy payable per species for SESSF quota
owners.
Summing the total Tier 2 levy amount payable from all SESSF
quota owners provides the total amount recovered across all of
the SESSF fisheries via the ITQ component of the levy.
8 The total recoverable Tier 2 costs for the trawl sectors used in the formula are derived by apportioning SESSF trawl budgets according to the Tier 1 and Tier 2 cost proportions
(see Table 2).

A Revised SESSF Levy Framework – Cobalt MRM Report for AFMA
Page 16
For the trawl sectors, on which this baseline per species
management cost is based, the Tier 2 amount recovered will be
around 85% of the combined trawl budget (see Figure 4.).
GHAT Gillnet Once all of the costs attributed to Tier 2 (ITQ
component) for the GHAT sectors have been calculated
(based on GHAT catches of SESSF quota species for the
previous year), this amount is subtracted from the total
recoverable costs for the GHAT budget to provide the
balance of GHAT costs that must be recovered.
This residual GHAT amount (or balance) will be the
Boat SFR component to be collected across all of the
GHAT sectors (as defined by Boat SFR types or permit
types).
The GHAT manager/s then estimate (based on the best
time/cost data available) the relative proportion of this
total cost that should be attributed to each GHAT
subsector.
This subsector total is then divided by the number of
Boat SFR’s/permits in that subsector to give the Tier 1
component payable for each concession type.
For GHAT fisheries the amount collected via the baseline ITQ
component of the levy (described above) will not be enough to
collect a significant proportion (e.g. 85%) of the recoverable
management costs for these fishing methods. This is because
the estimated management cost per SFR based on the trawl
fishery cost equation under-represents the true management cost
for most of the species taken in GHAT sectors.
This under-collection issue can be addressed by either:
a. Estimating a species specific management cost for the 3
primary GHAT target species (Blue Eye Trevalla,
Gummy Shark and School Shark) using the GHAT
fishery costs and catches of these species9, or
b. Making up the balance of GHAT ITQ levy under-
collection by recovering these residual “method specific”
GHAT management costs via the Boat SFR component -
of the levy - as described at left.
Auto LL
Manual baiting
trotline
Manual baiting
dropline
Trap
SA and Tas Coastal
Waters Permits
(combinations of
Gillnet, Hook, both)
Calculate Boat SFR component as for GHAT methods above. Where these permits are currently linked to a
Commonwealth Boat SFR they do not pay levy, although these linked permits do have a management cost. A decision
whether to “delink” these permits and levy them separately requires further consideration and discussion, including the
fisheries management implications of delinking, and any prior agreements relating to payment of levy for these permits.
9 This is the preferred approach as it enables a significant proportion of GHAT management costs for these species to be collected via the ITQ component of the levy consistent
with user-pays, and as requested by SEMAC and the Levy Working Group.

A Revised SESSF Levy Framework – Cobalt MRM Report for AFMA
Page 17
Number of SFRs owned for
each species multiplied by
the cents/SFR cost for that
species determines a
fishers’ ITQ levy
component
A baseline management cost
(cents per SFR) is calculated for
each quota species based on total
ITQ component of levy payable
for the CTS
Each SESSF quota species
receives a management cost
ranking using weighted
criteria as proxies for species
specific management costs
Total recoverable management
cost for each SESSF fishery (note GHAT sectors are
currently one cost centre)
This ITQ component (cents/SFR per
species) is consistent across SESSF
sectors & represents a baseline
management cost per species
Costs generated by Boat SFR
administration, and an agreed %
of bycatch/TEP & environment
related management costs are
attributed to Boat SFR component
for each sub-sector (method) of
the SESSF
Comprises approximately
86% of total levy
(CTS FY 11-12 example) Comprises approximately 14%
of total Levy for the CTS (using
Budget for FY11-12). For high
impact GHAT sectors it may be
more depending on how much is
collected via the ITQ component
ITQ Component (Tier 2)
Boat SFR Component (Tier 1)
Figure 3: overview of proposed SESSF levy framework

A Revised SESSF Levy Framework – Cobalt MRM Report for AFMA
Page 18
Boat SFR component
is 14% ($390,458)
Cost Inputs to SESSF
Levy
ITQ component is
86% ($2,413,099)
Total recoverable
management cost is
$2,788,987.
30% Fisheries Management
Services (FMS)
70% $763,535 (incl overheads)
30% SEMAC running costs 70% $79,247
0 Logbook Program costs 100% $156,714
30% Data management costs 70% $105,917
0 Licencing and quota
management costs
100% $103,193
0 PISCES and Gofish
amortisation
100% $68,950
20% Observer program costs 80% $325,340
0 Research (RAG,
Administration)
100% $227,665
0 Research projects 100% $871,058
30% Compliance Data
Collection
70% $87,368
Figure 4: Schematic of revised SESSF Levy Framework using CTS FY 2011-12 Budget
Costs attributed to ITQs
owned for each species (cents
per kg per species remains
constant across SESSF sectors
Costs attributed to Boat SFRs
for each AFMA cost
centre/fishery (high impact
methods will pay relatively more
via their Boat SFRs
Total costs recoverable from
SESSF industry sectors
(using FY2011-12 Commonwealth
Trawl Sector Budget)

A Revised SESSF Levy Framework – Cobalt MRM Report for AFMA
Page 19
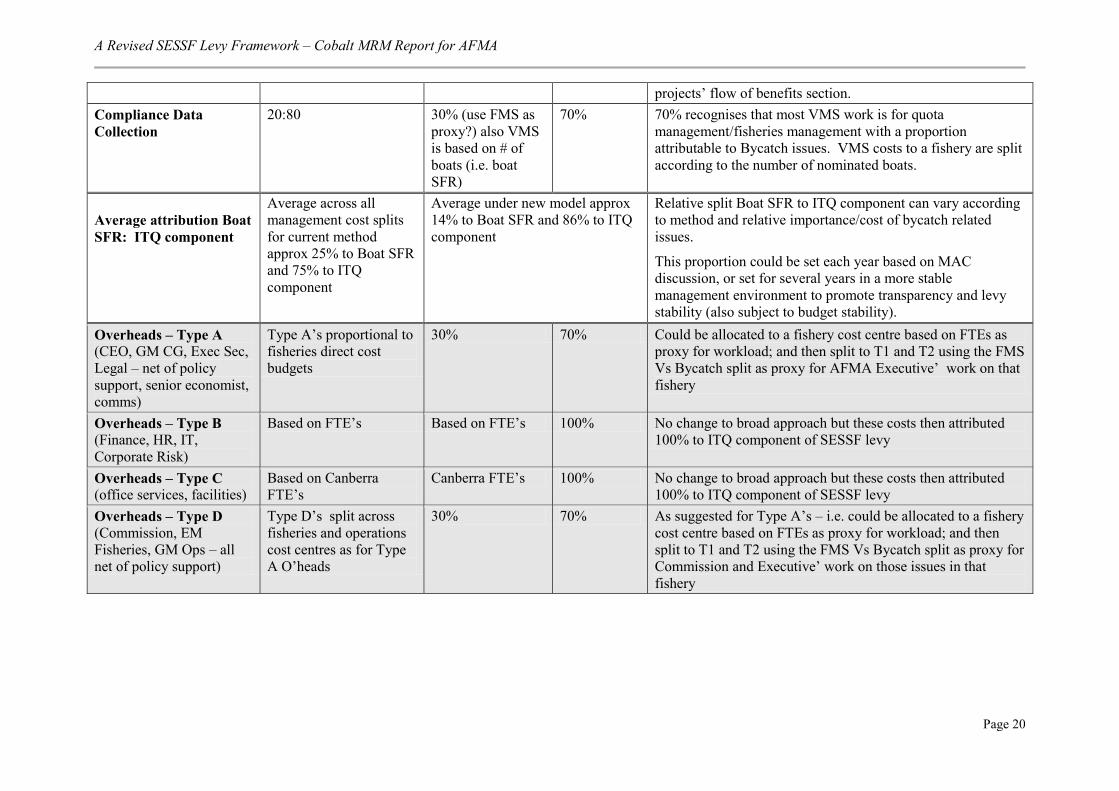
Table 2: New SESSF Levy Framework - attribution of costs to Tier 1 and Tier 2 of the levy.
Proposed SESSF Levy model – attributions to Boat SFR and ITQ components of the levy for major cost activities
Cost Component Previous Model –
proportions used to
calculate ITQ and Boat
SFR components
Proposed - Boat
SFR component
Proposed
ITQ
component
Rationale
Fisheries Management
Services (FMS)
50:50 30% 70% Majority of work (cost) is core fisheries management with a
proportion (30%) attributable to method specific bycatch
issues (i.e. not spread across ITQ component)
SEMAC running costs 0:100 30% 70% As above assuming MAC work is closely related to time/cost
incurred for fisheries management services
Logbook Program costs 50:50 0 100% Majority of these costs are based on core fisheries management
(i.e. primarily quota species management)
Data management costs 50:50 30% 70% Proposed split assumes data support activities are closely
related to proportion of fisheries management services (e.g.
some time for Bycatch/TEP issues, spatial management
development)
Licencing and quota
management costs
30:70 0 100% Costs are almost all attributable to core fisheries management
(i.e. primarily SESSF quota species management)
PISCES and Gofish
amortisation
30:70 0 100% As above
Observer program costs 0:100 20% 80% Majority of work (cost) relates to core fisheries management.
A proportion (20%) relates to bycatch/TEP management.
Specific Bycatch related observer programs may be fee for
service.
Research (RAG,
Administration)
0:100 ( 65% trawl, 25%
GHAT, 10% GAB)
0 100% Research costs are one of the 6 weighted categories used to
estimate the inherent management cost per species that is then
used as the basis for the SESSF ITQ component of the levy.
Research is a high cost activity (e.g. approx 30% of the
recoverable costs for the CTS) and therefore carries the highest
weighting of the 6 activity categories (see Appendix 1.).
Research projects 0:100 (as for research) 0 100% As above (most cost is in stock assessment projects). Guidance
about research beneficiaries is available from an FRDC
A Revised SESSF Levy Framework – Cobalt MRM Report for AFMA
Page 20
projects’ flow of benefits section.
Compliance Data
Collection
20:80 30% (use FMS as
proxy?) also VMS
is based on # of
boats (i.e. boat
SFR)
70% 70% recognises that most VMS work is for quota
management/fisheries management with a proportion
attributable to Bycatch issues. VMS costs to a fishery are split
according to the number of nominated boats.
Average attribution Boat
SFR: ITQ component
Average across all
management cost splits
for current method
approx 25% to Boat SFR
and 75% to ITQ
component
Average under new model approx
14% to Boat SFR and 86% to ITQ
component
Relative split Boat SFR to ITQ component can vary according
to method and relative importance/cost of bycatch related
issues.
This proportion could be set each year based on MAC
discussion, or set for several years in a more stable
management environment to promote transparency and levy
stability (also subject to budget stability).
Overheads – Type A (CEO, GM CG, Exec Sec,
Legal – net of policy
support, senior economist,
comms)
Type A’s proportional to
fisheries direct cost
budgets
30% 70% Could be allocated to a fishery cost centre based on FTEs as
proxy for workload; and then split to T1 and T2 using the FMS
Vs Bycatch split as proxy for AFMA Executive’ work on that
fishery
Overheads – Type B
(Finance, HR, IT,
Corporate Risk)
Based on FTE’s Based on FTE’s 100% No change to broad approach but these costs then attributed
100% to ITQ component of SESSF levy
Overheads – Type C
(office services, facilities)
Based on Canberra
FTE’s
Canberra FTE’s 100% No change to broad approach but these costs then attributed
100% to ITQ component of SESSF levy
Overheads – Type D
(Commission, EM
Fisheries, GM Ops – all
net of policy support)
Type D’s split across
fisheries and operations
cost centres as for Type
A O’heads
30% 70% As suggested for Type A’s – i.e. could be allocated to a fishery
cost centre based on FTEs as proxy for workload; and then
split to T1 and T2 using the FMS Vs Bycatch split as proxy for
Commission and Executive’ work on those issues in that
fishery

A Revised SESSF Levy Framework – Cobalt MRM Report for AFMA
Page 21
Additional Issues for Consideration
Estimating and Recovering Research Costs
Under the existing levy framework, SESSF fisheries research costs (RAGs, stock
assessment research, research administration) are attributed to Tier 2 (ITQ
component). Costs are summed and then apportioned to each sector according to a
previously agreed attribution formula (65% to trawl, 25% to GHAT, 10% to GAB).
More recently there has been a more defined approach for some research costs where
there is a flow of benefits contrary to this default option (e.g. recent Gulper Shark
research costs attributed primarily to SETF and GHAT Auto LL).
The default approach outlined above also makes it more difficult for AFMA to ensure
that any cost savings obtained from research efficiencies are passed to the
beneficiaries of those efficiencies and not diluted across the entire SESSF. For
example, the GABTF has moved to multiyear assessments for some species to reduce
their research costs whilst maintaining an acceptable level of confidence in
assessments. Under the existing framework these efficiencies are not clearly passed
on to the GABTF levy base. This can reduce the incentive for industry to work with
AFMA to identify productivity improvements.
There may also be other areas where fisheries like the GABTF are benefitting from
assessment work on shared species and not paying the appropriate share of those
costs. Western Gemfish assessment costs have been mentioned as an example.
AFMA has also identified an increasing requirement for RAGs to incorporate bycatch
and TEP related research, and work associated with broader EBFM related research
into their work programs. Some of this may be attributable to industry and some to
government in line with CRIS 2010. More detailed policy guidance about how to
apply the CRIS under these circumstances may be appropriate to ensure that costs are
attributed appropriately.
Accurate estimation and attribution of research costs back to species that are then
levied under the ITQ component is complicated by the lack of detailed cost
information per species. This may be addressed by RAGs compiling more accurate
estimates of time spent against SESSF species, and/or stock assessment projects
providing a more detailed breakdown of time/costs per species to assist accurate cost
attribution.
Research costs are a major part (25-30%) of recoverable costs in SESSF fisheries, and
are also a key area for consideration to develop cost efficiencies. They are a cost area
where a more detailed activity based costing approach may be beneficial. If more
accurate data about research costs per species was available, this could be included
directly into the Tier 2 levy-base calculation rather than estimated via the species cost
matrix using HSP tier levels.
Management costs for uncaught species, or those with very low catches
The proposed SESSF levy model uses catch of a quota species to derive the
management cost per SFR for recovery via the Tier 2 component of levy. Some
species, such as Orange Roughy, generate significant recoverable management costs
even though they are not actively fished, or are caught in very small quantities.
These species’ may be attributed with an amount of “catch” sufficient to recover an
appropriate management cost levy via the Tier 2 process - or alternatively have their

A Revised SESSF Levy Framework – Cobalt MRM Report for AFMA
Page 22
catch to SFR conversion rate adjusted such that each SFR collects an amount (when
summed across all SFRs for that species) that recovers an appropriate amount of Tier
2 levy.
Levy stability from year to year
AFMA’s licencing section is currently considering options to reduce variability in
levy payable per fishery/concession from year to year and outcomes from that process
may be suitable for adoption in the SESSF levy process. Unplanned variability
reduces the efficiency of AFMA’s licencing and levy processes, and increases time
spent handling related issues and concerns from industry.
Industry have also expressed concern that AFMA is not well positioned to adapt
promptly to a changing fishing business environment. For example, as fisheries
downsize, catches decline, or additional regulatory restrictions are introduced (e.g.
marine parks), AFMA’s costs may not reduce accordingly. Other concerns centre on
whether projected cost savings from new technology and systems at AFMA (e.g. e-
monitoring) were being realised. Some of these productivity initiatives are relatively
recent and will take time to accrue. AFMA has undertaken to provide evidence of
such savings as soon as it can.
Industry are also concerned that if permit/concession surrenders continue to occur at a
high rate this can dramatically increase levy payable by remaining concession holders.
A revised levy model with a clear and direct relationship to costs and attribution of
those can help however will not directly address this issue. Efforts to reduce
management costs commensurate with reductions in fleets and or catch and effort are
fundamentally important - noting that there will always be a baseline of recoverable
“fixed costs” associated with managing a Commonwealth fishery.
Given accurate cost estimation and attribution, and assuming that “the right work is
being done efficiently”, an emphasis on improved budget forecasting, and fiscal
management within a financial year should significantly reduce unplanned or
unexplained levy variation from year to year. If unplanned and high priority
additional work is generated, and the need to do the work is accepted (i.e. benefits of
doing the work exceed costs), then the work to be done and approximate costs should
be discussed and agreed via MAC consultation, and then carefully managed to
minimise levy impacts.
In light of challenging business circumstances, and concerns about AFMA’s cost
management, industry are opposed to paying an additional amount for budget
contingencies, or to contribute to a levy fund that can help to smooth out levy
variation from year to year. This approach is used in some other industry sectors,
such as AQIS import regulation cost recovery, however the scale of operations is
generally significantly larger than for most fishing businesses.
Linked permits and Boat SFRs
Currently several SESSF permits are linked to other concessions for fisheries
management and levy payment purposes. Accurately determining the historic basis
for these linked permits is outside the scope of this review. Nonetheless it is an
important issue and may require some additional research where the reasons for
linkages are not recorded and readily available within AFMA.
For the new levy model, permits and Boat SFRs should be levied according to the
recoverable costs they generate. Under the proposed model this is largely determined

A Revised SESSF Levy Framework – Cobalt MRM Report for AFMA
Page 23
by the amount of recoverable costs attributed to the Tier 1 or Boat SFR part of the
levy, and then an estimate of management time divided by the number of permits in a
sector. Where there are sound fisheries management or other regulatory reasons for
maintaining linked permits, such that they only pay one levy per concession
“package”, maintaining some linked permits may be appropriate.
This decision requires further consideration, including any prior agreements between
AFMA and other jurisdictions about whether or not to levy permits that are part of a
linked package. This should include consideration of GHAT coastal waters permits
for Tasmania and South Australia.

A Revised SESSF Levy Framework – Cobalt MRM Report for AFMA Appendix 1
Page 24
Appendix 1 - SESSF quota species management cost matrix Table 3: SESSF quota species management cost matrix for determining the levy management cost multiplier (MCM)
SESSF Quota Species & 2011 total catch
(tons)
Cross jurisdiction
management (i.e.
shared TACC, OCS
issues, complexity)
Resource Sharing (i.e.
Vic snapper - important
to Recreational and
Commercial sectors)
Listed sp, TEP/wildlife
interactions and
related work/issues
Broader
Environmental
impacts (trophic,
habitat etc)
Efficiency of Management
system (incl industry
organisations) & higher if
stock rebuilding in place.
Harvest Strategy
Tier Level (T1=4-
5, T3=2-3, T4=1-
2)
weighted
and
summed
scores
score
converted to
management
cost multiplier
Alfonsino - 181t 2 1 2 1 2 3 21.2 1.55
Bight Redfish -350t 1 1 2 1 2 4 22.7 1.66
Blue Eye Trevalla - 354t 2 2 3 1 3 2 22.9 1.67
Blue Grenadier - 4079t 1 1 2 1 2 4 22.7 1.66
Blue Warehou - 96t 1 1 2 1 4 2 19.7 1.44
Deepwater Flathead 1 1 2 1 2 4 22.7 1.66
Deepwater Sharks East - 15t 2 1 4 1 4 2 25.2 1.84
Deepwater Sharks West - see above 2 1 4 1 4 2 25.2 1.84
Elephant Fish - 64t 2 3 3 1 3 2 24.1 1.76
Flathead - 2749t 1 2 2 1 2 5 26.9 1.96
Gemfish (Eastern) 2 1 3 1 4 5 32.2 2.35
Gemfish (Western) - 167t (2010) 1 1 3 1 4 4 27.7 2.02
Gummy Shark - 1416t 2 3 4 1 4 4 33.6 2.45
Jackass Morwong - 418t 2 1 2 1 3 5 28.7 2.09
John Dory - 90t 1 1 2 1 2 2 16.7 1.22
Mirror Dory - 508t 1 1 2 1 2 3 19.7 1.44
Ocean Perch - 231t 1 1 2 1 2 2 16.7 1.22
Orange Roughy (Albany and Esperance) 1 1 2 1 4 4 25.7 1.88
Orange Roughy (Cascade Plateau) 1 1 2 1 2 4 22.7 1.66
Orange Roughy (Eastern) 2 1 2 1 4 4 27.2 1.99
Orange Roughy (Southern) 2 1 2 1 4 4 27.2 1.99
Orange Roughy (Western) 84t (all zones) 1 1 2 1 4 4 25.7 1.88
Oreo smooth - Cascade -2t 1 1 2 1 2 2 16.7 1.22
Oreos (basket) -75t 1 1 2 1 2 2 16.7 1.22
Pink Ling - 1223t 1 1 4 1 2 4 26.7 1.95
Redfish - 91t 1 1 2 1 2 2 16.7 1.22
Ribaldo - 117t 1 1 2 1 2 2 16.7 1.22
Royal Red Prawn 1 1 2 1 2 1 13.7 1.00
Saw Shark 2 1 3 1 3 2 21.7 1.58
School Shark - 156t 2 1 5 1 4 5 36.2 2.64
School Whiting - 355t 2 1 2 1 2 4 24.2 1.77
Silver Trevally - 175 2 3 2 1 3 4 28.1 2.05
Silver Warehou - 1009t 1 1 2 1 2 4 22.7 1.66
Smooth Oreos (Cascade Plateau) 1 1 2 1 2 2 16.7 1.22
Weighting applied per category 1.5 1.2 2 1 1.5 3
Attributes/scores relate to the inherent complexity/cost of managing these SESSF quota species. Each species is scored from 1 (lowest time) to 5 (most time) spent on each activity area
(attribute). Matrix provides an estimate of the relative inherent management cost per species (i.e. this cost does not include additional management costs for species (e.g. Gummy Shark) taken by
methods with greater TEP and/or environmental impacts (e.g. Gillnet currently).

A Revised SESSF Levy Framework – Cobalt MRM Report for AFMA Appendix 1
Page 25
Description of the Management Cost Matrix10
Cost Driver Relevance & Comments
1. Cross jurisdiction
management (i.e. shared
TACC, OCS issues,
complexity)
Category picks up time/cost generated by issues like shared TAC
discussions/negotiations, and OCS related discussions that
complicate management of a species and add cost. Includes
international/regional straddling stocks. Scoring should recognise
the relative impact of this driver on range of SESSF quota species
on which Tier 2 levy is payable. Scores are weighted by 1.5
(moderate)
2. Resource sharing Category picks up time/costs associated with management issues
related to resource sharing between commercial/recreational and/or
indigenous sectors. This is a relatively minor issue for SESSF
fisheries currently (excepting recent Vic/C’wealth Snapper issues)
and this category could be combined into 1. above if required.
Scores are weighted by 1.2 (low).
3. Listed Species and/or
TEP interactions &
related work/issues
Category picks up work/cost associated with TEP interactions
driven by fishing for the species in question. This can be a very
significant driver of management cost across a range of
management activities (i.e. data management costs as a result of
development of GIS based maps for spatial management of TEP
interactions). Scores are weighted by 2 (moderate-high).
4. Broader environmental
impacts (i.e. trophic
importance, habitat
impacts etc)
Category picks up work/cost associated with a species’ trophic
importance and perceptions/facts about how the ecosystem is
impacted by fishing, including broader habitat impacts and how
that fishing should be managed to meet AFMA’s EBFM
objectives. An example (non SESSF but related) could be the
substantial work initiated by stakeholder concerns about ecological
impacts of a large factory vessel trawling for small pelagic species
off Tasmania. Scores are weighted by 1 (low).
5. Harvest Strategy Tier Category picks up research costs (stock assessment projects,
research administration, and broader research projects). This is a
significant cost driver (25-30% of recoverable costs) and is
complicated by lack of detailed cost data per species. The matrix
is an attempt to cost effectively estimate and attribute these costs
based on data that is currently available (HSP tier levels) as a
proxy for true costs. Scores are weighted by 3 (high).
10
Categories and scores have been reviewed by SESSF staff for initial model development. They are a key driver for
Tier 2 levy attribution and should be critically reviewed prior to each new levy cycle.

A Revised SESSF Levy Framework – Cobalt MRM Report for AFMA Appendix 2
Page 26
Appendix 2 - Example of revised SESSF levy model and explanatory notes Table 4: copy of base model to determine Tier 2 levies for SESSF quota species
Quota species
2011 trawl
catch in kg
Management
cost multiplier
weighted
catch kg
$ per species
total
New $ per
SFR
$ SFR for
old model
2011
conversion
factor for
SFRs
% of total
trawl
catch kg
2011 attributed
trawl SFRs based
on CTS/GHAT
catch splits
2011 attributed
GHAT SFRs based
on CTS/GHAT
catch splits
2011 GHAT
catch SFRs
Total
allocated
SFRs
Trawl T2 $
collected
T2 $ collected
from "GHAT"
catch
Total $
collected
Alfonsino 179,881 1.55 278,356 $ 34,227.18 $ 0.05 $ - 0.996 2% 745,550 7,427 1,799 752,977 33,889.58$ 337.59$ 34,227.18$
Blue eye trevalla - 1.67 - $ - $ - $ 0.12 0.4131 0% 53,854 734,800 799,675 788,654 -$ -$ -$
Blue grenadier 4,047,809 1.66 6,706,954 $ 824,699.60 $ 0.17 $ 0.11 0.9081 36% 4,945,271 5,567 5,046 4,950,838 823,772.18$ 927.42$ 824,699.60$
Blue warehou 91,445 1.44 131,494 $ 16,168.74 $ 0.01 $ 0.03 0.0557 1% 2,279,774 105,081 76,333 2,384,855 15,456.31$ 712.42$ 16,168.74$
Deepwater shark basket east 69,783 1.84 128,360 $ 15,783.38 $ 0.07 $ - 0.3685 1% 207,512 9,569 8,732 217,081 15,087.63$ 695.75$ 15,783.38$
Deepwater shark basket west - 1.84 - $ - $ - $ - 0.5312 0% 259,750 - 259,750 -$ -$ -$
Elephant fish 28,010 1.76 49,273 $ 6,058.71 $ 0.07 $ 0.09 0.9634 0% 40,073 52,303 38,043 92,376 2,628.27$ 3,430.44$ 6,058.71$
Flathead 2,744,314 1.96 5,388,471 $ 662,576.45 $ 0.23 $ 0.17 0.9298 24% 2,939,432 791 794 2,940,223 662,398.24$ 178.21$ 662,576.45$
Gemfish east 127,577 2.35 299,853 $ 36,870.43 $ 0.19 $ 0.07 0.5028 1% 178,395 20,460 29,096 198,855 33,076.85$ 3,793.58$ 36,870.43$
Gemfish west (SET) - 2.02 - $ - $ - $ 0.05 0.3291 0% 285,607 - 285,607 -$ -$ -$
Gummy shark 2.45 - $ - $ - $ 0.27 0.7675 0% 246,202 1,990,241 1,642,332 2,236,443 -$ -$ -$
Jackass morwong 382,927 2.09 802,190 $ 98,638.80 $ 0.07 $ 0.05 0.3243 3% 1,359,743 6,017 5,673 1,365,760 98,204.25$ 434.55$ 98,638.80$
John dory 87,905 1.22 107,154 $ 13,175.89 $ 0.06 $ 0.17 1.075 1% 204,844 51 21 204,895 13,172.61$ 3.28$ 13,175.89$
Mirror dory 507,482 1.44 729,737 $ 89,729.82 $ 0.13 $ 0.08 1.0623 5% 673,190 20 14 673,210 89,727.19$ 2.63$ 89,729.82$
Ocean perch 192,365 1.22 234,489 $ 28,833.17 $ 0.10 $ 0.08 0.9969 2% 258,006 40,908 31,723 298,914 24,887.19$ 3,945.98$ 28,833.17$
Orange roughy cascade zone 84,557 1.66 140,105 $ 17,227.62 $ 0.01 $ 0.02 0.3318 1% 1,506,641 - 1,506,641 17,227.62$ -$ 17,227.62$
Orange roughy eastern zone - 1.99 - $ - $ - $ 0.00 0.0034 0% 725,451 - 7,254,511 -$ -$ -$
Orange roughy southern zone - 1.99 - $ - $ - $ 0.00 0.0047 0% 735,633 - 7,356,328 -$ -$ -$
Orange roughy western zone - 1.88 - $ - $ - $ 0.00 0.0413 0% 145,090 - 1,450,898 -$ -$ -$
Oreo basket, other 74,398 1.16 86,635 $ 10,652.74 $ 0.02 $ - 0.1993 1% 564,422 - 564,422 10,652.74$ -$ 10,652.74$
Oreo smooth cascade - 1.22 - $ - $ - $ - 0.4796 0% 312,758 - 312,758 -$ -$ -$
Oreo smooth other 1,631 1.22 1,988 $ 244.47 $ 0.00 $ - 0.3264 0% 137,834 - 137,834 244.47$ -$ 244.47$
Pink ling 749,650 1.95 1,460,997 $ 179,646.90 $ 0.20 $ 0.22 1.333 7% 554,152 340,688 349,212 894,840 111,250.76$ 68,396.14$ 179,646.90$
Redfish 91,582 1.22 111,636 $ 13,727.03 $ 0.03 $ 0.00 0.5676 1% 472,589 1,309 447 473,898 13,689.10$ 37.93$ 13,727.03$
Ribaldo 48,696 1.22 59,359 $ 7,298.94 $ 0.03 $ - 0.6481 0% 115,041 143,852 100,445 258,893 3,243.34$ 4,055.59$ 7,298.94$
Royal red prawn 128,247 1.00 128,247 $ 15,769.49 $ 0.04 $ 0.03 0.7929 1% 382,098 - 382,098 15,769.49$ -$ 15,769.49$
Sawshark 88,564 1.58 140,280 $ 17,249.12 $ 0.05 $ 0.15 0.6515 1% 182,725 164,154 143,109 346,879 9,086.32$ 8,162.80$ 17,249.12$
School shark 2.64 - $ - $ - $ 0.12 0.3791 0% 52,133 412,009 365,565 464,142 -$ -$ -$
School whiting 355,688 1.77 628,296 $ 77,256.40 $ 0.04 $ 0.02 0.3159 3% 2,024,991 - 2,024,991 77,256.40$ -$ 77,256.40$
Silver trevally 165,701 2.05 339,868 $ 41,790.87 $ 0.09 $ 0.04 1.162 1% 463,550 278 90 463,828 41,765.83$ 25.04$ 41,790.87$
Spotted (silver) warehou 1,008,508 1.66 1,671,032 $ 205,473.17 $ 0.21 $ 0.16 2.605 9% 981,671 132 52 981,803 205,445.58$ 27.58$ 205,473.17$
Total 11,256,720 19,624,773 2,413,098.90$ 100% 2,317,931.97$ 95,166.93$ 2,413,098.90$
Combined Trawl (excl GAB)
Tier 2 recoverable costs 2,413,098.90$
Notes: previous years trawl catch in kg is entered. This is multiplied by the per species management cost multiplier (from management cost matrix - sheet 1) to give a weighted
catch amount. The weighted catch for each species as a proportion of the sum of weighted catch for all species provides the share of total recoverable Tier 2 management costs
attributable to that species (this gives the total $ amount per species to be collected - Col E). This amount is then divided by the total number of SFRs allocated for the species
to provide the cents/SFR amount that is the basis for the T2 levy per species. The catch shares for trawl and GHAT respectively (sheet 4) are then used to determine the
amount of T2 levy per species collected for each budget (GHAT or Trawl). The balance of recoverable costs (those not collected via the tier 2 process) are then collected via the
Boat SFR or Permit levies applicable to each fishery/method (sheet 6).

A Revised SESSF Levy Framework – Cobalt MRM Report for AFMA Appendix 2
Page 27
Description of key components of the proposed SESSF Levy Model
Component Relevance & Comments
1. Trawl catch in
Kilograms
Derived from the best available catch data for the most recent
fishing season. These data are used to determine the management
cost per species, acknowledging that active catch in the fishery is
more relevant to determining management cost per species than
total number of SFRs allocated for a fishery (many of which may
be uncaught and have significantly less influence on management
costs than actual catch).
2. Management Cost
Multiplier (MCM)
Derived from the management cost matrix at Appendix 1. An
estimate of the inherent management cost of each species for levy
purposes.
3. Weighted catch in kg Derived from the catch in kg of a species multiplied by the MCM
estimated for that species.
4. $ per species total Derived by dividing the weighted catch in kg for a species by the
sum of all species’ weighted catch values; and then multiplying
this by the total recoverable Tier 2 cost for the combined SESSF
trawl fisheries (ECDWT, CVIT, CTS). This gives an amount ($)
to be recovered - representing the species specific proportion of
tier 2 costs for each quota species.
5. New $ per SFR Each SESSF quota species proportion of total recoverable T2 costs
is then divided by the total number of SFRs allocated for that
species to derive the cents per SFR value which is the basis of the
T2 levy payable for quota owners.
6. 2011 Conversion Factor
for SFRs
The conversion factor is the ratio of kg of catch to the number of
SFRs for that species. Derived from TAC and the number of SFRs
allocated for that species.
7. 2011 attributed
trawl/GHAT SFRs
based on catch splits
The most recent catches for all SESSF quota species are
proportioned to Trawl and GHAT fisheries respectively. This
catch proportion is then used to divide the total number of SFRs
into an assumed Trawl catch and GHAT catch to estimate the
amount of T2 levy collected against each of these fishery budgets.
8. T2 $ collected from
Trawl or GHAT catch
This is the $ amount assumed to be collected by attributing catch
to a sector to cover all of the SFRs on which levy must be
collected - as described above.

A Revised SESSF Levy Framework – Cobalt MRM Report for AFMA Appendix 3
Page 28
Appendix 3 - Summary of Project Consultation
Consultation to assist development of the revised SESSF levy model
Consultation type Description
Internal AFMA
consultation
This was used to scope and plan the project approach; prompt consideration
of key design principles for the revised levy model; and assist with
development and critique of options. An internal consultation document was
prepared and distributed to relevant sections within AFMA (primarily
Fisheries Branch and Service One/Licencing). Internal consultation also
served to raise AFMA awareness of the issues and risks associated with the
current approach, and staff understanding of key levy issues and cost
recovery principles.
SEMAC consultation A discussion paper canvassing issues, principles and options for the revised
levy model was prepared and circulated at the SEMAC meeting on 25 May
2012. A presentation and discussion session was also undertaken. SEMAC
expressed its general support for the principles, design criteria and
preliminary options covered at this meeting (several members were absent).
A record of the discussion is available from the SEMAC Chair’s Summary
for that meeting.
SEMAC Levy
Working Group
(LWG) consultation
The AFMA/Industry LWG was previously set up by AFMA to assist with
revision of the levy model. Membership was expanded slightly to
accommodate sectoral representatives that had shown strong interest and
made valuable contributions. In addition to one on one telephone
conversations with LWG members throughout the project, the contractor
facilitated a detailed discussion of the proposed approach at the LWG
meeting at Melbourne Airport on 11 July 2012 (Chaired by AFMA). Gerry
Geen - Seafish Tasmania, and Dale Sumner - LEFCOL gave their apologies.
Mike Rowley - Fortuna Fishing was unable to be contacted. Participants at
the Melbourne meeting were:
Brad Milic AFMA - A/g SESSF Senior Manager - Chair
Andrew Powell - AFMA Licencing Manager
Andy Bodsworth - Cobalt MRM - contractor
Simon Boag - SETFIA
Leigh Chambers - SA GHAT Fisher - Ex Scalefish Hook SFR Owner
Brian Bailey - Shark Fishing Industry Association
Robyn Gerrity - Tasmanian Scalefish Hook sector representative
Anthony Cicconte - quota owner and concession holder for various
GHAT concessions - primarily Gummy Shark
Les Scott - Petuna Sealord, quota owner and owner of various GHAT
and CTS concessions, including blue grenadier trawl and auto longline.
SESSF Concession
Holders
Broader consultation with SESSF concession holders that will be impacted
by the revised levy approach is recommended. This could be facilitated by
sending concession holders an abridged and updated version of the
discussion paper used for the 11 July LWG meeting.


