
2
A. SCOPE OF OUR ENGAGEMENT
We have been instructed by Greenpeace Switzerland, Badenerstrasse 171, 8036 Zürich, Switzerland (“Greenpeace”) to conduct an objective and
independent review of data provided by ISS Ethix, Bleicherweg 10, 8002 Zurich, Switzerland (“ISS Ethix”) with respect to selected companies from loan
portfolios of Credit Suisse Group AG (“CS”) and UBS Group AG (“UBS”); (the “Report”).
I. Scope of our Report
The Report is based on certain data provided by ISS Ethix via e-mail, dated 2nd November 2018 (“ISS Ethix Data”) and it is subject to certain general
limitations of the scope of review and assumptions (see A. III.).
II. ISS Ethix Data
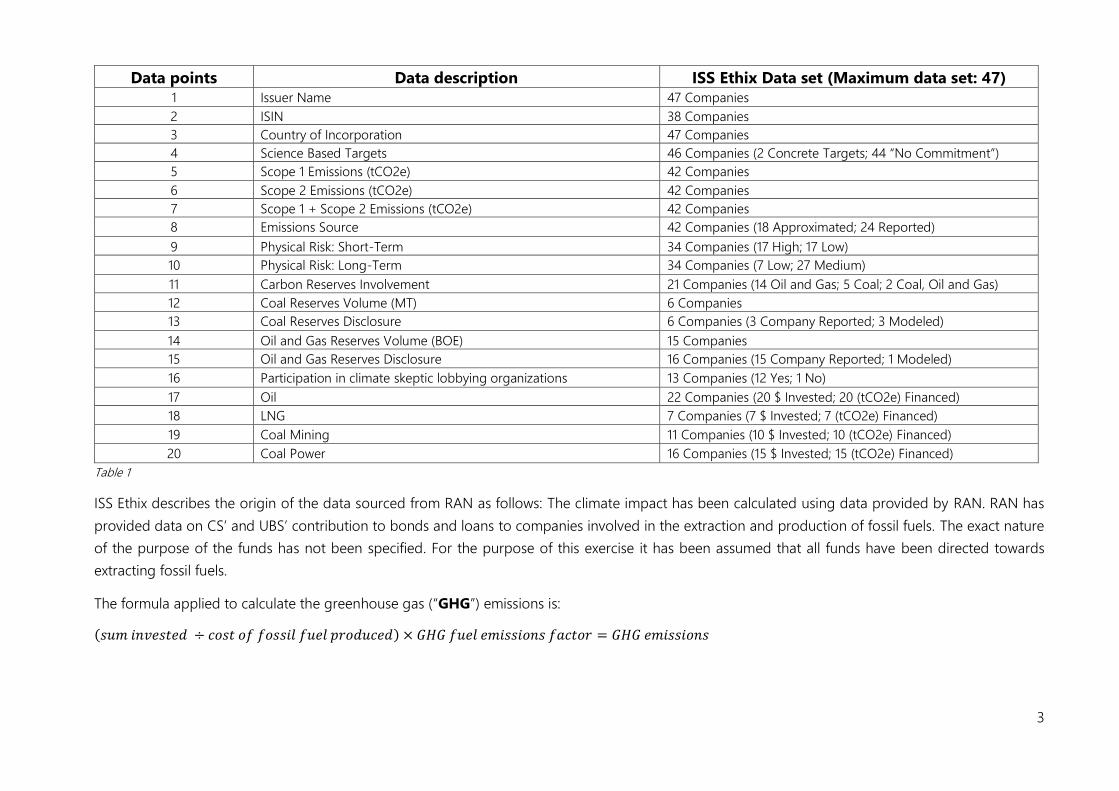
We have been provided with ISS Ethix Data. The ISS Ethix Data consists of 47 data sets for 47 companies.
ISS Ethix had agreed to respond to our questions in a questions and answers process (“Q&A Process”).
Our review covers the status of ISS Ethix Data as provided until 19th November 2018.
ISS Ethix provided data on (i) climate impact based on financed emissions and (ii) other data points relevant for this Report. Whereas data on financed
emissions were sourced from the Rainforest Action Network (“RAN”)1 by ISS Ethix, other data points were provided directly by ISS Ethix.
1 A detailed methodology of the calculation of financed emissions by a single bank can be found here: https://www.ran.org/bankingonclimatechange2018/#data-panel. right. assumes the
correctness of the data and has not put the calculation methodology under scrutiny.
3
Data points Data description ISS Ethix Data set (Maximum data set: 47)
1 Issuer Name 47 Companies
2 ISIN 38 Companies
3 Country of Incorporation 47 Companies
4 Science Based Targets 46 Companies (2 Concrete Targets; 44 “No Commitment”)
5 Scope 1 Emissions (tCO2e) 42 Companies
6 Scope 2 Emissions (tCO2e) 42 Companies
7 Scope 1 + Scope 2 Emissions (tCO2e) 42 Companies
8 Emissions Source 42 Companies (18 Approximated; 24 Reported)
9 Physical Risk: Short-Term 34 Companies (17 High; 17 Low)
10 Physical Risk: Long-Term 34 Companies (7 Low; 27 Medium)
11 Carbon Reserves Involvement 21 Companies (14 Oil and Gas; 5 Coal; 2 Coal, Oil and Gas)
12 Coal Reserves Volume (MT) 6 Companies
13 Coal Reserves Disclosure 6 Companies (3 Company Reported; 3 Modeled)
14 Oil and Gas Reserves Volume (BOE) 15 Companies
15 Oil and Gas Reserves Disclosure 16 Companies (15 Company Reported; 1 Modeled)
16 Participation in climate skeptic lobbying organizations 13 Companies (12 Yes; 1 No)
17 Oil 22 Companies (20 $ Invested; 20 (tCO2e) Financed)
18 LNG 7 Companies (7 $ Invested; 7 (tCO2e) Financed)
19 Coal Mining 11 Companies (10 $ Invested; 10 (tCO2e) Financed)
20 Coal Power 16 Companies (15 $ Invested; 15 (tCO2e) Financed)
Table 1
ISS Ethix describes the origin of the data sourced from RAN as follows: The climate impact has been calculated using data provided by RAN. RAN has
provided data on CS’ and UBS’ contribution to bonds and loans to companies involved in the extraction and production of fossil fuels. The exact nature
of the purpose of the funds has not been specified. For the purpose of this exercise it has been assumed that all funds have been directed towards
extracting fossil fuels.
The formula applied to calculate the greenhouse gas (“GHG”) emissions is:
(𝑠𝑢𝑚 𝑖𝑛𝑣𝑒𝑠𝑡𝑒𝑑 ÷ 𝑐𝑜𝑠𝑡 𝑜𝑓 𝑓𝑜𝑠𝑠𝑖𝑙 𝑓𝑢𝑒𝑙 𝑝𝑟𝑜𝑑𝑢𝑐𝑒𝑑) × 𝐺𝐻𝐺 𝑓𝑢𝑒𝑙 𝑒𝑚𝑖𝑠𝑠𝑖𝑜𝑛𝑠 𝑓𝑎𝑐𝑡𝑜𝑟 = 𝐺𝐻𝐺 𝑒𝑚𝑖𝑠𝑠𝑖𝑜𝑛𝑠
4
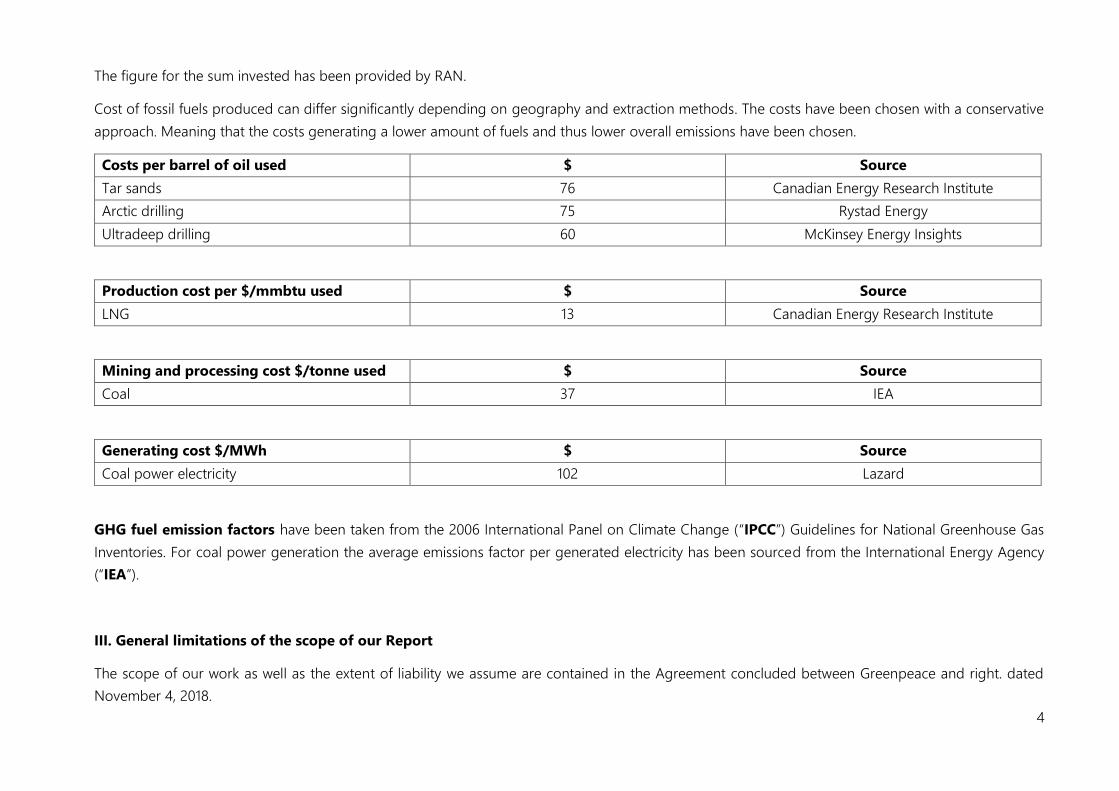
The figure for the sum invested has been provided by RAN.
Cost of fossil fuels produced can differ significantly depending on geography and extraction methods. The costs have been chosen with a conservative
approach. Meaning that the costs generating a lower amount of fuels and thus lower overall emissions have been chosen.
Costs per barrel of oil used $ Source
Tar sands 76 Canadian Energy Research Institute
Arctic drilling 75 Rystad Energy
Ultradeep drilling 60 McKinsey Energy Insights
Production cost per $/mmbtu used $ Source
LNG 13 Canadian Energy Research Institute
Mining and processing cost $/tonne used $ Source
Coal 37 IEA
Generating cost $/MWh $ Source
Coal power electricity 102 Lazard
GHG fuel emission factors have been taken from the 2006 International Panel on Climate Change (“IPCC”) Guidelines for National Greenhouse Gas
Inventories. For coal power generation the average emissions factor per generated electricity has been sourced from the International Energy Agency
(“IEA”).
III. General limitations of the scope of our Report
The scope of our work as well as the extent of liability we assume are contained in the Agreement concluded between Greenpeace and right. dated
November 4, 2018.
5
Our review is based on ISS Ethix Data.
We are under no obligation to update the Report or advise you of any development or circumstance of any kind including any regulatory change or fact
that occurs after the date hereof, even if such developments or circumstances may affect conclusions or any matter set forth in or relating to this Report.
This Report contains information of a general and high-level nature. It does not intend to provide, nor should it be relied upon as, investment advice,
financial advice or legal advice in respect of any jurisdiction.
In translating German terms into English, we have used expressions which, in our opinion, most closely reflect the original term. We are not official
translators and do not accept responsibility for any differences in meaning or inferences that can be made of such terms in English.
IV. Assumptions
In connection with this Report, please note the following:
• The accuracy of this Report is necessarily dependent on disclosed ISS Ethix Data, and the replies to further information requests, being true,
complete, accurate and not misleading.
• We have not carried out a review of other publicly available sources and have not verified the accuracy or authenticity of ISS Ethix Data and
information provided or independently researched the facts and/or circumstances. We assume the provided ISS Ethix Data to be accurate and up
to date.
6
B. PERMITTED RECIPIENTS AND OTHER THIRD PARTIES
Generally, this Report has been prepared for the use of Greenpeace only. However, the Report and its derived results shall be published and disclosed
objectively. In the event of queries about the methodology and its use on behalf of third parties we request the Report be made available upon request.
C. LIMITATION OF LIABILITY
In accordance with the Agreement between Greenpeace and right., right.’s total liability shall be limited to the fees paid by Greenpeace.
Any requests regarding this Report shall exclusively be addressed to
Hannah Helmke
right. based on science UG (haftungsbeschränkt)
Intzestraße 1, 60314 Frankfurt am Main (Germany)
Phone: +49 (0) 221 29105326
Frankfurt am Main, 19th November 2018
Copyright ©
right. based on science UG (haftungsbeschränkt), November 2018
7
Foreword
right. based on science (“right.”) is a data provider, which combines insights from climate science with economic data to create science-based climate
metrics. These metrics enable stakeholders of e.g. a certain company to understand the impact this company has on climate change and the exposure of
this company to climate-related risks.
right.’s mission is to increase transparency on climate-related risks and opportunities within the market to better steer capital into futureproof activities.
right.’s work consists of generating objective and integer facts about the impact and the exposure of an economic entity towards climate change. It shall
serve as a solid base for the full variety of stakeholders to express and probe their strategies to tackle the broad challenges that lie within the climate
change phenomenon. right. will not judge about the effectiveness and the appropriateness of different strategies and believes that a solid and transparent
data base of any strategy supports the strength, with which workable solutions for climate-related issues can be found.
Hannah Helmke
Founder and CEO
Authors: Hannah Helmke, Dr. Hans-Peter Hafner, Roman Herzog and Fabian Gebert.
8
Table of Content
Part 1: Analysis of financed activities ............................................................................................................................................................................................................. 9
A. Executive Summary ............................................................................................................................................................................................................................... 9
B. Analysis.................................................................................................................................................................................................................................................. 10
I. Investments for each financed activity between 2015 and 2017................................................................................................................................................. 10
II. Total emissions financed for each financed activity between 2015 and 2017 ......................................................................................................................... 14
III. Emissions financed in relation to company-specific reserves .................................................................................................................................................... 18
IV. Emissions financed in relation to involvement in climate-sceptic lobbying ........................................................................................................................... 19
V. Emissions financed in relation to companies having set a Science Based Target ................................................................................................................... 21
VI. Emissions financed in relation to the companies’ exposure to physical risks ........................................................................................................................ 22
Part 2: Climate Performance ...................................................................................................................................................................................................................... 27
A. Executive Summary ................................................................................................................................................................................................................................. 27
B. The XDC Model ........................................................................................................................................................................................................................................ 27
I. The XDC Metric ..................................................................................................................................................................................................................................... 27
II. Output of the XDC Model .................................................................................................................................................................................................................. 28
III. Validation of the XDC Model ........................................................................................................................................................................................................... 28
IV. Input data for this Report ................................................................................................................................................................................................................. 28
C. Analysis ...................................................................................................................................................................................................................................................... 29
I. Climate Performance of financed emissions ................................................................................................................................................................................... 29
II. Climate Performance of the company’s fossil fuel reserves ........................................................................................................................................................ 30
III. Standard XDC and Sector Target XDC ............................................................................................................................................................................................ 30
IV. Financed Emissions in relation to Standard XDC.......................................................................................................................................................................... 33
9
An analysis of extreme fossil fuel emissions
financed by CS and UBS
Banks play an important role in society’s adjustments to climate change.
They do this through financing and investment decisions, credit risk
management policies and lending practices and the development of risk-
mitigation products. Thereby they can take an active role in mastering
the transition to a <2°C world. While most banks communicate their
willingness to support this transition, there is a lack of transparency
regarding the actual strength, with which they put words into action.
Ongoing financing of extreme fossil fuel activities by banks might stand
in contrast to communicated commitments to financing the
development of a low-carbon economy.
In order to better grasp whether the contribution of banks to reaching
climate targets is significant, the concept of “financed emissions” is
helpful. “Financed emissions” are those emissions, which are associated
with lending and investments.
This Report provides a quantitative analysis of the emissions financed by
the Swiss banks CS and UBS resulting from lending money to companies
engaged in extreme fossil fuel activities. Part one of the Report provides
a quantitative and descriptive overview of financed emissions relating to
extreme fossil fuels by the two banks. Part two introduces science-based
climate metrics as complementary sources of information to better put
quantitative results, such as those generated in part one, into context..
Part 1: Analysis of financed activities
A. Executive Summary
Both banks in sum have provided slightly less finance to extreme fossil
fuel activities in 2017 than in 2015. Whereas UBS decreased financing such
activities between 2015 and 2017 in absolute terms, CS increased absolute
financing between 2015 and 2017. The decline at UBS is the consequence
of constantly reduced financing of oil, coal power and coal mining. The
increase at CS mainly results from a steep increase of financing coal
mining from 2016 to 2017.
Especially striking is a sharp decrease in financing LNG by CS between
2015 and 2017 and a sharp increase in finance provide by CS to coal
mining activities between 2016 and 2017.
Financed emissions by both banks in sum steeply increased between
2015 and 2017. Whereas UBS is financing fewer absolute emissions in
2017 than in 2015, emissions financed by CS more than tripled between
2015 and 2017. This increase of financed emissions is the result of a steep
increase of financing coal mining from 2016 to 2017.
The analysis of ISS Ethix Data did not find any correlation between the
amount of reserves a company has and the amount of financed
emissions resulting from financing activities by CS and UBS.
The biggest share of finance by CS and UBS was provided to companies,
of which there is no data on whether they engage in climate sceptic
lobbying.
2.88% of finance provided within the period of 2015 until 2017 went to
companies that had set themselves a Science Based Target (“SBT”).
10
The analysis of ISS Ethix Data revealed a strong increase in the share of
finance provided to companies between 2015 and 2017 with a high
exposure to short-term physical risk. The share of finance provided to
companies with medium exposure to long-term physical risk slightly
declined for the same period of time.
B. Analysis
Both CS and UBS are lending money to companies engaged in exploring
and producing fossil fuels. This part describes these financing activities
and quantifies the emissions corresponding to such projects. The
following results were determined by summing up investments and
financed emissions across each category assessed for each bank
separately and for both banks together.
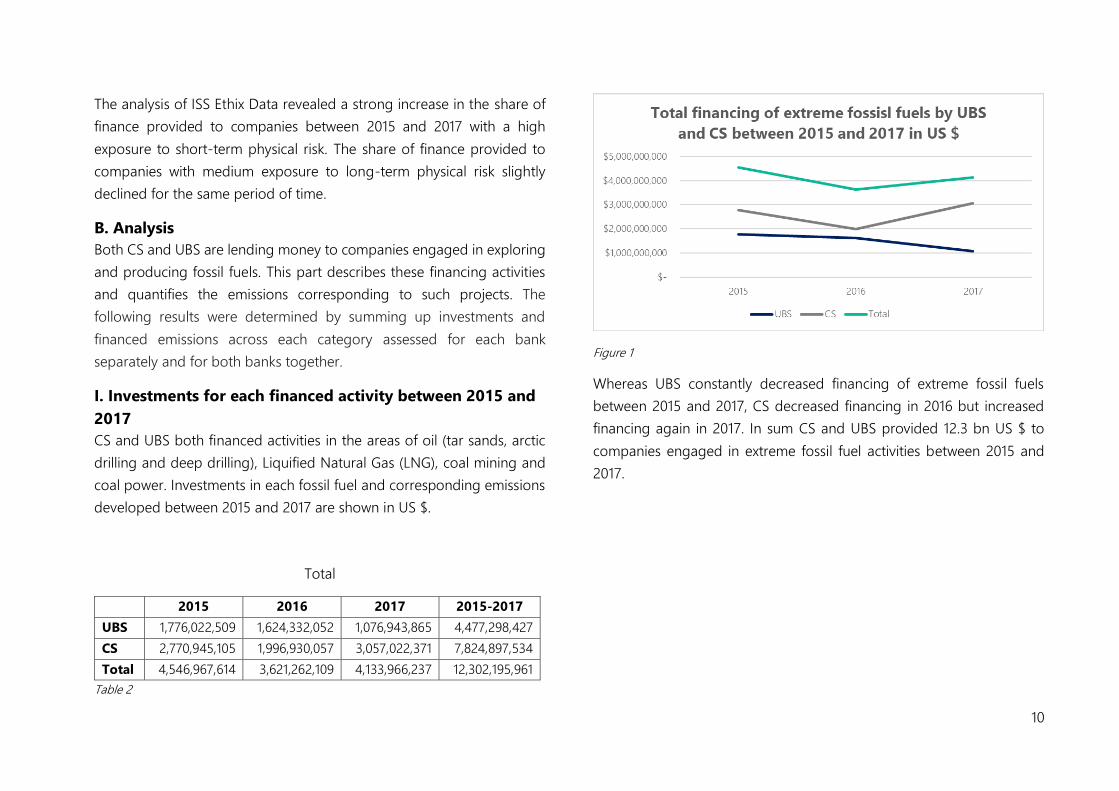
I. Investments for each financed activity between 2015 and
2017
CS and UBS both financed activities in the areas of oil (tar sands, arctic
drilling and deep drilling), Liquified Natural Gas (LNG), coal mining and
coal power. Investments in each fossil fuel and corresponding emissions
developed between 2015 and 2017 are shown in US $.
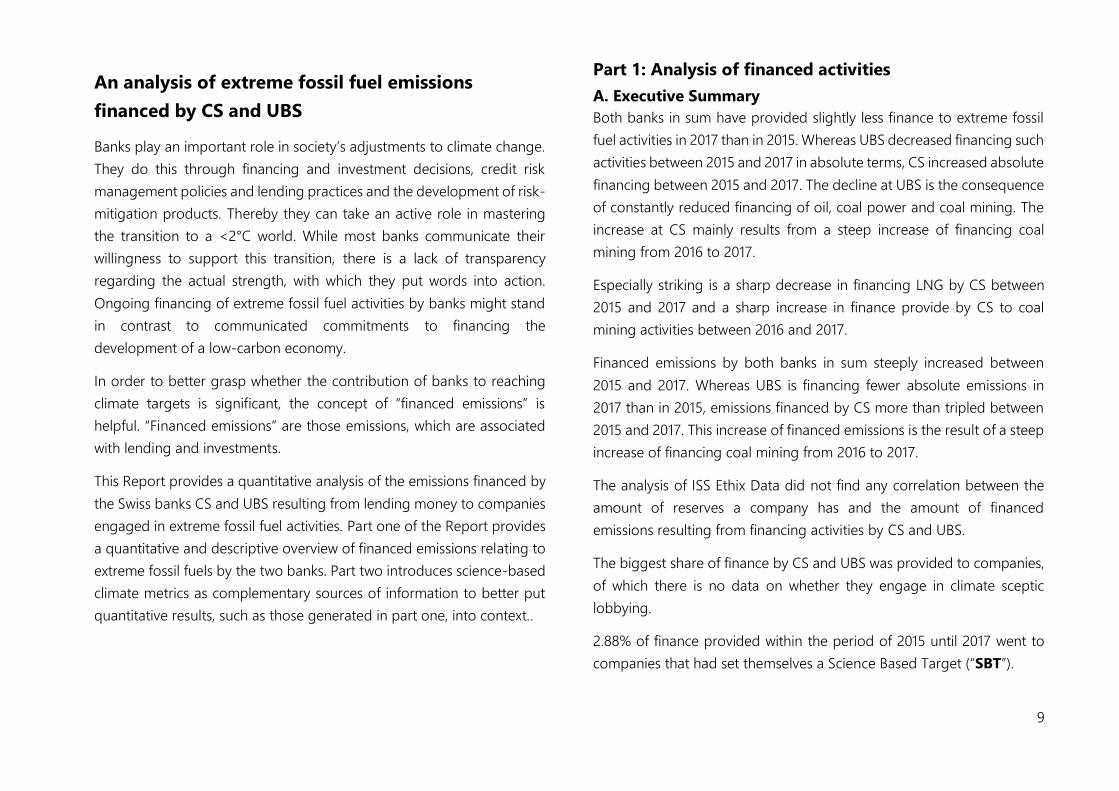
Total
2015 2016 2017 2015-2017
UBS 1,776,022,509 1,624,332,052 1,076,943,865 4,477,298,427
CS 2,770,945,105 1,996,930,057 3,057,022,371 7,824,897,534
Total 4,546,967,614 3,621,262,109 4,133,966,237 12,302,195,961
Table 2
Figure 1
Whereas UBS constantly decreased financing of extreme fossil fuels
between 2015 and 2017, CS decreased financing in 2016 but increased
financing again in 2017. In sum CS and UBS provided 12.3 bn US $ to
companies engaged in extreme fossil fuel activities between 2015 and
2017.
11
Figure 2
Figure 3
Figure 4
Figure 5
12
Oil
2015 2016 2017 2015-2017
Tar Sands
UBS 102,189,544 76,344,466 43,010,937 221,544,948
CS 205,176,563 106,323,459 542,882,972 854,382,995
Total 307,366,108 182,667,925 585,893,909 1,075,927,944
Arctic Drilling
UBS 3,603,869 11,000,091 3,716,215 18,320,176
CS 21,748,671 10,075,906 3,716,215 35,540,792
Total 25,352,540 21,075,998 7,432,430 53,860,968
Deep Drilling
UBS 335,382,436 165,568,295 192,596,059 693,546,791
CS 216,628,321 265,495,935 93,967,871 576,092,128
Total 552,010,758 431,064,230 286,563,930 1,269,638,920
Oil Total
UBS 441,175,850 252,912,853 239,323,212 933,411,916
CS 443,553,556 381,895,301 640,567,058 1,466,015,916
Total 884,729,407 634,808,154 879,890,270 2,399,427,833
Table 3
13
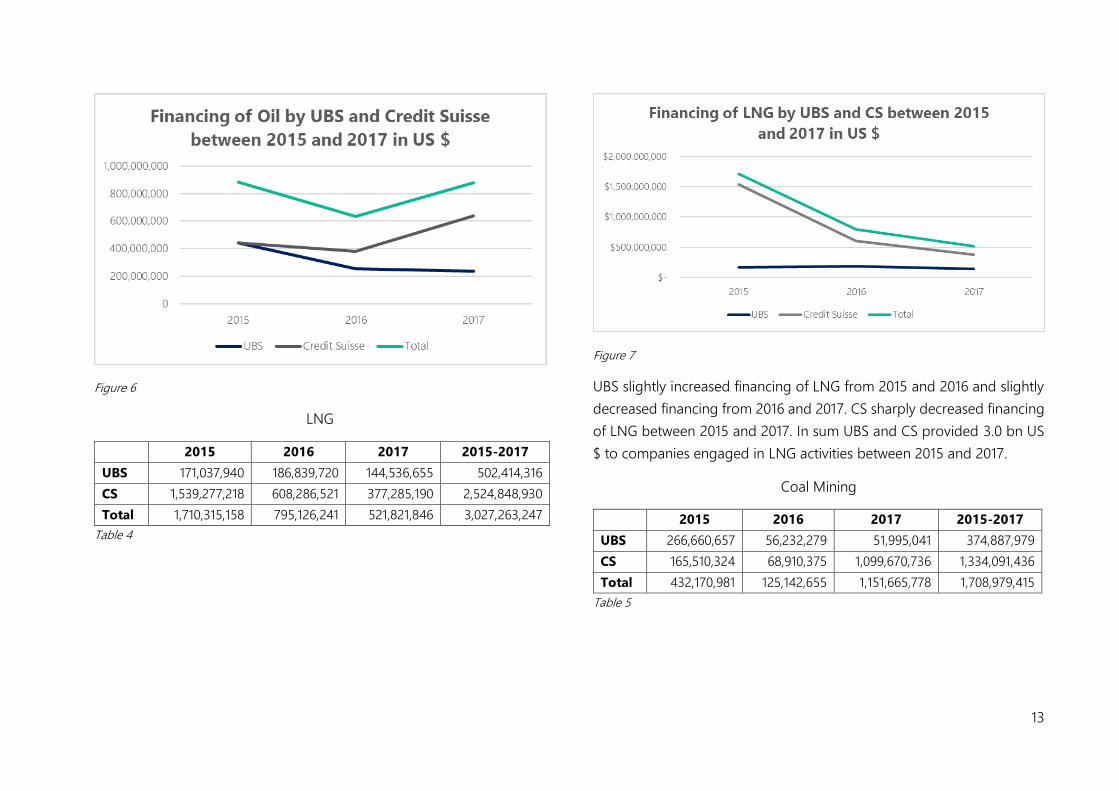
Figure 6
LNG
2015 2016 2017 2015-2017
UBS 171,037,940 186,839,720 144,536,655 502,414,316
CS 1,539,277,218 608,286,521 377,285,190 2,524,848,930
Total 1,710,315,158 795,126,241 521,821,846 3,027,263,247
Table 4
Figure 7
UBS slightly increased financing of LNG from 2015 and 2016 and slightly
decreased financing from 2016 and 2017. CS sharply decreased financing
of LNG between 2015 and 2017. In sum UBS and CS provided 3.0 bn US
$ to companies engaged in LNG activities between 2015 and 2017.
Coal Mining
2015 2016 2017 2015-2017
UBS 266,660,657 56,232,279 51,995,041 374,887,979
CS 165,510,324 68,910,375 1,099,670,736 1,334,091,436
Total 432,170,981 125,142,655 1,151,665,778 1,708,979,415
Table 5
14
Figure 8
Whereas financing of coal mining activities by UBS dropped between
2015 and 2017, financing provided by CS for such activities decreased
between 2015 and 2016 but sharply increased between 2016 and 2017. In
sum, 1.7 bn US $ were given by UBS and CS to companies engaged in
coal mining activities.
Coal Power
2015 2016 2017 2015-2017
UBS 897,148,060 1,128,347,198 641,088,955 2,666,584,215
CS 622,604,006 937,837,858 939,499,385 2,499,941,250
Total 1,519,752,066 2,066,185,057 1,580,588,341 5,166,525,465
Table 6
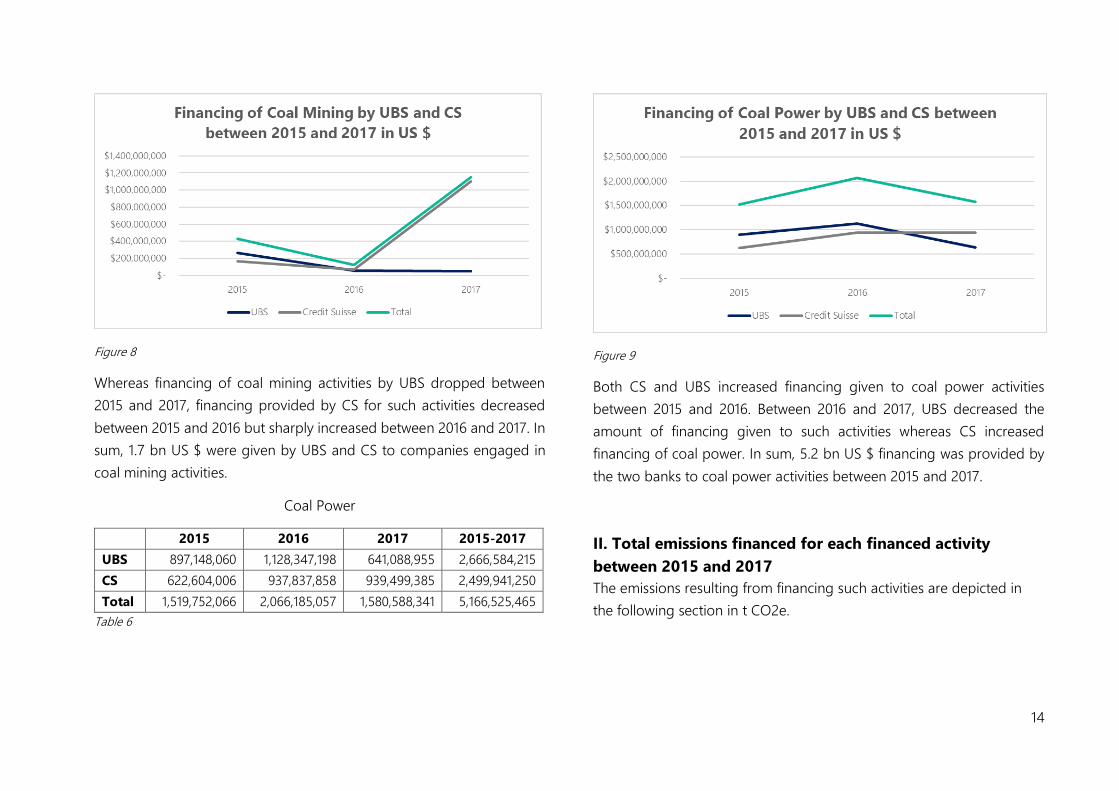
Figure 9
Both CS and UBS increased financing given to coal power activities
between 2015 and 2016. Between 2016 and 2017, UBS decreased the
amount of financing given to such activities whereas CS increased
financing of coal power. In sum, 5.2 bn US $ financing was provided by
the two banks to coal power activities between 2015 and 2017.
II. Total emissions financed for each financed activity
between 2015 and 2017
The emissions resulting from financing such activities are depicted in
the following section in t CO2e.
15
Total
2015 2016 2017 2015-2017
UBS 28,408,305 16,210,013 11,329,433 55,947,752
CS 26,129,652 18,220,964 82,628,263 126,978,880
Total 54,537,957 34,430,978 93,957,697 182,926,633
Table 7
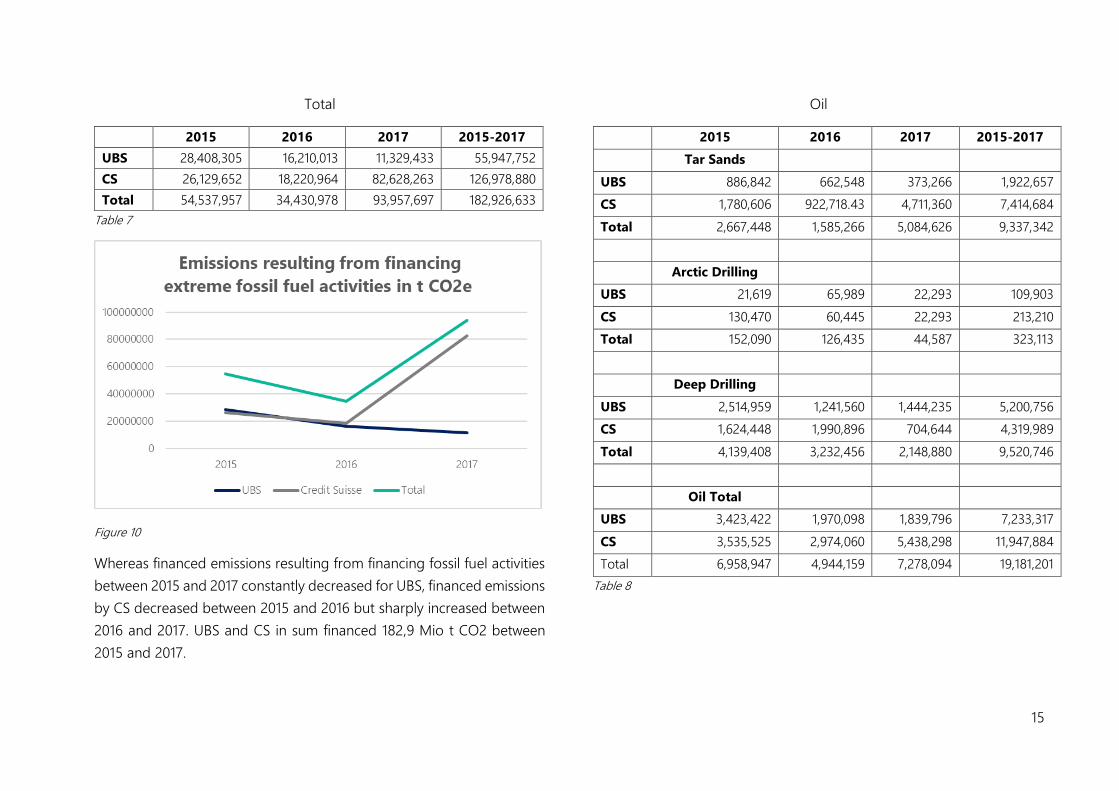
Figure 10
Whereas financed emissions resulting from financing fossil fuel activities
between 2015 and 2017 constantly decreased for UBS, financed emissions
by CS decreased between 2015 and 2016 but sharply increased between
2016 and 2017. UBS and CS in sum financed 182,9 Mio t CO2 between
2015 and 2017.
Oil
2015 2016 2017 2015-2017
Tar Sands
UBS 886,842 662,548 373,266 1,922,657
CS 1,780,606 922,718.43 4,711,360 7,414,684
Total 2,667,448 1,585,266 5,084,626 9,337,342
Arctic Drilling
UBS 21,619 65,989 22,293 109,903
CS 130,470 60,445 22,293 213,210
Total 152,090 126,435 44,587 323,113
Deep Drilling
UBS 2,514,959 1,241,560 1,444,235 5,200,756
CS 1,624,448 1,990,896 704,644 4,319,989
Total 4,139,408 3,232,456 2,148,880 9,520,746
Oil Total
UBS 3,423,422 1,970,098 1,839,796 7,233,317
CS 3,535,525 2,974,060 5,438,298 11,947,884
Total 6,958,947 4,944,159 7,278,094 19,181,201
Table 8
16
LNG
2015 2016 2017 2015-2017
UBS 776,505 848,244 656,190 2,280,939
CS 6,988,253 2,761,595 1,712,858 11,462,708
Total 7,764,759 3,609,839 2,369,049 13,743,648
Table 9
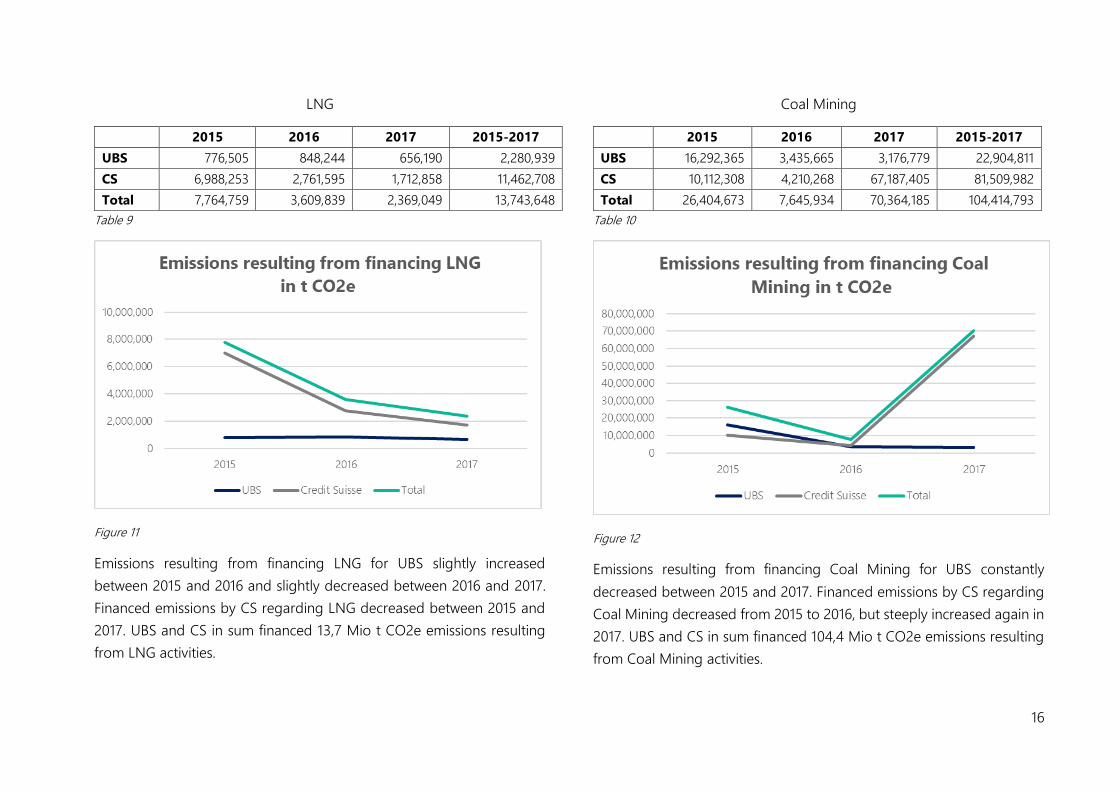
Figure 11
Emissions resulting from financing LNG for UBS slightly increased
between 2015 and 2016 and slightly decreased between 2016 and 2017.
Financed emissions by CS regarding LNG decreased between 2015 and
2017. UBS and CS in sum financed 13,7 Mio t CO2e emissions resulting
from LNG activities.
Coal Mining
2015 2016 2017 2015-2017
UBS 16,292,365 3,435,665 3,176,779 22,904,811
CS 10,112,308 4,210,268 67,187,405 81,509,982
Total 26,404,673 7,645,934 70,364,185 104,414,793
Table 10
Figure 12
Emissions resulting from financing Coal Mining for UBS constantly
decreased between 2015 and 2017. Financed emissions by CS regarding
Coal Mining decreased from 2015 to 2016, but steeply increased again in
2017. UBS and CS in sum financed 104,4 Mio t CO2e emissions resulting
from Coal Mining activities.
17
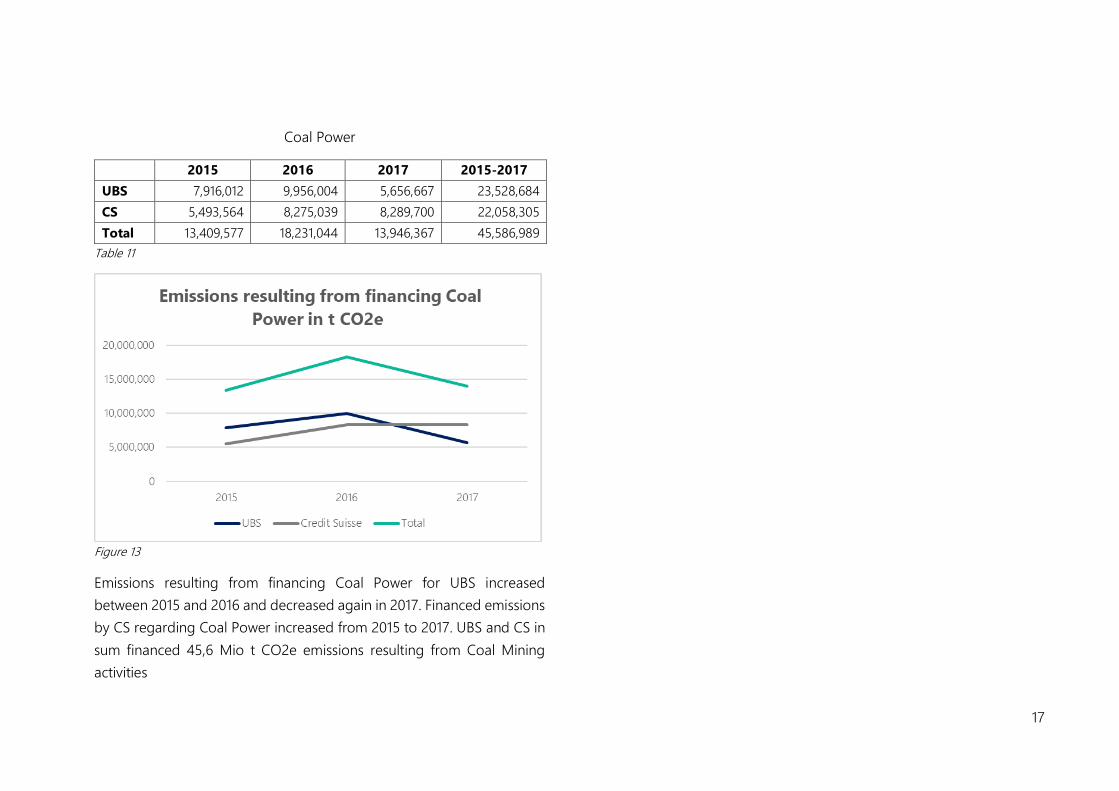
Coal Power
2015 2016 2017 2015-2017
UBS 7,916,012 9,956,004 5,656,667 23,528,684
CS 5,493,564 8,275,039 8,289,700 22,058,305
Total 13,409,577 18,231,044 13,946,367 45,586,989
Table 11
Figure 13
Emissions resulting from financing Coal Power for UBS increased
between 2015 and 2016 and decreased again in 2017. Financed emissions
by CS regarding Coal Power increased from 2015 to 2017. UBS and CS in
sum financed 45,6 Mio t CO2e emissions resulting from Coal Mining
activities
18
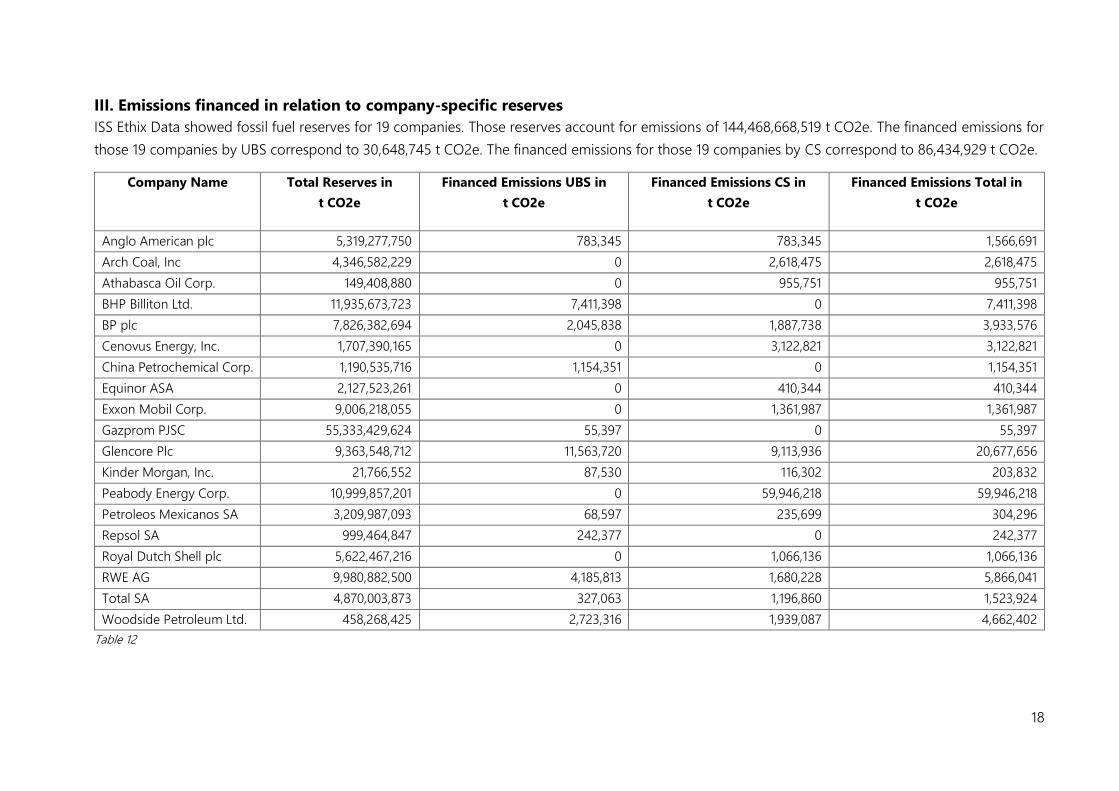
III. Emissions financed in relation to company-specific reserves
ISS Ethix Data showed fossil fuel reserves for 19 companies. Those reserves account for emissions of 144,468,668,519 t CO2e. The financed emissions for
those 19 companies by UBS correspond to 30,648,745 t CO2e. The financed emissions for those 19 companies by CS correspond to 86,434,929 t CO2e.
Company Name Total Reserves in
t CO2e
Financed Emissions UBS in
t CO2e
Financed Emissions CS in
t CO2e
Financed Emissions Total in
t CO2e
Anglo American plc 5,319,277,750 783,345 783,345 1,566,691
Arch Coal, Inc 4,346,582,229 0 2,618,475 2,618,475
Athabasca Oil Corp. 149,408,880 0 955,751 955,751
BHP Billiton Ltd. 11,935,673,723 7,411,398 0 7,411,398
BP plc 7,826,382,694 2,045,838 1,887,738 3,933,576
Cenovus Energy, Inc. 1,707,390,165 0 3,122,821 3,122,821
China Petrochemical Corp. 1,190,535,716 1,154,351 0 1,154,351
Equinor ASA 2,127,523,261 0 410,344 410,344
Exxon Mobil Corp. 9,006,218,055 0 1,361,987 1,361,987
Gazprom PJSC 55,333,429,624 55,397 0 55,397
Glencore Plc 9,363,548,712 11,563,720 9,113,936 20,677,656
Kinder Morgan, Inc. 21,766,552 87,530 116,302 203,832
Peabody Energy Corp. 10,999,857,201 0 59,946,218 59,946,218
Petroleos Mexicanos SA 3,209,987,093 68,597 235,699 304,296
Repsol SA 999,464,847 242,377 0 242,377
Royal Dutch Shell plc 5,622,467,216 0 1,066,136 1,066,136
RWE AG 9,980,882,500 4,185,813 1,680,228 5,866,041
Total SA 4,870,003,873 327,063 1,196,860 1,523,924
Woodside Petroleum Ltd. 458,268,425 2,723,316 1,939,087 4,662,402
Table 12
19
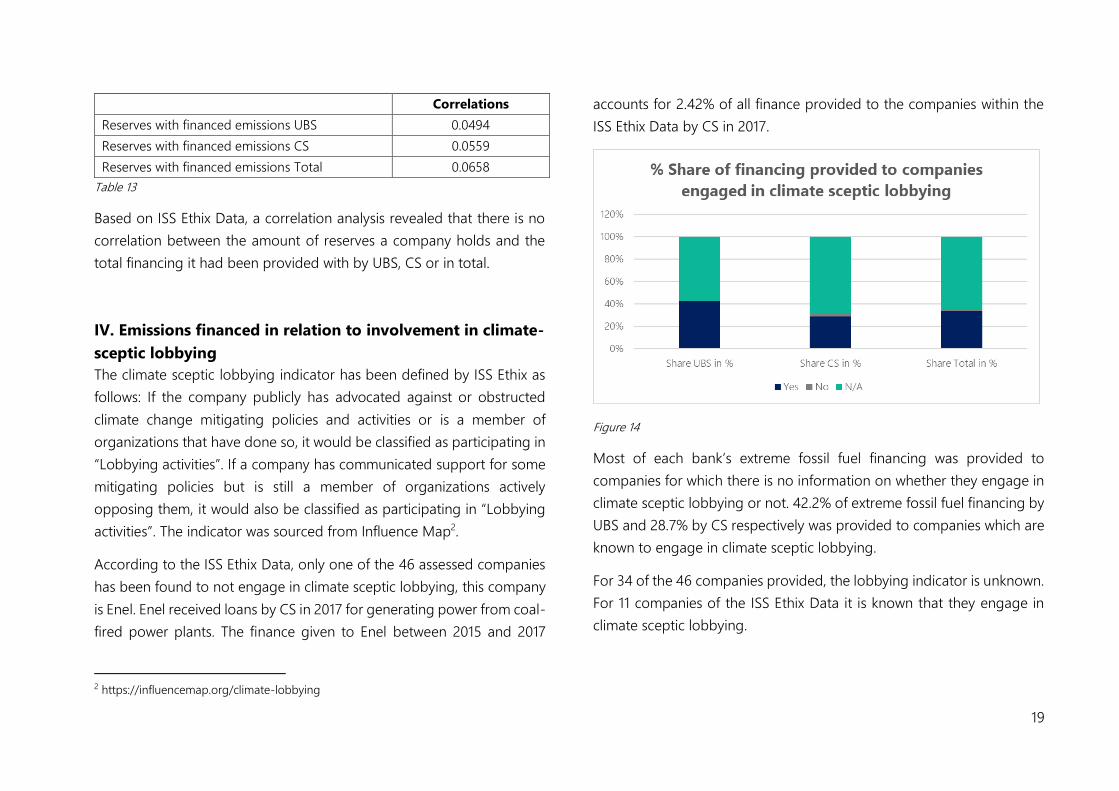
Correlations
Reserves with financed emissions UBS 0.0494
Reserves with financed emissions CS 0.0559
Reserves with financed emissions Total 0.0658
Table 13
Based on ISS Ethix Data, a correlation analysis revealed that there is no
correlation between the amount of reserves a company holds and the
total financing it had been provided with by UBS, CS or in total.
IV. Emissions financed in relation to involvement in climate-
sceptic lobbying
The climate sceptic lobbying indicator has been defined by ISS Ethix as
follows: If the company publicly has advocated against or obstructed
climate change mitigating policies and activities or is a member of
organizations that have done so, it would be classified as participating in
“Lobbying activities”. If a company has communicated support for some
mitigating policies but is still a member of organizations actively
opposing them, it would also be classified as participating in “Lobbying
activities”. The indicator was sourced from Influence Map2.
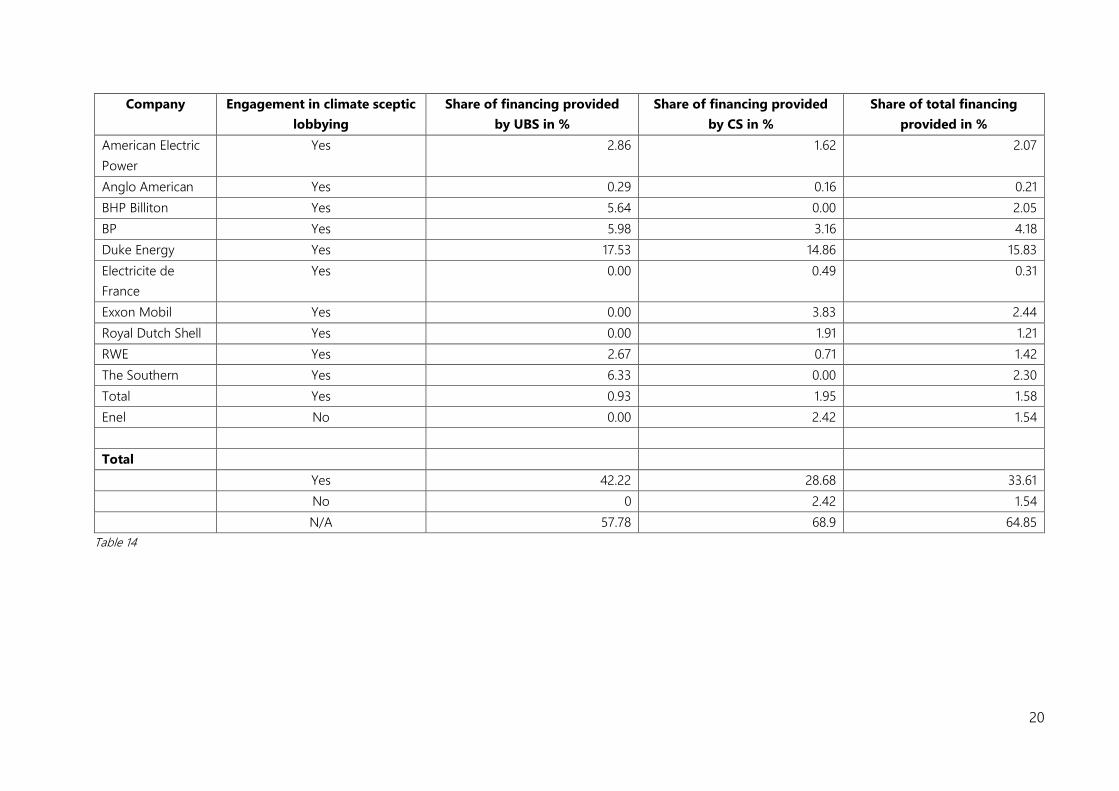
According to the ISS Ethix Data, only one of the 46 assessed companies
has been found to not engage in climate sceptic lobbying, this company
is Enel. Enel received loans by CS in 2017 for generating power from coal-
fired power plants. The finance given to Enel between 2015 and 2017
2 https://influencemap.org/climate-lobbying
accounts for 2.42% of all finance provided to the companies within the
ISS Ethix Data by CS in 2017.
Figure 14
Most of each bank’s extreme fossil fuel financing was provided to
companies for which there is no information on whether they engage in
climate sceptic lobbying or not. 42.2% of extreme fossil fuel financing by
UBS and 28.7% by CS respectively was provided to companies which are
known to engage in climate sceptic lobbying.
For 34 of the 46 companies provided, the lobbying indicator is unknown.
For 11 companies of the ISS Ethix Data it is known that they engage in
climate sceptic lobbying.
20
Company Engagement in climate sceptic
lobbying
Share of financing provided
by UBS in %
Share of financing provided
by CS in %
Share of total financing
provided in %
American Electric
Power
Yes 2.86 1.62 2.07
Anglo American Yes 0.29 0.16 0.21
BHP Billiton Yes 5.64 0.00 2.05
BP Yes 5.98 3.16 4.18
Duke Energy Yes 17.53 14.86 15.83
Electricite de
France
Yes 0.00 0.49 0.31
Exxon Mobil Yes 0.00 3.83 2.44
Royal Dutch Shell Yes 0.00 1.91 1.21
RWE Yes 2.67 0.71 1.42
The Southern Yes 6.33 0.00 2.30
Total Yes 0.93 1.95 1.58
Enel No 0.00 2.42 1.54
Total
Yes 42.22 28.68 33.61
No 0 2.42 1.54
N/A 57.78 68.9 64.85
Table 14
21
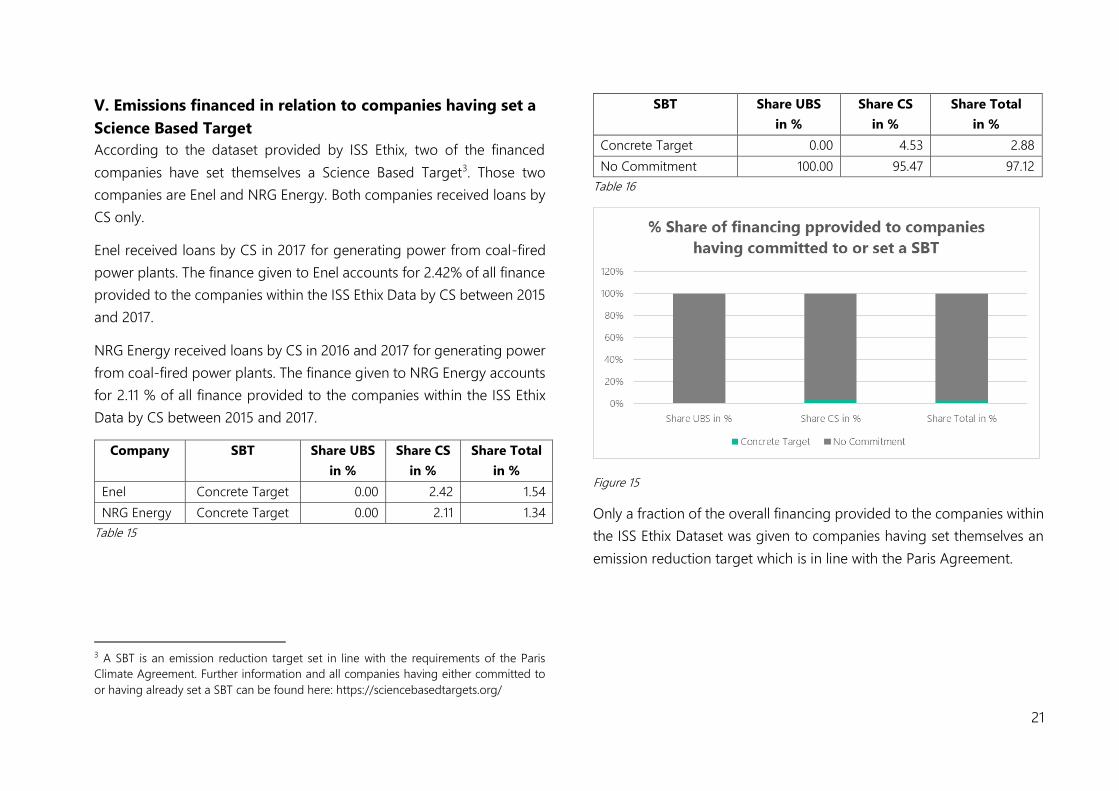
V. Emissions financed in relation to companies having set a
Science Based Target
According to the dataset provided by ISS Ethix, two of the financed
companies have set themselves a Science Based Target3. Those two
companies are Enel and NRG Energy. Both companies received loans by
CS only.
Enel received loans by CS in 2017 for generating power from coal-fired
power plants. The finance given to Enel accounts for 2.42% of all finance
provided to the companies within the ISS Ethix Data by CS between 2015
and 2017.
NRG Energy received loans by CS in 2016 and 2017 for generating power
from coal-fired power plants. The finance given to NRG Energy accounts
for 2.11 % of all finance provided to the companies within the ISS Ethix
Data by CS between 2015 and 2017.
Company SBT Share UBS
in %
Share CS
in %
Share Total
in %
Enel Concrete Target 0.00 2.42 1.54
NRG Energy Concrete Target 0.00 2.11 1.34
Table 15
3 A SBT is an emission reduction target set in line with the requirements of the Paris
Climate Agreement. Further information and all companies having either committed to
or having already set a SBT can be found here: https://sciencebasedtargets.org/
SBT Share UBS
in %
Share CS
in %
Share Total
in %
Concrete Target 0.00 4.53 2.88
No Commitment 100.00 95.47 97.12
Table 16
Figure 15
Only a fraction of the overall financing provided to the companies within
the ISS Ethix Dataset was given to companies having set themselves an
emission reduction target which is in line with the Paris Agreement.
22
VI. Emissions financed in relation to the companies’
exposure to physical risks
ISS Ethix describes the origin of the submitted data on the physical risk
indicator as follows:
The indicator shows the companies´ risk exposure to short-term and
long-term physical risk.
Each sector and each region have characteristic physical risk levels
relating to their exposure to long term climate change and catastrophic
events. Based on a regional and sectoral analysis of the portfolio, a
general level of exposure to physical risks (long term climate change and
catastrophic events) can be attributed to the portfolio.
The sector of each holding’s main field of activity is determined, and the
company is then attributed the corresponding risk level. This is done
using ISS Ethix's proprietary sector classification which determines a
company's main field of operations. The same is done for the company’s
main region of activity. This is based on the company´s headquarter
location.
The calculations are based on research by Moody’s4, the Sustainable
Accounting Standard Board (“SASB”)5 and CICERO6.
4 Environmental Risks: Heat Map Shows Wide Variations in Credit Impact Across Sectors,
Moody’s Investors Service, Nov. 2015 5 Climate Risk: Technical Bulletin TB001 – 10182016, Sustainability Accounting Standards
Board, Oct. 2016
The following description of the different classifications of low, medium
and high has been provided by ISS Ethix upon request by right.:
Low classified physical risk is described as: No or potentially emerging
risks in the medium to long term (5 years and beyond) with uncertainty
as to which extent they might material.
Medium classified physical risk is described as: Emerging risks that in
aggregate have the potential to have material impacts in the medium
term.
High classified physical risk is described as: More immediate risks that
can have a material impact.
1. Short Term Risk: Investments in US $
Short-term refers to a time horizon of three years. From 34 companies
with data on physical risks, 17 show an exposure to medium physical
risks and 17 show exposure to high physical risk.
The amount of financing provided by UBS to companies exposed to
medium physical risk in the short term decreased steadily between 2015
and 2017. The amount given to companies exposed to high physical risk
decreased from 2015 to 2016 but increased again from 2016 to 2017. UBS
has provided significantly less finance to companies exposed to high risk
than to companies exposed to medium risk. The amount of financing
6 Shades of Climate Risk: Categorizing Climate Risk for Investors, CICERO: Climate
Finance, Feb. 2017
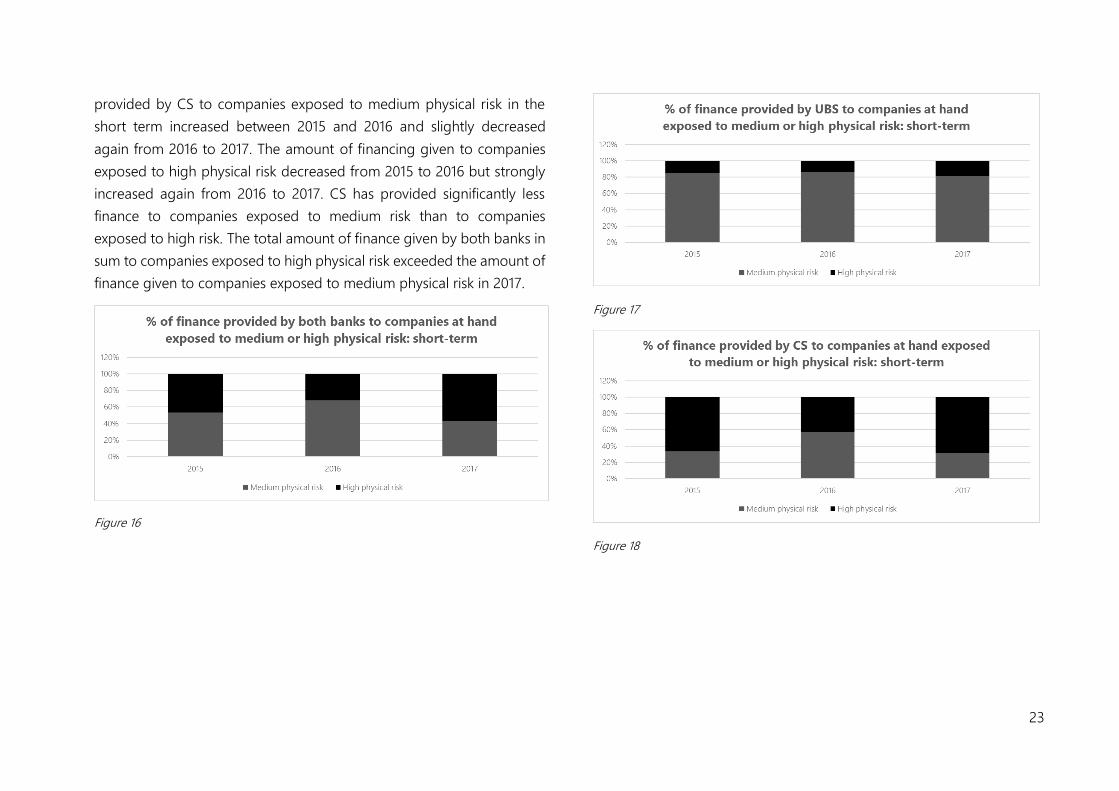
23
provided by CS to companies exposed to medium physical risk in the
short term increased between 2015 and 2016 and slightly decreased
again from 2016 to 2017. The amount of financing given to companies
exposed to high physical risk decreased from 2015 to 2016 but strongly
increased again from 2016 to 2017. CS has provided significantly less
finance to companies exposed to medium risk than to companies
exposed to high risk. The total amount of finance given by both banks in
sum to companies exposed to high physical risk exceeded the amount of
finance given to companies exposed to medium physical risk in 2017.
Figure 16
Figure 17
Figure 18
24
Table 17 shows the amount of $ invested in companies exposed to
medium and high physical risk for each bank separately and for both
banks together between 2015 and 2017.
2015 2016 2017 2015-2017
Total
Medium 2172975335 1826099242 1656537674 5655612251
High 1882157811 845855162 2154623625 4882636598
UBS
Medium 1339614484 889659348 741398830 2970672663
High 233683505 138844788 167596047 540124341
CS
Medium 833360850 936439892 915138844 2684939588
High 1648474306 707010374 1987027577 4342512257
Table 17
2. Short Term Risk: Emissions Financed in t CO2e
Table 18 shows the financed emissions in t CO2e corresponding to the
investments in companies with short-term medium and high exposure to
physical risks.
2015 2016 2017 2015-2017
Total
Medium 27106750 14302147 13962481 55371379
High 23742072 11221424 71286465 106249962
UBS
Medium 19307357 6916532 5887727 32111617
High 7239883 3935177 3764013 14939075
CS
Medium 7799392 7385614 8074754 23259762
High 16502188 7286246 67522451 91310886
Table 18
3. Long Term Risk: Investments in US $
Long-term refers to a time horizon of more than five years. From 34
companies with data on physical risks, 7 show an exposure to low physical
risks and 27 show exposure to medium physical risk.
The amount of financing provided by UBS to companies exposed to low
physical risk in the long term increased slightly between 2015 and 2016
and decreased in 2017. The amount given to companies exposed to
medium physical risk decreased from 2015 to 2016 but increased again
from 2016 to 2017. UBS has provided significantly less finance to
companies exposed to low risk in the long-term than to companies
exposed to medium risk in the long-term.
The amount of financing provided by CS to companies exposed to low
physical risk in the long term increased between 2015 and 2017. The
amount given to companies exposed to medium physical risk decreased
from 2015 to 2016 but increased again from 2016 to 2017. CS has
25
provided significantly less finance to companies exposed to low risk than
to companies exposed to medium risk.
Figure 19
Figure 20
Figure 21
Table 19 shows the amount of $ invested in companies exposed to low
and high physical risk for each bank separately and for both banks
together between 2015 and 2017.
2015 2016 2017 2015-2017
Total
Low 836379087 1113821053 1030881185 2981081325
Medium 3218754059 1558133351 2780280114 7557167524
UBS
Low 480881540 583447695 356342996 1420672232
Medium 1092416449 445056441 552651882 2090124773
CS
Low 355497547 530373357 674538188 1560409093
Medium 2126337609 1113076910 2227628232 5467042752
Table 19
26
4. Long Term Risk: Emissions Financed in t CO2e
Table 20 shows the financed emissions corresponding to the investments
in companies with short-term medium and high exposure to physical
risks.
2015 2016 2017 2015-2017
Total
Low 7379815.476 9827832.819 9096010.454 26303658.75
Medium 43469007.07 15695739.38 76152936.6 135317683
UBS
Low 4243072.414 5148067.903 3144202.906 12535343.22
Medium 22304168.8 5703642.688 6507538.238 34515349.73
CS
Low 3136743.062 4679764.916 5951807.548 13768315.53
Medium 21164838.26 9992096.693 69645398.36 100802333.3
Table 20
27
Part 2: Climate Performance
This section is to be understood as an explorative outlook providing a
glimpse into how science-based metrics can add valuable information to
quantitative analyses as carried out in part 1, once methodologies are
fully developed. The methodology used for determining the science-
based metrics provided in this part is the X-Degree Compatibility (“XDC”)
Model, which is proprietary to right. and currently in ß-development
phase. The XDC Model computes science-based climate metrics for the
purposes of corporate climate strategy development, risk management,
reporting and communication based on various scenarios.
A. Executive Summary
The total amount of financed emissions between 2015 and 2017 would
lead to an increase of global temperatures by 0.0001293345 °C.
The total amount of emissions resulting from burning the total reserves
of those 19 companies of which data on reserves was available would
lead to an increase of global temperatures by 0.100253 °C.
The Standard XDC could be calculated for 33 companies and ranges from
1.2°C to well above 6°C. Two of the companies covered by the analysis
have a Standard XDC below 2°C and two companies have a Standard
XDC below their Target XDC as of IEA 2DS.
B. The XDC Model
The XDC is a science-based climate metric, which illustrates for a single
company, how many degrees the world would warm up to by 2050 if all
entities behaved as emission intensively as the company at hand. If a
company has an XDC of e.g. 2.3°C, this means that the world would warm
by 2.3°C, if everyone else would operate in the same manner. The XDC
is computed via the XDC Model, which can additionally calculate several
other metrics, such as an emission target.
I. The XDC Metric
The calculation underlying the metric is:
XDC = (𝐸𝑚𝑖𝑠𝑠𝑖𝑜𝑛𝑠 / 𝐺𝑟𝑜𝑠𝑠 𝑉𝑎𝑙𝑢𝑒 𝐴𝑑𝑑𝑒𝑑) x Climate Performance
The model computes the XDC of a company following two major
questions:
Step 1: What amount of emissions would reach the atmosphere if every
company would be as emission intensive as the company at hand, given
the same economic output?
In the first step, the XDC Model computes an emission budget that would
be generated by the global economy if every company’s ratio between
emissions and gross value added were the same as the company being
evaluated.
Step 2: What temperature increase would result from the release of that
specific amount of emissions?
In the second step, the XDC Model computes how much global warming
would result from this amount of emissions reaching the atmosphere.
right. uses emission-driven climate models to compute step 2. This
means that the input data are the anthropogenic emissions of GHG and
the output is a value for global warming expressed in degrees Celsius.
28
Our model captures the effect of further GHG emissions resulting in an
increase of the atmospheric concentration of these gases in the
atmosphere. The increase of the atmospheric concentration causes an
increase of the radiative forcing and therefore on global warming.
II. Output of the XDC Model
The output of the XDC Model can be divided into two main categories:
• Standard XDC: The Standard XDC assumes standard assumptions
for economic growth and emissions. The underlying scenario is a
Business As Usual Scenario assuming the ratio between emissions
and gross value added remains the same until 2050. Due to using the
same assumptions for every XDC computed, the Standard XDC
serves the purpose of comparing one company to another or to
another peer group, such as a sector.
• Scenario Based XDC: The scenario based XDC allows individual
assumptions for economic growth and emissions for each year until
2050 to be assessed. By doing this, XDCs based on different scenarios
can be computed. Furthermore, the Scenario Based XDC allows for
variation in scope 1-3 coverage. A user can decide what percentage
of scope 1-3 emissions should be considered into the resulting XDC.
Determining scenarios allows a user to consider emissions targets,
strong business growth expectations, expansion plans or the effect
of modern technology on decarbonizing e.g. the supply chain.
III. Validation of the XDC Model
right. has validated the calculations up to the moment, in the following
way:
Radiative Forcing: The primary source for radiative forcing are GHG. Our
values for radiative forcing generated by GHG for the base year 2016 are
in line with the National Oceanic and Atmospheric Administration
(“NOAA”) results. Total radiative forcing for the base year is in line with
IPCC results.
Carbon Budgets: Current climate science describes remaining cumulative
budgets for GHG emissions to stay below 2 / 3 / 4 degrees Celsius global
warming. Remaining cumulative budgets for GHG emissions as
calculated by the XDC Model are within the 90% confidence interval of
those scientific results until almost 4°C.
IV. Input data for this Report
In order calculate science-based climate metrics via the XDC Model for a
company via data provided by third parties, the company has to be
publicly listed. Out of the 47 companies provided by ISS Ethix, 13 are held
privately or by governments. Since ISS Ethix did not provide climate data
for the company Connacher Oil & Gas Ltd., it has also been deducted
from the sample. Consequently, the final number of companies, for which
calculations have been done using the XDC Model, amounts to 33. For
the calculation of the Standard XDC for Enbridge, Inc. data from 2017 was
used, considering the fact, that this company underwent a large merger
in 2017.
29
The following sources of input data apply to analyses carried out in part 2
of this Report:
Emissions: Carbon footprint (scope 1 and scope 2) were sourced by ISS
Ethix. ISS Ethix describes the methodology as follows:
(1) ISS Ethix collects self-reported GHG data from all available
sources, including CSR reports, the CDP, investor relation
communication, websites etc. This self-reported data is validated
by analysts. Usually, 20-25% of this data is dismissed as not
trustworthy.
(2) For all non-reporting or poorly reporting companies, ISS Ethix
developed a sophisticated approach for modeling such data.
ISS Ethix’s methodology for estimating the carbon emissions of non-
reporting companies was developed over three years with researchers
from the Swiss Federal Institute of Technology. ISS Ethix’s approach relies
on about 800 subsector specific models, applied on a proprietary,
carbon-focused subsector classification system.
Gross Value Added: Gross Value Added can be calculated by adding
EBITDA (Earnings before Interest, Taxes, Depreciation and Amortization)
and personnel costs. EBITDA for the 33 companies covered by the
analysis in part 2 was sourced from Factset Research Systems. In case of
negative values for EBITDA, only personnel costs were used as GVA.
Personnel costs were also sourced from Factset Research Systems. In case
personnel costs could not be provided by Factest Research Systems, this
information was derived from sector-specific estimations.
C. Analysis
I. Climate Performance of financed emissions
The climate performance of the total sum of emissions financed by CS
and UBS was determined by entering the total amount of financed
emissions into the climate performance calculation part of the XDC
Model.
Results show that the total amount of financed emissions between 2015
and 2017 would lead to an increase of global temperatures by
0.0001293345°C.
Also small numbers can play a huge role. In November 2015, Saúl
Luciano Lliuya, a Peruvian farmer filed claims for declaratory judgment
and damages in a German court against RWE, Germany’s largest
electricity producer. Lliuya’s suit alleged that RWE, having knowingly
contributed to climate change by emitting “substantial volumes” –
namely 0.47% of worldwide GHGs. The case will move forward into the
evidentiary phase.
The case indicates that there is a need to establish what is the specific
result in temperature increase that past and future emissions will
amount to. As climate attribution science becomes more precise, the
specific impacts and effects of contributions will be easier to associate
with specific consequences.
30
II. Climate Performance of the company’s fossil fuel
reserves
ISS Ethix Data show values for coal reserves for six companies and oil and
gas reserves for 15 companies. In order to determine the additional
climate performance of these reserves, reserves had to be turned into
emissions according to the following process for each fossil fuel:
1. Coal
Coal reserves given in Metric Tonnes where converted into Short Tonnes
in order to apply factors given by the IEA to calculate the emissions
resulting from burning the coal reserves. The factor applied for turning
MT into ST was 1.10231. No distinction could be made between different
sorts of coal, which is why the general factor for coal was used.
2. Oil and Gas
Oil and gas reserves given in Barrel Oil Equivalent where converted into
British Thermal Units (“BTU”) in order to apply factors given by the IEA
to calculate the emissions resulting from burning the oil and gas reserves
of the 16 companies. 1 BOE corresponds to 5.800.641 BTU. BTU was then
converted into tonnes of CO2e according to the factors for “Home
Heating and Diesel Fuel (Distillate)” given by the IEA.
The climate performance of the total sum of reserves held by the 19
companies (two companies have coal and oil and gas reserves) having
received credit by CS and UBS was determined by entering the total
7 InfluenceMap, Who Owns the World’s Coal, 2017.
amount of emissions resulting from burning those reserves into the
climate performance calculation part of the XDC Model.
Results show that the total amount of emissions resulting from burning
the total reserves of the 19 companies would lead to an increase of global
temperatures by 0.100253 degrees Celsius.
It should be stressed that around 70% of coal reserves are located in Asia7
and that reserves of the companies financed by UBS and CS located in
China and South Korea could not be incorporated into this calculation
due to missing data on the amount of reserves which those companies
hold.
III. Standard XDC and Sector Target XDC
The Standard XDC for the base year 2016 was calculated according to the
following assumptions: 3.2%8 growth of global GVA p.a. until 2050, 3.2%
growth of company-specific GVA p.a. until 2050 and zero decoupling of
emissions and GVA until 2050. Scope 1 emissions were covered by 100%
of the analysis whereby Scope 2 emissions were covered by 50% of the
analysis, taking into account the shared GVA from Scope 2 emissions
between the company at hand and its energy providers.
The Target XDC is a Scenario Based XDC and has been determined for
OECD countries based on the emission-reduction assumptions of the IEA
2DS using the following data bases:
8 IEA ETP 2016.
31
1. Emissions according to the International Energy Agency's 2 degrees
scenario (“2DS”)
For sectors covered by the IEA ETP 2016, GHG emissions permitted to
achieve the 2°C target are reported in 5-year intervals. For the
intermediate years, the data was interpolated linearly by right. This way
the cumulative emissions for the years 2016-2050 had been determined.
The assignment of the companies in the sample to the sectors of the IEA
had been done as follows:
- Oil Production and Mining was assigned to Industry [ISIC rev4
divisions 5-9 and 10-33]
- Power Generation and Gas Distribution was assigned to Power
[ISIC rev4 division 35]
- Transport in Pipelines was assigned to Transport [ISIC rev4
divisions 49-53]
2. GVA by sector for OECD countries for the year 2016 was sourced from
the OECD databank.
The data was calculated and summed up using the annual 1.8% growth
forecast given by the IEA for OECD countries until 2050.
Resulting sums for GHG emissions and GVA were used to determine the
Target XDC of the sectors Industry, Power and Transport.
Taking into account existing and well-founded criticism against the
rationale of the IEA 2DS, it should be noted that a Target XDC under the
9 https://tntcat.iiasa.ac.at/SspDb/dsd?Action=htmlpage&page=about
2°C-mitigation scenarios provided by the scenario framework of the
Shared Socioeconomic Pathways (“SSPs”)9 might be a better indicator
for 2°C-compatible emission reduction requirements of the companies
covered by the analysis.
32
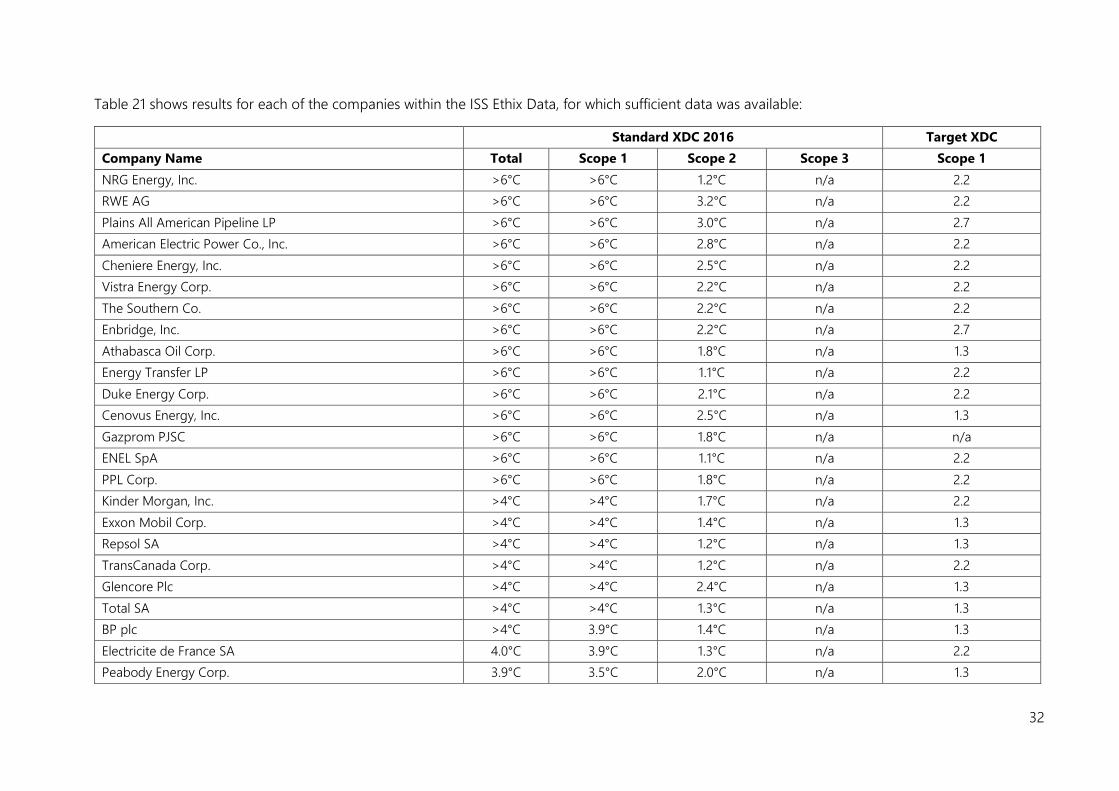
Table 21 shows results for each of the companies within the ISS Ethix Data, for which sufficient data was available:
Standard XDC 2016 Target XDC
Company Name Total Scope 1 Scope 2 Scope 3 Scope 1
NRG Energy, Inc. >6°C >6°C 1.2°C n/a 2.2
RWE AG >6°C >6°C 3.2°C n/a 2.2
Plains All American Pipeline LP >6°C >6°C 3.0°C n/a 2.7
American Electric Power Co., Inc. >6°C >6°C 2.8°C n/a 2.2
Cheniere Energy, Inc. >6°C >6°C 2.5°C n/a 2.2
Vistra Energy Corp. >6°C >6°C 2.2°C n/a 2.2
The Southern Co. >6°C >6°C 2.2°C n/a 2.2
Enbridge, Inc. >6°C >6°C 2.2°C n/a 2.7
Athabasca Oil Corp. >6°C >6°C 1.8°C n/a 1.3
Energy Transfer LP >6°C >6°C 1.1°C n/a 2.2
Duke Energy Corp. >6°C >6°C 2.1°C n/a 2.2
Cenovus Energy, Inc. >6°C >6°C 2.5°C n/a 1.3
Gazprom PJSC >6°C >6°C 1.8°C n/a n/a
ENEL SpA >6°C >6°C 1.1°C n/a 2.2
PPL Corp. >6°C >6°C 1.8°C n/a 2.2
Kinder Morgan, Inc. >4°C >4°C 1.7°C n/a 2.2
Exxon Mobil Corp. >4°C >4°C 1.4°C n/a 1.3
Repsol SA >4°C >4°C 1.2°C n/a 1.3
TransCanada Corp. >4°C >4°C 1.2°C n/a 2.2
Glencore Plc >4°C >4°C 2.4°C n/a 1.3
Total SA >4°C >4°C 1.3°C n/a 1.3
BP plc >4°C 3.9°C 1.4°C n/a 1.3
Electricite de France SA 4.0°C 3.9°C 1.3°C n/a 2.2
Peabody Energy Corp. 3.9°C 3.5°C 2.0°C n/a 1.3
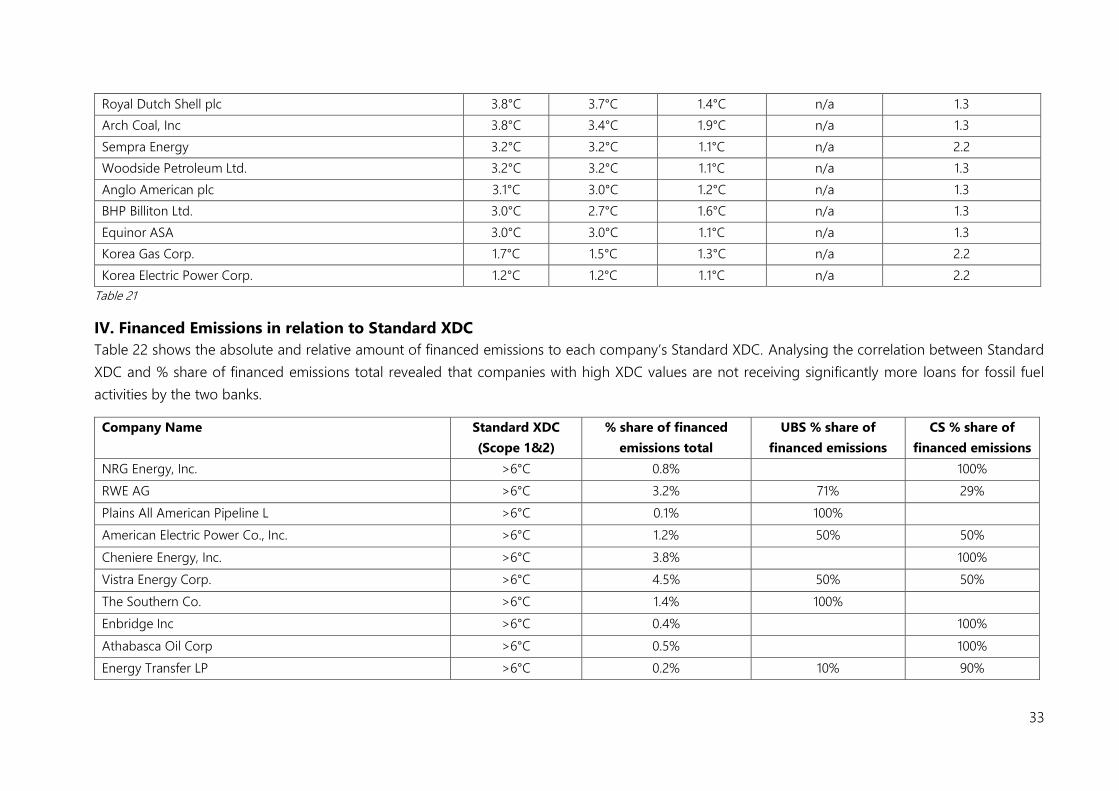
33
Royal Dutch Shell plc 3.8°C 3.7°C 1.4°C n/a 1.3
Arch Coal, Inc 3.8°C 3.4°C 1.9°C n/a 1.3
Sempra Energy 3.2°C 3.2°C 1.1°C n/a 2.2
Woodside Petroleum Ltd. 3.2°C 3.2°C 1.1°C n/a 1.3
Anglo American plc 3.1°C 3.0°C 1.2°C n/a 1.3
BHP Billiton Ltd. 3.0°C 2.7°C 1.6°C n/a 1.3
Equinor ASA 3.0°C 3.0°C 1.1°C n/a 1.3
Korea Gas Corp. 1.7°C 1.5°C 1.3°C n/a 2.2
Korea Electric Power Corp. 1.2°C 1.2°C 1.1°C n/a 2.2
Table 21
IV. Financed Emissions in relation to Standard XDC
Table 22 shows the absolute and relative amount of financed emissions to each company’s Standard XDC. Analysing the correlation between Standard
XDC and % share of financed emissions total revealed that companies with high XDC values are not receiving significantly more loans for fossil fuel
activities by the two banks.
Company Name Standard XDC
(Scope 1&2)
% share of financed
emissions total
UBS % share of
financed emissions
CS % share of
financed emissions
NRG Energy, Inc. >6°C 0.8% 100%
RWE AG >6°C 3.2% 71% 29%
Plains All American Pipeline L >6°C 0.1% 100%
American Electric Power Co., Inc. >6°C 1.2% 50% 50%
Cheniere Energy, Inc. >6°C 3.8% 100%
Vistra Energy Corp. >6°C 4.5% 50% 50%
The Southern Co. >6°C 1.4% 100%
Enbridge Inc >6°C 0.4% 100%
Athabasca Oil Corp >6°C 0.5% 100%
Energy Transfer LP >6°C 0.2% 10% 90%
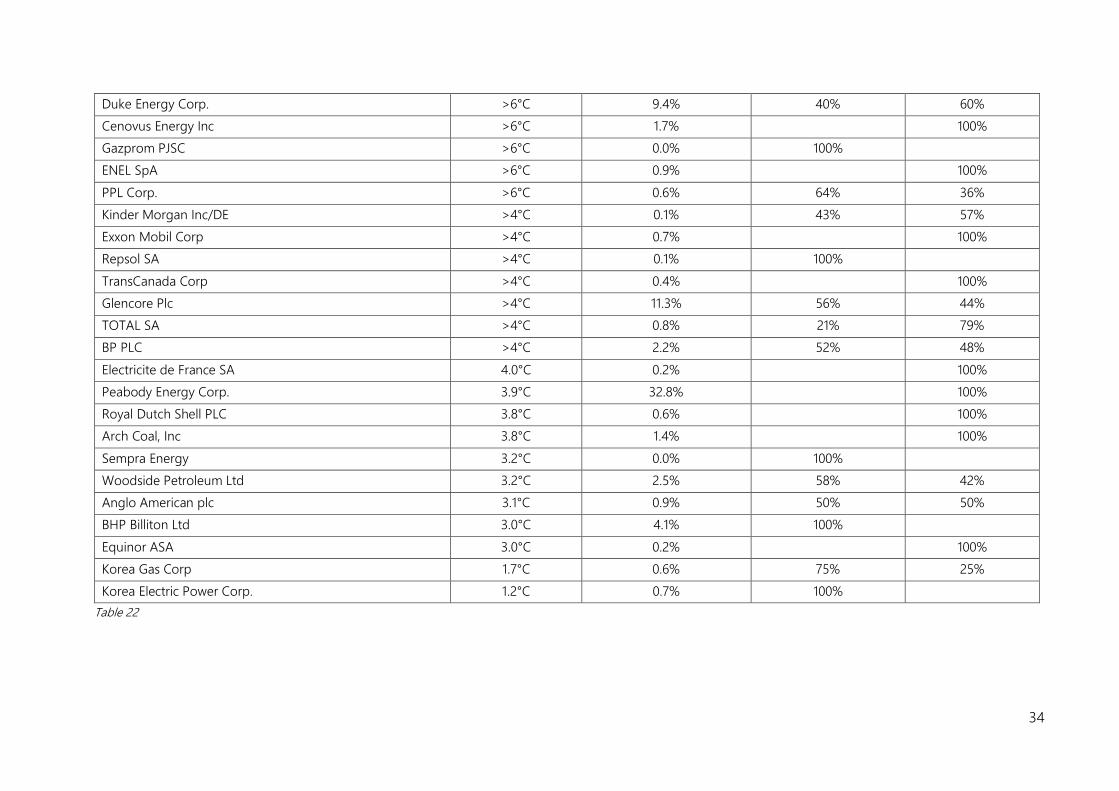
34
Duke Energy Corp. >6°C 9.4% 40% 60%
Cenovus Energy Inc >6°C 1.7% 100%
Gazprom PJSC >6°C 0.0% 100%
ENEL SpA >6°C 0.9% 100%
PPL Corp. >6°C 0.6% 64% 36%
Kinder Morgan Inc/DE >4°C 0.1% 43% 57%
Exxon Mobil Corp >4°C 0.7% 100%
Repsol SA >4°C 0.1% 100%
TransCanada Corp >4°C 0.4% 100%
Glencore Plc >4°C 11.3% 56% 44%
TOTAL SA >4°C 0.8% 21% 79%
BP PLC >4°C 2.2% 52% 48%
Electricite de France SA 4.0°C 0.2% 100%
Peabody Energy Corp. 3.9°C 32.8% 100%
Royal Dutch Shell PLC 3.8°C 0.6% 100%
Arch Coal, Inc 3.8°C 1.4% 100%
Sempra Energy 3.2°C 0.0% 100%
Woodside Petroleum Ltd 3.2°C 2.5% 58% 42%
Anglo American plc 3.1°C 0.9% 50% 50%
BHP Billiton Ltd 3.0°C 4.1% 100%
Equinor ASA 3.0°C 0.2% 100%
Korea Gas Corp 1.7°C 0.6% 75% 25%
Korea Electric Power Corp. 1.2°C 0.7% 100%
Table 22


![XDC Dual Fiber CWDM series - XENYAsup.xenya.si/sup/info/xenya/wdm/[XWDM]_XDC_CWDM_DualFiberSeri… · XDC Dual Fiber CWDM series ... watermark peak attenuation, still allows transfer](https://static.documents.pub/doc/80x56/5adac9d37f8b9a53618d19fc/xdc-dual-fiber-cwdm-series-xwdmxdccwdmdualfiberserixdc-dual-fiber-cwdm.jpg)
