
A Shoreline Tour & The Simpson
Diversity Index
Susan W. Taylor
Summer 2010 Workshopin Biology and Multimedia for High School Teachers
Life Sciences - HHMI Outreach. Copyright 2010 President and Fellows of Harvard College
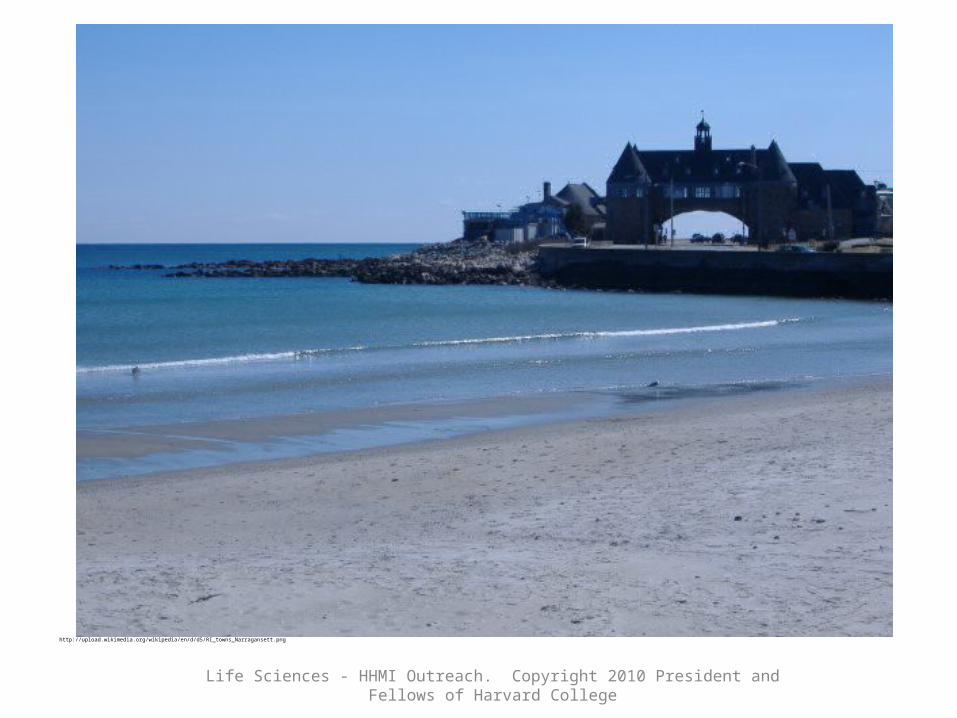
http://upload.wikimedia.org/wikipedia/en/d/d5/RI_towns_Narragansett.png
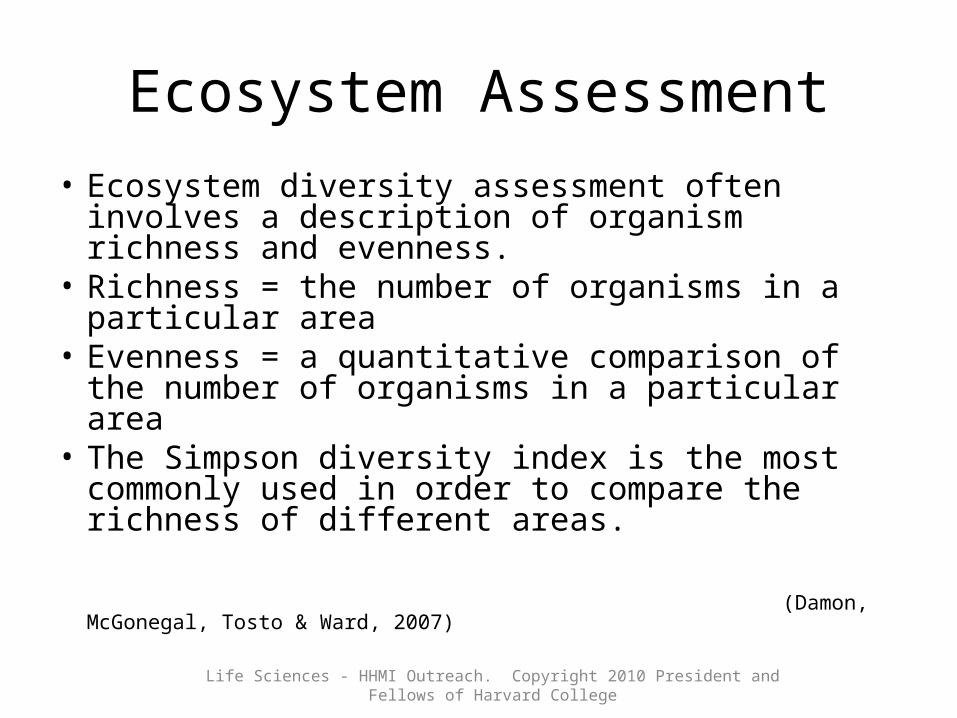
Ecosystem Assessment• Ecosystem diversity assessment often involves a
description of organism richness and evenness.• Richness = the number of organisms in a
particular area• Evenness = a quantitative comparison of the
number of organisms in a particular area• The Simpson diversity index is the most
commonly used in order to compare the richness of different areas.
(Damon, McGonegal, Tosto & Ward, 2007)
Life Sciences - HHMI Outreach. Copyright 2010 President and Fellows of Harvard College
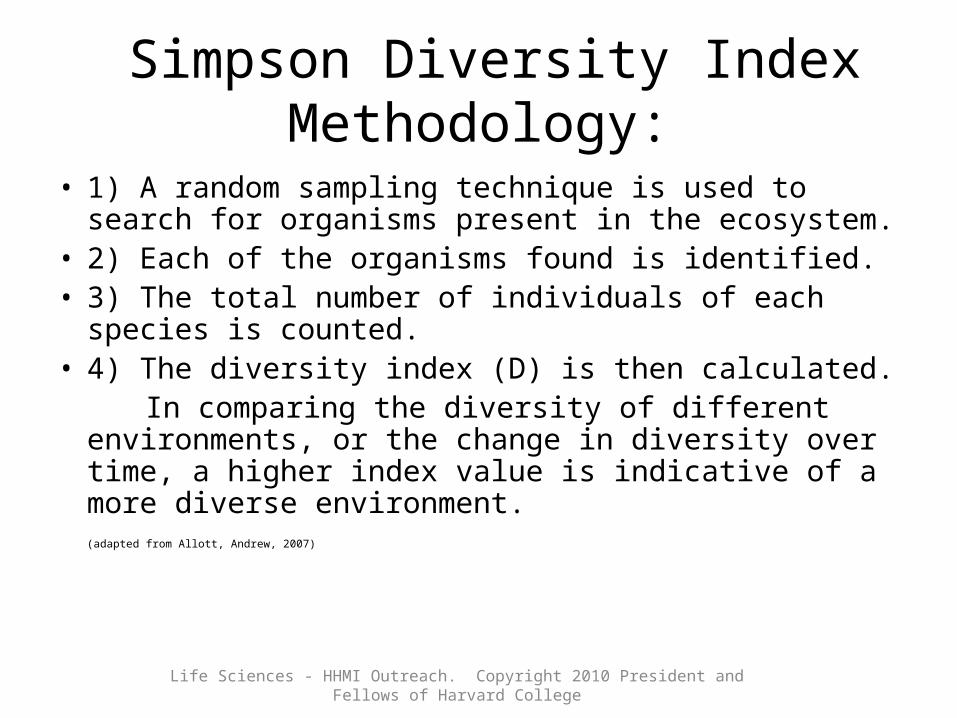
Simpson Diversity Index Methodology:
• 1) A random sampling technique is used to search for organisms present in the ecosystem.
• 2) Each of the organisms found is identified.• 3) The total number of individuals of each species is
counted.• 4) The diversity index (D) is then calculated. In comparing the diversity of different environments,
or the change in diversity over time, a higher index value is indicative of a more diverse environment.
(adapted from Allott, Andrew, 2007)
Life Sciences - HHMI Outreach. Copyright 2010 President and Fellows of Harvard College
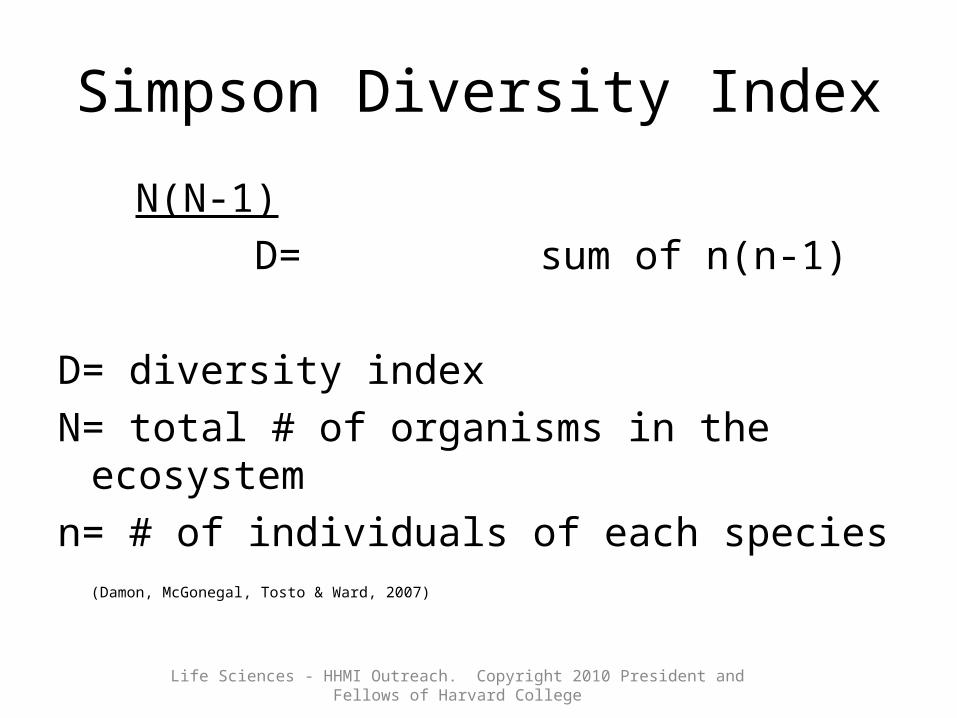
Simpson Diversity Index
N(N-1) D= sum of n(n-1)
D= diversity index N= total # of organisms in the ecosystem n= # of individuals of each species
(Damon, McGonegal, Tosto & Ward, 2007)
Life Sciences - HHMI Outreach. Copyright 2010 President and Fellows of Harvard College
Shoreline Surveys & Calculations
• Sample data from two shorelines will be provided for investigation. Using the data presented for each shoreline environment:
1) Fill out a data collection sheet(one is provided for you at SusanTaylorWorksheet.docx)
2) Calculate the Simpson diversity index for environments 1 & 2.
3)Predict which environment is more diverse.
Life Sciences - HHMI Outreach. Copyright 2010 President and Fellows of Harvard College
A Sample of Life at the Shore
Organisms under investigation:Common PeriwinkleCommon Sea StarMusselHorseshoe CrabLobster
Life Sciences - HHMI Outreach. Copyright 2010 President and Fellows of Harvard College
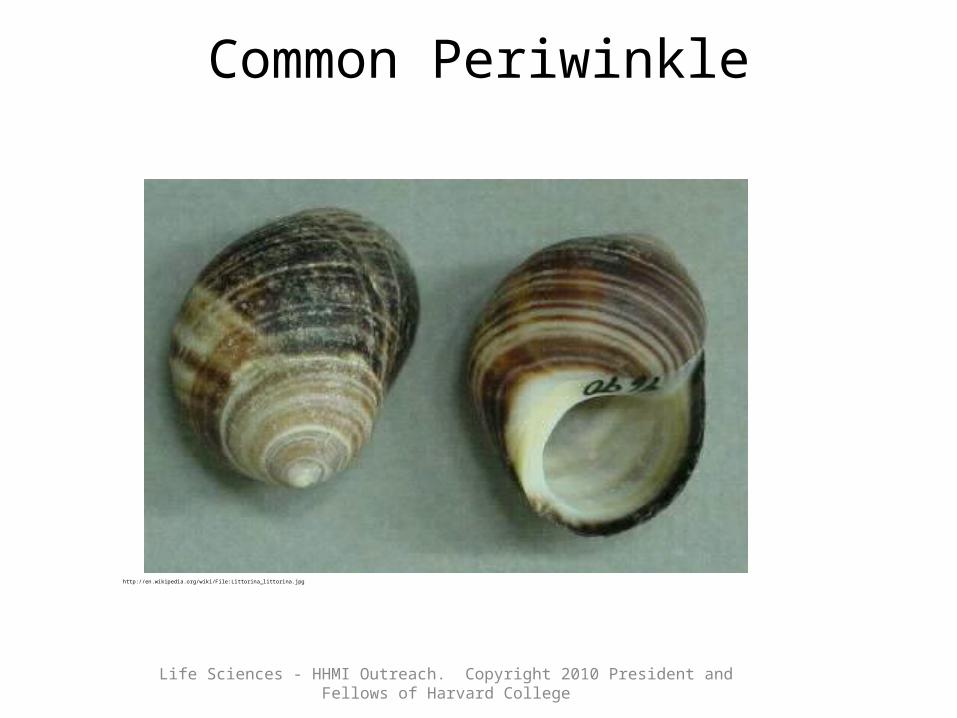
Common Periwinkle
Life Sciences - HHMI Outreach. Copyright 2010 President and Fellows of Harvard College
http://en.wikipedia.org/wiki/File:Littorina_littorina.jpg
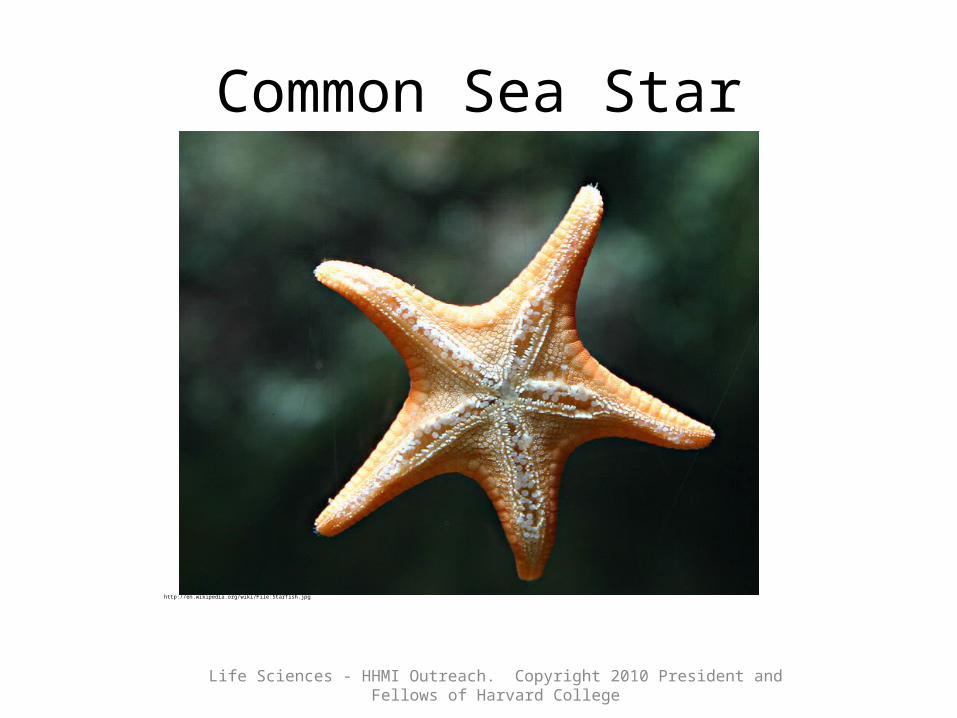
Common Sea Star
Life Sciences - HHMI Outreach. Copyright 2010 President and Fellows of Harvard College
http://en.wikipedia.org/wiki/File:Starfish.jpg
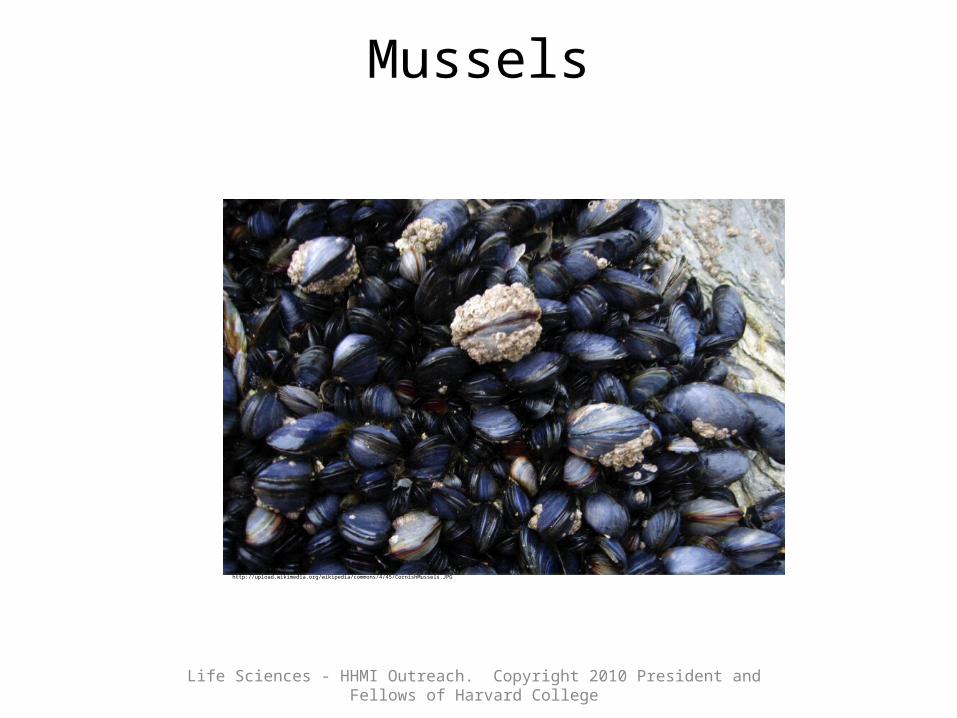
Mussels
Life Sciences - HHMI Outreach. Copyright 2010 President and Fellows of Harvard College
http://upload.wikimedia.org/wikipedia/commons/4/45/CornishMussels.JPG
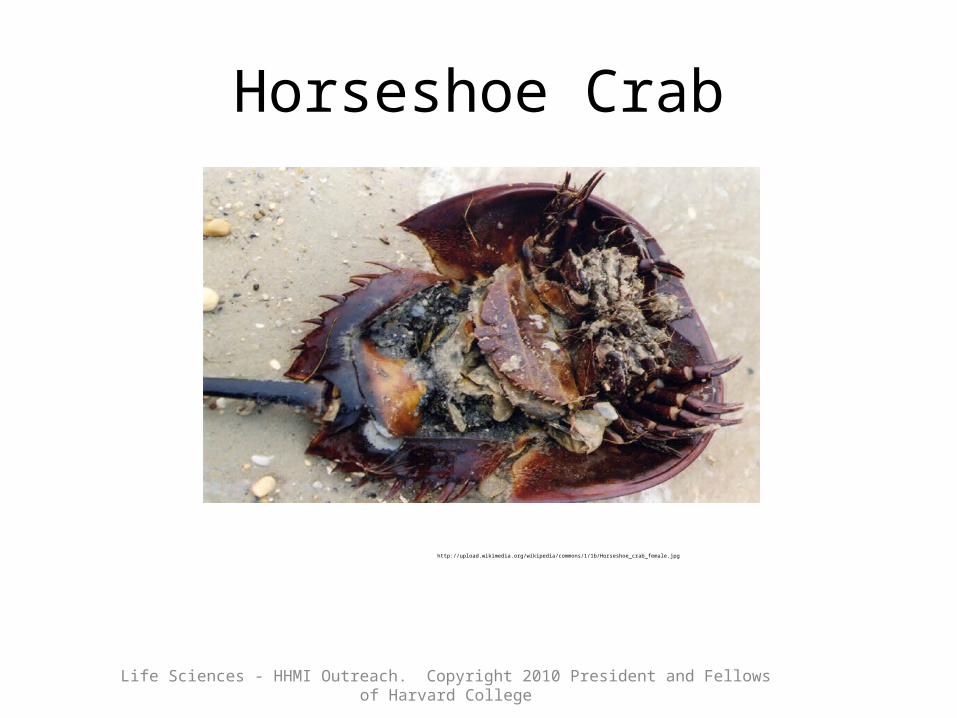
Horseshoe Crab
http://upload.wikimedia.org/wikipedia/commons/1/1b/Horseshoe_crab_female.jpg
Life Sciences - HHMI Outreach. Copyright 2010 President and Fellows of Harvard College
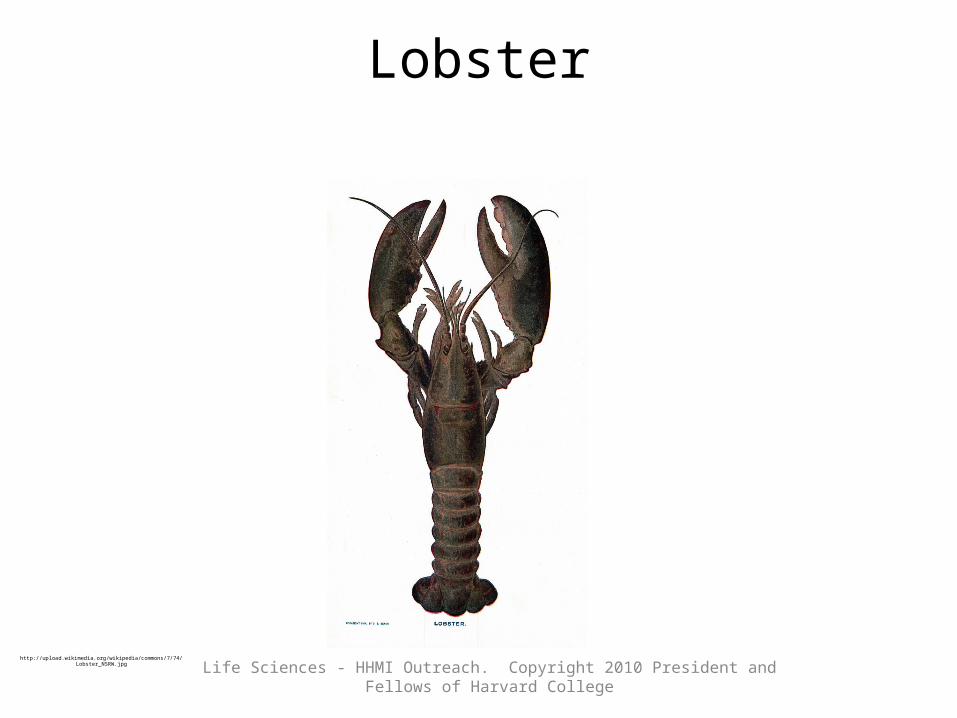
Lobster
Life Sciences - HHMI Outreach. Copyright 2010 President and Fellows of Harvard Collegehttp://upload.wikimedia.org/wikipedia/commons/7/74/Lobster_NSRW.jpg
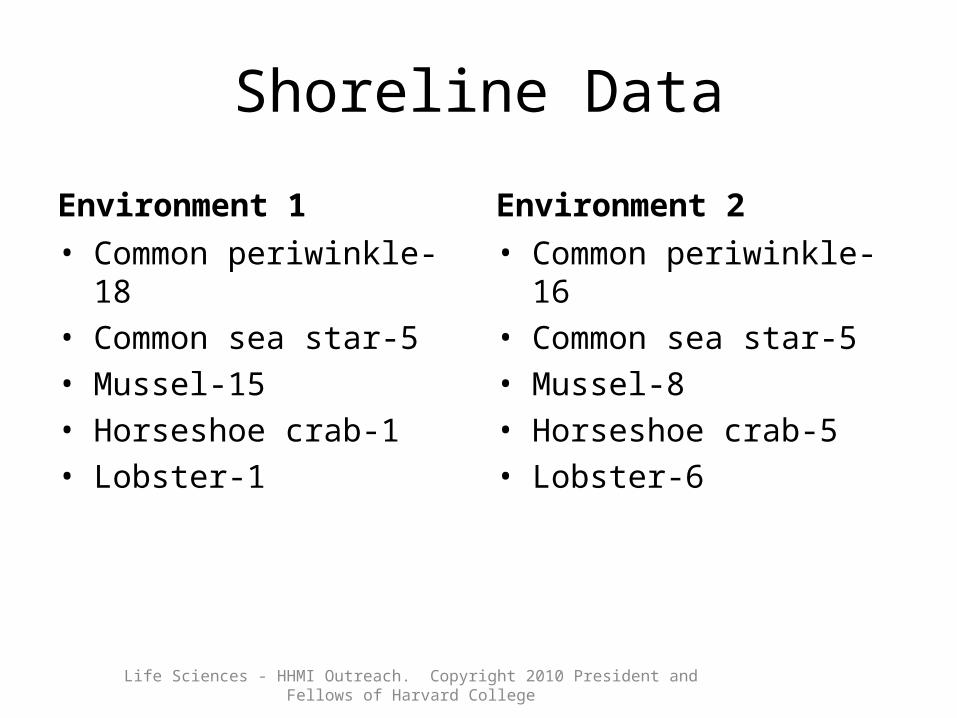
Shoreline Data
Environment 1• Common periwinkle-18• Common sea star-5• Mussel-15• Horseshoe crab-1• Lobster-1
Environment 2• Common periwinkle-16• Common sea star-5• Mussel-8• Horseshoe crab-5• Lobster-6
Life Sciences - HHMI Outreach. Copyright 2010 President and Fellows of Harvard College
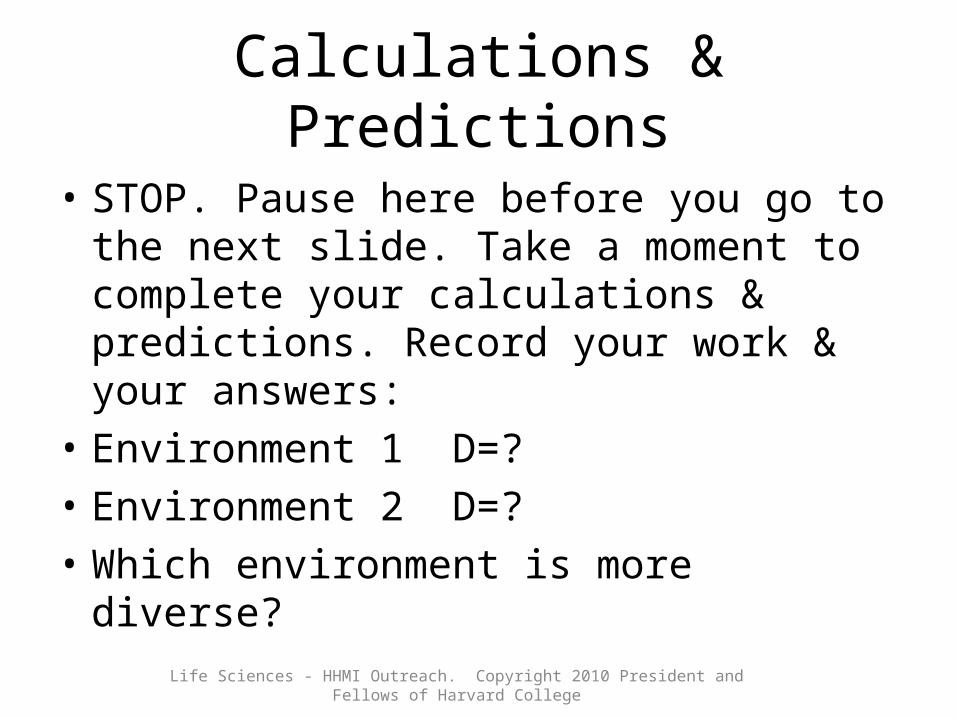
Calculations & Predictions
• STOP. Pause here before you go to the next slide. Take a moment to complete your calculations & predictions. Record your work & your answers:
• Environment 1 D=?• Environment 2 D=?• Which environment is more diverse?
Life Sciences - HHMI Outreach. Copyright 2010 President and Fellows of Harvard College
Calculation Verification
• The following slides contain calculation charts & answers to help you confirm your work.
Life Sciences - HHMI Outreach. Copyright 2010 President and Fellows of Harvard College
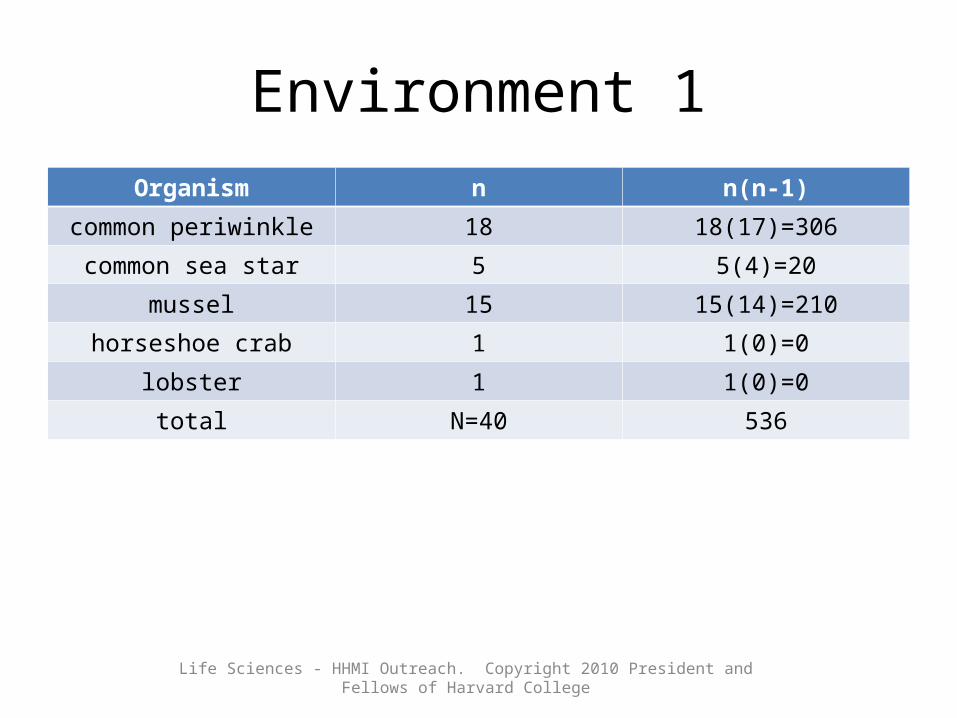
Environment 1Organism n n(n-1)
common periwinkle 18 18(17)=306
common sea star 5 5(4)=20
mussel 15 15(14)=210
horseshoe crab 1 1(0)=0
lobster 1 1(0)=0
total N=40 536
Life Sciences - HHMI Outreach. Copyright 2010 President and Fellows of Harvard College
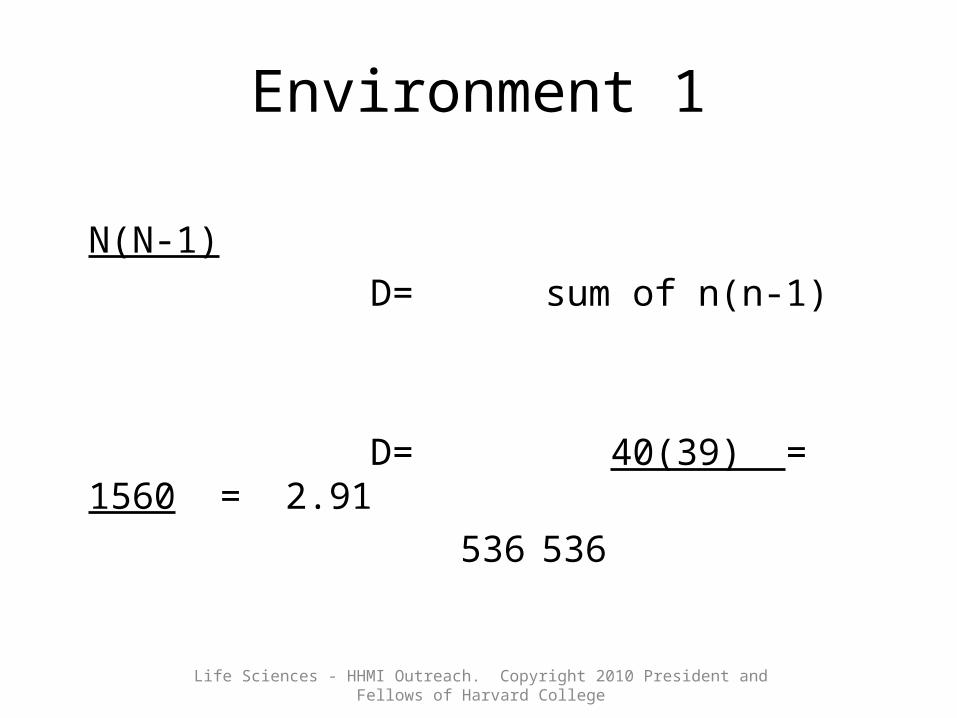
Environment 1
N(N-1) D= sum of n(n-1) D= 40(39) = 1560 = 2.91
536 536
Life Sciences - HHMI Outreach. Copyright 2010 President and Fellows of Harvard College

Environment 2Organism n n(n-1)
common periwinkle 16 16(15)=240
common sea star 5 5(4)=20
mussel 8 8(7)=56
horseshoe crab 5 5(4)=20
lobster 6 6(5)=30
total N=40 366
Life Sciences - HHMI Outreach. Copyright 2010 President and Fellows of Harvard College
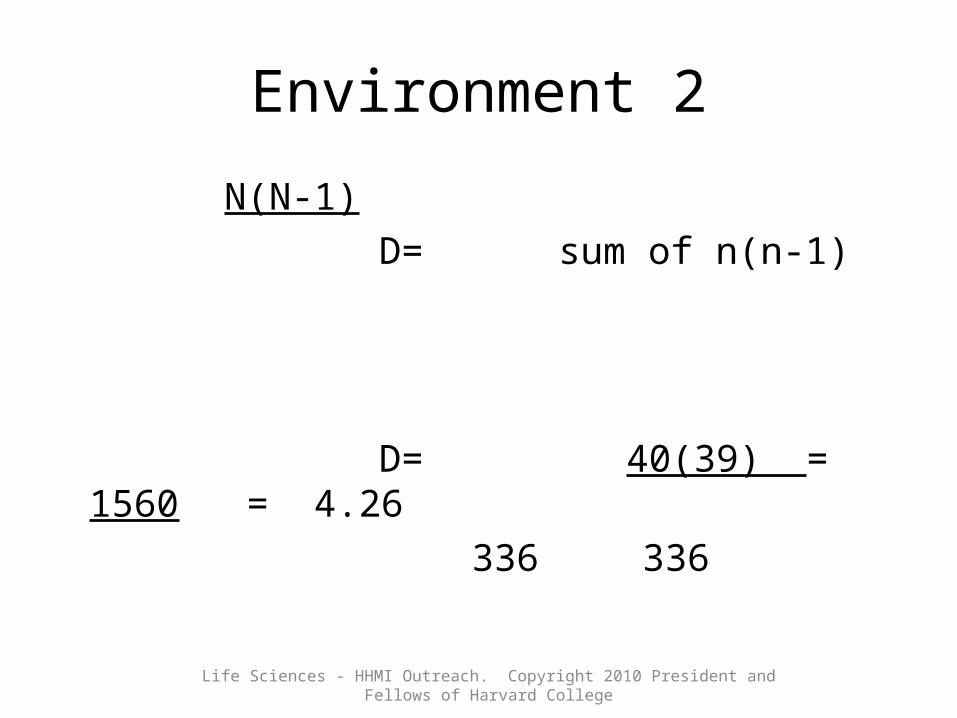
Environment 2
N(N-1) D= sum of n(n-1) D= 40(39) = 1560 = 4.26
336 336
Life Sciences - HHMI Outreach. Copyright 2010 President and Fellows of Harvard College
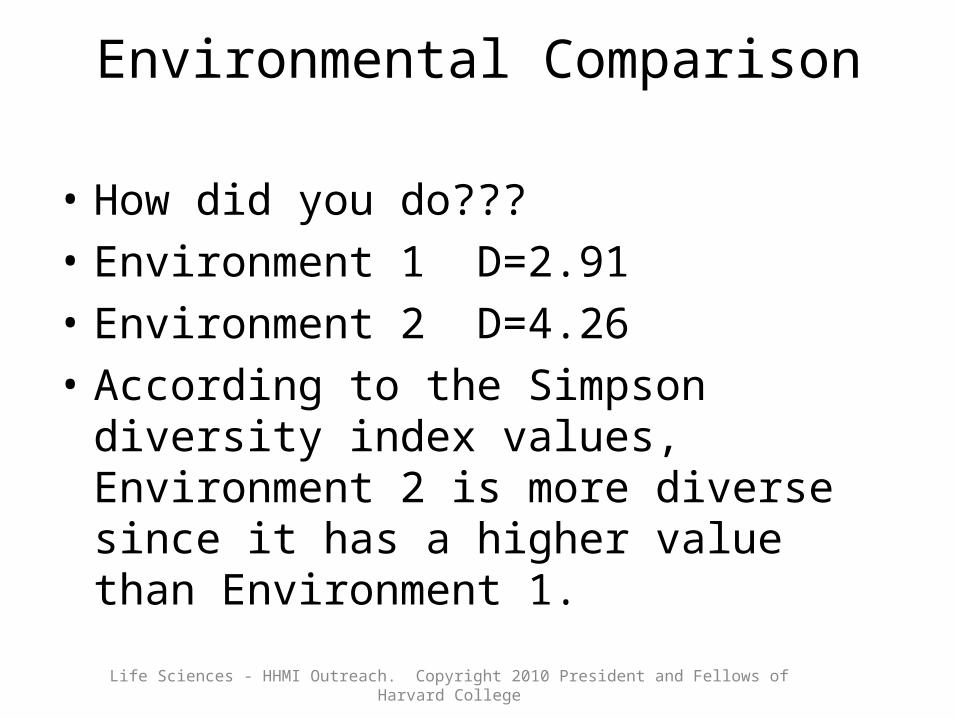
Environmental Comparison
• How did you do???• Environment 1 D=2.91• Environment 2 D=4.26• According to the Simpson diversity index
values, Environment 2 is more diverse since it has a higher value than Environment 1.
Life Sciences - HHMI Outreach. Copyright 2010 President and Fellows of Harvard College
Further Investigation
• Here are some suggestions for further study:• Using the same organisms, create different scenarios
by varying N( the total number of organisms present) or by varying the number of each organism to see how it affects the Simpson diversity index.
• Select an alternate ecosystem and organisms of choice, complete various data tables and calculations.
• Expand this investigation of diversity by making actual field collections in order to work with data you have collected yourself.
Life Sciences - HHMI Outreach. Copyright 2010 President and Fellows of Harvard College
References Cited• Allott, Andrew, Biology for the IB Diploma, Oxford: Oxford University Press, p. 156.• Damon, Alan, McGonegal, Randy, Tosto, Patricia & William Ward, Higher Level Biology, Edinburgh Gate, Harlow, Essex:
Heinemann International, 2007, p.572-3.• Common Starfish Image. http://en.wikipedia.org/wiki/File:Starfish.jpg • Horseshoe Crab Image. http://en.wikipedia.org/wiki/File:Horseshoe_crab_female.jpg • Lobster Image. http://en.wikipedia.org/wiki/File:Lobster_NSRW.jpg#globalusage• Mussels Image. http://en.wikipedia.org/wiki/File:CornishMussels.JPG • Periwinkle Image. http://en.wikipedia.org/wiki/File:Littorina_littorina.jpg• Shoreline Image. http://en.wikipedia.org/wiki/File:RI_towns_Narragansett.png
Life Sciences - HHMI Outreach. Copyright 2010 President and Fellows of Harvard College


