

A SOVEREIGN MONEY LAUNDERING SCHEME
Lebanon: Iran’s Financial Safe Haven

www.uani.com 2
The Strength of Lebanon’s Economy and the
Strength of its Sovereign Debt is Inexplicable and
an International Outlier
1. Lebanon’s Tenuous Politics
2. By Traditional Indicators, Lebanon’s Economy is in Shambles
3. Lebanese Sovereign Debt Suspiciously Trades at Low Yields with No Rational Economic Explanation
4. Credit Default Swaps to Insure its Sovereign Debt Trade at Very Low Premiums
5. Where is the Investment Demand for Lebanese Bonds Coming From?
6. Next Steps & U.S. Government Action

www.uani.com 3
1. Lebanon’s Tenuous Politics

Country Overview
www.uani.com 4
General
Population 4.2 million
Area 10,450 sq km
Languages Arabic, English, French
Borders Syria, Israel, Mediterranean Sea
Nationality Sunni, Shia, Christian
Capital Beirut
Political Structure
Political Parties
Organized on sectarian basis
The “March 14” alliance is headed by
the Future Movement (Sunni) with the
Lebanese Forces (Christian) in loose
alliance with the Progressive Socialist
Party (Druze) and the Phalange
(Christian)
The “March 8” block comprises
Hezbollah (Shia), Amal (Shia) and Free
Patriotic Movement (Christian)
Form of State
Parliamentary republic
The national assembly has 128 seats
equally divided between Muslims and
Christians
Prime Minister Najib Mikati (Sunni)
President Michael Suliman (Maronite Christian)
Next Elections June 2013
Economic Data
Currency
Lebanese Lira/Pound (LBP)
The LBP is kept at a tight exchange
rate band to the USD
GDP US$38.5 billion
Gross Government Debt US$53.8 billion
Growth8.1% average 2007-2010
Expected 1.5% in 2011
GDP Per Capita US$15,600
Main Industries Banking, tourism
Source: CIA World Factbook

Lebanon’s Politics & its False Economy
• A Precarious Political Situation
– Severe domestic political tensions with a Hezbollah-dominated cabinet
– Heavily influenced by the neighboring political conflict in Syria
– Upcoming elections in June 2013
• Deceiving the Markets & Artificially Stabilized Sovereign Debt
– Real risk of Lebanese debt not accurately reflected in the markets
• Unstable economy with severe debt burden – one of the highest in the world
• Lebanon unable to reduce budget deficit with declining underlying growth
– Lebanese sovereign bond pricing does not reflect these major issues
• Sovereign default has artificially maintained a low-risk profile
– Evidence of third party (Iran/Syria) influence, and/or corruption artificially propping up the
Lebanese economy
www.uani.com 5

A Precarious Political
Situation
• Entrenched in sectarian tensions keep market reforms slow and cautious
– Cabinet composed largely of Hezbollah members (“March 8th” alliance), supported by Iran and Syria
– “March 8th” and “March 14th” have about even allocations in parliament with elections in 2013
• Political crisis in Syria will have an important bearing on the balance of power in Lebanon
– Civil uprising against Bashar al-Assad’s regime has led to increased violence in Syria
– Lebanon abstained from voting on the Arab League sanctions against Syria
– As more Syrians flee to Lebanon, there is increasing risk of spillover
• Despite relative government stability following the assassination of Prime Minister Rafiq al-Hariri, unity remains precarious
– UN investigation calls for the arrest of four Hezbollah members
– The Lebanese government only agreed recently to hold to its part of financing the investigation
• Potential armed conflict with Israel
– Hezbollah has rearmed after the 2006 conflict with Israel
– An Israel-Iran conflict could draw in Hezbollah as a local proxy for Iran
• Relations with moderate allies impaired
– Politicians aligned with the Assad regime may face censure from Arab allies in post-Assad world
– U.S., France and Saudi Arabia, who support the “March 14” block will remain wary of Hezbollah's influence in Lebanon
The potential for political instability
creates a downside risk to GDP
growth and to the overall economy.
www.uani.com 6

www.uani.com 7
2. By Traditional Indicators, Lebanon’s
Economy is in Shambles
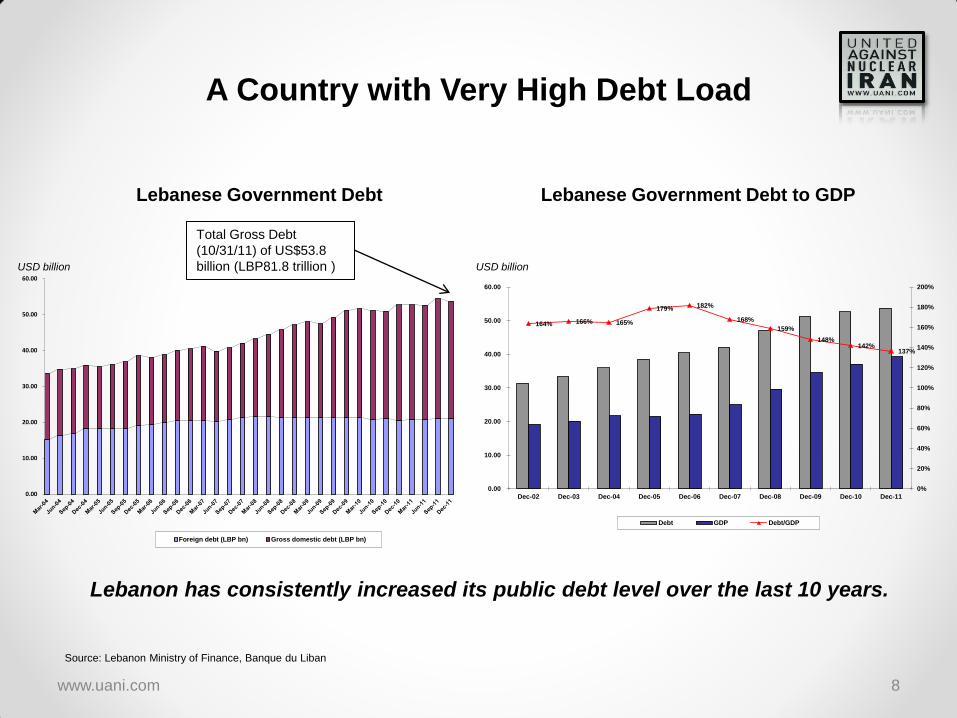
A Country with Very High Debt Load
Lebanese Government Debt Lebanese Government Debt to GDP
www.uani.com 8
Total Gross Debt
(10/31/11) of US$53.8
billion (LBP81.8 trillion )
Lebanon has consistently increased its public debt level over the last 10 years.
Source: Lebanon Ministry of Finance, Banque du Liban
0.00
10.00
20.00
30.00
40.00
50.00
60.00
Foreign debt (LBP bn) Gross domestic debt (LBP bn)
164% 166% 165%
179% 182%
168%
159%
148%142%
137%
0%
20%
40%
60%
80%
100%
120%
140%
160%
180%
200%
0.00
10.00
20.00
30.00
40.00
50.00
60.00
Dec-02 Dec-03 Dec-04 Dec-05 Dec-06 Dec-07 Dec-08 Dec-09 Dec-10 Dec-11
Debt GDP Debt/GDP
USD billion USD billion

…One of the Highest Debt Levels in the World
www.uani.com 9
Debt to GDP – The International Benchmark
Lebanon has the fourth largest debt to GDP ratio in the world, higher than several
of the most distressed economies in the world such as Ireland and Italy.
Source: International Monetary Fund, figures as of 2010
0.0%
50.0%
100.0%
150.0%
200.0%
250.0%

10.7%
8.6%
3.8%
2.5%
7.6%
5.2%
1.9%
5.7%
5.1%
0.0%
2.0%
4.0%
6.0%
8.0%
10.0%
12.0%
0
500
1,000
1,500
2,000
2,500
3,000
3,500
4,000
4,500
Dec-02 Dec-03 Dec-04 Dec-05 Dec-06 Dec-07 Dec-08 Dec-09 Dec-10
Debt service Deficit % deficit / GDP
Misc Tax Revenues, 26.2%
Customs Revenues,
18.4%VAT Revenues,
21.0%
Non Tax Revenues,
13.5%
Deficit, 20.9%
A Country that Carries a High Budget Deficit,
Heavily Impacted by its Debt Burden
Deficit as % of GDP and Debt Service Breakdown of Revenue and Deficit
www.uani.com 10
Total Expenses US$9.9
million (2010)
Budget and Deficit
Source: Lebanon Ministry of Finance
USD mm
USD mm Dec-02 Dec-03 Dec-04 Dec-05 Dec-06 Dec-07 Dec-08 Dec-09 Dec-10 Sep-10 Sep-11
Revenue 3,587 4,132 4,701 4,641 4,577 5,378 6,508 7,998 7,986 5,853 6,604
General expenditure 2,568 2,615 2,847 2,836 3,239 3,409 3,773 6,113 5,960 4,366 4,892
Debt service 3,071 3,239 2,672 2,348 3,028 3,282 3,294 3,843 3,916 2,967 2,785
Total expenditure 5,639 5,854 5,519 5,184 6,267 6,691 7,067 9,956 9,876 7,332 7,677
Deficit (2,052) (1,722) (818) (544) (1,690) (1,313) (559) (1,959) (1,890) (1,479) (1,073)
GDP 19,184 20,117 21,775 21,524 22,218 25,061 29,646 34,620 37,104
% deficit / Expenditure 36.4% 29.4% 14.8% 10.5% 27.0% 19.6% 7.9% 19.7% 19.1% 20.2% 14.0%
% deficit / GDP 10.7% 8.6% 3.8% 2.5% 7.6% 5.2% 1.9% 5.7% 5.1%

Struggling to Reduce
the Budget Deficit
• The Lebanese government has struggled to pass budgets for the last 5 years due to political disputes and external conflicts
– 2012 budget is now before the cabinet
– 2012 budget includes contentious tax increases which would help pull in revenue but may prevent budget from being passed
– Tax increase are expected to impose additional burden on the weaker social layers
• The electricity sector is in bad shape and in dire need of reform
– The country continues to suffer from power shortages, particularly in the summer months
– A large investment program was recently approved by the cabinet for US$5 billion
• Privatization initiatives aimed at freeing up government resources are not moving forward
– Private sector sees high political risk in Lebanon and has lowered demand for privatized assets
– Infrastructure development in partnership with the private sector is slow
• Government income from the telecom sector is booked in its fiscal statistics based on expected surplus rather than actual transfers
– Expected income is not a reliable for debt servicing
The politically entrenched process
has prohibited material economic
progress.
www.uani.com 11

A Country with a Consistent Current
Account Deficit
Import and Export Current Account Deficit as % of GDP
www.uani.com 12
Trade Statistics
Source: Lebanon Ministry of Finance
2002 2003 2004 2005 2006 2007 2008 2009 2010
Export ($m) 1,045 1,524 1,747 1,880 2,282 2,816 3,478 3,484 4,253
Import ($m) 6,445 7,168 9,397 9,340 9,398 11,815 16,137 16,242 17,964
Current acount deficit ($m) 5,400 5,644 7,650 7,460 7,116 8,999 12,659 12,758 13,711
GDP ($bn) 19.18 20.12 21.78 21.52 22.22 25.06 29.65 34.62 37.10
% CA deficit / import 83.8% 78.7% 81.4% 79.9% 75.7% 76.2% 78.4% 78.5% 76.3%
% CA deficit / GDP 28.1% 28.1% 35.1% 34.7% 32.0% 35.9% 42.7% 36.9% 37.0%
1,045 1,524 1,747 1,880
2,282 2,816
3,478 3,484 4,253
6,445 7,168
9,397 9,340 9,398
11,815
16,137 16,242
17,964
0
2,000
4,000
6,000
8,000
10,000
12,000
14,000
16,000
18,000
20,000
2002 2003 2004 2005 2006 2007 2008 2009 2010
Export Import
28.2% 28.1%
35.2% 34.7%
32.1%
36.0%
42.8%
36.9% 37.0%
0.0%
5.0%
10.0%
15.0%
20.0%
25.0%
30.0%
35.0%
40.0%
45.0%
0
5,000
10,000
15,000
20,000
25,000
Dec-02 Dec-03 Dec-04 Dec-05 Dec-06 Dec-07 Dec-08 Dec-09 Dec-10
Current account deficit% CA deficit / GDP
USD mm USD mm

Underlying Growth is Declining
Lebanon Historical and Projected GDP
• The Lebanese economy is facing a material slowdown in GDP growth
– “After four years of strong growth, Lebanon’s economy has lost momentum, reflecting domestic political uncertainty and regional unrest…” (IMF, November 2011)
• Lebanon’s growth prospects will depend upon regional performance as Arab states are the principal consumer of Lebanon’s service-oriented economy
– Unrest in the region impacts tourism in Lebanon; tourists are primarily from Arab countries and have chosen more stable destinations like Turkey or Morocco
– Tourism indirectly supports ¼ of jobs and generates much of the demand for construction
• Heavy government borrowing and limited price competition suggests that banks’ prime lending rates will remain prohibitively expensive for small and medium businesses, putting pressure on real economic growth
• Lebanese growth will continue to struggle and all signs point to even higher risk of sovereign debt default
Lebanon Growth Relative to Other Arab
Nations
www.uani.com 13
Source: Lebanon Ministry of Finance
8.20% 8.50%9.00%
7.10%
1.50%
3.40%
4.70%
0.00%
1.00%
2.00%
3.00%
4.00%
5.00%
6.00%
7.00%
8.00%
9.00%
10.00%
2007 2008 2009 2010 2011 2012 2013
7.1%
5.1%
3.7%
3.2% 3.1%
2.3%
1.5%1.2%
4.6%
-2.0%
0.0%
2.5%
3.4%
1.8%
4.6%
1.5%
3.9%
2.9%
-2.0%
-1.0%
0.0%
1.0%
2.0%
3.0%
4.0%
5.0%
6.0%
7.0%
8.0%
Lebanon Egypt Morocco Syria Tunisiia Jordan
2010 2011 2012

www.uani.com 14
3. Lebanese Sovereign Debt Suspiciously Trades at
Low Yields with No Rational Economic Explanation

Lebanon’s Weak Economy and Political
Situation is Reflected in its Weak Credit Rating
Lebanon’s Rating
“The ratings are constrained by our view of Lebanon's high
public debt burden, large external imbalances, and the risk
of a breakdown of the current consensus in the
government…”
“…key source of political tension at present is the U.N.
Special International Tribunal's investigation into the
circumstances surrounding the assassination of Prime
Minister Rafik Hariri…could ultimately cause Hezbollah to
withdraw from the government. We believe that this would
severely undermine prospects for sustainable growth and
political stability…”
“Lebanon's current account deficit, which stands at over 20%
of GDP, remains in our view a source of vulnerability and we
believe its financing will remain highly reliant on continued
investor confidence over the medium term.”
S&P, November 2010
Selected Comparable Country Ratings &
Cost of Debt
www.uani.com 15
Long Term Short Term Outlook
Moody's B1 - Stable
S&P B B Stable
Fitch B B Stable
10yr Bond
Yield
Moody's S&P Fitch (4/17/12)
Bulgaria Baa3 BBB BBB- -
Egypt Ba3 BB BB 6.9 or 8.2
Gabon - BB- BB- 4.250
Georgia Ba3 B+ B+ 5.650
Ghana - B B+ -
Greece C CCC B- -
Indonesia Ba1 BB+ BB+ 6.050
Ireland Ba1 BBB+ BBB+ 6.800
Israel A1 A+ A 3.950
Jamaica B3 B- B- 7.500
Jordan Ba2 BB - -
Lebanon B1 B B 5.400
Lithuania Baa1 BBB BBB- 5.800
Nigeria - B+ BB- -
Philippines Ba2 BB BB+ 3.100
Senegal B1 B+ - 7.450
Spain A3 AA- AA- 5.850
Sri Lanka - B+ BB- 5.950
Turkey Ba2 BB BB+ 5.100
Ukraine B2 B+ B 9.450
Vietnam B1 BB B+ 5.250
Source: Bloomberg

Lebanese Historic Cost of Debt
www.uani.com 16
Historically, cost of Lebanese sovereign debt was much higher in 2006 and 2007
(~9%) than is it today (~5% to 6%).
Source: Bloomberg
Cost of Debt 2005-2007 Cost of Debt in 2012

277
324
367 371 379
408
461
484
200
250
300
350
400
450
500
2 yr 3 yr 5 yr 10 yr
Government bond spread CDS spread
Sovereign Bonds are Trading at Tight Spreads
Lebanon Government Bond Trading Stats
Lebanon government bonds trade at high cash prices, reflecting spreads even lower than applicable CDS* spreads, falsely suggesting that
these bonds are backed by a more robust economy than that of Lebanon.
Government Bond Spread vs. CDS
www.uani.com 17
Sovereign Bonds Trade Well Lebanon CDS Spreads Are Range-Bound
Recently and counter to intuition, both CDS and cash bonds are going up.
Source: Bloomberg
Maturity Coupon Price Yield
Benchmark
Yield Spread
3/25/2014 6.00% 105.1 304 27 277
5/2/2014 9.00% 111.2 306 27 279
4/22/2015 6.00% 106.2 365 41 324
7/15/2015 6.00% 106.3 376 41 335
11/30/2015 6.00% 106.3 397 41 356
1/19/2016 8.50% 114.6 410 87 323
5/11/2016 11.63% 127.0 413 87 326
3/20/2017 9.00% 118.9 454 87 367
11/12/2018 5.15% 100.6 496 87 409
11/28/2019 5.45% 100.7 526 201 325
4/12/2021 8.25% 118.9 548 201 348
10/4/2022 6.10% 102.5 572 201 371
*Credit Default Swaps (CDS): A financial swap designed to transfer the credit exposure of fixed income products between parties. The buyer of a CDS receives credit protection,
and the seller of a swap guarantees the credit worthiness of the debt security.

www.uani.com 18
4. Credit Default Swaps to Insure its Sovereign Debt
Trade at Very Low Premiums

Premium to Insurance Against Sovereign
Default Suspiciously Remains at Low Levels
Lebanese
5 Year
CDS 4.45%
www.uani.com 19
08/2006:
Hezbollah War
with Israel
Q4 2008: Global
Financial Crisis
04/2010:
Greek/European
Financial Crisis
01/2011:
Beginning of Arab
Spring
H2 2011:
Increasing Unrest
in Syria
Source: Bloomberg
In spite of severe risk indicators, the market registers Lebanese CDS as less risky.
Lebanon 5 Year Credit Default Swap (CDS) Spread Levels

* Excluding recent movement due to default. Data as of 03/28/2012.
Low CDS Levels Difficult to Justify
5 Year CDS Spreads of Selected Countries
www.uani.com 20
Source: Bloomberg

www.uani.com 21
5. Where is the Investment Demand for Lebanese
Bonds Coming From?

Deposits with central bank, 32.8%
Claims on private sector, 24.1%
Claims on public sector, 21.4%
Foreign assets, 18.6%
Fixed assets, 2.4%
Unclassified assets, 0.6%
Unexplained Inflows into Lebanon’s
Commercial Banking System
Bank’s Claim on Public Sector vs. Debt Bank Asset Split
• The commercial banking system has been the leading factor in the demand for government bonds both in local and foreign currency
• Over the last few years, the Lebanese commercial banks have enjoyed material inflows of deposits. Those deposits, however, carry a relatively high interest rate and need to be put to work (LBP savings account at 2.59% and LBP checking/current accounts at 0.91%). A significant portion goes to buying government bonds.
• The fact that cash bonds trade at significantly tighter spreads than CDS supports the notion that Lebanese bonds are inflated by significant inflows of funds into the banking system rather than fundamental investment analysis.
www.uani.com 22
Split of Subscriptions in Recent Auction
13%9%
23%
38%51%
31%
48%37%
45%
0%
10%
20%
30%
40%
50%
60%
70%
80%
90%
100%
Jul-11 Aug-11 Sep-11
Public institutions BanksCentral bank Other
31,193 32,423
38,314
43,812 44,192 45,008
60,857 63,364
70,941
77,112 79,298
81,956
Dec-06 Dec-07 Dec-08 Dec-09 Dec-10 Nov-11
Claims to public sectorTotal gross debt
Source: Banque du Liban

Increasing Money Supply
www.uani.com 23
A clear gradual increase in money supply. Where is it coming from?
Source: Banque du Liban
0.00
20.00
40.00
60.00
80.00
100.00
120.00Ja
n-0
4
Ju
n-0
4
No
v-0
4
Ap
r-0
5
Se
p-0
5
Fe
b-0
6
Ju
l-0
6
De
c-0
6
Ma
y-0
7
Oct-
07
Ma
r-0
8
Au
g-0
8
Ja
n-0
9
Ju
n-0
9
No
v-0
9
Ap
r-1
0
Se
p-1
0
Fe
b-1
1
Ju
l-1
1
De
c-1
1
USD billion

$0
$5
$10
$15
$20
$25
Ju
n-0
3
Ja
n-0
4
Au
g-0
4
Fe
b-0
5
Se
p-0
5
Ma
r-06
Oct-0
6
Ap
r-07
No
v-0
7
Ju
n-0
8
De
c-0
8
Ju
l-09
Ja
n-1
0
Au
g-1
0
Fe
b-1
1
Se
p-1
1
Ap
r-12
Oct-1
2
2011 to 2012:
The Syrian uprising
begins as a modest
movement in early
2011, but grows
increasingly violent as
protestors continue to
call for the resignation
of President Bashar al-
Assad and the
overthrow of his
government.
Increased Inflows Coinciding with
the Syrian Conflict?
Foreign Currency Deposits in Lebanon of Non-Residents
www.uani.com 24
The increase in
inflows has likely
been partially
influenced by the
Syrian conflict.
However, the
increase of foreign
currency deposits
appear to more
closely follow other
events…
Source: Bank of Lebanon
USD billion

$0
$5
$10
$15
$20
$25
Ju
n-0
3
Ja
n-0
4
Au
g-0
4
Fe
b-0
5
Se
p-0
5
Ma
r-06
Oct-0
6
Ap
r-07
No
v-0
7
Ju
n-0
8
De
c-0
8
Ju
l-09
Ja
n-1
0
Au
g-1
0
Fe
b-1
1
Se
p-1
1
Ap
r-12
Oct-1
2
2004 to 2007:
Weaker Iran sanctions or limited
to individuals or businesses
directly linked with nuclear
program
2008 to 2012:
International efforts to tighten
sanctions against Iran
significantly intensify, starting
with UN Resolution 1803 (March
2008) and culminating with
tougher sanctions against
institutions dealing with the
Central Bank of Iran in
December 2012
Increased Inflows Coincides with Sanctions
Against Iran
Foreign Currency Deposits in Lebanon of Non-Residents
www.uani.com 25
The increase in
inflows coincides
with the adoption of
more robust Iran
sanctions,
indicating a likely
relationship.
Source: Banque du Liban
USD billion

A Sovereign Money Laundering Scheme
www.uani.com 26
The Iran-Lebanon Connection
Drives Lebanese
Sovereign Bond
Prices Down Despite
Lebanon’s Weak
Fiscal Regime
Cash from Iran
Lebanese
Commercial Banks
Lebanese
Commercial Banks
Purchase Lebanese
Sovereign Bonds
Vital
Corresponding
Relationship
U.S. & EU Banks
Int’l Purchases (U.S. & EU) and Int’l Institutions (U.S. & EU) that Facilitate Bond or
CDS Transactions Legitimize Banking Regime and Perpetuate Fraudulent Acts

www.uani.com 27
6. Next Steps & U.S. Government Action

Rating Agencies Should Issue a ‘No Rating’
for Lebanese Bonds
• A bond credit rating assesses the credit worthiness of a corporation’s or a government’s debt
issues
• Rating agencies that issue any kind of rating (either ‘investment grade’ or ‘junk bonds’) help to
legitimize the exchange of these artificially stable bonds
• UANI calls upon all credit rating agencies to withdraw ratings for Lebanese bonds due to
their fraudulent values
– Without an official rating, no reputable institution would purchase such bonds
– Without an official rating, no institution can justify the purchase of Lebanese bonds to its
clients
– A ‘no rating’ will drive buyers and sellers out of the Lebanese bond market
• Further, there is already an extremely small ownership level by foreign institutions of Lebanese
bonds
www.uani.com 28
Lebanese Sovereign Bonds
Total Bonds Outstanding 21,559,668,069.90$
Total Bonds Foreign Owned 559,892,335.00$
% Foreign Owned 2.60%
Source: Bloomberg, figures as of April 9, 2012

Lebanese Bond Holders & Firms
Facilitating Transactions
• Institutions that engage in the buying and
selling of Lebanese bonds help legitimize
this debt instrument as a serious investment
• By investing in Lebanese bonds, institutions
facilitate the Iranian regime in hiding large
amounts of hard currency in the Lebanese
banking system
– Providing a safe haven for Iranian
currency as the regime actively
pursues an illicit nuclear program,
supports terrorism and is responsible
for egregious human rights abuses
• Firms cannot justify holding/facilitating
transactions of junk-rated Lebanese bonds
that have been artificially valued as a
sovereign money laundering enterprise
• UANI calls on all such firms to divest
from Lebanese sovereign debt and to
end its transaction services for these
bonds and CDS
www.uani.com 29
Lebanese Bond Holders
Advanced Series Trust
AGF Management Limited
Aktia Fund Management Ltd
Aletti Gestielle SGR SPA
American Life Insurance Company
Amundi
Aviva Funds Sicav
Blackrock Asset Management
Blackrock Fund Advisors
BNP Paribas Asset Management SG
Consultinvest Asset Management
Deka International SA
Eaton Vance Advisors Ireland Lt
Erste Sparinvest Kagmbh
Eurizon Capital SA
Fidelity Investments Canada Ltd
Fidelity Management & Research
Fideuram Gestions SA
GE Asset Management
GE Asset Management Incorporate
Hartford Life & Accident Ins Co
HSBC Investment Funds Inc
Interfund Advisory Co SA
JP Morgan Investment Management
Jyske Invest
Lombard Odier Darier Hentsch
Mackay Shields Financial Corp
Nationwide Fund Advisors
Neuberger Berman LLC
Nord Est Asset Management SA
Normura Asset Management Co. Ltd.
Price T Rowe Associates Inc
RBC Global Investment Management Inc.
Riversource Investments LLC
San Paolo IMI Asset Management
SEI Investments Fund Management
Sparinvest
Sparinvest Fondsmaeglerselskab
T Rowe Price Global Asset Management
T Rowe Price Global Investment Management
Thrivent Financial Lutherans
Union Bancaire Privee
Union Investment Luxembourg SA
Universal Investment Lux SA
Source: B loomberg as o f M arch 30, 2012
Involved Parties of Bond Transactions
Abousleiman & Partners
Bank Audi SAE
Bank of America Merrill Lynch
Bank of Beirut
Bank of New York
Bank of New York London
Banque Audi Sal
Banque de la Mediterranee Sal
Banque Libanaise pour le Commerce
Banque Mediterranne
BLOM Bank SAL
BNP Paribas
BNP Paribas/London
Byblos Bank
Citigroup Global Markets Ltd
Credit Libanais SAL
Credit Suisse First Boston (Europe)
Credit Suisse First Boston Corp
Credit Suisse First Boston Ltd
Credit Suisse Securities USA LLC
Deutsche Bank AG
Deutsche Bank AG London
Deutsche Bank Luxembourg SA
Deutsche Bank Securities Inc
Deutsche Bank Trust Company Americas
Dewey & LeBoeuf LLP
Dewey Ballantine LLP/London
El Khoury & Partners
Fransabank SAL
Freshfields Bruckhaus Deringer
HSBC Bank PLC
HSBC Holdings
Lebanese Canadian Bank
LeBoeuf Lamb Greene & Macrae LLP
Merrill Lynch International
Morgan Stanley & Co International
Nabil Abdel-Malek
Societe Generale
Standard Chartered BankSource: B loomberg as o f April 17, 2012


