
CHAPTER-1
INTRODUCTION AND DESIGN OF THE STUDY
INTRODUCTION
Stress is the debilitating effects caused by constant pressure both at
work and home, are a modern phenomenon. However, stress, or at least
temporary stress, is a very necessary part of our lives. One important
function of short-term stress is to channel our resources to deal with
challenging or even life threatening situations.
Temporary stress, therefore, allows us an extra turn of speed in
escaping Danger it increases the speed of our reactions when, for example,
avoiding a Collision while driving, it recharges a mentally or physically
exhausted body to cope with greater challenges, and boosts an athlete’s
performance during an important event.
In prehistoric times, this bodily reaction to stress was exactly what
was needed. This is attributed to physiological changes that occurred to the
body when danger appeared. Chemicals, especially adrenalin, were released
into body and prepared it for fight or flight. The heart beat faster; blood
supply was transferred from the non-essential to the essential; from the skin
and digestive organs to the muscles and the head. The resulted both in clear,
Swifter thinking and faster, stronger muscular responses.
The lungs took in more oxygen, breathing became more, and the
body anticipated keeping cool increasing perspiration. Once the danger had
passed or fighting or fleeding had occurred (successfully!), the bodily 1
functions reverted to normal. In prehistoric times, these bodily responses
were vital for survival. Then the energy generated by stress was utilized in
physical action.
2
Today, however, the problems and stress that we experience have
changed radically and can rarely be resolved with physical action. We are
not designed to operate effectively in this hi-tech world. Hunting for food is
how replaced by jostling with our trolleys in supermarkets!
Psychological stresses lead to the same bodily state of arousal as
does fight and flight, but mostly without any accompanying physical activity
to use adrenalin and energy made available. When this stress is prolonged,
physical and mental damage will occur, sometimes resulting in serious
disease.
STUDY OF THE STRESS
Study and stress are closely related. In normal condition, stress
comes from school work, homework or from revising, also stress comes
from examinations, tests, you can’t control your mood in the student life, the
you will waste more effort in studying.
1. Sleeping
Anyone over the age of eighteen needs to sleep about 8 hour’s at
night. But many pupils have a very bad habit-they like to work on a certain
project or revise their homework overnight until the early morning, where
they found occasional pleasure. But this will affect their performance
tomorrow. As a good student, I think they should go to sleep at eleven and
wake up at seven so that they can work long enough for their work and on
the hands it can keep you at top state and so you can have better
performance in examinations or at school, so you can have your lesson
concentrated or get a god result.3
Of course, this kind of time management need a good planning and
well organized. But it is worth\ to do so. And you should know that you
should have a time table to guide your tasks.
2. Relax
It is better to relax yourself after a period of studying. Like a short
walk in fresh air as refreshment. Also using a hot drink can help you to
relax.
Study of the stress dangerous
Stress can be fatal. Let me give an example, the sport man broke their
record not on the quiet training tracks, but on the competition. Stresses in
competition is great, it comes from crowd, friends, trainers of your team,
media, and most important, you yourself. You want to gather prize from
competition so you get the stress, and at the same time stress makes you to
fight in competition, boost up yourself, because you want to have the joy
and happiness from the time to win. So it is clear to see that stress is
essential for people to do better.
But the ‘level’ of stress each people can suffer is different. Too much
stress is very dangerous.
Additional stress will become the barrier to success, worrying
about something that is useless, for example, when you taking exam, you
may be affected By stress and you become lost confidence and can’t
concentrate.
4
But too little stress is also disastrous. If you do not have force
comes from your life, then you will not have interest in living due to little
changing, and you will feel life is boring and that comes to poor
performance.
So there is graph representing our stress against working performance, like
our body cells and enzymes, you yourself works effectively only in certain
stress range, too little stress comes to inability of your mind and works
poorly, and too much stress will make us ‘denatured’, that means we cannot
suffer the stress from work and instead, you will escape from reality.
Stress Management.
Provide stress management training and an employee assistance
program (EAP) important workers to cope with difficult work situations.
Nearly on-half of large companies in the United States provide so
management training for their
Workforces Stress management programs teach workers about the
nature and so effects of stress on health, and personal skills to reduce stress-
for example, time management or relaxation exe individual counseling for
employees with both work and personal problems. Stress management
training may rah symptoms such as anxiety and sleep disturbances; it also
has the advantage of being inexpensive and easy to it stress management
programs have two major disadvantages:
The beneficial effects on stress symptoms are often short-lived.
They often ignore important root causes of stress because they focus on
the worker and not the environment.5
Organization Change
Bring is consultant to recommend ways to improve working
conditions. This approach way to reduce stress at work. It involves the
identification of stressful aspects of work (e.g., excessive workload,
expectations) and the design of strategies to reduce or eliminate the
identified stressors.
The advantage of this a directory with the root causes of stress at
work. However, managers are sometimes uncomfortable with this approach
involve changes in work routines or production schedules, or changes in the
organizational structure.
Study of the Physical action on handle stress
Work for what you want
I think everyone should have something he/she’s interested, for
example, reading comics, watching TV, or just sports. These area
effective medicines for your stress!
Talk with others
Another effective method of solving stress is by social method- a
quite effective way. Anyone who has pressure or stress can talk freely with
their friends, don’t mind what you talk about, don’t mind who is chosen to
listen to you. Just say out can make you happen!
6
Sleeping
It’s from my own view that stress would be worsen if you do not have
enough sleep. A research founds that a person who do no sleep in last 24
hours will become less self control and more bad temper. So sleeping is
important
Instant method
Found that the method mentioned above needs a long time? There are
methods that can make you more comfortable! That is breathing.
OBJECTIVES OF THE STUDY
To find out the various factors that influences stress among
employees.
To find the employers opinion towards the stress disorder
To find the employees opinion towards stress experienced in their job.
To study the impact or stress on employees.
To identify the appropriate copying strategies to overcome stress.
To offer recommendations to manage stress among employees of
”ICL”
SCOPE OF THE STUDY
The study of stress may prove to be a useful tool for understanding the
various problems associated with the progressive industrial unit or service
organization.
7
The study is able to bring ort the comparative structure of stress among
different working groups. So the study will help us to a large extent to
understand the logic behind the stress among workers, and also helps
to suggest some possible recommendation to reduce the problems of
stress in the appropriate field.
NEED FOR THE STUDY
The study which was undergone in INDIA CEMENT LIMITED. A
study on stress management of employees in the organizational has been
conducted to analyze what are the difficulties faced by them, how to very
come this in the future. The study helps to know is drawbacks and
suggestions.
Stress is an inevitable concomitant of organizational life. Its source in
an organizational I s tats or role related. The complex & dynamic
environment in which organizational have to exist adapt them selves and
grow, add to further stress at work.
As business environment and organizations grow competitive and
complex, stress at work is also bound to increase. Dr.Hans selye, one of the
prominent psychologists of the twentieth century undertook original break
through work in the understanding and defining of stress. Stress according to
him is the “single non specific reaction of the body to demand made upon
it”,
8
Stress is the psychological and physiological reaction that takes places
when once perceives an imbalance in the level of demand placed on the
capacity to meet that demand in individuals.
RESEARCH METHODOLOGIES
NATURE OF STUDY
The present study is designed as a descriptive study on survey
method. Both primary and secondary data have been used. The secondary
data has been collected.Mainly from research reports, records of the
company and from journals.
Tools for Primary Data Collection
Questionnaire
In this study, a structured questionnaire consisting of a list of question
pertaining to the survey is prepared. It consists of multiple choice question
and questions for recommendation and suggestions. This facilitated it
represents to fill up the questionnaire is an easy and fast manner.
Secondary Data collection
9
The research related data has been collected from the company
newspaper.
Sample unit
Under this plan the research must define the target population that will
be sampled. In this sampling unit is India Cement Limited, Sankari.
Sample size
The sample size of the study has limited to 100 respondents, which
consist of both male and female from the age group of above 20 years.
Sample design
Here the population is defined; it is a probability sampling, under
probability survey. The survey was conducted on the responses from the 100
employees in India Cements Limited. Simple Random Sampling was
designed adopted for selecting the respondents to whom the schedule was
served.
Tools for Analysis
Simple percentages are used in making comparisons between two or
more series of data. With the help of absolutes figures, it was difficult to
interpret any meaning in the two or more data, but when percentage are read,
it becomes very easy to find the relative difference between the two data.
Number of respondent
10
Percentage = X 100
Total number of respondents
PERIOD OF STUDY
The period is confined of 45 days.
Limitation of the study
The busy schedule of the workers was a hindrance to collect more
data.
Due to time constraint the sample size is restricted to only 150
samples.
Some employees were having little difficulty in expressing their
views even though they knew the answer to the questions. Hence the
findings and suggestions may or may not be.
CHAPTER SCHEME
This study is designed under the following chapters:11
I - The First Chapter deals with Introduction and design of study
II - The Second Chapter deals with Review of the Literature
III - The Third Chapter deals with Profile of the company
IV - The Fourth Chapter deals with Data Analysis and Interpretation of Data
V - The Fifth Chapter deals with Summary of Findings and Suggestion
CHAPTER-II
REVIEW OF LITERATURE
12
Not to be confused with a book review, a literature Review scoweys
scholarly articles, books and other Sources (e.g. dissertation, conference
proceedings) relevant to a Particular issue, are a if research or theory,
providences a Description, summers and critical evaluation if each work.
The Literature review refers to and collection of material on a topic net
necessary the great literature texts of the world.
Chandola (2012) reported findings from a long-running study
involving more than, British civil servants also suggests stress induced
biological changes may play raises the risk of heart diseases by disrupting by
disrupting the body’s internal systems. The team conducted 7 surveys over a
12 period and found chronically stressed workers had 68% higher risk of
developing heart disease.
____________________________
CHANDOLA (2012) working with emotional intelligence. USA, Bantam books
Sullivan & Shaikh (2011) this paper aims at exploring, for the first
time in the Arab world, the role of emotional intelligence (EI) in affecting
work outcomes. The results revealed significant differences between
employees’ perceptions of emotional intelligence, conflict and readiness to 13
create and innovate. The paper provides practitioners with some advice
about understanding and managing climate and conflict.
Eniola (2010) This study investigated the influence of two
interactions emotional intelligence Tracing (EIT) and Self-Regulation
training (SRT) in remediation aggressive behavior in adolescence with
visual impairment. Forty eight visual impaired (Ranging form total blind to
partially sighted) participated in the study. The interaction effects revealed
that participants treated with the two interactions EIT and SRT showed
significant improvement in their aggressive behavior pattern then their
counterparts in the control group.
____________________________________________
Sullivan &AL-Shaikh (2011) Emotional intelligence at work : links to conflict and innovation
ENIOLA (2010) Organizational behavior 12th edition; New Delhi, prentice Hall of India pvt.ltd.employee
relations.
Yonung & Dulewicz (2009) this paper aims to present some findings
from a wider study into effective command, leadership and management in
the British Royal Navy (RN ). Its aim is to increase understanding of two
14
types of self-awareness, emotional and congruent, and their relationship to
job performance and personality. The results demonstrate that self-
evaluation of own performance (form LDQ) was significantly correlated
with appraised (actual) performance. Hierarchical regression showed that
both d scales explain significant variance in appraised performance,
especially the d2 measure which accounted for 47 percent.
Wilsonet al. (2009) This research aims to investigate the efficacy of
family involvement in shift work training targeting both physiological and
social coping strategies. The inclusion of social coping strategies combined
with family involvement significantly reduced work-family conflict. Open
responses categories on the survey suggest that these reductions were due to
the facilitation of a joint problem solving approach by family members. In
contrast, employee focused.
____________________
Young &Dulewicz (2009) relationship between emotional and congruent self-awareness and performance in
the British Royal Navy. Journal if managerial psychology. 10.1108/02683940710757191
Wilsonet al (2009 stress in life and work; new delhi, response books.Training on physiological coping alone
appears to increase family conflicts.
King & Garner (2008) The aim of the study was to test the
relationship of emotional intelligence (EI) to the appraisal, coping and
outcomes of workplace demands emotional intelligence was found to
comprise three factors: emotional self management (ESM), the ability to
15
understand other’s emotions (UOE) and the use of emotions in decisions
making.
Martin, Jones & Carlin ( 2008) The purpose of this paper is to
confirm predictions that employee reports of psychological climate,
appraisal of change and levels of adjustments during a change program
would be more positive for employees in higher status groups (Operational
zed as hierarchical level in the organizational and occupational role. The
results of study one resealed that upper level staff reported more positive
attitudes during change, across a range of indicators, the results of study two
showed that non-clinical staff reported more negative attitudes during
change than other occupational groups. In addition,, managers appraised
change as more stressful than non-managers, but felt more in.
_____________________
King &gardner (2008) emotional intelligence and occupational stress among professional staff in New
Zealand international journal of organizational psychology, 10.11008/eb43386
Martin jones &callan (2008) psychology; 5th edition; New delhi,prentice hall of indiapvt.lt
Highs (2007) reported a study to explore the relationship between the EI of
call center agents and ratings of their performance. Sample of 289 agents
from three organization were studied. Results included a strong relationship
16
between overall EI and individual performance as well between several EI
elements from the model and performance.
Brewin (1980) Clinical case histories can contribute to our
knowledge of the types of person-situation interaction which produces
managerial stress. Three case histories reveal similar interactions between a
certain vulnerable personality and a specific type of work role transition.
Common principles involved in these interactions are discussed.
_________________
HIGGS (2007) Abnormal psychology and modern life; 11th edition; New delhi, pearson education
Carmeli (2006) Attempted to narrow this gap by empirically
examining the extent to which senior managers with a high emotional
intelligence employed in public sector organizations developed positive
17
work attitude, altruistic behavior, and work outcomes. The result indicated
that emotional intelligence. Augments positive, altruistic behavior, work
outcomes, and moderated the effect on job satisfaction
Vakola et al.(2005) added a different way of looking and working
with organizational change by focusing on individual’s emotions and
personality trait. The study explore how emotional intelligence change at an
individual level by exploring the relationship between these attributes and
towards organizational change. The sample consisted of 137 professionals
who completed self reported inventories assessing confirmed that there was
a relationship between personality traits an.
_________________________________________________________
9. Brewin(1980) work role transitions and stress in managers: illustrations from the clinic, personal
review
10.1108/eb.55414
10. Carmeli(2006) organizational behavior concepts-theory and practices. New delhi. Deep and
deep publications pvt.ltd
11Vakola et al (2004) educational technology; 8th edition USA, person education company
Nikolana and Tsaousis (2004) extorted the relationship between
emotional intelligence and source of occupational stress and outcomes on a
sample of professional in mental health institution. A total of 212
participants were administered the emotional intelligence Questionnaire as
18
well as the organizational stress screening tool (ASSET), which measured
work place stress. The results showed a negative correlation between
emotional intelligence and stress at work. Indicating that high scores in
overall EI suffered less stress related to occupational environment. A
negative correlation between emotional intelligence and organizational
commitment, which according to the ASSET model was considered as a
consequence of stress, suggesting a new role for EI as determinant of
employee loyalty to organizations.
Shhutte et al.(2003) examined the link between emotional
intelligence and interpersonal relations. In studies one and two, the
participants with high scores for emotional intelligence had higher scores for
empathetic perspective taking and self monitoring in social situation .in
study three and four the participants with higher scores for emotional
19
intelligence displayed more cooperative responses towards partners. In five
the participants with higher scores for emotional intelligence had higher
scores for close and affectionate relationship. In study six the participant’s
scores for marital satisfaction were higher when they rated their marital
partners higher for emotional intelligence. In study seven the participant’s
anticipated greater satisfaction in relationship with partners described as
having emotional intelligence.
George and Bettenhausen (1990) in the study on social awareness
also plays a key role in the service competencies, the ability to identify
clients or customers often unstated needs and concerns and then match them
instill strategy with meaning and resonance. Emotional are contagious,
particularly when exhibited by those at top, and extremely successfully
leaders display a high level of positive energy that spreads throughout the
organizations. The more positive the style of a leader, the more positive,
helpful and cooperative are those in the group.
Hart (1987) The intent here is to present a representative, though not
exhaustive, review of some recent empirical and theoretical and literature on
stress and the management of stress in occupational settings. The paper
begins with a synopsis of the financial cost to the employers of unchecked
excessive levels of employee stress. The next section reviews of some
examples of empirically-based research supporting the clinical and cost
effectiveness of current occupational stress management (OSM) programs.
This is followed by a discussion of recent evidence showing that the
“traditional: (corporate) approach to OSM is incomplete and insufficient.
Towards the end of the article, an idealized, comprehensive, bio 20
psychological laminations of traditional OSM programs are discussed, and
it is suggested that future studies might studies might consider utilizing a
multilevel- multi method “triangulation” measurement approach.
CHAPTER-III
PROFILE OF THE COMPANY
PROFILE OF THE CEMENT INDULSTRY
Introduction
21
Joseph aspadin an Englishman from leeds, England who invented
cement in the year 1824, aspadin manufactured cement in Ruchimetary from
by burning mixture of limestone and clay. It was termed “Portland cement”
as it resembled the “Portland store” a popular limestone used for building
construction in England. Another of century passed a slightly better quality
of cement was produced in 1850 by another Englishman Isaac Charles
Johnson.
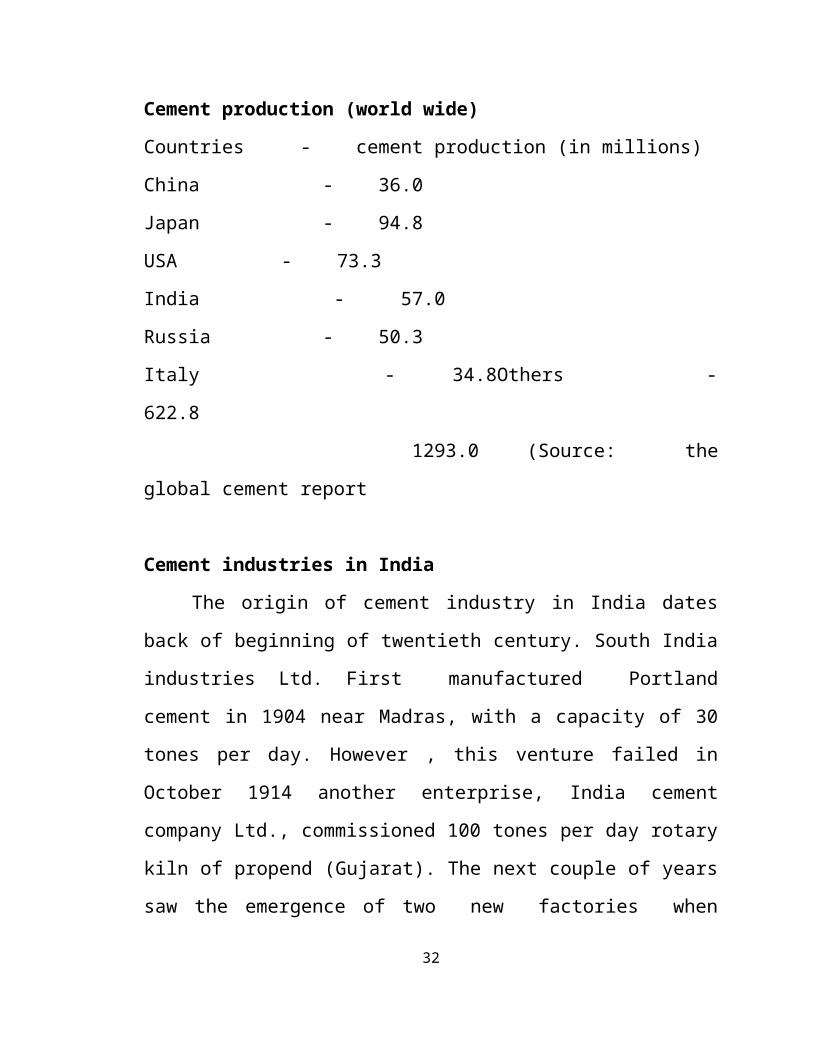
Cement production (world wide)
Countries - cement production (in millions)
China - 36.0
Japan - 94.8
USA - 73.3
India - 57.0
Russia - 50.3
Italy - 34.8Others - 622.8
1293.0 (Source: the global cement report
Cement industries in India
The origin of cement industry in India dates back of beginning of
twentieth century. South India industries Ltd. First manufactured Portland
cement in 1904 near Madras, with a capacity of 30 tones per day. However ,
this venture failed in October 1914 another enterprise, India cement
company Ltd., commissioned 100 tones per day rotary kiln of propend
(Gujarat). The next couple of years saw the emergence of two new factories
when plants at Kaini (M.P) &Lakher (Rajasthan) commissioned.
22
The first world war gave a fillip to the cement industry. In 1918, the
three factories together were able to produce about 85000 tones per year.
After three years many cement industries was started. Now there are nine
major cement industries in the Indian market.
Types of modern cement :
1 . Portland cement blends
2 . Portland Blast furnace Cement
3. Portland Flash Cement
4 . Portland PozzolanCement
5. Portland Silica Fume Cement
6. Masontry Cements
7 Expansive cements
8 White blended cements
9 very finely ground cements
Non-Portland hydraulic cements
Pozzolan-lime cements
Slag-lime cements
Super sulfated cements
Calcium sulfoaluminate cements
“nature” cements
Environment and social impacts
Cements manufacture causes environmental impacts at all stages of
the process. These include emissions of airborne of pollution in the form of
23
dust, gases, noise and vibration when operating machinery and during
blasting in quarries, and damage to country side from quarrying. Equipment
to reduce dust emissions during quarrying.and separate exhaust gases are
coming into increased use. Environmental protection also includes the re-
integration of quarries into the countryside after they have been closed down
by returning them to nature or re-cultivating them.
1 Climate
Cement manufacture contributes greenhouse gases both directory
through the production of carbon dioxide when calcium carbonate is heated,
producing lime and carbon dioxide, and also indirectly through the use of
energy, particularly if the energy is sourced from fossil fuels.
Fuels and Raw Materials:
A cement plant consumes 3,000 to 6,500 MJ of fuel per tones of
clinker produced, depending on the raw materials and the process used.
Most cement kilns today use coal and petroleum coke as primarily fuels,
and to a lesser extent natural gas and fuel oil.
Local impacts
Producing cements has significant positive and negative impacts at a
local level. On the positive side, the cement industry may create
employment and business opportunities for local people, particularly in
24
remote locations in developing countries where there are few other
opportunities for economic development. Negative impacts include
disturbance to the landscape, dust and noise, and disruption to local
biodiversity from quarrying limestone( the raw material for cement)
PROFILE OF THE INDIA CEMENTS:
Sri SANGARLINGAIYER, who will always as a father figure and
was a pioneer of heavy industry in the south, in the task of establishing the
enterprise Sri sankaralingaiyer was ably assigned Shri. T.s narayanasami
these two pioneers started the first plant at TALIYUTHU. The managing
agency firm of ESSEN PRIVATE LTD,, in which Mr. Sankaralingaiyer
and Mr.Narayanasami were the managing directories, managed the
company.
ICL was incorporated on 21 feb 1946 and commercial production
commenced in aug 1949. The technical collaborators of the company were
M/S F.L SMIDTH % CO who gave their know- how, design and
engineering and erection assistance. The machinery from M/S FL SMIDTH
& CO arrived during the course of 1947. In the year 1949 production
capacity of one lakh tone per annum.
SANKARIDURG: This plant was commercial in the year 1963 with the
initial capacity of 200000tones per year. This plant is located in a compact
block on about 200 acres along with the Madras of cochin National
Highway it covered three village namely,
25
o Sankari west
o Sanyasipatty
o Padaveedu
The former two in SankariTaluk and the third in TiruchengodeTaluk.
The factory is setup on the west side of the block while the last side is set
apart from the residential colony and amenities such as Canteen, school,
temple, posts & telegraph office etc,, The two areas are divided by a broad
100 feet private road leading from the highway.
COMPANY HIGHLIGHTS
1. This company is the largest producer of cement in south India.
1 The company’s plants are well spread with three in Tamilnadu and four
in Andhra Pradesh which cater to all major markets in south India and
Maharastra.
2 The company is the market leader with a market share of 28% in the
south. It aims to achieve a 35 % market share in the near future. The
company has access to huge limestone resources and plans to expand
capacity by debottlenecking and optimization of existing plants as well
as by equitation.
3 The company has a strong distribution network with over 10,000 stock
list of whom 25 % are dedicated.
4 The company has well established brands- Shankar super power,
coromandel super power and raasi super power.
5 Regional officers in all southern states and Maharasthra
offices/representative in every district.
26
Dalvoi project
The company has began construction of a green field cement plant at
an eighty hectare site located in the village of Dalavoi in Trichi District
south west of Madras. The plant has an annual installed capacity of 9,00,000
tones and use the try process technique. This plant started increased the
capacity of the company to 3.6 million tones per annum.
ISO 9002 certification
On 10th day of April 1994 ICL passed an important milestone in its
relentless quest for quality. The bureau of India standards (BIS) granted ICL
certification ISO 9002 in respect of the manufacture and supply of cement.
This coveted honor, which followed by stringent audits of the quality
systems at Sankarnagar as well as at the corporate office and by the excellent
teamwork of various other departments.
Cement manufacturing process
Cement can be manufactured in the following process
1. wet process
2. dry process
27
semi dry process
semi wet process
ours is a dry process to produce OPC and PPC. Limestone is the basic raw
material for producing cement. From quarry, limestone is received from
tippers. When we received from quarry, the limestone is of sixes of the cube
foot. The limestone crushed in the limestone crusher. The crushed limestone
is size 1”below this is conveyed by an inclined belt conveyer to the raw mill
hoppers. The additives red mud and blue dust added( around 2 %) to get the
required composition of killen feel slurry.
The crushed limestone along with additives is ground in the raw mills
along with water to produce slurry with around 30 to 40 % moisture
content. This slurry is pumped by slurry pumps to slurry silos, compressed
air is pumped to mix the slurry well.
Origin of the industry
In India, Portland cement was first manufactured in the year 1904
bear Chennai, by the south India Industries Ltd, in the 30 tonners per day
plant. How ever, this venture failed. In October 1914, another enterprise,
Indian cement company Ltd..commissioned 100 tones per day rotary kiln at
Gujarat the next couple of years saw the emergence of two new factories.
The are found to be located in Madhya Pradesh .
After the first world war in 1918, these three factories together where
able to produce 85000 tones per year, on 21 feb, ICL completed its fifty
years to concrete contribution to the nation building. When Sankari cement
made its first appearance in the market it has grown hugely in stature and
28
reputation in to a multifaceted organization whose activities today span
cement, shipping, real estate, chemicals and trading.
Existing system in ICL
The existing system carries lot of demerits associated with the manual
and
informal system, which would over, come by an on-line system.
Computerization has number of added advantages .it enhances control
through increased accuracy, consistency, netter security. Processing is mode
faster, enhancing quick and easy retrieval of information. A computerized
system has the capacity to handle the projected increase in volume of
information over time.
Documentation and report generation will be simplified, leading to
considerable savings in time and effort. Another thing is data redundancy
can be prevented and human effort in key operations and calculations can be
alleviated.
ICL has introduced computerization during 1986 by installing one
minicomputer system with MS DOS operating system COBOL is the
language used for date processing in this computer system. Subsequently
they have installed another minicomputer system namely WIPRO s-830v
during 1987 they have already computerized most of their business
application with available resources. However, most of the systems
implemented a present are under batch processing mode only.
29
In addition to the above minicomputer system which are already
available with them a lot of PC are also installed in ICL. These PC’s are
spread over various department both in administrative building & inside
their plant. Recently they have setup a (LAN) by interconnecting all the
PC’s installed in the administrative building. For this purpose, a powerful
fileserver in installed.
Outlook 2009-10
While the country’s economic growth was impacted was impacted by
the global economic recession, there are some positive political and
economic indicators which favor an improved performance of the indian
economy 2009-10.
The G-20 summit’s promise of a new world economic dawn through
the offer of US $ 1.1 trillion in loans and guarantees badly affected by the
global economic melt down and pledges of a heavier regulation of
international finance.
The decisive mandate given by the Indian electorate to the congress
party led UPA alliance which has galvanized the economic mood of the
country.
The union budget proposals which have emphasized development of
infrastructure through substantially higher allocations for JNNURM, Bharat
Nirman national highways, Railways and Housing apart from the initiative
of funding PPP projects through IIFC and banks.
30
Signs of economic recovery are clearly visible with the six core
industries led by coal and cement posting a 6% growth in June compared to
2.8% in the previous month.
Performance of the day
After two years of record production and capacity utilization of 105%,
the company’s performance in terms of production at its plants suffered a
marginal set
Back on account of unscheduled breakdowns at some plants, plants
stoppage of one of the kilns at Vishnupuram for up gradation, delay in some
of the up gradation projects and restriction in power availability from the
grid both in Tamilnadu and Andhra Pradesh. Cement production during
2008-09 was 91.11 lack tones while the gross turnover of the company was
Rs.3954.53 crore up by 10 % against rs 3598.48 crores. The operating profit
was lower at Rs. 1043.20 crores as compared to Rs.1120.13 crores while the
net profit after providing for interest, depreciation and tax dipped to
Rs.432.18 crores as against Rs.638.54crores in the previous fiscal
Capacity up gradation plans
During the first quarter of the current fiscal the cement grinding
facility for the line II at Malkapur was commissioned and the parli grinding
unit at Maharashtra also started production. Work is on schedule on the up
gradation of kiln at Chilamkur and also on the new line at Rajastha. The
company’s proposals to set up 2 X 50 me power plant to take care of the
growing power needs of company’s Tamilnadu and Andhra Pradesh plants
are also being activity pursued. The company has taken steps to obtain coal
31
mining rights in Indonesia to meet captive requirements for cement and
power generation.
INTRODUCTION AND COMMENCEMENT OF COMMERCIAL
PRODUCTION
India cements limited was incorporated on 21 st February 1946. The
technical collaborators of the company were MIS.F.L. smidth and co,, who
gave their know-how, design and engineering and erection assistance. The
machinery from M/s. Smith and co,, arrived during the course of 1947 and
commercial production commenced in August 1949 with an initial
production capacity. The managing agency firm of Essen private Limited
managed the company.
GROWTH OF ICL PLANT
1 Sankarnagar plant
2 Sankari plant
3 Chilamkur plant
4 Yerragunthla plant
5 Dalavoi plant
6 Tandur plant
7 Vishnupuram plant
QUALITY QUEST
32
India cement limited was the first company to obtain ISO certification
in south India, stamp of which proudly imprinted on every bag, which leaves
the factory.
India cement limited was also one of the first companies to export
cement. In recognition of its efforts on the export front, the company was
accorded the status of an “export House” by the directorate general of
foreign trade.
The exports have conformed to the rigid quality standards of the
British standards specification of 1958, which are normally acceptable in the
international market.
ISO 9002 FOR SANKAR NAGAR
On 10th April 1994, India cement Limited passed an important
milestone in is a relentless quest for quality. The bureau of Indian Standards
(BIS) granted India cement limited Sankarnagar the license for quality
Systems certificate “ISO 9002” in respect of the manufacture and supply of
cement.
The coveted honor, which followed stringent audits of the quality
systems at sankarnagar as well as at the corporate office, was made possible
the dedicated efforts of the “ISO TASK FORCE” backed by excellent
teamwork from all departments.
STRENG OF ICL
33
India cement Limited’s distribution is based on its excellent quality,
proper weight, price and timely equitable distribution of its product
throughput the states of Tamil Nadu and Kerala, its core markets, India
cement Limited has ensured even distribution to its stockiest and customers
over a long period.
EXPORT
Export of cement is another growing area, which enables many units
to maintain a higher percentage of the capacity utilization when the market
is faltering. In this respect many neighboring countries need to import
cement for various reasons and India in good position to supply.
INDUSTRIAL RELATIONS
Industrial relations continue to remain cordial. Appropriate
development interventions for employees at all levels under a structure
training programmed was intensified.
RESEARCH AND DEVELOPMENT
The India cements Limited has commenced operations of the research
and development Division, during November 99, and set up full=fledge
facilities at its centre located at the company’s Dalavoi plant.
NAME OF THE ASSOCIATE I SUBDIARY COMPANES34
Associative company
1 Trishful investments limited
2 India cements capital & finance Ltd
1 Visaka cement industry Ltd
2 India cement Limited shipping Ltd
3 Soudambika finance & investments Pvt.Ltd
4 Siva sunder Finance & Investments Pvt.Ltd
Subsidiary company
1. India cement limited security Ltd
2. India cement Limited finance services Ltd
3. India cement limited International Ltd
ASSOCIATE COMPANIES
INDIA CEMENT LIMITED SUGARS LIMITED
India cement Limited sugar Limited plant was set up in Makkavalli,
Mandya district, Karnataka. The India cement Limited sugar limited sugar
limited started plant scale trial crushing operations on 24th may 1999.
TRISHUL CONCRETE PRODUCTION LIMITED
This company has promoted Trishul concrete products Private Limited
for setting up a ready-mix concrete plant at Thirumudivakkam, Chenna. The
plant wa commissioned on 16th September 1999 and markets its ready-mix
concrete in the brand name of “ coromandel concrete”.
INDIA CEMENT LIMITED CAPITAL AND FINANCE LIMITED35
India cement Limited capital finance Limited were taken over during
the year 1997.
INDIA CEMENT LIMITED FINANCIAL SERVICES LTD AND ICL
SECURITES LTD.
India cement limited securities limited (ICLS) India cement Limited
financial services Limited (ICLFS) acquired from the promoters
Arunasugars Finance Limited.
DIVISIONS
1. Logistic division
2. Wind mill
3. Shipping division
4. Trading division
5. Real estate and property development division
ACHIEVEMENTS OF INDIA CEMENTS LIMITED
1969 : India cement limited awarded Merit certificate for outstanding
export Outstanding export performance (1969-1969)
1988-89 : India cement Limited own samman award for their contribution
towards central towards central excise revenue.
1992 : India cement Limited bagged “date street journal’s corporate
excellent award and has been ranked 22w’ in the journals golden list of 50
best companies.
36
1992 : The inspectorate of factories, govt of Tamilnadu has certified Sankari
unit the rank in less manday lost due to accidents.
1993-94 :Certificate of recognition as an export house has been issued to
India Cement Limitation by the directorate general of the foreign trade.
1993 :India cement Limited bags capexil special award for exports in 1992-
1993.
1970 : India cement Limited awarded Merit certificate for outstanding
export Performance (1969-1969).
1988-89 : India cement Limited own samman award for their contribution
Towards central excise revenue.
1992 : India Cement Limited bagged “data street journal’s corporate
excellent and has been 22w’ in the golden list of 50 best companies.
1992: The inspectorate of factories, govt. of Tamilnadu has certified
Sankari Unitthe rank in less manday lost due to accidents.
1993-94 : Certificateofrecognition as an export house has been issued to
India Cement limited by the directorate general of the foreign trade.
1993 : India cement Limited bags Capexil special award for exports in
1992- 93.
37
1993: India cement Limited granted certificate of recognition as export
house.
1994: ISO 9002 Certification for the India cement Limited sankarnagar
plant
1994 : India cement Limited bags Capexil special award for exports in
1993- 94
1994: India cement limited ranked 14 (11in business world-opinion survey
of India’s most respected companies.
1994-95: India cement Limited bags an award for outstanding performance
for for exports through Tuticorin port.
1994-95 : India cement Limited receives the lala Sriram National ward for
Leadership In chemical industry from all India council of technical
education.
1997 : India cement Limited was awarded the best occupational health
services In place of employment by Indian association occupational
health,Tamilnadu branch.]
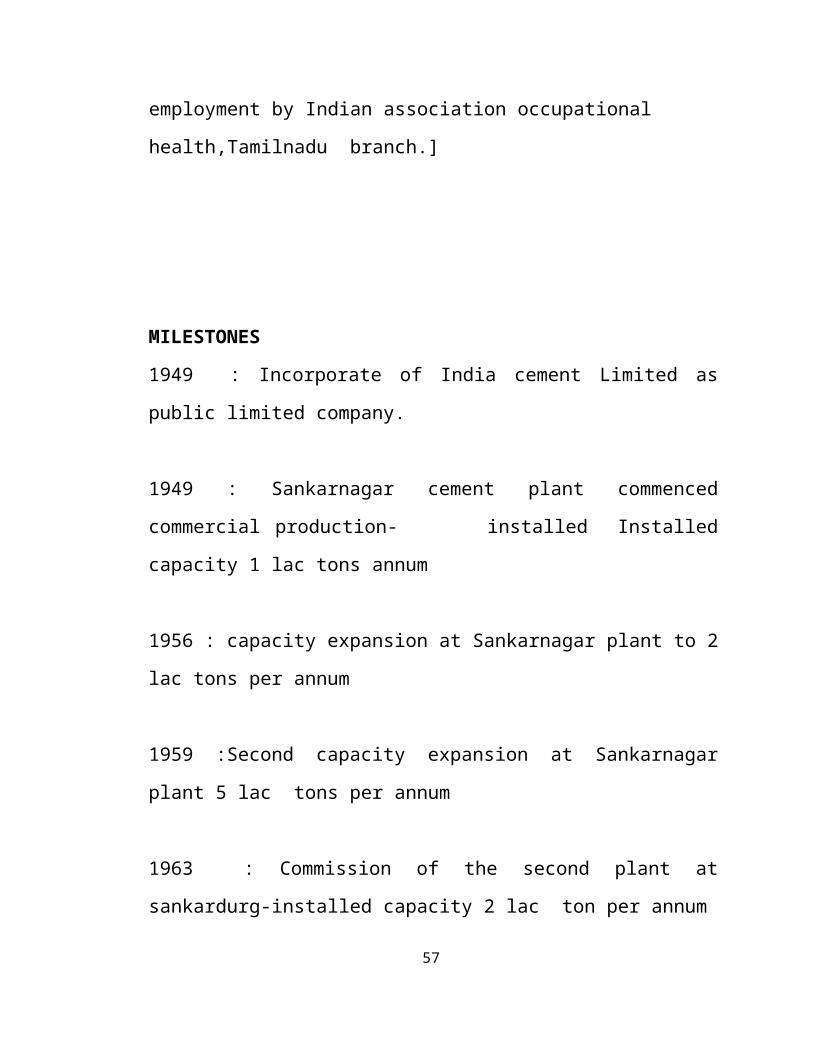
MILESTONES38
1949 : Incorporate of India cement Limited as public limited company.
1949 : Sankarnagar cement plant commenced commercial production-
installed Installed capacity 1 lac tons annum
1956 : capacity expansion at Sankarnagar plant to 2 lac tons per annum
1959 :Second capacity expansion at Sankarnagar plant 5 lac tons per
annum
1963 : Commission of the second plant at sankardurg-installed capacity 2
lac ton per annum
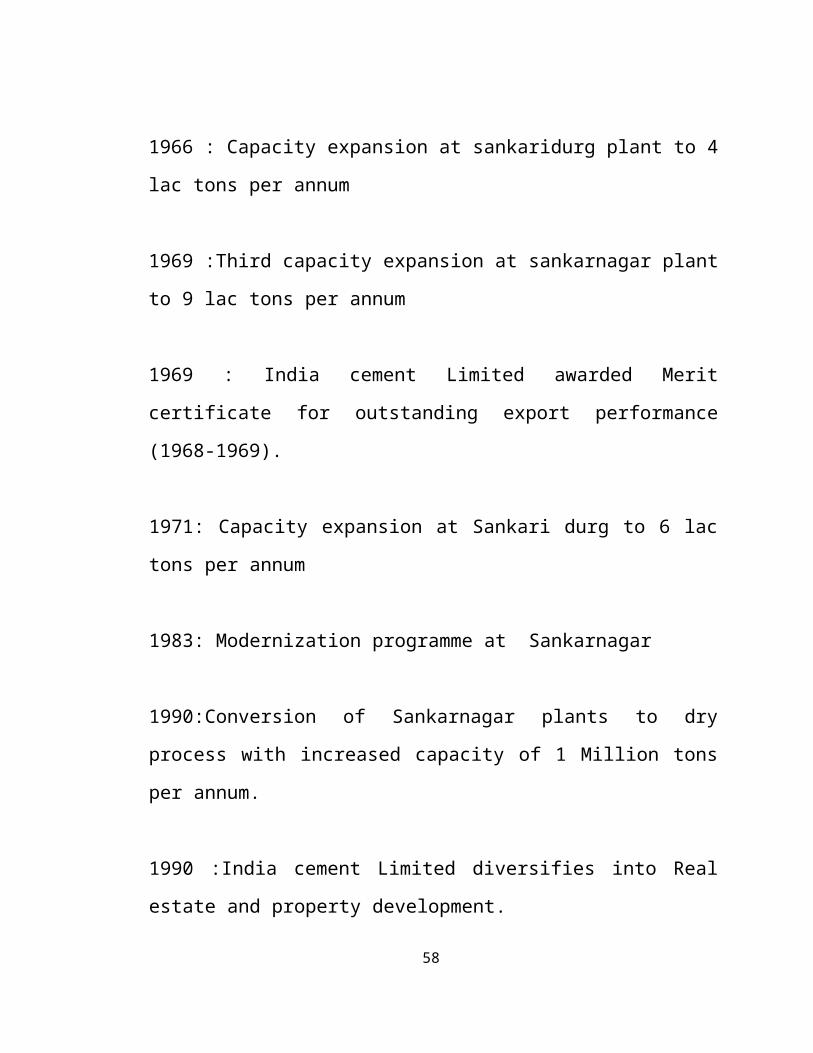
1966 : Capacity expansion at sankaridurg plant to 4 lac tons per annum
1969 :Third capacity expansion at sankarnagar plant to 9 lac tons per annum
1969 : India cement Limited awarded Merit certificate for outstanding
export performance (1968-1969).
1971: Capacity expansion at Sankari durg to 6 lac tons per annum
1983: Modernization programme at Sankarnagar
1990:Conversion of Sankarnagar plants to dry process with increased
capacity of 1 Million tons per annum.
39
1990 :India cement Limited diversifies into Real estate and property
development.
1990 :India cement Limited acquires coromandel cement plant at
Cuddappah Installed capacity increased to 2.6 million tons and becomes
the larges Producer of cements in south India.
1991 : India cement Limited acquires its first Bulk carrier ICL Rajarajan
1992 :India cement Limited acquires its second Bulk carrier – ICL
Jayamkondan
1992 :India cement Limited floats rights issue of equity shares of Rs 15.98
crores
1993 : India cement Limited acquires third Bulk carrier- ICL Vikraman
1993 : India cement Limited floats rights issue of Equity shares oRs. 34/74
crores.
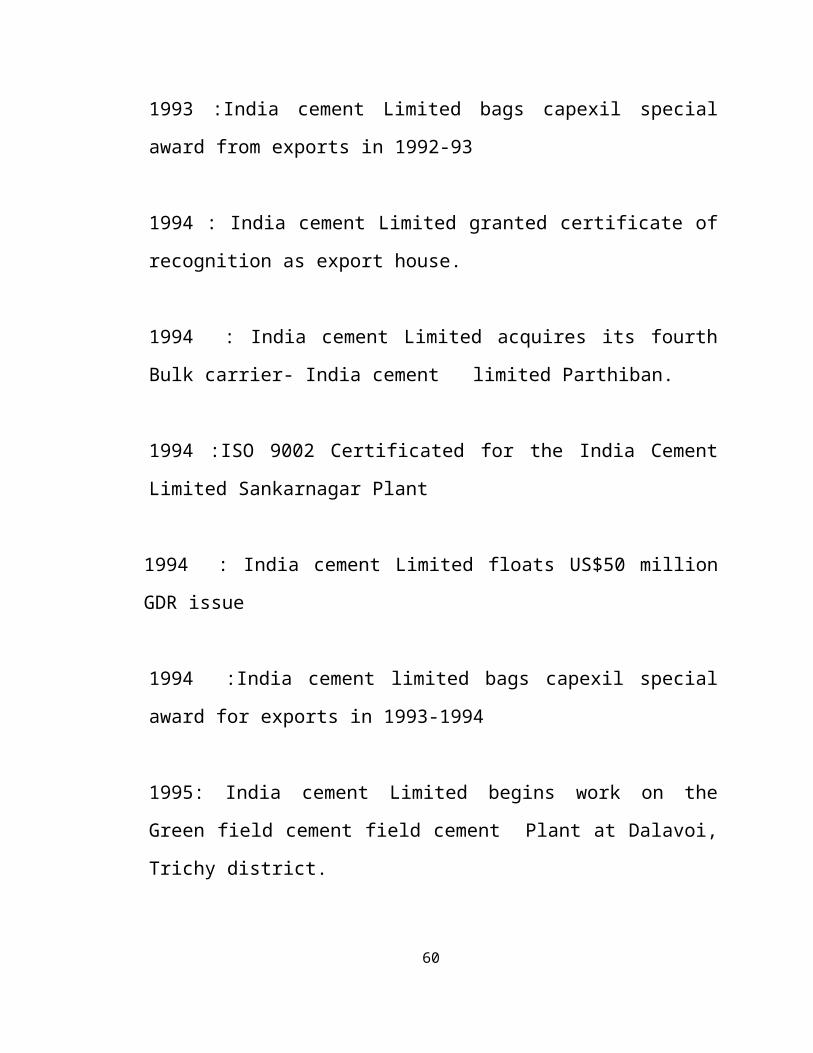
1993 :India cement Limited bags capexil special award from exports in
1992-93
1994 : India cement Limited granted certificate of recognition as export
house.
40
1994 : India cement Limited acquires its fourth Bulk carrier- India cement
limited Parthiban.
1994 :ISO 9002 Certificated for the India Cement Limited Sankarnagar
Plant
1994 : India cement Limited floats US$50 million GDR issue
1994 :India cement limited bags capexil special award for exports in 1993-
1994
1995: India cement Limited begins work on the Green field cement field
cement Plant at Dalavoi, Trichy district.
1995:India cement limited acquires its fifth bulk carrier –India cement 1995
India cement limited acquires its fifth bulk carrier – India cement
Rajamahendra.
1995 : India cement Limited announces 1:1 bonus shares
1996 :India cement limited completes 50 years of concrete contribution to
Nation building
1997 : India cement Limited took over the Visaka cement industry Ltd,
situated at Tandur at Andhra Pradesh.
41
1998 : India cement Limited acquires the cement corporation of India plant
At Yerraguntla in Andhra Pradesh.
1998 : India cement Limited acquires the Raasi cement and its subsidiaries
1999 : India cement acquires cement plant sari Vishnu cement ltd at
Nalgonda District of Andhra Pradesh installed capacity 1.0 million tones.
1999 Turnover sails over the Rs 1000 crore mark
2001 India cement divests is stake in sir Vishnu cement limited.
2001 Group’s overall capacity reaches a million tonners
2004 The company through is special purpose vehicle Miscoromandel
co ltd has commissioned a (gas based) captive power plant at Ramanatha-
puram for a capacity of 17.4 MW and the same has started supplying power
from the month of November 200.
2005 : The company has successfully completed an equity issue in the
International Market during October 2005 by issuing 25,613,796 global
depositary shares At USP 4.3226 per GDS (each GDS representing under
lying equity shares Is 10 each) and raised an amount of us 497.
2006 : The company has issued zero coupon convertible Bonds due 2011
(FCCBS) for us $75 million to investors outside India at an
initialConversion Price of Rs. 305.57 per share.42
2007 :The company has converted the Sankari plant from west process dry
Process and commissioned the plant.
2008 :The Honble high court of judicature at madras vide its order dated
25th July 2007 sanctioned the scheme of amalgamation of Visaka cement
Industry limited with the India cements Ltd.
2009 :The company has received its shipping business with the purchase
of Two ships (dry bulk carries) with a total capacity of 79843dwt.
2008 :The company has successfully bid for the Chennai Franchise of the
DLF IPL 20/20 Cricket tournament-“CHENNAI SUPER KINGS”
2009 :The company has completed and commercial production of one
million to Grinding plant at Parli (Maharastra).
2009 :The II line of 1.2 mt at Malkapur was commercial operations from
march
2010 :ICL financial service limited (ICLFSL) ), the Company’s wholly
owned subsidiary, acquired 60.89% (including shares acquired under open
offer) of equity share capital of Indo Zinc Limited (IZL). Consequently, IZL
became a subsidiary of ICLFSL and ultimate subsidiary of the Company in
January,2010.
43
2010 :The Corporate office of the company was shifted in February, 2010 to
its own Building “Coromandel Towers” at 93, Santhome High Road,
Karpagam Avenue , MRC Nagar, Chennai 600 028.
2010 :The company ‘s cricket franchise “Chennai super kings” has won IPL
III Trophy in April 2010.
2010 :The Chilamakur plant with capacity upgraded to 4500 Tonners per
day starte Functioning from tournament on 26th 2010.
2010 :The company privately placed in march,2010 2,45,94,000 equity
shares at a Price of Rs.120.20 per share (including premium of Rs.110.20
per share) to qualified institutional buyers.
2011 : IS/ISO 9001:2008 Certification for Dalavoi plant in February 2011.
2011 :The company redeemed fully all the outstanding Foreign Currency
Convertible Bonds for US$ 75 Million on 12th may 2011,the scheduled date.
2011 :The company’s cricket franchise “Chennai super kings” won IPL IV
Trophy on 28th May 2011.
2012 :The 48 MW captive power plant at Sankarnagar was commissioned
in January 2012.
44
2012 Commemorative postage stamp on the birth centenary of Sri T.S
Narayanasamy, one of the Founders of the company, was released on 11 th
November,2012.
2012 The company had acquired its third bulk carrier of 52489 DWT in
August 2012.
2012 IS/ISO 9001: 2008 Certification of Yerraguntla Plant in April 2012.
Man power:
Details about of Number of Employees in the ICL
Employees : 204
Officers : 69
Total : 273
THE VISION
The new millennium will bring with its new challenges and
greater opportunities. The 21st century will most certainly see the unfolding
of a period of extraordinary possibilities and incredible development
bringing about more fundamentals changes in the global economy than the
last 200 years. The successfully corporate will be those who equip
themselves to meet the challenges and convert opportunities into winning
strategies. If we are to keep place, it is imperative that we learn to
successfully tread the global pathway.
In this, Journey,, clarity of vision, a readiness to cultivate a global
mindset, effectiveness, clarity of vision, a readiness to cultivate a global
mindset, effectiveness, a strong accent on R&D and innovation and a move 45
away from selling to innovative marketing in recognition of the fact that the
customer is truly kin, are some of the strategies that will help corporate
survive succeed.
However, it must be remembered that it is not enough to adopt a set
of values and just leave them in place. In order to move with the changing
times, values and ideas must be ceaselessly reexamined so as to ensure that
they are in tune with the Organization's goals. The India Cement Limited is
committed contribute its might making the 21st century an "Indian Century".
HIGHLISTS OF THE MISSION
AIMING HIGH
ICL should be one of the largest Cement Companies in the
Country. Out growth is size will be through continuous review of potentials
of the existing manufacturing resources, strategic acquisitions and
expansions.
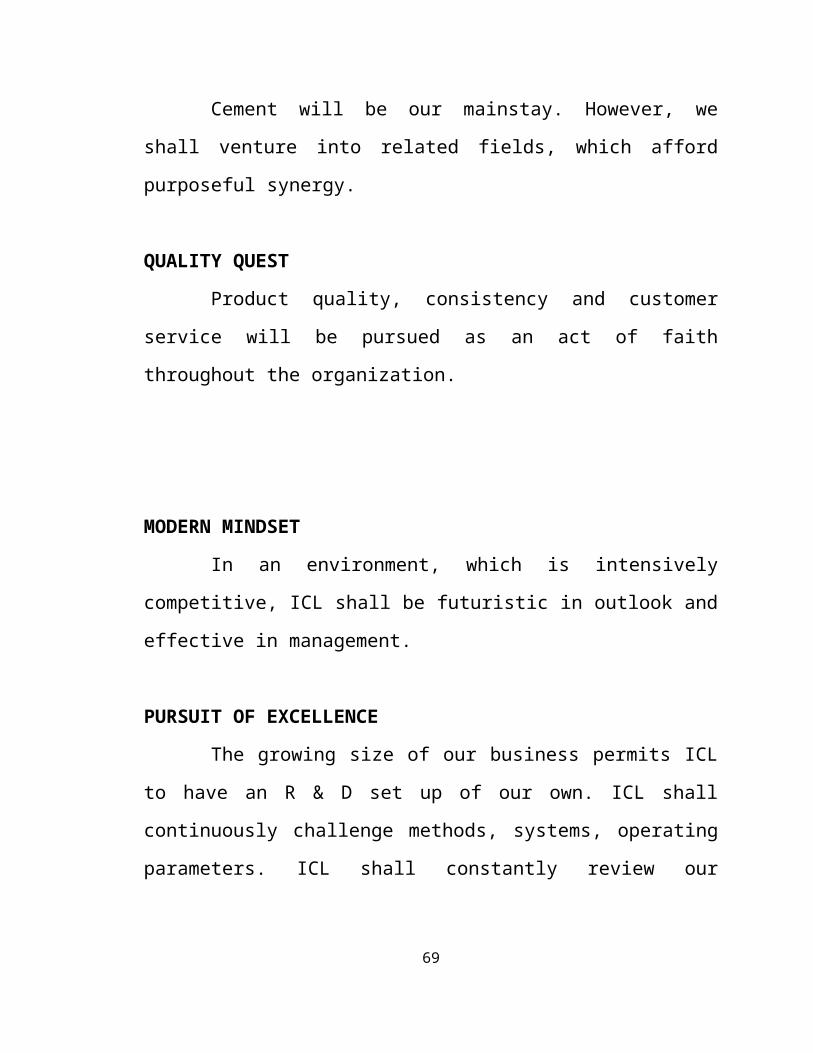
CORE COMPETENCY
Cement will be our mainstay. However, we shall venture into
related fields, which afford purposeful synergy.
QUALITY QUEST
Product quality, consistency and customer service will be pursued
as an act of faith throughout the organization.
46
MODERN MINDSET
In an environment, which is intensively competitive, ICL shall be
futuristic in outlook and effective in management.
PURSUIT OF EXCELLENCE
The growing size of our business permits ICL to have an R & D set
up of our own. ICL shall continuously challenge methods, systems,
operating parameters. ICL shall constantly review our manufacturing
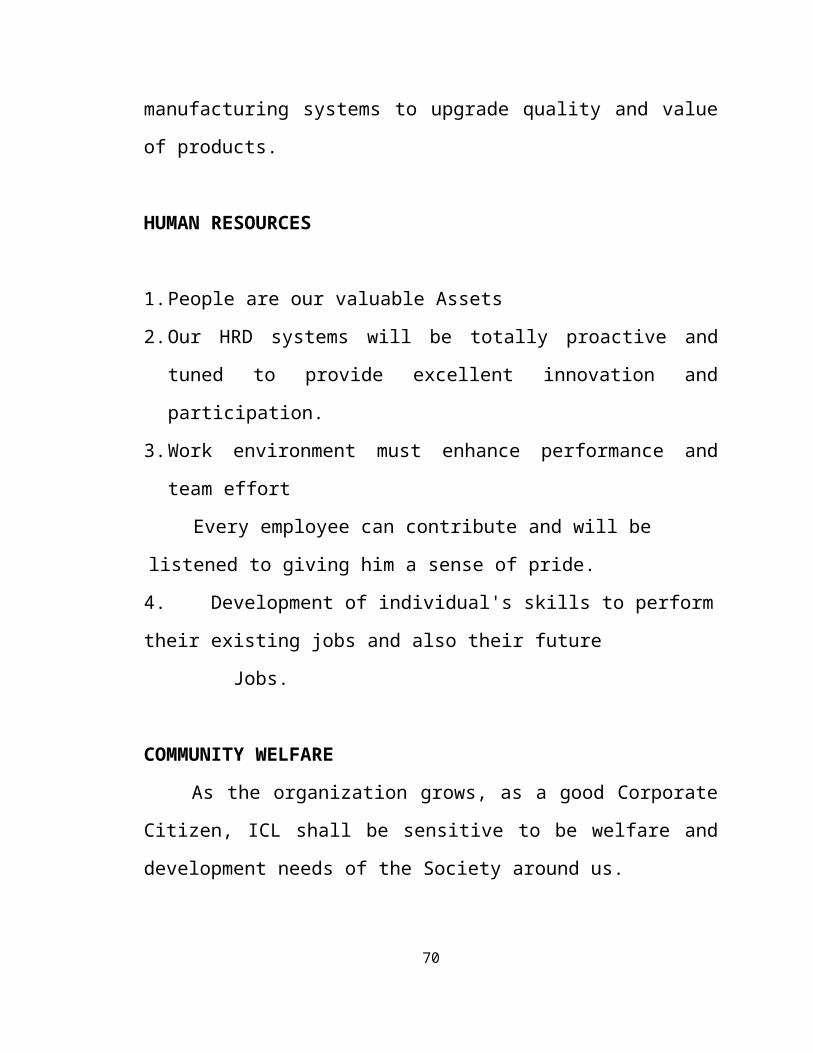
systems to upgrade quality and value of products.
HUMAN RESOURCES
1. People are our valuable Assets
2. Our HRD systems will be totally proactive and tuned to provide excellent
innovation and participation.
3. Work environment must enhance performance and team effort
Every employee can contribute and will be listened to giving him a sense
of pride.
4. Development of individual's skills to perform their existing jobs and
also their future
Jobs.
COMMUNITY WELFARE
As the organization grows, as a good Corporate Citizen, ICL shall be
sensitive to be welfare and development needs of the Society around us.
47
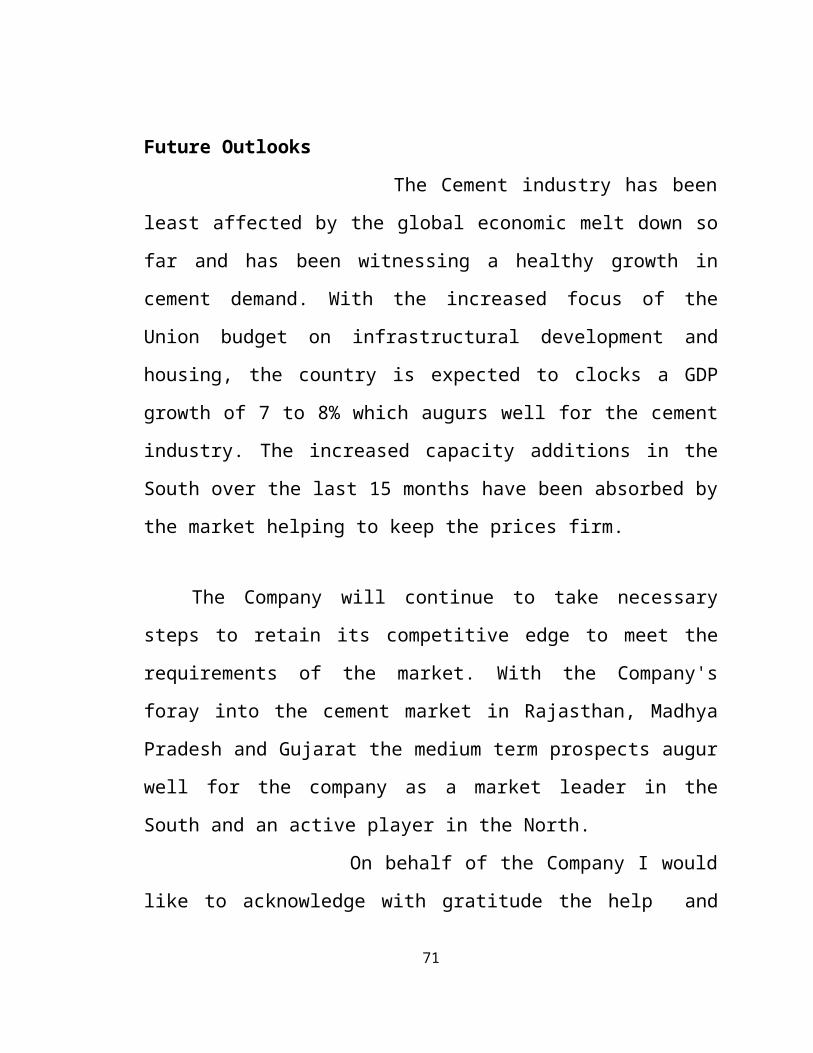
Future Outlooks
The Cement industry has been least affected by the global
economic melt down so far and has been witnessing a healthy growth in
cement demand. With the increased focus of the Union budget on
infrastructural development and housing, the country is expected to clocks a
GDP growth of 7 to 8% which augurs well for the cement industry. The
increased capacity additions in the South over the last 15 months have been
absorbed by the market helping to keep the prices firm.
The Company will continue to take necessary steps to retain its
competitive edge to meet the requirements of the market. With the
Company's foray into the cement market in Rajasthan, Madhya Pradesh and
Gujarat the medium term prospects augur well for the company as a market
leader in the South and an active player in the North.
On behalf of the Company I would like to acknowledge with
gratitude the help and co-operation received by us from the Central
Government, the Governments of Tamil Nadu and Andhra Pradesh, the
Financial Institutions and our bankers. I wish to commend the Management
Team and the employees of the Company for their dedicated Endeavour's
during the year.
48
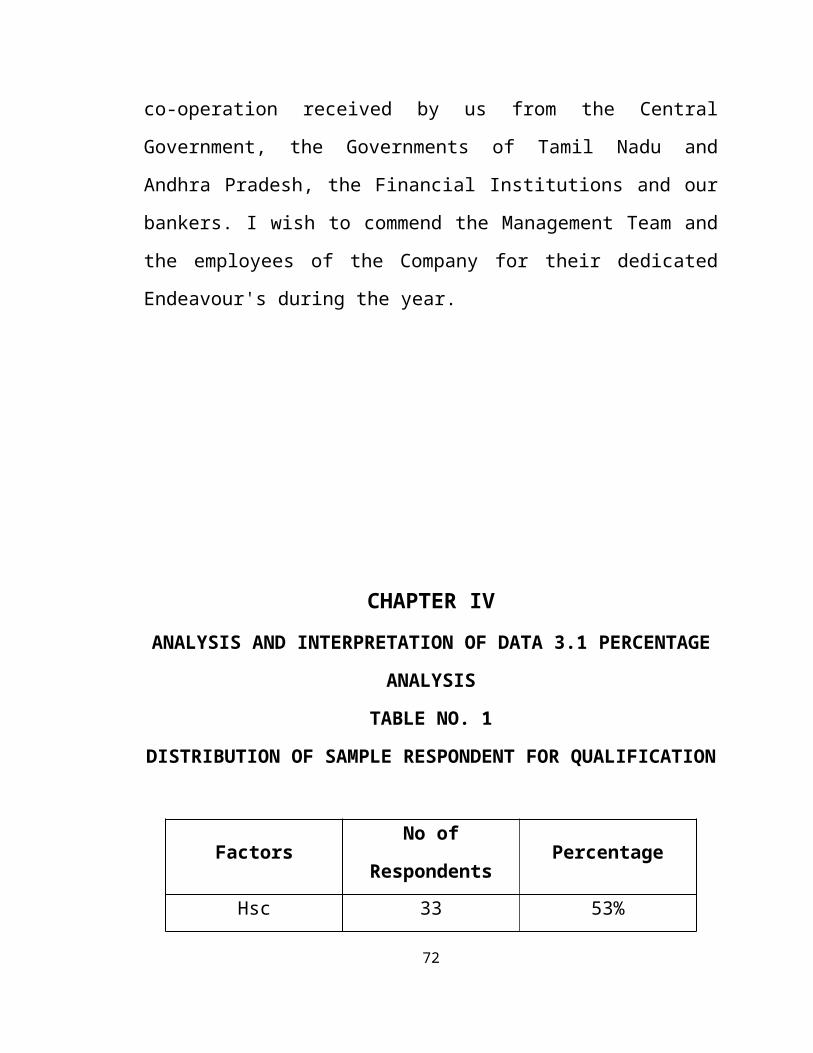
CHAPTER IV
ANALYSIS AND INTERPRETATION OF DATA 3.1 PERCENTAGE
ANALYSIS
TABLE NO. 1
DISTRIBUTION OF SAMPLE RESPONDENT FOR
QUALIFICATION
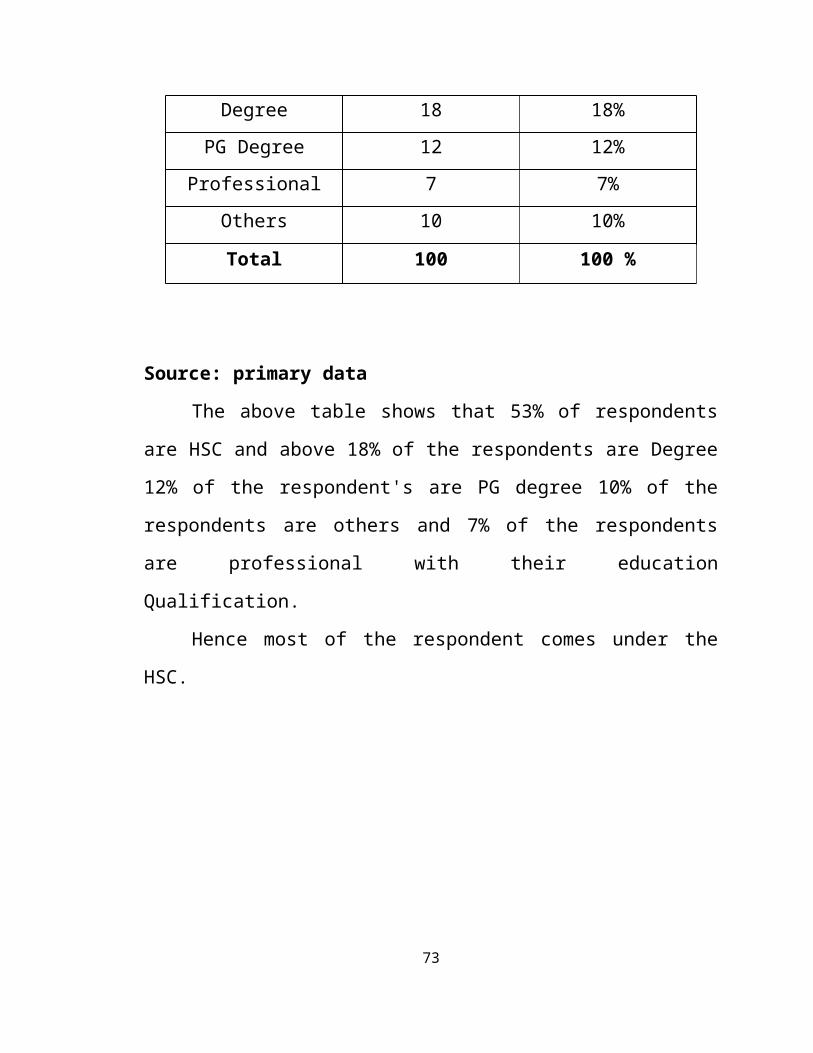
Factors No of Respondents Percentage
Hsc 33 53%
Degree 18 18%
PG Degree 12 12%
Professional 7 7%
Others 10 10%
Total 100 100 %
Source: primary data
The above table shows that 53% of respondents are HSC and above
18% of the respondents are Degree 12% of the respondent's are PG degree
10% of the respondents are others and 7% of the respondents are
professional with their education Qualification.
Hence most of the respondent comes under the HSC.
49
CHART NO. 1
SATISFACTION LEVEL FOR QUALIFICATION DISTRIBUTION
OF SAMPLE RESPONDENT FOR QUALIFICATION
50
53%
18%12%
7%10%
0%
10%
20%
30%
40%
50%
60%
PERCENTAGE
Hsc Degree PG Degree Professional Others
FACTORS
TABLE NO. 2
DISTRIBUTION OF SAMPLE RESPONDENT FOR DESIGNATION
Factors No of Respondents Percentage
High Level 4 4%
Middle Level 56 56%
Lower Level 40 40%
Total 100 100%
Source: primary data
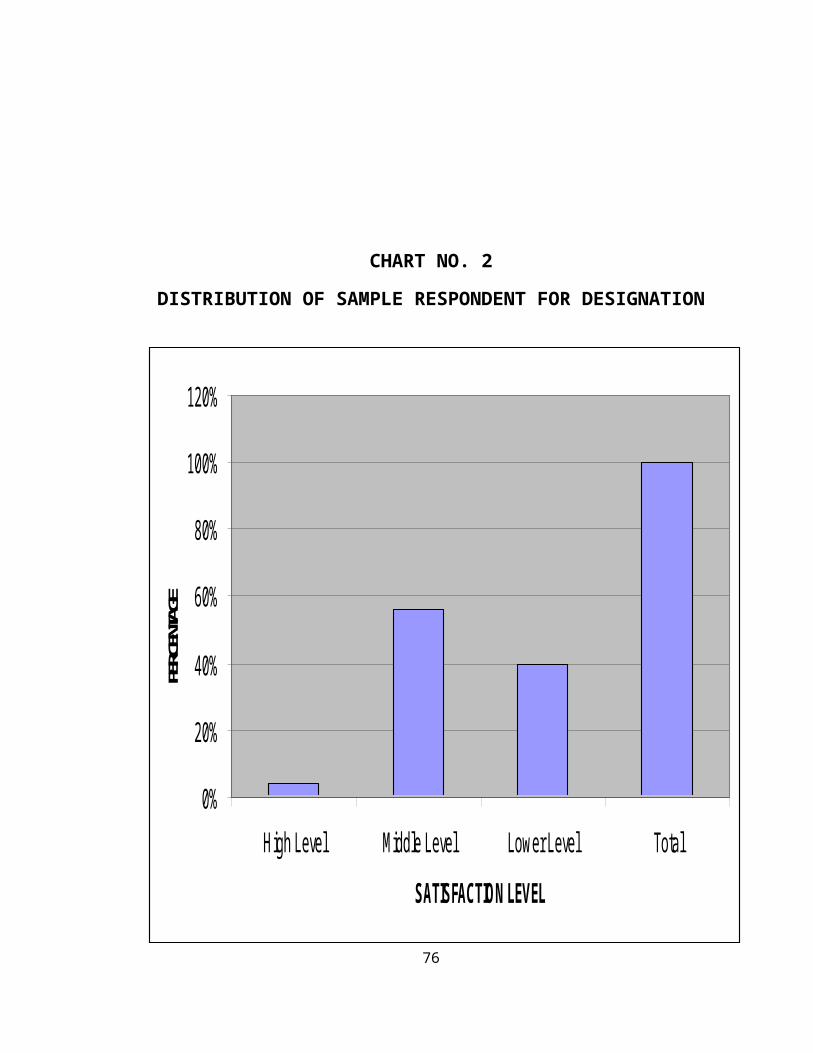
The above table shows that 56% of the respondents are Middle Level.
40% of the respondents are Lower Level 4% of the respondents are High
Level with their designation. Majority of the respondent comes under the
middle level stage.
51
CHART NO. 2
DISTRIBUTION OF SAMPLE RESPONDENT FOR DESIGNATION
52
0%
20%
40%
60%
80%
100%
120%
High Level Middle Level Lower Level Total
SATISFACTION LEVEL
PERC
ENTA
GE
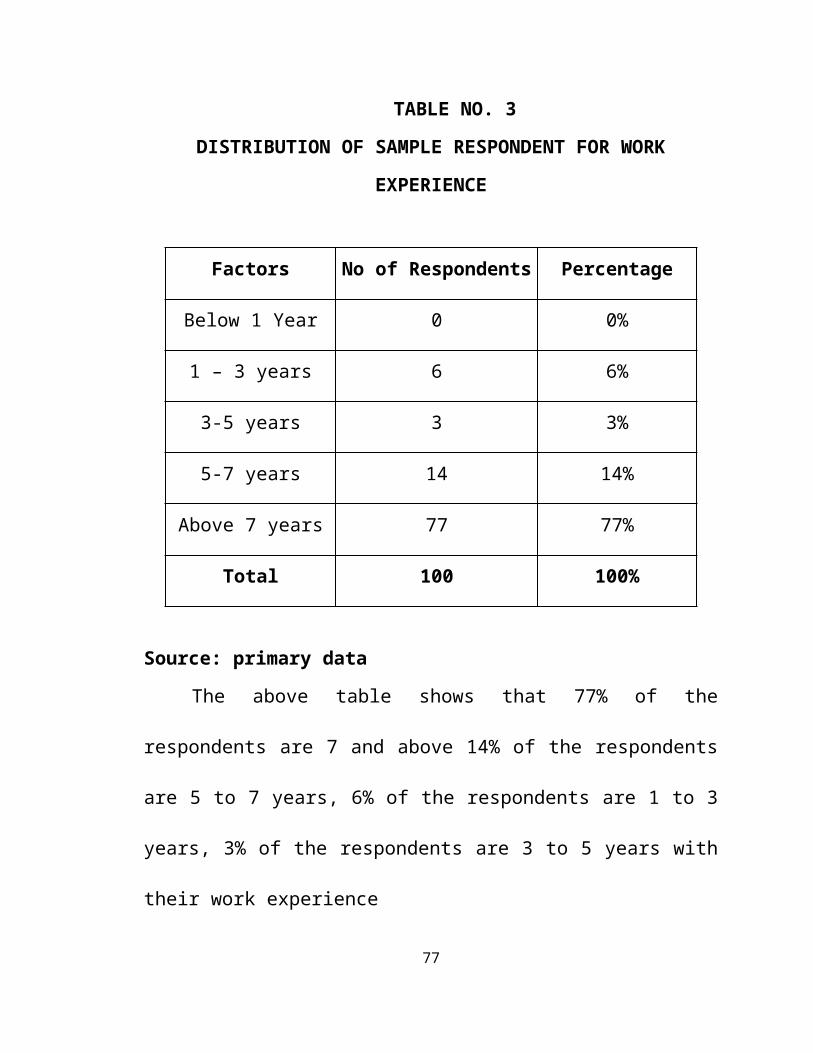
TABLE NO. 3
DISTRIBUTION OF SAMPLE RESPONDENT FOR WORK
EXPERIENCE
Factors No of Respondents Percentage
Below 1 Year 0 0%
1 – 3 years 6 6%
3-5 years 3 3%
5-7 years 14 14%
Above 7 years 77 77%
Total 100 100%
Source: primary data
The above table shows that 77% of the respondents are 7 and above
14% of the respondents are 5 to 7 years, 6% of the respondents are 1 to 3
years, 3% of the respondents are 3 to 5 years with their work experience
Majority of the respondent comes under the above 7years work
experience.
53
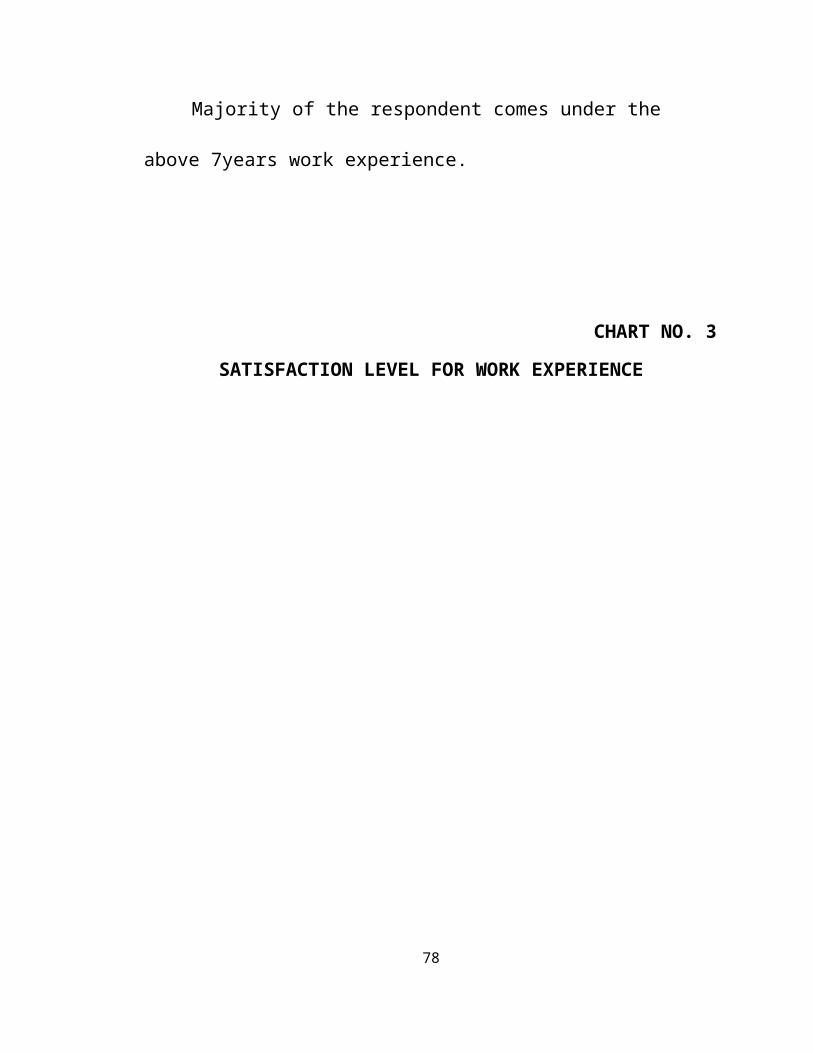
CHART NO. 3
SATISFACTION LEVEL FOR WORK EXPERIENCE
54
0%
10%
20%
30%
40%
50%
60%
70%
80%
90%
Below 1 Year 1 – 3 years 3-5 years 5-7 years Above 7 years
SATISFACTION LEVEL
PER
CEN
TAG
E
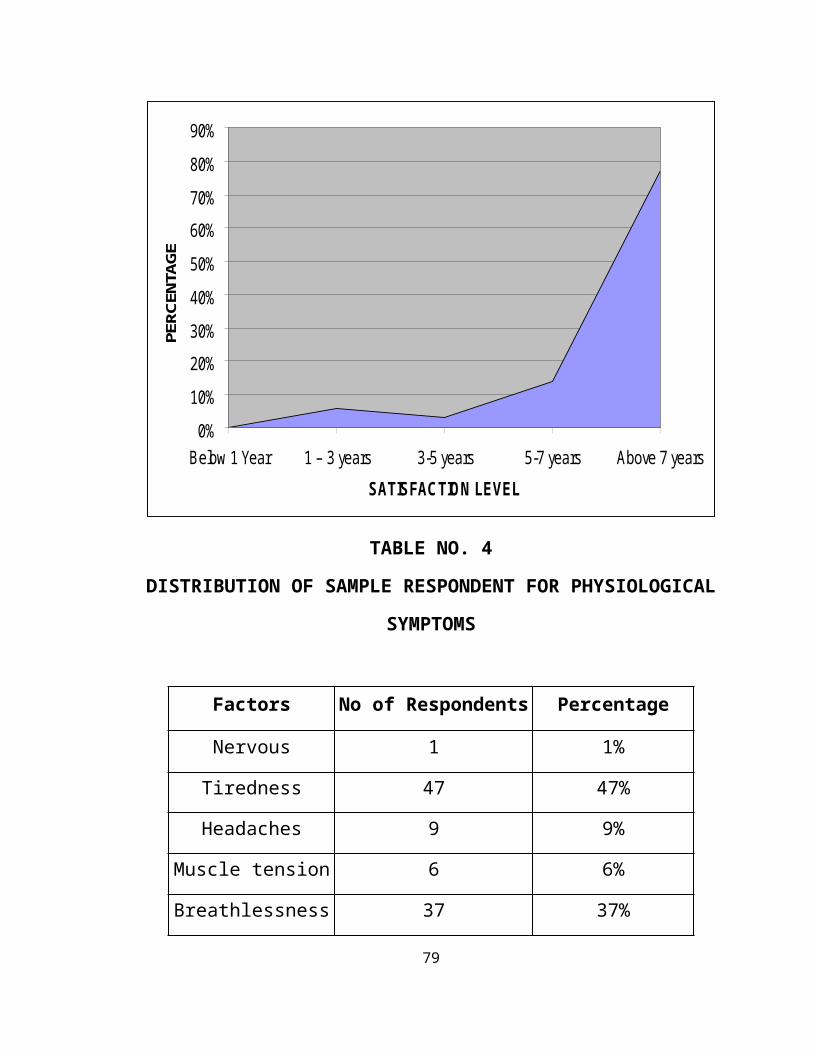
TABLE NO. 4
DISTRIBUTION OF SAMPLE RESPONDENT FOR
PHYSIOLOGICAL SYMPTOMS
Factors No of Respondents Percentage
Nervous 1 1%
Tiredness 47 47%
Headaches 9 9%
Muscle tension 6 6%
Breathlessness 37 37%
55
Total 100 100%
Source: primary data
The above table shows that 47% of the respondents are Tiredness and
37% of the respondents are Breathlessness and 9% of the respondents are
Headaches and 6% of the respondents are Muscle tension with their
Physiological Symptoms.
Hence the majority of the respondent comes under the tiredness
problem.
CHART NO.4
SATISFACTION LEVEL FOR PHYSIOLOGICAL SYMPTOMS
56
1%
47%
9%6%
37%
TABLE NO. 5
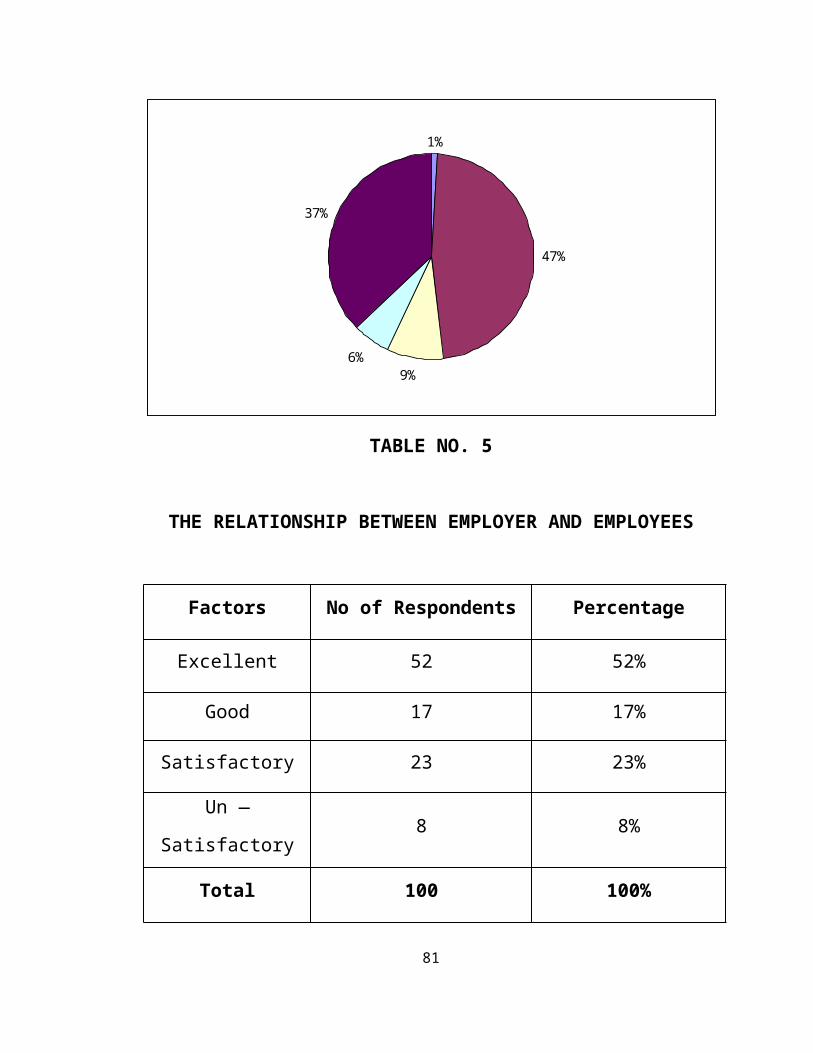
THE RELATIONSHIP BETWEEN EMPLOYER AND EMPLOYEES
Factors No of Respondents Percentage
Excellent 52 52%
Good 17 17%
Satisfactory 23 23%
Un — Satisfactory 8 8%
Total 100 100%
Source: primary data
57
The above tables shows respondents are Excellent and 23% of the
respondents are Satisfactory are 17% of the respondents are Good and 8% of
the respondents are with their Employer and employee relationship.
Majority respondent comes under the excellent relationship with their
employer.
58
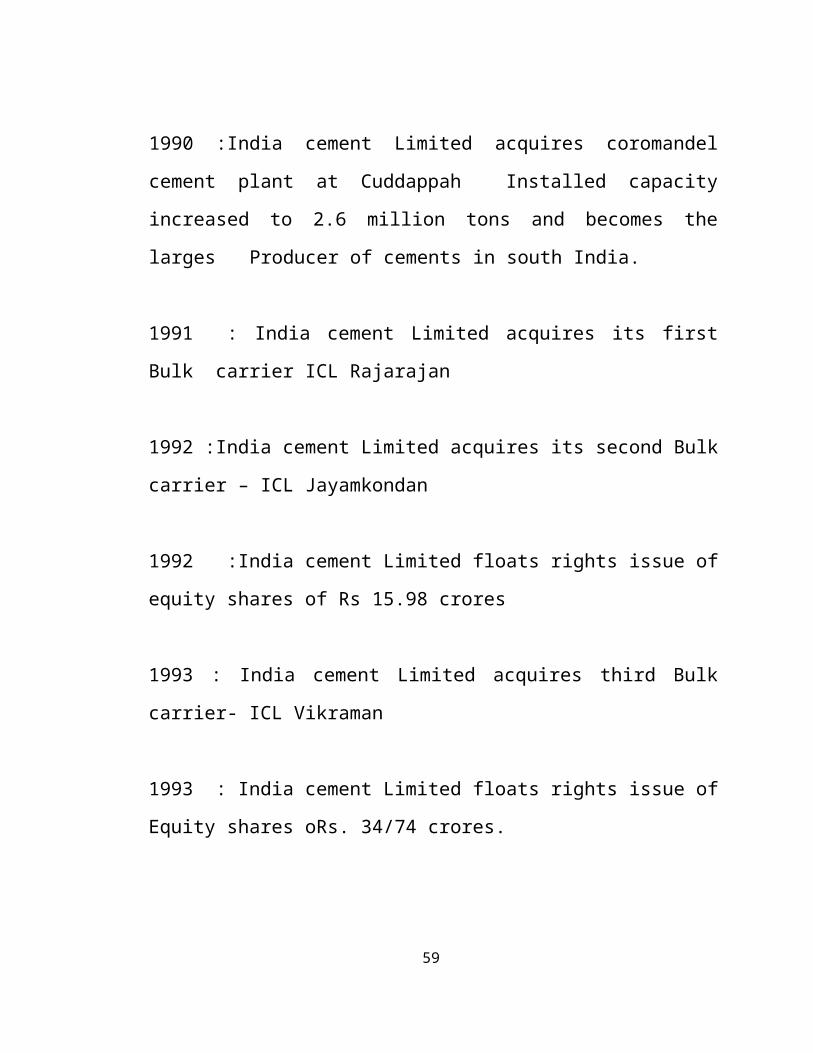
CHART NO. 5
SATISFACTION LEVEL FOR EMPLOYER AND EMPLOYEES
59
52%
17%
23%
8%
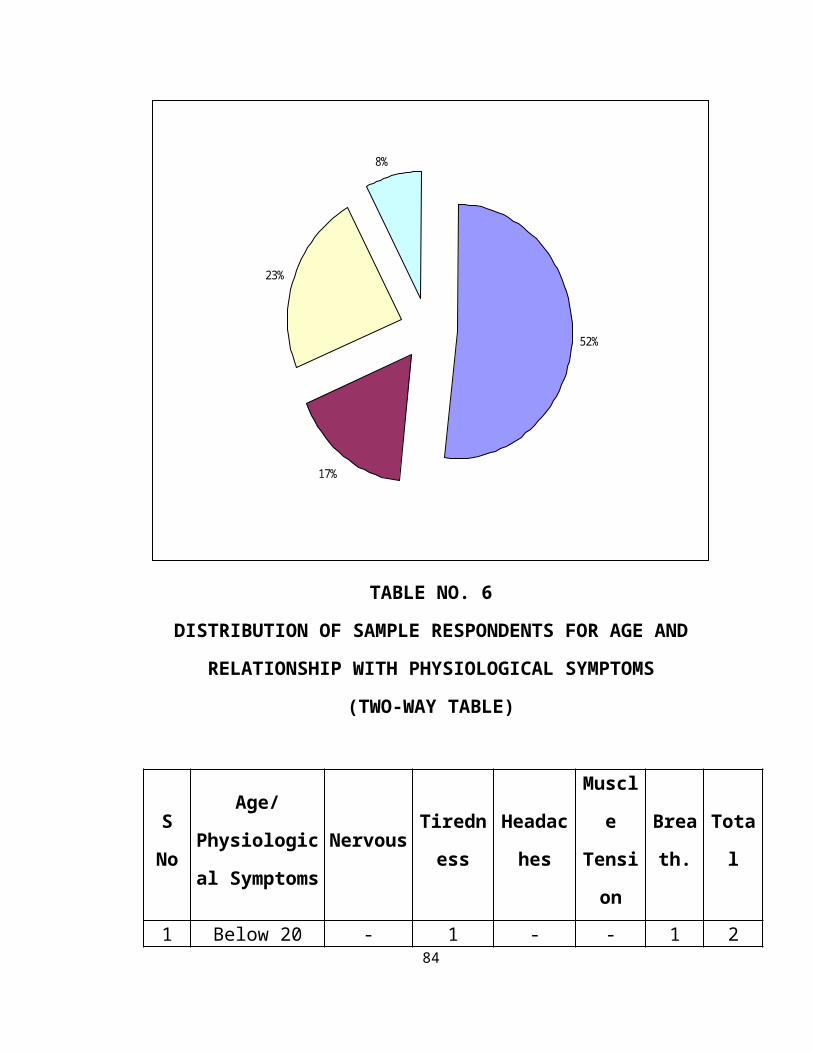
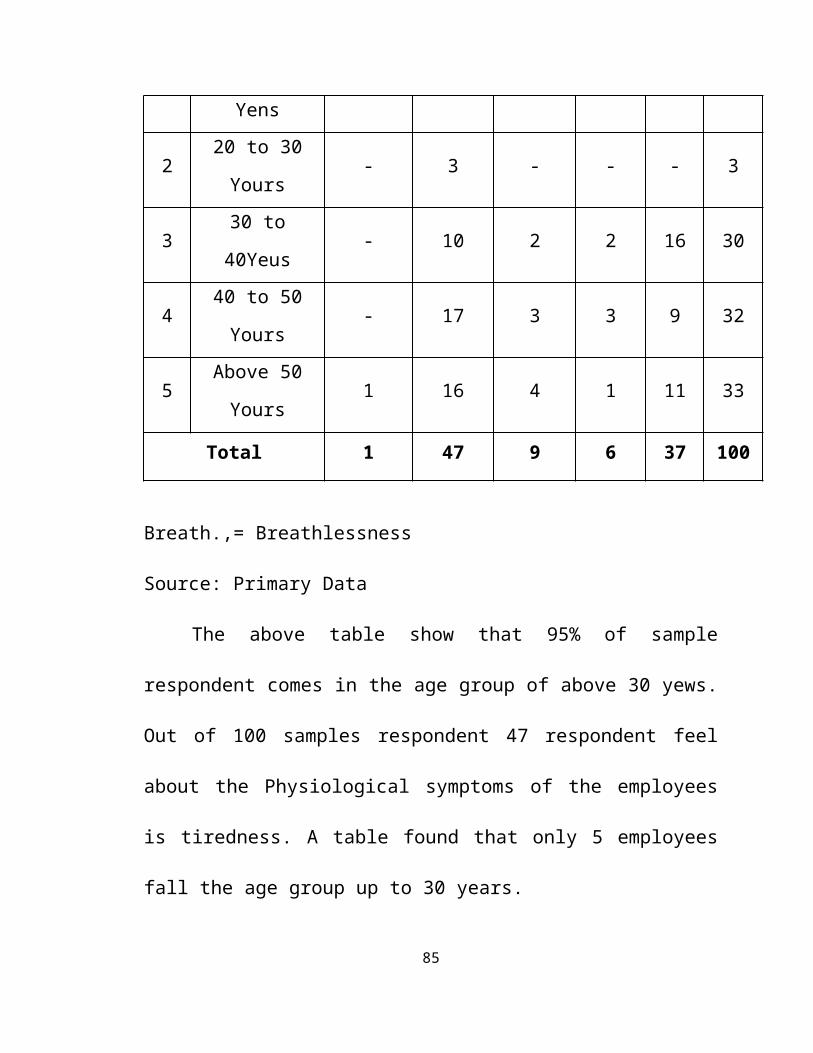
TABLE NO. 6
DISTRIBUTION OF SAMPLE RESPONDENTS FOR AGE AND
RELATIONSHIP WITH PHYSIOLOGICAL SYMPTOMS
(TWO-WAY TABLE)
S No
Age/
Physiological
Symptoms
NervousTirednes
s
Headach
es
Muscle
Tension
Breat
h.Total
1 Below 20 Yens - 1 - - 1 2
2 20 to 30 Yours - 3 - - - 3
60
3 30 to 40Yeus - 10 2 2 16 30
4 40 to 50 Yours - 17 3 3 9 32
5 Above 50 Yours 1 16 4 1 11 33
Total 1 47 9 6 37 100
Breath.,= Breathlessness
Source: Primary Data
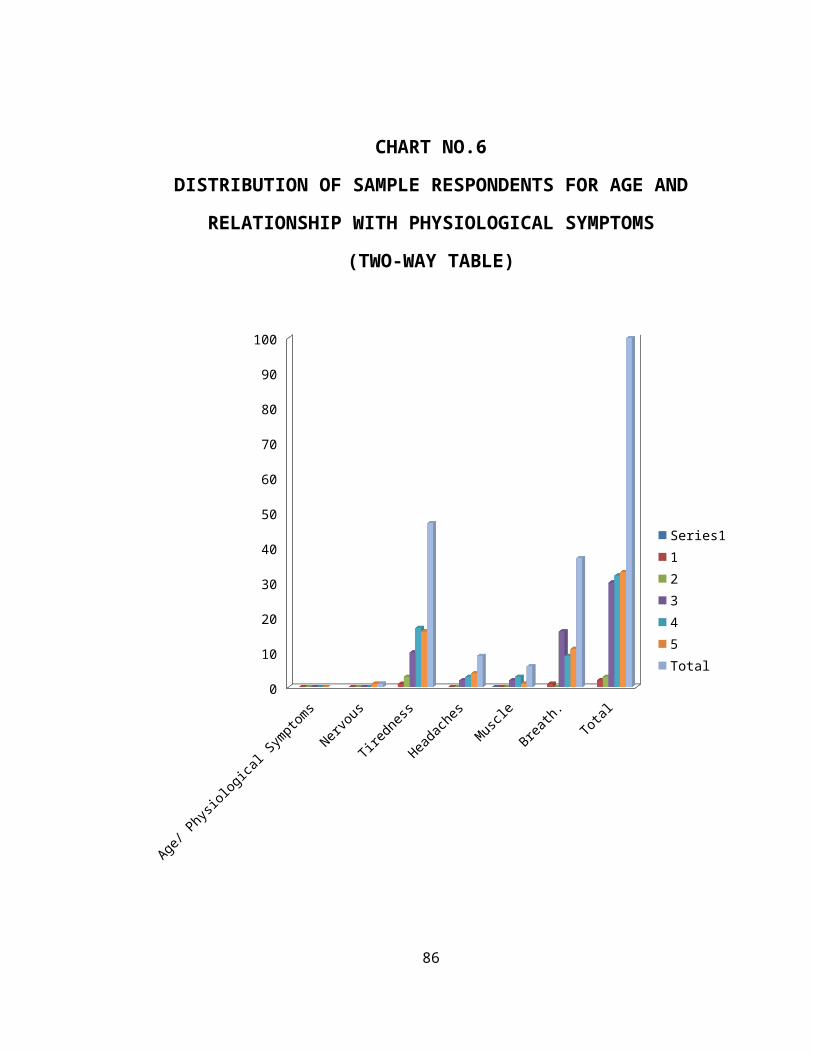
The above table show that 95% of sample respondent comes in the
age group of above 30 yews. Out of 100 samples respondent 47 respondent
feel about the Physiological symptoms of the employees is tiredness. A table
found that only 5 employees fall the age group up to 30 years.
CHART NO.6
DISTRIBUTION OF SAMPLE RESPONDENTS FOR AGE AND
RELATIONSHIP WITH PHYSIOLOGICAL SYMPTOMS
(TWO-WAY TABLE)
61
Age/ Phys-iological
Symptoms
Nervous Tiredness Headaches Muscle Breath. Total0
10
20
30
40
50
60
70
80
90
100
Series112345Total
TABLE NO. 7
DISTRIBUTION OF SAMPLE RESPONDENTS FOR DESIGNATION
AND RELATIONSHIP WITH PHYSIOLOGICAL SYMPTOMS.
S Qualificatio Nervou Tirednes Headach Muscle Breath Total
62
No.
n/
Physiologica
l
Symptoms
s s es Tension
1 HSC - 25 6 3 19 53
2 Degree 1 5 - 1 11 18
3 PG Degree - 9 - 1 2 12
4 Professional - 5 - - 2 7
5 Others - 3 3 1 3 10
Total 1 47 9 37 100
Breath., =Breathlessness
Source: Primary Data
The above table shows that 83% sample respondent comes under the
qualification of HSC, DEGREE AND PG DEGREE. Out of 100 samples
respondent 47 employees feel about the physiological symptoms of the
respondent is tiredness.
Hence it has been clearly understood that majority of HSC, AND
PGDEGREE qualification respondent having tiredness as there
physiological symptoms.
CHART NO.7
DISTRIBUTION OF SAMPLE RESPONDENTS FOR DESIGNATION AND RELATIONSHIP WITH PHYSIOLOGICAL SYMPTOMS
63
1 2 3 4 5 Total0%
10%
20%
30%
40%
50%
60%
70%
80%
90%
100%
TotalBreathMuscle TensionHeadachesTirednessNervousQualification/
TABLE NO. 8
DISTRIBUTION OF SAMPLE RESPONDENTS FOR DESIGNATION
AND RELATIONSHIP WITH PHYSIOLOGICAL SYMPTOMS.
64
S No.
Designation/
Physiological
Symptoms
NervousTirednes
s
Headache
s
Muscle
Tensio
n
Breat
hTotal
1 High Level - 1 1 - 2 4
2 Middle Level 1 31 4 3 17 56
3 Lower Level - 15 4 13 19 40
Total 1 47 9 6 37 100
Breath.,=Breathlessness
Source: Primary Data
From the above table show that 96% of the sample respondent comes
in the middle level and lower level group. Out of 100 ample respondents, 42
respondents feel about the tiredness with their physiological symptoms of
employees. A table funnels that only employees fall the High level group.
Hence it has been clearly understood majority of middle level and
lower level employee having tiredness with their physiological symptoms.
CHART NO.8
DISTRIBUTION OF SAMPLE RESPONDENTS FOR DESIGNATION
AND RELATIONSHIP WITH PHYSIOLOGICAL SYMPTOMS
65
Designation/
Nervous
Tiredness
Headaches
Muscle Tension
Breath
Total
0 20 40 60 80 100 120 140 160 180 200
Series1Series2123Total
TABLE NO. 9
DISTRIBUTION OF SAMPLE RESPONDENTS FOR WORK
EXPERIENCE AND RELATIONSHIP WITH PHYSIOLOGICAL
66
SYMPTOMS.
S
No.
Work
Experience/
Physiological
Symptoms
Nervou
s
Tirednes
s
Headache
s
Muscle
Tension
Breath
.Total
1 Below 1 years - 2 2 1 1 6
2 1 to 3 Years - 2 2 - 2 6
3 3 to 5 Years - 3 - ~ 3
4 5 to 7 Years - 5 - 1 8 14
5 Above 7 Years 1 35 5 4 26 71
Total 1 47 9 6 37 100
Breath.,=Breathlessness
Source; Primary Data
The above table high lights 85% of the respondent comes under the 5
to 7 years out of 100 sample respondent, 47 and 37 respondent feel about the
tiredness and Breathlessness problem. A table found only 15 employees fall
the work experience group up to 1 to 5 years.
CHART NO.9
DISTRIBUTION OF SAMPLE RESPONDENTS FOR WORK
EXPERIENCE AND RELATONSHIP WITH PHYSIOLOGICAL
67
SYMPTOMS.
0%
10%
20%
30%
40%
50%
60%
70%
80%
90%
100%
0 0
0
0
0
0
0
12
3
4
50
0
0
0
0
1
1
2
2
3
5
35
47
22
0
0 59
1 0
0
14
6
1 2
826
37
6 63
1471 100
TABLE NO. 10
68
DISTRIBUTION OF SAMPLE RESPONDENTS FOR MONTHLY
INCOME AND RELATIONSHIP WITH PHYSIOLOGICAL
SYMPTOMS
S No.
Your
Monthly
Income/
Physiological
Symptoms
Nervou
s
Tirednes
s
Headache
s
Muscle
Tensio
n
Breath Total
ILess than
6,000- 1 - 1 2 4
26,000 to
12,0001 36 6 4 23 70
312,000 to
18,000- 3 2 - 8 13
418,000 to
24,000- 6 1 1 2 10
5 Above 24,000 - 1 - - 2 3
Total 1 47 9 6 37 100
Breath.,=Breathlessness
Source: Primary Data
The above table indicates that as 70% of respondent earned 6000 to
12,000.13% of respondent earned up to 12,000-10,000 as there monthly
income and 10% of the respondent earned up to 18,000 to 24,000 out of 100
sample respondent 47 respondent feel about the physiological symptoms is
Tiredness.
CHART NO.10
69
DISTRIBUTION OF SAMPLE RESPONDENTS FOR MONTHLY
INCOME AND RELATIONSHIP WITH PHYSIOLOGICAL
SYMPTOMS
I 2 3 4 5 Total0
20
40
60
80
100
120
140
160
180
200
TotalBreathMuscle TensionHeadachesTirednessNervousYour Monthly
TABLE NO. 11
DISTRIBUTION OF SAMPLE RESPONDENTS FOR AGE AND70
RELATIONSHIP WITH EMPLOYER AND EMPLOYEES
S NO
Age with
Employers
and Employees
Relationship
Excellent GoodSatisfaction
s
Un-
Satisfaction
s
Total
1 Below 20 Years 2 - - - 2
2 20 to 30 Years 1 - 2 - 3
3 30 to 40 Years 15 7 6 2 30
4 40 to 50 Years 16 5 7 4 32
5 Above 50 Years 18 5 8 2 33
Total 52 17 23 8 100
Source: Primary Data
From the above table clearly shows that 95% of sample respondent
comes in the age group of above 30 years. Out of 100 sample respondent, 52
respondent feel about the relationship with the employers is excellent. A
table found that only 5 employees fall the age group up to 30 years.
CHART NO.11
71
DISTRIBUTION OF SAMPLE RESPONDENTS FOR AGE AN
RELATIONSHIP WITH EMPLOYER AND EMPLOYEES
1 2 3 4 5 Total0%
10%
20%
30%
40%
50%
60%
70%
80%
90%
100%
TotalUn-SatisfactionsSatisfactionsGoodExcellentAge with Employers
TABLE NO .12
72
DISTRIBUTION OF SIMPLE RESPONDENTS FOR
QUALIFICATION AND RELATIONSHIP WITH EMPLOYER AND
EMPLOYEES
S No.
Qualification
with
Employers and
Employees
Relationship
Excellent GoodSatisfaction
s
Un-
Satisfaction
s
Total
1 Hsc 32 8 8 5 53
2 Degree 8 6 4 - 18
3 PG Degree 7 - 3 2 12
4 Professional 3 3 1 - 7
5 Others 2 - 7 1 10
Total 52 17 23 8 100
Source; Primary Data
The above table states that 83% of sample respondent come in the
HSC, Degree, PG Degree. Out of 100 samples respondent 52 respondent
feel about the relationship with the employers is excellent. A table found that
only 17 employers fall the Qualification of professional and other.
73
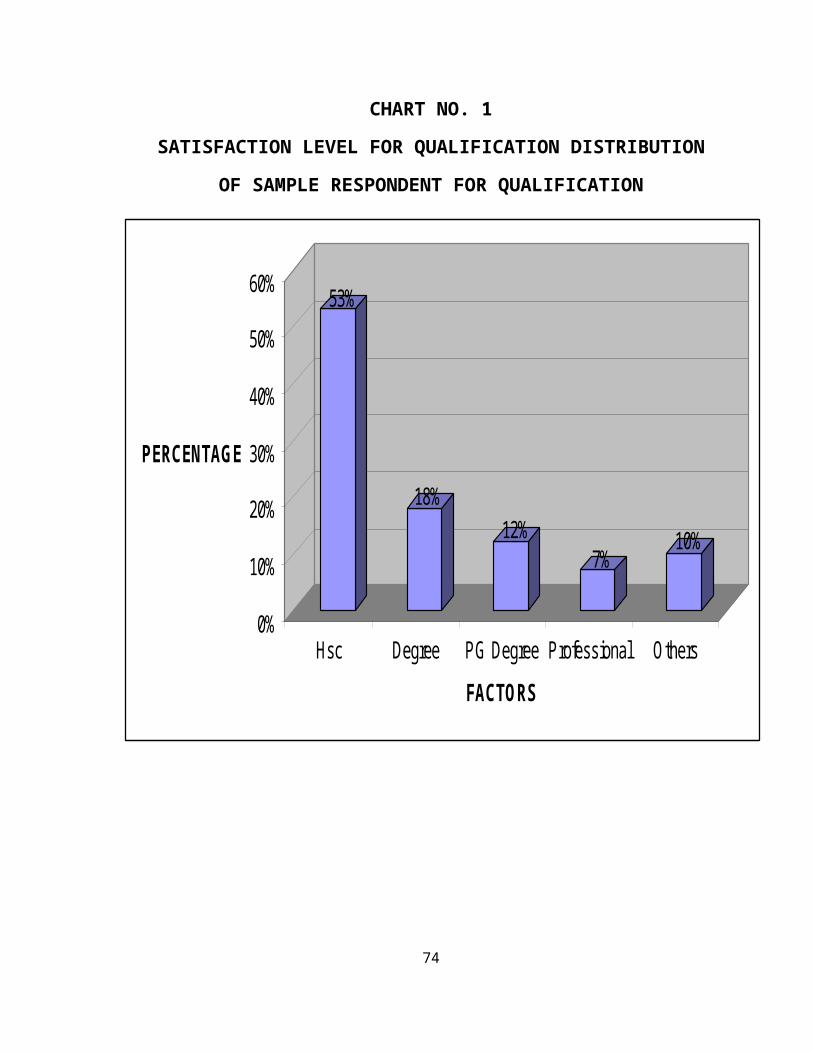
CHART NO.12
DISTRIBUTION OF SIMPLE RESPONDENTS FOR
QUALIFICATION AND RELATIONSHIP WITH EMPLOYER AND
EMPLOYEES
1 2 3 4 5 Total0
20
40
60
80
100
120
140
160
180
200
Qualification with Employers and Employees Relationship
Excellent
Good
Satisfactions
Un- Satisfactions
Total
74
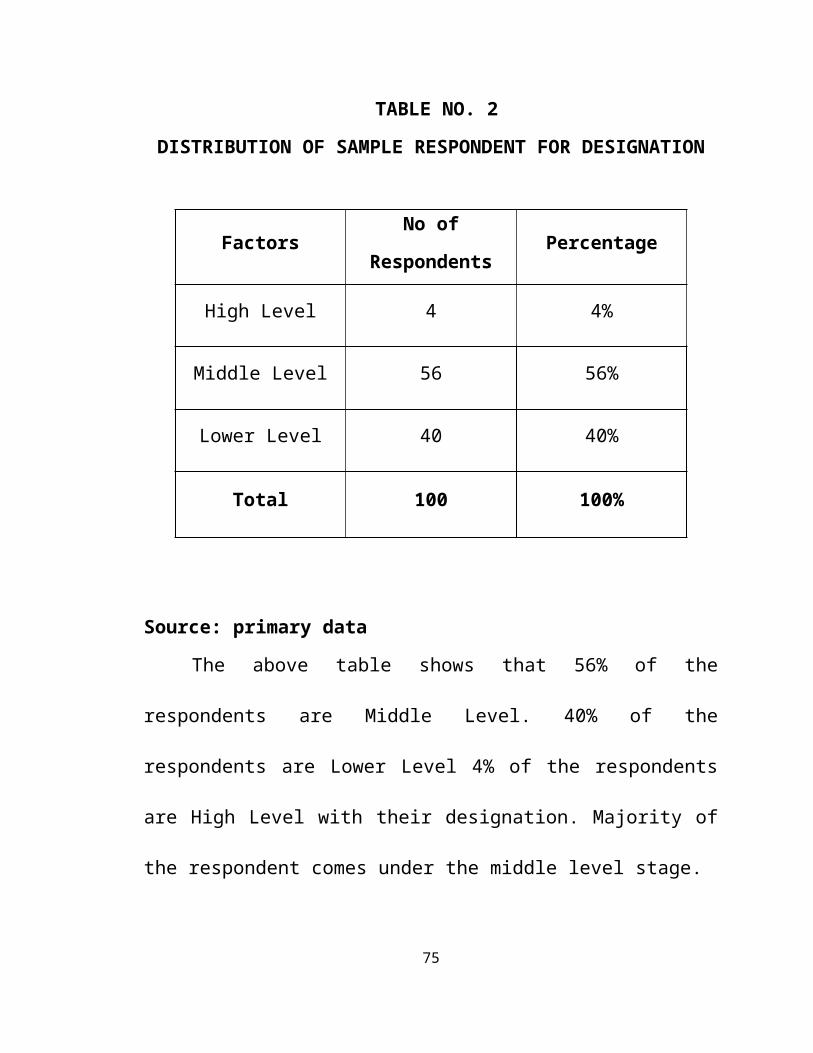
TABLE NO.13
DISTRIBUTION OF SAMPLE RESPONDENTS FOR DESIGNATION
AND RELATIONSHIP WITH
EMPLOYER AND EMPLOYEES
S No
Designation
with
Employers
and
Employees
Relationship
Excellent GoodSatisfaction
s
Un-
SatisfactionsTotal
1High Level 1 1 1 1 4
2 Middle Level 30 8 14 4 56
3 Lower Level 21 8 8 3 40
Total 52 17 23 8 100
Source: Primary Data
From the above table show that 96% of sample respondent comes
under the middle level and lower level. Out of 100 respondents, 52
respondent feel about the relationship with the employer is excellent. A table
found that only 4 employees fall the denigration of high level.
CHART NO.13
75
DISTRIBUTION OF SAMPLE RESPONDENTS FOR DESIGNATION
AND RELATIONSHIP WITH
EMPLOYER AND EMPLOYEES
1 2 3 4 5 Total
0 0 0 0 0
32
8 7 3 2
52
8
60 3 0
17
8
43 1 7
23
5
02
0
1
8
53
1812
710
100
Qualification with Employers and Employees RelationshipExcellentGoodSatisfactionsUn- SatisfactionsTotal
TABLE NO.1476
DISTRIBUTION OF SAMPLE RESPONDENTS FOR WORK
EXPERIENCE AND RELATIONSHIP WITH EMPLOYER AND
EMPLOYEES
S No
Work Experience
with Employers
and Employees
Relationship
Excellent GoodSatisfaction
s
Un-
SatisfactionsTotal
1 Below 1 Years 2 - 1 6
2 1 to 3 years 4 2 - - 6
3 3 to 5 Years - - 3 - 3
4 5 to 7 Years 8 5 1 - 14
5 Above 7 Years 38 10 16 7 71
Total 52 17 23 8 100
Source: Primary Data
The above table shows that 85% of respondent comes under the 5 to 7
years. Out of 100 samples respondent 52 respondent feel about the
relationship with the employers is excellent. A table found that only 15
employees fall the work experience group of up to 1 to 5 years.Hence
majority of work exprence group is above 7 years and majority of the
respondent having excellent relationship with their employers
CHART NO.14
77
DISTRIBUTION OF SAMPLE RESPONDENTS FOR WORK
EXPERIENCE AND RELATIONSHIP WITH EMPLOYER AND
EMPLOYEES
0
20
40
60
80
100
120
140
160
180
200
Total54321
TABLE NO.15
78
DISTRIBUTION OF SAMPLE RESPONDENTS FOR MONTHLY
INCOME AND RELATIONSHIP WITH EMPLOYER AND
EMPLOYEES
S No.
Your Monthly
Income with
Employers and
Employees
Relationship
Excellent GoodSatisfaction
s
Un-
Satisfaction
s
Total
1 Less than 6,000 2 1 1 4
2 6,000 to 12,000 36 n 18 5 70
3 12,000 to 18,000 5 4 2 2 13
4 18,000 to 24,000 7 2 1 - 10
5 Above 24,000 2 - 1 - 3
Total 52 17 23 8 100
Source: Primary Data
From the above table shows that 70% of employees earned 6,000 to
12,000. Out of 100 respondent 52 respondent feel about the relationship with
the employers is excellent. Hence it has been clearly understand the majority
of employers per-month income is 6,000 to 12,000 and majority of the
having excellent relationship with their employers.
CHART NO.15
79
DISTRIBUTION OF SAMPLE RESPONDENTS FOR MONTHLY
INCOME AND RELATIONSHIP WITH EMPLOYER AND
EMPLOYEES
1 2 3 4 5 Total0
50
100
150
200
250
TotalUn-SatisfactionsGoodExcellentYour Monthly Income with Employers and
CHAPTER-V80
SUMMARY OF FINDINGS, SUGGESTION AND CONCLUSION
4.1 FINDINGS
Hence most of the respondent comes under the HSC.
Majority of the respondent comes under the middle level stage.
Majority of the respondent comes under the above 7years work
experience.
Hence the majority of the respondent comes under the tiredness
problem.
Majority of the respondent comes under the excellent relationship
with their employer.
Hence majority of age group is above 30 years and majority of the age
group having tiredness as there physiological symptoms
Hence it has been clearly understood that majority of HSC.AND
PGDEGREE qualification respondent having tiredness as there
physiological symptoms.
Hence it has been clearly under stood majority of middle level and
lower level employee having tiredness with their physiological
symptoms.
Hence clearly understand of majority of employees earned there
monthly Income 6,000 to 12,000 and majority of the employees
having Tiredness with their physiological symptoms.
Hence majority of age group is above 30 years and majority of the age
group having excellent relationship with their employers.
Hence clearly understand of majority of employees earned there
monthly Income 6,000 to 12,000 and majority of the employees
having Tiredness with their physiological symptoms81
Hence majority of qualification of employees is HSC, DEGREE AND
PG DEGREE and majority of the qualification group having excellent
relationship with their employer
Hence it has been clearly understand that majority of designation
group is middle level and majority of the designation group having
excellent relationship with their employers.
Hence majority of work experience group is above 7 years and
majority of the respondent having.
Excellent relationship with their employers.
Hence it has been clearly understand the majority of employers per-
month income is 6,000 to 12,000 and majority of the having
excellent relationship with their employers.
4.2 SUGGESTIONS:-
82
The employees are suffering from tiredness. this shows the impact
of stress on their health.
Enough safety measures should be given in the period.
Employees should not be forced to finish the target they should be
given extra to the show performing works.
Medical checkup should be given frequently.
The organization may arrange for cultural and festival celebrations
for the employees which relieve the employees stress and provide a
free hand working environment within the industrial region.
If the management creates positive images and counseling. It will
reduce the stress and also increase confidence in wording
environment
The company should set realistic academic and personal priorities
periodically the company should not overload the employees with
unimportant tasks.
4.3 CONCLUSION:
83
The Project work titled A STUDY ON EMPLOYEES STRESS OF
INDIA CEMENTS LTD", SANKARI WEST, is great blessing to the
nation. We can say with sincere passion. Multifarious facilities monumental
growth marvelous production. Variegated. The employee stress is the mental
feeling of favorableness. Now a days employees stress play in important role
than waged and salaries paid, the data are analyzed using statistical tools and
findings and suggestions are given to the organization to reducing
employees stress.
BIBLIOGRAPHY
CHANDOLA (2012) Working with emotional intelligence. USA,
Bantam books.84
Suliman & Al-Shaikh (2011) Emotional intelligence at work. links to
conflict and innovation.
ENIOLA (2010) Organizational behavior 12th edition; New Delhi,
Prentice Hall of India Pvt. Ltd.
Employee Relations. 10.118/01425450710720020
Young & Duelist (2009) Relationships between emotional and
congruent self-awareness and performance in the British Royal Navy.
Journal of managerial Psychology. 10.1108/02683940710757191
WILSONET AL (2009 Stress in Life and work; New Delhi,
Response books.
KING & GARDNER (2008) Emotional intelligence and
occupational stress among professional staff in New Zealand
internationaljournal of organizational
psychology.10.1108/eb43386.
MARTIN JONES & CALLAN (2008) Psychology; 5th edition; New
Delhi, prentice Hall of India Pvt. LtdNIKOLADU & TSADUSIS (2002)
Managing Organizationalbehavior, 5th edition USA, John Wiley&sons.
85
Posig & Klckul (2007) Women in Management Review: work-role
expectations and work family conflict: gender differences in
emotional exhaustion. 10.1108/09649420410563430.
HIGGS (200) Abnormal psychology and modern life; 11 Edition;
New Delhi, Pe arson education
VAKOLA ET AL (2005) Educational Technology; 8th edition-USA,
Person Education Company.
Shipper Kincaid, M Rotondo & C.hoffman (2003) A Cross Cultural
Exploratory Study of the Linkage between Emotional intelligence and
Managerial Effectives. International Journal of Organizations Analysis
10.1108/eb028970
CARMELI (2006), organizational behaviour concepts-theory and
practices. New Delhi. Deep and Deep publications Pvt. Ltd
MACCANN ETAL (2003 )Synopsis of Psychiatry -Behavioural
science; 10th edition; New Delhi, Wolter Kulwer Pvt. Ltd
Rahim, Polychronic, Zhao, & Sheng Yu (2002). A Model of
Emotional intelligence and Conflict management Strategies International
Journal of Organizational Analysis 10.1108/eb028955.
NIKOLADU & TSADUSIS (2004) Managing Organizational
behaviour,5th edition. USA, John Wiley&sons Inc. \SCHUTTE ET 86
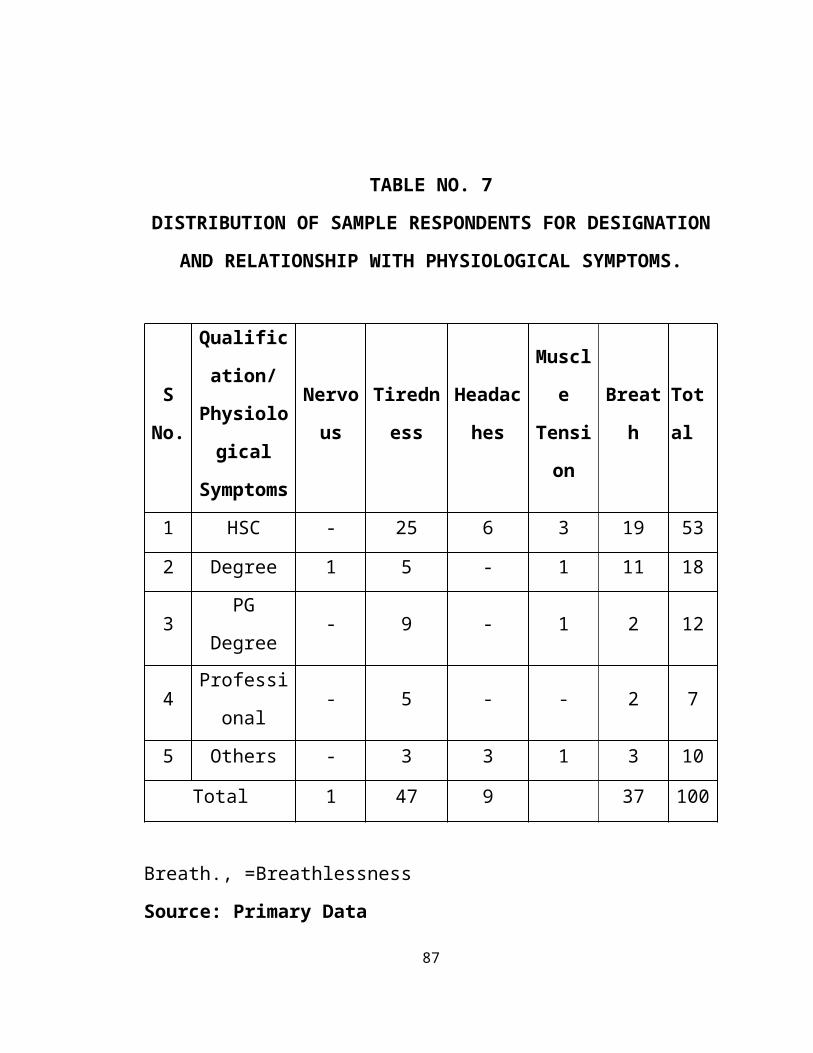
AL(2001) Human resource management theory & practices; UK,
Macmillan.
George and battenhausen (1990), Human behavior at work. 8th edition.
USA, Mo-Graw Hill International Editions. Hart (187) Managing Stress in
Occupational Settings:: A Selective Review of Current Research and
Theory, Journal of Managerial Psychology, 10.1108/eb043386.
Brewin (1980) Work Role Transitions and Stress in managers:
illustrations from the Clinic, personnel
Review.10.1108/eb055414.
.
APPENDIX
"A STUDY ON EMPLOYEES STRESS OF INDIA CEMENTS LTD",
SANKARl WEST
QUESTIONNAIRE
1. Age of the Respondentsa. Below 30 yrs [ ] b. 30-40 yrs [ ] c. Above 40 yrs [ ]
87
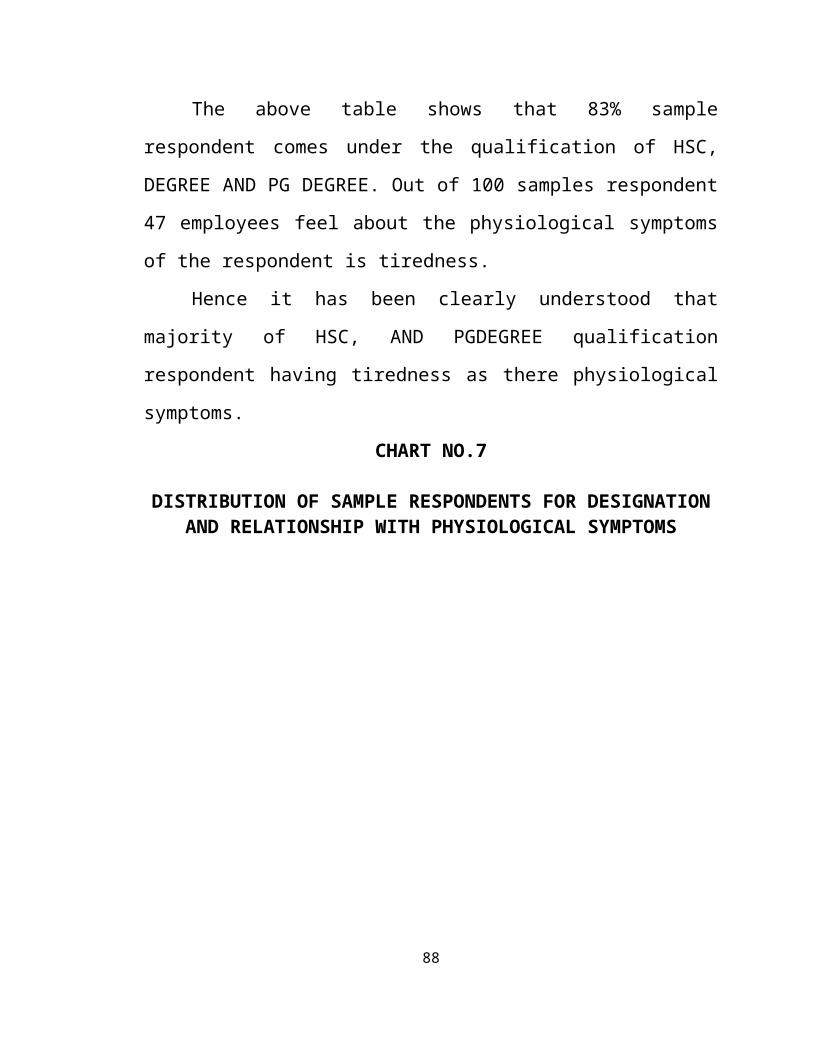
2. Experience of the Respondentsa. Below 10 yrs [ ] b. Above 10 yrs [ ]
3. Qualification of the Respondentsa.Upto SSLC [ ] b.HSC [ ]c. Graduate [ ] d. Diploma [ ]
4. Designation of the Employee a. High Level [ ] b. Middle Level [ ]c. Low Level [ ]
5. Work Experience of the Samplea. Below l year [ ] b. 1-3 Year [ ] c.3-5Year [ ] d.5-7 Year [ ] e. above 7 Years [ ]
6. Do you face Physiological Symptoms at Worka. Yes [ ] b. No [ ]If Yes, a. Nervous [ ] b. Tiredness [ ] c. Headaches [ ] d. Muscle Tension [ ] e. Breathlessness [ ]
7. Relationship between Employer and Employeesa. Excellent [ ] b. Good [ ] c. Satisfactory [ ] d. Unsatisfactory [ ]
8. Do you suffer from difficulty in sleeping?a. Not at all [ ] b. Sometimes [ ] c. Often [ ]
9. Do you find difficulty in concentration?a. Not at all [ ] b. Sometimes [ ] c. Often [ ]
10. Do you get anger soon?a. Not at all [ ] b. Sometimes [ ] c. Often [ ]
11. Do you find any negative thinking about your job?a. Not at all [ ] b. Sometimes [ ] c. Often [ ]
88
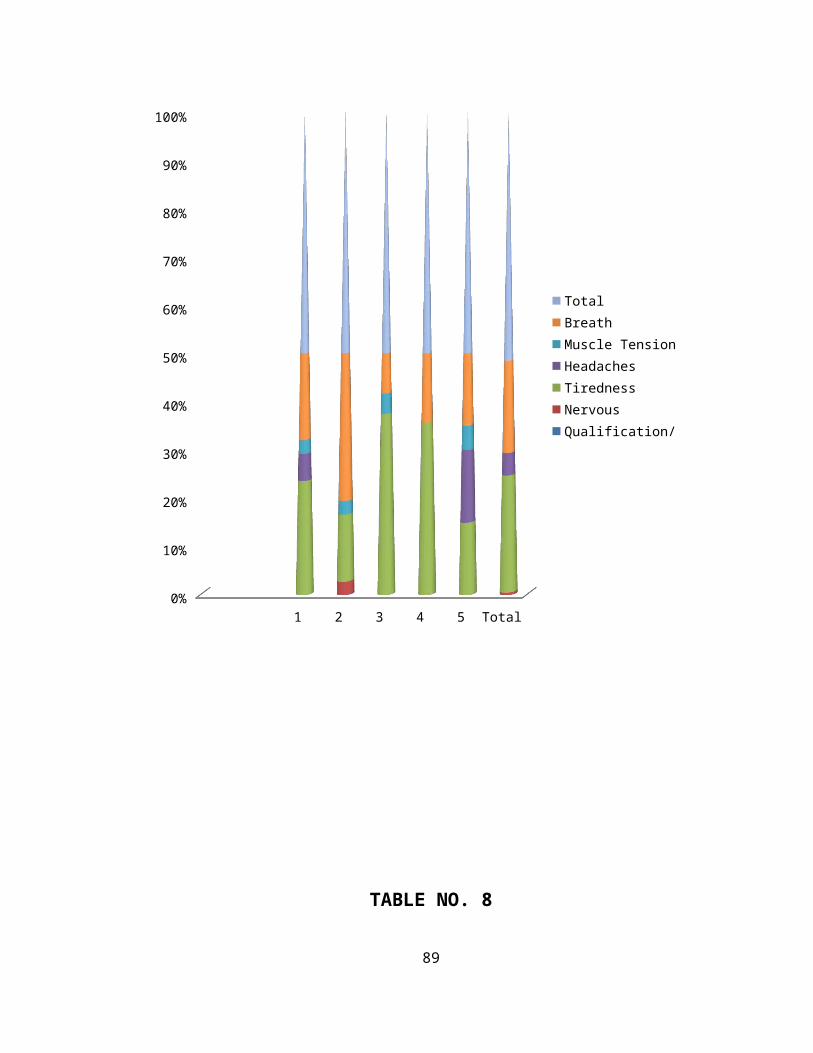
12. Do you find time to have hobbies and leisure time with family?a. Not at all [ ] b. Sometimes [ ] c. Often [ ]
13. When Conflict arises at the work place do you tend to over react?a. Not at all [ ] b. Sometimes [ ] c. Often [ ]
14. Do you have smooth relationship with the co-workers?a. Not at all [ ] b. Sometimes [ ] c. Often [ ]
15. Are you satisfied with your monthly income?a. Yes [ ] b. No [ ]
89


