
A Survey of Systemic RiskAnalytics
Dimitrios Bisias,1Mark Flood,4AndrewW.Lo,2,3,5,6
Stavros Valavanis3
1Operations Research Center, 2Sloan School of Management, 3Laboratory for
Financial Engineering, 5Computer Science and Artificial Intelligence Laboratory,
Massachusetts Institute of Technology, Cambridge, Massachusetts 02139;
email: [email protected], [email protected], [email protected]
4Office of Financial Research, US Department of the Treasury, Washington, DC
20220; email: [email protected]
6AlphaSimplex Group, LLC, Cambridge, Massachusetts 02142
Annu. Rev. Financ. Econ. 2012. 4:255–96
The Annual Review of Financial Economics is
online at financial.annualreviews.org
This article’s doi:
10.1146/annurev-financial-110311-101754
Copyright © 2012 by Annual Reviews.
All rights reserved
JEL: G12, G29, C51
1941-1367/12/1205-0255$20.00
Keywords
systemic risk, financial institutions, liquidity, financial crises,
risk management
Abstract
We provide a survey of 31 quantitative measures of systemic risk in
the economics and finance literature, chosen to span key themes
and issues in systemic risk measurement and management. We
motivate these measures from the supervisory, research, and data
perspectives in the main text and present concise definitions of
each risk measure—including required inputs, expected outputs,
and data requirements—in an extensive Supplemental Appendix.
To encourage experimentation and innovation among as broad an
audience as possible, we have developed an open-source MatlabÒlibrary for most of the analytics surveyed, which, once tested, will
be accessible through the Office of Financial Research (OFR) at
http://www.treasury.gov/initiatives/wsr/ofr/Pages/default.aspx.
255
Ann
u. R
ev. F
inan
c. E
con.
201
2.4:
255-
296.
Dow
nloa
ded
from
ww
w.a
nnua
lrev
iew
s.or
g A
cces
s pr
ovid
ed b
y M
assa
chus
etts
Ins
titut
e of
Tec
hnol
ogy
(MIT
) on
06/
19/1
7. F
or p
erso
nal u
se o
nly.
1. INTRODUCTION
In July 2010, the US Congress enacted the Dodd-Frank Wall Street Reform and Consumer
Protection Act (Dodd-Frank Act), the most comprehensive financial reform bill since the
1930s. Among other things, the Dodd-Frank Act created the Financial Stability Oversight
Council (FSOC) and the Office of Financial Research (OFR). The FSOC has three broad
mandates: (a) to identify risks to financial stability arising from events or activities of large
financial firms or elsewhere, (b) to promote market discipline by eliminating participants’
expectations of possible government bailouts, and (c) to respond to emerging threats to the
stability of the financial system.1 The starting point for all these directives is the accurate
and timely measurement of systemic risk. The truism that “one cannot manage what one
does not measure” is especially compelling for financial stability, given that policymakers,
regulators, academics, and practitioners have yet to reach a consensus on how to define
systemic risk. Although regulators sometimes apply Justice Potter Stewart’s definition of
pornography, i.e., systemic risk may be hard to define but they know it when they see it,
such a vague and subjective approach is not particularly useful for measurement and anal-
ysis, a prerequisite for addressing threats to financial stability.
One definition of systemic risk is “any set of circumstances that threatens the stability of
or public confidence in the financial system” (Billio et al. 2012, p. 537). The European
Central Bank (ECB) defines it as a risk of financial instability “so widespread that it
impairs the functioning of a financial system to the point where economic growth and
welfare suffer materially” (ECB 2010, p. 129). Others have focused on more specific
mechanisms, including imbalances (Caballero 2009), correlated exposures (Acharya
et al. 2010), spillovers to the real economy (Group of Ten 2001), information disruptions
(Mishkin 2007), feedback behavior (Kapadia et al. 2009), asset bubbles (Rosengren
2010), contagion (Moussa 2011), and negative externalities [Financial Stability Board
(FSB) 2009].
This partial listing of possible definitions suggests that more than one risk measure will
be needed to capture the complex and adaptive nature of the financial system. Because
systemic risk is not yet fully understood, measurement is obviously challenging, with many
competing—and sometimes contradictory—definitions of threats to financial stability.
Moreover, a single consensus measure of systemic risk may be neither possible nor desir-
able; such a Maginot Line strategy invites a blindsided surprise from an unforeseen or
newly emerging mechanism. Instead, a robust framework for monitoring and managing
financial stability must incorporate both a diversity of perspectives and a continuous
process for reevaluating the evolving structure of the financial system and adapting
systemic risk measures to these changes. At the same time, to be useful in measuring
systemic risk, a practical implementation must translate economic concepts into very
particular choices: One must decide which attributes of which entities will be measured,
how frequently and over what observation interval, and with what levels of granularity and
accuracy. Summary measures involve further choices on how to filter, transform, and
aggregate the raw inputs.
In this review, we take on this challenge by surveying the systemic risk measures and
conceptual frameworks that have been developed over the past several years and providing
1See Section 112(a)(1) (Pub. L. 111-203, H.R. 4173). The full range of detailed mandates, constraints, and author-
ities for the FSOC and OFR are covered in Sections 112–156 of the Act.
256 Bisias et al.
Ann
u. R
ev. F
inan
c. E
con.
201
2.4:
255-
296.
Dow
nloa
ded
from
ww
w.a
nnua
lrev
iew
s.or
g A
cces
s pr
ovid
ed b
y M
assa
chus
etts
Ins
titut
e of
Tec
hnol
ogy
(MIT
) on
06/
19/1
7. F
or p
erso
nal u
se o
nly.
open-source software implementation (in MatlabÒ) of each of the analytics we include here.
These measures are listed in Table 1, which loosely groups them by the type of data they
require and indications of the Appendix Section where they are described in detail (see
Supplemental Appendixes A–F; follow the Supplemental Materials link in the online ver-
sion of this article or at http://www.annualreviews.org). The taxonomy of Table 1 lists the
analytics roughly in increasing order of the level of detail for the data required to imple-
ment them. This categorization is obviously most relevant for the regulatory agencies that
will be using these analytics, but it is also relevant to industry participants who will need to
supply such data.2 For each of these analytics, Supplemental Appendixes A–F contain a
concise description of its definition, its motivation, the required inputs, the outputs, and a
brief summary of empirical findings, if any. For convenience, in Supplemental Appendix G
we list the program headers for all the MatlabÒ functions provided.
Thanks to the overwhelming academic and regulatory response to the Financial Crisis
of 2007–2009, we face an embarrassment of riches with respect to systemic risk analytics.
The size and complexity of the financial system imply a diversity of legal and institutional
constraints, market practices, participant characteristics, and exogenous factors driving
the system at any given time. Accordingly, there is a corresponding diversity of models
and measures that emphasize different aspects of systemic risk. These differences matter.
For example, many of the approaches surveyed in this review assume that systemic risk
arises endogenously within the financial system. If correct, this implies that there should be
measurable intertemporal patterns in systemic stability that might form the basis for early
detection and remediation. In contrast, if the financial system is simply vulnerable to
exogenous shocks that arrive unpredictably, then other types of policy responses are called
for. The relative infrequency with which systemic shocks occur makes it all the more
challenging to develop useful empirical and statistical intuition for financial crises.3
Unlike typical academic surveys, we do not attempt to be exhaustive in our breadth.
[Other surveys are provided by Acharya et al. (2010), De Bandt & Hartmann (2000), and
International Monetary Fund (IMF) (2011, Ch. 3).] Instead, our focus is squarely on
the needs of regulators and policymakers, who, for a variety of reasons—including the
public-goods aspects of financial stability and the requirement that certain data be kept
confidential—are solely charged with the responsibility of ensuring financial stability from
day to day. We recognize that the most useful measures of systemic risk may be ones
that have yet to be tried because they require proprietary data only regulators can obtain.
Nevertheless, given that most academics do not have access to such data, we chose to
emphasize those analytics that could be most easily estimated so as to quicken the pace of
experimentation and innovation.
Although each of the approaches surveyed in this review is meant to capture a specific
challenge to financial stability, we remain agnostic at this stage about what is knowable.
2An obvious alternate taxonomy is the venerable Journal of Economic Literature ( JEL) classification system or the
closely related EconLit taxonomy. However, these groupings do not provide sufficient resolution within the narrow
subdomain of systemic risk measurement to be useful for our purposes. Borio & Drehmann (2009b) suggest a three-
dimensional taxonomy, involving forecasting effectiveness, endogeneity of risks, and the level of structural detail
involved. Those three aspects are reflected in the taxonomies we propose in this review.
3Borio & Drehmann (2009a) observe that there is as yet no single consensus explanation for the behavior of the
financial system during crises, and because they are infrequent events in the most developed financial centers, the
identification of stable and reliable patterns across episodes is virtually impossible in one lifetime. Caruana (2010a)
notes two studies indicating that, worldwide, there are roughly three or four financial crises per year on average.
Most of these have occurred in developing economies, perhaps only because smaller countries are more numerous.
www.annualreviews.org � Systemic Risk Analytics 257
Supplemental Material
Ann
u. R
ev. F
inan
c. E
con.
201
2.4:
255-
296.
Dow
nloa
ded
from
ww
w.a
nnua
lrev
iew
s.or
g A
cces
s pr
ovid
ed b
y M
assa
chus
etts
Ins
titut
e of
Tec
hnol
ogy
(MIT
) on
06/
19/1
7. F
or p
erso
nal u
se o
nly.

Table 1 Taxonomy of systemic risk measures by data requirementsa,b
Systemic risk measure Appendix Section
Macroeconomic measures:
Costly asset price boom/bust cycles A.1
Property-price, equity-price, and credit-gap indicators A.2
Macroprudential regulation A.3
Granular foundations and network measures:
The default intensity model B.1
Network analysis and systemic financial linkages B.2
PCA and Granger-causality networks B.3
Bank funding risk and shock transmission B.4
Mark-to-market accounting and liquidity pricing B.5
Forward-looking risk measures:
Contingent claims analysis C.1
Mahalanobis distance C.2
The option iPoD C.3
Multivariate density estimators C.4
Simulating the housing sector C.5
Consumer credit C.6
Principal components analysis C.7
Stress-test measures:
GDP stress tests D.1
Lessons from the SCAP D.2
A 10-by-10-by-10 approach D.3
Cross-sectional measures:
CoVaR E.1
DIP E.2
Co-Risk E.3
Marginal and systemic expected shortfall E.4
(Continued)
258 Bisias et al.
Ann
u. R
ev. F
inan
c. E
con.
201
2.4:
255-
296.
Dow
nloa
ded
from
ww
w.a
nnua
lrev
iew
s.or
g A
cces
s pr
ovid
ed b
y M
assa
chus
etts
Ins
titut
e of
Tec
hnol
ogy
(MIT
) on
06/
19/1
7. F
or p
erso
nal u
se o
nly.
The system to be measured is highly complex, and the measures considered here are largely
untested out of sample, i.e., outside the recent crisis. Indeed, some of the conceptual
frameworks that we review are still in their infancy and have yet to be applied. Moreover,
even if an exhaustive overview of the systemic risk literature were possible, it would likely
be out of date as soon as it was written.
Instead, our intention is to present a diverse range of methodologies, data sources, levels
of data frequency and granularity, and industrial coverage. We wish to span the space of
what has already been developed, to provide the broadest possible audience with a sense of
where the boundaries of the field lie today, and to do so without clouding the judgments
of that audience with our own preconceptions and opinions. Therefore, we have largely
refrained from any editorial commentary regarding the advantages and disadvantages of
the measures contained in this survey, and our inclusion of a particular approach should
not be construed as an endorsement or recommendation, just as omissions should not be
interpreted conversely. We prefer to let the users, and experience, be the ultimate judges of
which measures are most useful.
Our motivation for providing open-source software for these measures is similar:
We wish to encourage more research and development in this area by researchers from
all agencies, disciplines, and industries. Having access to working code for each mea-
sure should lower the entry cost to the field. We have witnessed the enormous leverage
that the wisdom of crowds can provide to even the most daunting intellectual challenges—
for example, the Netflix Prize, the DARPA Network Challenge, and Amazon’s Mechanical
Turk—and hope that this survey may spark the same kind of interest, excitement,
and broad engagement in the field of systemic risk analytics. Accordingly, this survey
is intended to be a living document, and we hope that users will not only benefit from
these efforts but will also contribute new analytics and corrections and revisions of
existing analytics and will help expand our understanding of financial stability and
its converse. In the long term, we hope this survey will evolve into a comprehensive
library of systemic risk research, a knowledge base that includes structured descriptions
Table 1 (Continued)
Systemic risk measure Appendix Section
Measures of illiquidity and insolvency:
Risk topography F.1
The leverage cycle F.2
Noise as information for illiquidity F.3
Crowded trades in currency funds F.4
Equity market illiquidity F.5
Serial correlation and illiquidity in hedge-fund returns F.6
Broader hedge-fund-based systemic risk measures F.7
aAbbreviations: CoVaR: conditional value at risk; DIP: distressed insurance premium; iPoD: implied probability of
default; SCAP: Supervisory Capital Assessment Program.bSee Supplemental Appendixes A–F; follow the Supplemental Materials link in the online version of this article or at
http://www.annualreviews.org.
www.annualreviews.org � Systemic Risk Analytics 259
Supplemental Material
Ann
u. R
ev. F
inan
c. E
con.
201
2.4:
255-
296.
Dow
nloa
ded
from
ww
w.a
nnua
lrev
iew
s.or
g A
cces
s pr
ovid
ed b
y M
assa
chus
etts
Ins
titut
e of
Tec
hnol
ogy
(MIT
) on
06/
19/1
7. F
or p
erso
nal u
se o
nly.

of each measurement methodology, identification of the necessary data inputs, source
code, and formal taxonomies for keyword tagging to facilitate efficient online indexing,
searching, and filtering.
Although the individual models and methods we review were not created with any
classification scheme in mind, certain commonalities across these analytics allow us to
cluster the techniques into clearly defined categories, e.g., based on the types of inputs
required, analysis performed, and outputs produced. Therefore, we devote a significant
amount of attention in this review to organizing systemic risk analytics into several
taxonomies that will allow specific audiences such as policymakers, data- and information-
technology staff, and researchers to identify quickly those analytics that are most rele-
vant to their unique concerns and interests.
However, the classifications we propose in this review are necessarily approximate.
Each risk measure should be judged on its own merits, including the data required and
available, the sensitivities of the model, and its general suitability for capturing a particular
aspect of financial stability. Because our goal for each taxonomy is to assist users in their
search for a particular risk measure, creating a single, all-inclusive classification scheme is
neither possible nor desirable. Several papers we survey are internally diverse, defying
unique categorization. Moreover, the boundaries of the discipline are fuzzy in many places
and expanding everywhere. An organizational scheme that is adequate today is sure to
become obsolete tomorrow. Not only will new approaches emerge over time, but innova-
tive ideas will reveal blind spots and inadequacies in the current schemas; hence, our
taxonomies must also evolve over time.
For our current purposes, the most important perspective is that of policymakers and
regulators given that they are the ones using systemic risk models day to day. Therefore, in
Section 2 we begin with a discussion of systemic risk analytics from the supervisory
perspective, in which we review the financial trends that motivate the need for greater
disclosure by systemically important financial institutions (SIFIs), then review how regula-
tors might make use of the data and analytics produced by the OFR, and finally propose a
different taxonomy focused on supervisory scope. In Section 3, we turn to the research
perspective and describe a broader analytical framework in which to compare and contrast
various systemic risk measures. This framework naturally suggests a different taxonomy,
one organized around methodology. We also include a discussion of nonstationarity, which
is particularly relevant for the rapidly changing financial industry. Although there are no
easy fixes to time-varying and state-dependent risk parameters, awareness is perhaps the
first line of defense against this problem. For completeness, we also provide a discussion of
various data issues in Section 4, which includes a summary of all the data required by the
systemic risk analytics covered in this survey, a review of the OFR’s ongoing effort to
standardize legal entity identifiers (LEIs), and a discussion of the trade-offs between trans-
parency and privacy and how recent advances in computer science may allow us to achieve
both simultaneously. We conclude in Section 5.
2. SUPERVISORY PERSPECTIVE
The Financial Crisis of 2007–2009 was a deeply painful episode for millions of people;
hence, there is significant interest in reducing the likelihood of similar events in the future.
The Dodd-Frank Act clearly acknowledges the need for fuller disclosure by SIFIs and has
endowed the OFR with the statutory authority (including subpoena power) to compel such
260 Bisias et al.
Ann
u. R
ev. F
inan
c. E
con.
201
2.4:
255-
296.
Dow
nloa
ded
from
ww
w.a
nnua
lrev
iew
s.or
g A
cces
s pr
ovid
ed b
y M
assa
chus
etts
Ins
titut
e of
Tec
hnol
ogy
(MIT
) on
06/
19/1
7. F
or p
erso
nal u
se o
nly.

entities to provide the necessary information. Nevertheless, it may be worthwhile to con-
sider the changes that have occurred in our financial system that justify significant new
disclosure requirements and macroprudential supervisory practices. Several interrelated
long-term trends in the financial services industry suggest that there is more to the story
than a capricious, one-off event—a black swan that will not recur for decades. These trends
include the gradual deregulation of markets and institutions, disintermediation away from
traditional depositories, and the ongoing phenomenon of financial innovation.
2.1. Trends in the Financial System
Innovation is endemic to financial markets, in large part because competition tends
to drive down profit margins on established products. A significant aspect of recent
innovation has been the broad-based movement of financial activity into new domains,
exemplified by the growth in mortgage securitization and shadow banking activities.
For example, Gorton & Metrick (2010) document the strong growth since the 1980s in
repo and money-fund assets, and Loutskina & Strahan (2009) demonstrate that the
widespread availability of securitization channels has improved liquidity in mortgage
markets, reducing the sensitivity of credit supply to the idiosyncratic financial conditions
of individual banks. Facilitating these institutional changes are underlying advances in
modeling portfolio credit risk, legal and technical developments to support electronic
mortgage registration, and the expansion of markets for credit derivatives. Another factor
is the burden of supervision and regulation, which falls more heavily on established insti-
tution types, such as traditional banks and broker-dealers, and relatively lightly on hedge
funds and private equity firms.
As innovation and alternative investments become more significant, the complexity of
the financial system grows in tandem—and size matters. In many cases, financial innova-
tion has effectively coincided with deregulation, as new activities have tended to expand
most among less regulated, nontraditional institutions. For example, in the 1980s, the
hedge-fund industry was well established but small enough that its activities had little
effect on the rest of the system. By the late 1990s, hedge-fund assets and activities had
become so intertwined with global fixed-income markets that the demise of a single hedge
fund—Long-Term Capital Management (LTCM)—was deemed potentially so disruptive to
financial stability that the Federal Reserve Bank of New York felt compelled to broker a
bailout. Securitization is particularly important in this context: It effectively disinter-
mediates and deregulates simultaneously by moving assets off the balance sheets of
highly regulated, traditional depositories and into less regulated, special purpose vehicles.
Adrian & Shin (2009) connect the growth in shadow banking to securitization, arguing
that the latter has enabled increases in leverage by reducing idiosyncratic credit risk at
originating institutions. As securitization activity expanded, the balance sheets of securities
firms such as Lehman Brothers ballooned, potentially increasing the fragility of the system
as a whole. Adrian & Shin (2009) demonstrate the procyclicality of this (de-)leveraging
effect through the recent boom and crisis. The collapse in the asset-backed securitization
market that followed the crisis was, in effect, a reintermediation, and reregulation has
emerged in the form of the Dodd-Frank Act in the United States and similar legislation
in the United Kingdom and the European Union. Even innovation has taken a holiday,
with structured products falling out of favor and investors moving closer to cash and
its equivalents.
www.annualreviews.org � Systemic Risk Analytics 261
Ann
u. R
ev. F
inan
c. E
con.
201
2.4:
255-
296.
Dow
nloa
ded
from
ww
w.a
nnua
lrev
iew
s.or
g A
cces
s pr
ovid
ed b
y M
assa
chus
etts
Ins
titut
e of
Tec
hnol
ogy
(MIT
) on
06/
19/1
7. F
or p
erso
nal u
se o
nly.

Over the longer term, however, broader trends have also involved disintermediation.
Feldman & Lueck (2007) update an earlier study of long-term structural trends in financial
markets by Boyd & Gertler (1994), and using adjusted flow-of-funds data, they show that
banks have employed a variety of techniques, including securitization, to recover market
share lost in the 1980s and 1990s. However, their statistics also show dramatic growth in
market share for “other financial intermediaries,” which increases from less than 10% in
1980 to roughly 45% in 2005 (see Feldman & Lueck 2007, figure 3). Even this is a gross
underestimate because the term “other financial intermediaries” does not include the
hedge-fund industry. Accompanying this broader trend of disintermediation is the secular
growth in the finance and insurance industries as a share of the US and global economies.
There is considerable anecdotal evidence for this growth in recent years—in numbers,
assets, employees, and diversity—and more objective measures, such as per capita value-
added and salary levels, confirm this informal impression. Total employment of the finance
and insurance sectors has continued to rise, even in recent decades as the spread of
automation has eliminated many back-office jobs. This pattern is part of a larger trend in
the US economy where, according to nominal US GDP data from 1947 to 2009, service
industries have become an increasingly larger proportion of the US economy than goods-
producing industries. The finance and insurance sectors have grown almost monotonically
during that period, in contrast to many other goods-producing sectors such as manufactur-
ing. One implication of these trends is that the repercussions of sector-wide shocks to the
financial system are likely to be larger now than in the past.
Closely related to the growth of the financial sector is the intensity of activity in that
sector. This is partly the result of innovations in telecommunications and computer tech-
nology and partly due to financial innovations that encourage rapid portfolio rebalancing,
such as dynamic hedging, portfolio insurance, and tracking indexes.4 Whether measured
by trading volume, number of transactions, the total assets deployed, or the speed with which
transactions are consummated, the pace of financial activity has increased dramatically, even
over the past decade. Improvements in computation, connectivity, trading, social and finan-
cial networking, and globalization have facilitated ever faster and more complex portfolio
strategies and investment policies. The colocation of high-frequency trading algorithms at
securities exchanges is perhaps the most extreme example, but the paperwork crisis of the
late 1960s was an early indication of this trend. The implication for regulatory supervision is
that the relatively leisurely pace of quarterly financial reporting and annual examinations is
becoming increasingly inadequate. Moreover, legacy supervisory accounting systems some-
times fail to convey adequately the risk exposures from new, complex contingent contracts
and from lightly regulated markets with little or no reporting requirements. In fact, super-
visors do not even have consistent and regularly updated data on some of the most basic
facts about the industry, such as the relative sizes of all significant market segments.
A related concern is whether the systemic consequences of shocks to these sectors might
be more or less severe than among the more traditional institutional segments. This is
4Even the simplest measure, such as the average daily trading volume in the S&P 500 index, exhibits an increase of
three orders of magnitude over the past half century, from 3 million shares in 1960 to just over 4 billion shares as of
September 1, 2011. The growth in equity market trading is only a lower bound for the growth in total financial-
market activity. It does not include the explosive growth in the many exchange-traded and over-the-counter (OTC)
derivatives since the 1970s, including the introduction of S&P 500 index futures contracts. It also ignores the broad
expansion of securitization techniques, which have converted large swaths of previously illiquid loan contracts into
bonds that trade actively in secondary markets.
262 Bisias et al.
Ann
u. R
ev. F
inan
c. E
con.
201
2.4:
255-
296.
Dow
nloa
ded
from
ww
w.a
nnua
lrev
iew
s.or
g A
cces
s pr
ovid
ed b
y M
assa
chus
etts
Ins
titut
e of
Tec
hnol
ogy
(MIT
) on
06/
19/1
7. F
or p
erso
nal u
se o
nly.

largely an open question because so little is known about systemic exposures in the shadow
banking sector. Feldman & Lueck (2007, pp. 48–49) conclude with a plea for more
detailed information, given that “good policy on banking requires a solid sense of banks’
market share.” In a world of interconnected and leveraged institutions, shocks can propa-
gate rapidly throughout the financial network, creating a self-reinforcing dynamic of
forced liquidations and downward pressure on prices.
Lack of transparency also hampers the ability of firms to protect themselves. Market
participants may know their own counterparties, but no individual firm can peer more
deeply into the counterparty network to see all of the interconnections through which it
can be affected. Two familiar examples illustrate this more general problem. Participants
who had purchased credit default swap (CDS) protection from AIG Financial Products
(AIGFP) were unknowingly exposed to wrong-way risk because they could not see the full
extent of AIG’s guarantee exposures to others, and Lehman Brothers disguised the full
extent of its leverage from other participants via its Repo 105 transactions. Because
trading firms must maintain secrecy around their portfolio exposures to remain profit-
able, the opaqueness of the financial network will never resolve itself solely through
market mechanisms.
2.2. Policy Applications
Having made the case for additional disclosure by SIFIs, a natural response by industry
stakeholders is to ask how such disclosure and systemic risk analytics should be used
and why the financial industry should be a willing participant. Although the details of
macroprudential and systemic risk policy decisions are beyond the scope of this review, a
few general observations about uses and abuses may be appropriate. Alexander (2010)
provides a useful perspective on this issue in his outline of four distinct policy applications
of systemic risk measures: (a) By identifying individual institutions posing outsized threats
to financial stability (i.e., SIFIs), metrics can help in targeting heightened supervisory
standards; (b) by identifying specific structural aspects of the financial system that are
particularly vulnerable, metrics can help policymakers identify where regulations need to
be changed; (c) by identifying potential shocks to the financial system posing outsized
threats to stability (e.g., asset price misalignments), metrics may help guide policy to
address those threats; and (d) by indicating that the potential for financial instability is
rising (i.e., providing early-warning signals), metrics can signal to policymakers a need to
tighten so-called macroprudential policies.
The benefits of systemic risk measures in an ex post forensic analysis of market perfor-
mance and behavior in the wake of systemic events should not be underestimated. Such
analyses are routinely performed in other industries such as transportation and may help
identify institutional weaknesses, regulatory lapses, and other shortcomings that lead to
much-needed reforms. (See Fielding, Lo & Yang 2011 for a detailed description of how the
National Transportation Safety Board has played a critical role in improving safety in the
transportation industry despite having no regulatory responsibility or authority.) In fact,
apart from the Inspector General’s occasional reports and presidential commissions, we
have not institutionalized regular and direct feedback loops between policymaking and its
outcomes in the financial sector. The ability to identify underperforming policies and
unintended consequences quickly and definitively is one of the most effective ways of
improving regulation, and measurement is the starting point.
www.annualreviews.org � Systemic Risk Analytics 263
Ann
u. R
ev. F
inan
c. E
con.
201
2.4:
255-
296.
Dow
nloa
ded
from
ww
w.a
nnua
lrev
iew
s.or
g A
cces
s pr
ovid
ed b
y M
assa
chus
etts
Ins
titut
e of
Tec
hnol
ogy
(MIT
) on
06/
19/1
7. F
or p
erso
nal u
se o
nly.

With respect to early-warning indicators of impending threats to financial stability,
three important caveats apply. First, reliable forecast power alone will not solve the super-
visory decision problem because there is no single pressure gauge that captures the full state
of an intricate, multifaceted financial system. There will always be noise and conflicting
signals, particularly during periods of financial distress. Moreover, given that many of the
metrics described here can be used with different time periods, firms, countries, asset classes,
market sectors, and portfolios, the curse of dimensionality applies. In a real decision envi-
ronment, analysts will need techniques for sifting through such conflicting signals.
Second, there is the problem of statistical regime shifts, which are particularly relevant
for systemic events. Adding model structure can improve conditional forecasts, especially
in a shifting environment, but even if we know the correct structural model—a heroic
assumption, particularly ex ante—obtaining a reliable statistical fit is a nontrivial matter.
Of course, in practice, we can never be sure about the underlying structure generating the
data. For example, in the run-up to the recent crisis, knowledgeable and credible experts
were found on both sides of the debate surrounding the over- or undervaluation of US
residential real estate.
Third, to the extent that the Lucas critique applies (see Section 2.3), early-warning indi-
cators may become less effective if individuals change their behavior in response to such sig-
nals. Apart from the question of whether such indicators are meant for regulators’ eyes only
or for the public, this possibility implies an ongoing need to evaluate the efficacy of exist-
ing risk analytics and to develop new analytics as old measures become obsolete and new
systemic threats emerge. This is one of the primary reasons for the establishment of the OFR.
As to why the financial industry should willingly participate in the OFR’s research
agenda, perhaps the most obvious and compelling reason is that all financial institutions
benefit from financial stability, and most institutions are hurt by its absence. For example,
the breakdown in stability and liquidity and the collapse of asset prices in the fall and
winter of 2008–2009 were enormous negative-sum events that imposed losses on most
participants. In the aftermath of this crisis, there is near unanimity that firm-level risk
management and supervision have limitations and that the fallacy of composition applies:
Patterns exist in market dynamics at the system level that are distinct from the simple
aggregation of the behavior of the individual participants. (See Danielsson & Shin 2003
for an evocative example of the fallacy of composition. This basic principle is reflected in
many of the measures here.)
Moreover, although all firms share the benefits of financial stability, market mecha-
nisms do not exist to force firms to internalize the full cost of threats to stability created by
their own activities. To address these externalities, systemic risk measures may be used to
provide more objective and equitable methods for calibrating a Pigouvian tax on individual
SIFIs, as proposed by Acharya & Richardson (2009), or the Basel Committee on Banking
Supervision’s (BCBS’s) (2011) capital surcharge on global systemically important banks
(G-SIBs). These proposals are controversial. The Clearing House Association (TCH) and
Institute of International Bankers (IIB)—trade associations of many of the world’s largest
commercial banks—responded that, “there are significant open questions regarding the
purported theoretical and policy foundations, as well as the appropriate calibration, for a
G-SIB surcharge” (TCH & IIB 2011, p. 3). As with any policy intervention, we should
always be prepared to address the possibility of unintended consequences.
Another reason firms are not always penalized for their risky behavior is the existence
of a safety net, created by government policy either explicitly (e.g., deposit insurance) or
264 Bisias et al.
Ann
u. R
ev. F
inan
c. E
con.
201
2.4:
255-
296.
Dow
nloa
ded
from
ww
w.a
nnua
lrev
iew
s.or
g A
cces
s pr
ovid
ed b
y M
assa
chus
etts
Ins
titut
e of
Tec
hnol
ogy
(MIT
) on
06/
19/1
7. F
or p
erso
nal u
se o
nly.

implicitly (e.g., too-big-to-fail policies). It has long been recognized that both deposit
insurance and the discount window can encourage banks to take risks that might endanger
their solvency.5 In hindsight, it is clear that, throughout the recent crisis, both regulators
and market participants failed to act in a timely fashion to curtail excessive leverage and
credit expansion.
It is tempting to attribute such supervisory forbearance to some form of regulatory
capture.6 However, forbearance might also be motivated by indecisiveness, which can be
exacerbated by limited information and penalties regulators may face for making mistakes.
Regulatory action in the face of unsafe or unsound practices typically involves formal
interruptions of ongoing business activities, e.g., via cease-and-desist orders or the closure
of an institution. Such decisions are not lightly made because they are fraught with uncer-
tainty and the stakes are high. Waiting for unequivocal evidence of trouble can allow losses
to accumulate, especially if the state of the institution is observed infrequently and mea-
sured with error, and managers and regulators are gambling on a significant reversal
(Benston & Kaufman 1997).
In fact, the loss function for supervisory mistakes is highly asymmetric between Type-I
(premature closure) and Type-II (forbearance) errors. Regulators expect to be punished,
e.g., reprimanded or sued, for acting too soon by closing a solvent firm. The opposite
mistake—waiting until after a firm defaults on its obligations—puts the regulator in the
role of cleaning up a mess created by others, but the perceived penalty is much smaller. At
any point in time, this asymmetry creates strong incentives for supervisors to wait one more
day, either for the arrival of unequivocal information to support a particular choice or for the
decision to become moot through the failure of the institution.7 In these circumstances,
improved techniques for measuring threats can significantly reduce the likelihood of pol-
icy mistakes.
Although economic incentives alone can create a bias toward forbearance, these ten-
dencies are likely to be exacerbated by well-known behavioral tendencies. Prompt corrective
action can avert large accumulated losses, but such prophylactic responses always introduce
the possibility of errors in supervisory decisions, with negative short- and long-term conse-
quences to the regulator. Hardwired behavioral responses to double down and become
more risk tolerant when faced with sure losses only make matters worse in these situations.
5Acharya & Richardson (2009) discuss the general role of government mispricing of risk in encouraging risky
behavior, and the papers in Lucas (2010) propose better pricing models for government guarantees. For a recent
analysis of the moral hazard inherent in deposit insurance, see Demirguc-Kunt, Kane & Laeven (2008). On the
historical understanding of the moral hazard issues at the time of the Federal Deposit Insurance Corporation’s
(FDIC’s) creation, see Flood (1992). Regarding the moral hazard inherent in the lender-of-last-resort function, see
Rochet & Vives (2004). For an analysis of the historical understanding, see Bordo (1990) or Bignon, Flandreau &
Ugolini (2009).
6There is an extensive literature on forbearance and regulatory capture, well beyond the scope of this review.
For examples dating from the aftermath of the 1980s S&L crisis, see Kane (1989) and Boot & Thakor (1993).
Two recent studies consider these arguments in the context of the recent crisis: Huizinga & Laeven (2010) and
Brown & Din (2011).
7In the words of Shakespeare’s Hamlet (Act III, Scene 1), “Thus conscience does make cowards of us all.” Boot &
Thakor (1993) present a similar argument in the context of a detailed model, in which regulators act to preserve their
valued reputations, which would be damaged by the revelation of a premature closure. The result is a pooling
equilibrium in which the asymmetric reputational costs of a premature closure versus forbearance lead all regulators
to mimic each other’s closure policies. However, their model allows no possibility for regulators to improve their
monitoring technology. Incentives are also supported in the model by a second period after the close/wait decision
that allows bankers to gamble for resurrection.
www.annualreviews.org � Systemic Risk Analytics 265
Ann
u. R
ev. F
inan
c. E
con.
201
2.4:
255-
296.
Dow
nloa
ded
from
ww
w.a
nnua
lrev
iew
s.or
g A
cces
s pr
ovid
ed b
y M
assa
chus
etts
Ins
titut
e of
Tec
hnol
ogy
(MIT
) on
06/
19/1
7. F
or p
erso
nal u
se o
nly.
[See Kahneman & Tversky (1979) for the loss aversion phenomenon, and Lo (2011, sec-
tion 5) for a discussion of its relevance for risk managers, policymakers, and rogue traders.]
More generally, accurate systemic risk metrics can foster better ex post accountability
for regulators: If they knew, or should have known, of systemic dangers ex ante, but
failed to act, systemic risk metrics can provide the basis for remedial action. However, once
again, there may be an unintended consequence in that silence from an informed regu-
lator might be construed as tacit consent. Therefore, systemic risk monitoring must be
structured so as not to absolve market participants of responsibility for managing their
own risks.
2.3. The Lucas Critique and Systemic Risk Supervision
No policy discussion would be complete without addressing the potential impact of feed-
back effects on human behavior and expectations, i.e., the Lucas (1976, p. 41) critique,
that “any change in policy will systematically alter the structure of econometric models.”
Of course, we have little to add to the enormous literature in macroeconomics on this
topic and refer readers instead to the excellent recent essay by Kocherlakota (2010) in
which he reviews this important idea and its influence on modern macroeconomics and
monetary policy.
As a starting point, we presume that the Lucas critique applies to systemic risk supervi-
sion. Measurement inevitably plays a central role in regulatory oversight and in influencing
expectations. Imagine conducting monetary policy without some measure of inflation,
GDP growth, and the natural rate of unemployment. Given that systemic risk monitoring
will provoke institutional and behavioral reactions, the relevant questions revolve around
the nature and magnitude of the impact. The first observation to be made about the Lucas
critique is that it has little bearing on the importance of accurate metrics for systemic risk.
By yielding more accurate inputs to policy decisions, these measures should have important
first-order benefits for systemic stability, regardless of whether and how fully individual
and institutional expectations might discount the impact of such policies.
The second observation regarding the Lucas critique is related to the fact that many of
the analytics contained in this survey are partial-equilibrium measures. Therefore, by
definition they are subject to the Lucas critique to the extent that they do not incorporate
general-equilibrium effects arising from their becoming more widely used by policymakers.
The same can be said for enterprise-wide risk management measures—once portfolio
managers and chief risk officers are aware of the risks in their portfolios and organizations,
they may revise their investment policies, changing the overall level of risk in the financial
system. This may not be an undesirable outcome. After all, one of the main purposes of
early-warning signals is to encourage individuals to take action themselves instead of
relying solely on government intervention. However, this thought experiment does not
necessarily correspond to a dynamic general-equilibrium process, but rather may involve
a phase transition from one equilibrium to another, where the disequilibrium dynamics
take weeks, months, or years, depending on the frictions in the system. The Lucas critique
implies that the general-equilibrium implications of systemic risk policies must be studied,
which is hardly controversial. Nevertheless, partial-equilibrium measures may still serve a
useful purpose in addressing short-term dynamics, especially in the presence of market
imperfections such as transactions costs, nontraded assets, incomplete markets, asymmet-
ric information, externalities, and limited human cognitive abilities.
266 Bisias et al.
Ann
u. R
ev. F
inan
c. E
con.
201
2.4:
255-
296.
Dow
nloa
ded
from
ww
w.a
nnua
lrev
iew
s.or
g A
cces
s pr
ovid
ed b
y M
assa
chus
etts
Ins
titut
e of
Tec
hnol
ogy
(MIT
) on
06/
19/1
7. F
or p
erso
nal u
se o
nly.

Finally, rational expectations is a powerful idea for deducing the economic implications
of market dynamics in the limiting case of agents with infinite and instantaneous cognitive
resources. However, recent research in the cognitive neurosciences and in the emerging
field of neuroeconomics suggests that this limiting case is contradicted by empirical, exper-
imental, and evolutionary evidence. This is not particularly surprising in and of itself, but
the more informative insights of this literature have to do with the specific neural mecha-
nisms that are involved in expectations, rational and otherwise.8 This literature implies
that rational expectations may be only one of many possible modes of economic inter-
actions between Homo sapiens, and the failure of dynamic stochastic general-equilibrium
models to identify the recent financial crisis seems to support this conclusion.
For these reasons, we believe the Lucas critique does not vitiate the need for measures of
systemic risk; on the contrary, it buttresses the decision to create the OFR as a research-
centric institution. We are still in the earliest days of understanding the elusive and multi-
faceted concept of systemic risk, and that markets and individuals adapt and evolve in
response to systemic measurement only reinforces the need for ongoing research.
2.4. Supervisory Taxonomy
A second taxonomy for the analytics reviewed in this survey is along the lines of supervisory
scope, which is of particular interest to policymakers. Institutionally, individual regulators’
responsibilities and activities are typically segregated by industry subsector. The jurisdic-
tional boundaries that separate the regulatory purview of the individual agencies provide
clarity for regulated entities and allow supervisors to develop focused expertise in particular
areas of the financial system. A given systemic risk metric may be more or less relevant for a
particular regulator depending on the regulator’s supervisory jurisdiction. Because it is likely
that a given crisis will be triggered by events at a specific institution with a clearly identified
primary regulator, e.g., LTCM or Lehman, having metrics that are tailored to specific
institutional types and business models may help pinpoint dangers in those institutions and
sound the alarm for the relevant regulator. For example, measures of equity market liquidity
will likely interest the securities market supervisors more than housing regulators.
However, by definition, threats to financial stability involve many institutions simulta-
neously and typically affect the system as a whole. Among others, Brunnermeier et al. (2009,
pp. 6–10) emphasize the distinction between microprudential regulation (especially the
capital-focused Basel system) and macroprudential regulation. The former is focused on
prudential controls at the firm level, whereas the latter considers the system as a whole (see
also Hanson, Kashyap & Stein 2011 and Bank of England 2009). Although the impact of
systemic events is a macroprudential concern, particular metrics of threats to financial stability
may by applicable at either a microprudential or a macroprudential level (or sometimes both).
To this end, grouping systemic risk analytics by supervisory scope will yield two
broad categories, microprudential and macroprudential analytics, and within the former
category, we can further categorize them by institutional focus: securities and commodities,
banking and housing, insurance and pensions, and general applications. This new taxonomy
is summarized in Table 2, and we describe each of these categories in more detail below.
8For example, Lo (2011) provides a review of the most relevant research in the cognitive neurosciences for financial
crises, in which recent studies have shown that the regions of the brain responsible for mathematical reasoning and
logical deduction are forced to shut down in the face of strong emotional stimuli.
www.annualreviews.org � Systemic Risk Analytics 267
Ann
u. R
ev. F
inan
c. E
con.
201
2.4:
255-
296.
Dow
nloa
ded
from
ww
w.a
nnua
lrev
iew
s.or
g A
cces
s pr
ovid
ed b
y M
assa
chus
etts
Ins
titut
e of
Tec
hnol
ogy
(MIT
) on
06/
19/1
7. F
or p
erso
nal u
se o
nly.
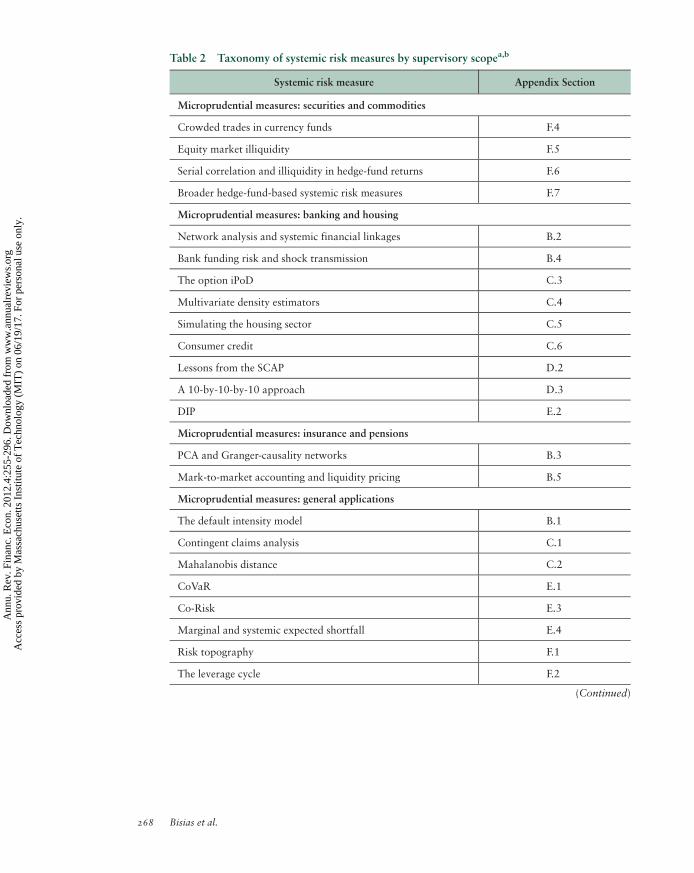
Table 2 Taxonomy of systemic risk measures by supervisory scopea,b
Systemic risk measure Appendix Section
Microprudential measures: securities and commodities
Crowded trades in currency funds F.4
Equity market illiquidity F.5
Serial correlation and illiquidity in hedge-fund returns F.6
Broader hedge-fund-based systemic risk measures F.7
Microprudential measures: banking and housing
Network analysis and systemic financial linkages B.2
Bank funding risk and shock transmission B.4
The option iPoD C.3
Multivariate density estimators C.4
Simulating the housing sector C.5
Consumer credit C.6
Lessons from the SCAP D.2
A 10-by-10-by-10 approach D.3
DIP E.2
Microprudential measures: insurance and pensions
PCA and Granger-causality networks B.3
Mark-to-market accounting and liquidity pricing B.5
Microprudential measures: general applications
The default intensity model B.1
Contingent claims analysis C.1
Mahalanobis distance C.2
CoVaR E.1
Co-Risk E.3
Marginal and systemic expected shortfall E.4
Risk topography F.1
The leverage cycle F.2
(Continued)
268 Bisias et al.
Ann
u. R
ev. F
inan
c. E
con.
201
2.4:
255-
296.
Dow
nloa
ded
from
ww
w.a
nnua
lrev
iew
s.or
g A
cces
s pr
ovid
ed b
y M
assa
chus
etts
Ins
titut
e of
Tec
hnol
ogy
(MIT
) on
06/
19/1
7. F
or p
erso
nal u
se o
nly.

2.4.1. Microprudential measures: securities and commodities. Securities and commodities
market regulators have jurisdiction over a broad range of secondary market and inter-
institution trading. For example, the US Securities and Exchange Commission (SEC) and
Commodities Futures Trading Commission (CFTC) together regulate a range of markets,
including equities, commodities, and currencies, along with the securities firms active in
those markets such as investment managers, mutual funds, broker/dealers, and, post-Dodd-
Frank, hedge funds. Similar supervisors exist in other countries, although the details of
regulatory authority naturally vary across geopolitical boundaries. Several of the measures
of fragility surveyed here focus on this market segment. Pojarliev & Levich (2011) look for
patterns of coordinated behavior, i.e., crowded trades, in high-frequency trading data for
currency funds. Khandani & Lo (2011) consider two distinct measures of liquidity in
equity markets. Getmansky, Lo & Makarov (2004) and Chan et al. (2006a,b) also focus
on liquidity, in this case for hedge funds, where serial correlation in reported returns can
appear as an artifact of reporting conventions in illiquid markets.
2.4.2. Microprudential measures: banking and housing. Depository institutions form the
core constituency for the cluster of banking regulators, including central banks, deposit
insurers, and bank chartering agencies. Residential mortgage originators, such as thrifts,
building and loan societies, and mortgage banks, also fall into this grouping, along with
housing government-sponsored enterprises such as Fannie Mae, Freddie Mac, and the
Federal Home Loan banks in the United States. Within this class, Fender & McGuire
(2010a) look for binding funding constraints in aggregate balance sheet data for inter-
national banking groups. Merton & Bodie (1993) focus on the corporate financing,
especially leverage, of insured depositories. Khandani, Kim & Lo (2010) consider aggre-
gate patterns in consumer lending via credit-risk forecasts estimated from detailed
credit-card data. Huang, Zhou & Zhu (2009) calculate a hypothetical insurance pre-
mium based on firms’ equity prices and CDS spreads and they apply this to a sample
of banks. Khandani, Lo & Merton (2012) examine coordinated increases in home-
owner leverage, due to a one-way ratchet effect in refinancing behavior. Capuano (2008)
Table 2 (Continued)
Systemic risk measure Appendix Section
Macroprudential measures
Costly asset price boom/bust cycles A.1
Property-price, equity-price, and credit-gap indicators A.2
Macroprudential regulation A.3
Principal components analysis C.7
GDP stress tests D.1
Noise as information for illiquidity F.3
aAbbreviations: CoVaR: conditional value at risk; DIP: distressed insurance premium; iPoD: implied probability of
default; SCAP: Supervisory Capital Assessment Program.bSee Supplemental Appendixes A–F; follow the Supplemental Materials link in the online version of this article or at
http://www.annualreviews.org.
www.annualreviews.org � Systemic Risk Analytics 269
Supplemental Material
Ann
u. R
ev. F
inan
c. E
con.
201
2.4:
255-
296.
Dow
nloa
ded
from
ww
w.a
nnua
lrev
iew
s.or
g A
cces
s pr
ovid
ed b
y M
assa
chus
etts
Ins
titut
e of
Tec
hnol
ogy
(MIT
) on
06/
19/1
7. F
or p
erso
nal u
se o
nly.

and Segoviano & Goodhart (2009) use techniques from information theory to extract
implied probabilities of default (iPoD) from equity and equity option prices, applying this
technique to samples of commercial and investment banks. Espinosa-Vega & Sole (2010)
and Duffie (2011) construct financial network models and take banking firms as the
primary sample of interest.
2.4.3. Microprudential measures: insurance and pensions. Pension and insurance regula-
tors, such as the European Insurance and Occupational Pensions Authority (EIOPA) in
Europe and the Pension Benefit Guaranty Corporation (PBGC) and state insurance
departments in the United States, are the focus of the third microprudential category in
our taxonomy. Relatively few of the studies in our sample deal directly with pension
funds or insurance companies, despite the fact that the recent crisis actively involved
these institutions. An exception is Billio et al. (2012), who include insurance as one of
four industry sectors in a latent factor model used to identify patterns of risk concentra-
tion and causation. An insurance-company subsidiary, AIGFP, played a prominent role
in the recent crisis as a seller of credit protection on subprime mortgage securitizations,
and pension funds were among the buyers of this credit protection.9 The lack of easily
accessible data in these industries is a significant factor: Pension-fund and insurance-
company portfolio holdings are not widely available, unlike equity and bond market
benchmark indexes that would broadly track their performance. Sapra (2008) considers
issues arising from historical and mark-to-market accounting for both insurance com-
panies and banks.
2.4.4. Microprudential measures: general applications. Accounting and market price data
for large financial firms are widely available, and several fragility measures based on stock-
market data could be applied to any or all of the microprudential categories just listed.
As with Merton & Bodie (1993), Geanakoplos (2010) similarly focuses on institutional
leverage, but he envisions a much broader scope of applicability than just banks. Gray &
Jobst (2010) use CDS spreads in a contingent claims analysis of financial firm risk.
Adrian & Brunnermeier’s (2010) conditional value at risk (CoVaR) and the IMF’s (2009)
related Co-Risk models of shared exposures similarly rely on firm-level market prices.10
The Mahalonobis distance metric of Kritzman& Li (2010) is a statistical model that could,
in principle, be applied to any time series.
2.4.5. Macroprudential measures. Although the boundaries that support efficient insti-
tutional specialization among regulators serve many practical purposes, they some-
times create the jurisdictional gaps within which risky activities are most likely to go
undetected. These gaps are covered by macroprudential regulation, which is, of course,
9AIGFP is an example of a firm that does not fit neatly into the microprudential regulatory framework. Although it
was an insurance-company subsidiary, it was supervised by a domestic housing regulator, the Office of Thrift
Supervision, without deep expertise in the credit derivatives that were AIGFP’s specialty. Moreover, AIGFP was
headquartered in London, adding a geographic obstacle. Ashcraft & Schuermann (2008) describe subprime securi-
tizations with the example of a pension-fund investor.
10The default intensity model of Giesecke & Kim (2011), the distressed insurance premium (DIP) of Huang,
Zhou & Zhu (2009), and the systemic expected shortfall (SES) of Acharya et al. (2010) also satisfy this
general description.
270 Bisias et al.
Ann
u. R
ev. F
inan
c. E
con.
201
2.4:
255-
296.
Dow
nloa
ded
from
ww
w.a
nnua
lrev
iew
s.or
g A
cces
s pr
ovid
ed b
y M
assa
chus
etts
Ins
titut
e of
Tec
hnol
ogy
(MIT
) on
06/
19/1
7. F
or p
erso
nal u
se o
nly.

not new.11 Two of the oldest elements of the US regulatory safety net are motivated
by macroprudential concerns. The discount window, which provides emergency liquidity
support to innocent bystander banks in a systemic crisis, was created with the found-
ing of the Federal Reserve in 1913. Deposit insurance—created at the federal level
in 1933 with the FDIC—discourages bank runs and provides orderly resolution of
failing depositories.
However, it has been almost 80 years since the creation of the FDIC and nearly a
century since the founding of the Fed, and the intervening decades have witnessed a steady
disintermediation from traditional depository institutions. Recent decades have shown
strong growth in direct capital-market access by large borrowers, derivatives markets,
managed investment portfolios (including mutual funds, exchange-traded funds, and
hedge funds), and various forms of collateralized borrowing (including asset-backed and
mortgage-backed securitization and repurchase agreements). As a result, when the crisis
struck in force in the fall of 2008, large segments of the financial system did not have
immediate access to orderly resolution (FDIC) or lender-of-last-resort (Fed) facilities.
Macro-level metrics tend to concentrate on aggregate imbalances. As a result, they are
frequently intended to serve as early-warning signals, tracking the buildup of unsustainable
tensions in the system. For the same reason, there is also a tendency to use macroeconomic
time series and official statistics in these measures. For example, Borio & Drehmann
(2009b) look for simultaneous imbalances in broad indicators of equity, property, and
credit markets. Alfaro & Drehmann (2009) examine the time series of GDP for signs of
weakening in advance of a crisis. Hu, Pan & Wang (2010) extract an indicator of market
illiquidity from the noise in Treasury prices. The absorption ratio of Kritzman et al. (2010)
measures the tendency of markets to move in unison, suggesting tight coupling. Alessi &
Detken (2009) track anomalous levels in macroeconomic time series as possible indicators
of boom/bust cycles.
2.5. Event-/Decision-Horizon Taxonomy
Decision-making is a critical activity for policymakers, who must choose whether,
when, and how to intervene in the markets. In this context, the informativeness of a
systemic risk metric over time—especially relative to a decision horizon or the onset
of a systemic event—is significant. Accordingly, we can classify risk analytics into three
temporal categories: pre-event, contemporaneous, and postevent analytics. There is
obvious benefit from measures that provide early warning of growing imbalances or
impending dangers; forewarned is often forearmed. However, even strictly contem-
poraneous signals of market turmoil can be useful in allocating staff and other super-
visory infrastructure during an emerging crisis; reaction time matters, particularly as
events are unfolding. And there is also a role for ex post analysis in maintaining account-
ability for regulators (see the discussion in Section 2 and in Borio 2010) and generating
forensic reports of systemic events. This event- and decision-horizon classification scheme
is summarized in Table 3.
11Clement (2010) traces the usage of the term “macroprudential” back to the 1970s, citing (p. 61) in particular a
Bank of England background paper from 1979: “This ‘macroprudential’ approach considers problems that bear
upon the market as a whole as distinct from an individual bank, and which may not be obvious at the micro-
prudential level.” Etymology aside, macroprudential supervision has a longer history.
www.annualreviews.org � Systemic Risk Analytics 271
Ann
u. R
ev. F
inan
c. E
con.
201
2.4:
255-
296.
Dow
nloa
ded
from
ww
w.a
nnua
lrev
iew
s.or
g A
cces
s pr
ovid
ed b
y M
assa
chus
etts
Ins
titut
e of
Tec
hnol
ogy
(MIT
) on
06/
19/1
7. F
or p
erso
nal u
se o
nly.

Table 3 Taxonomy of systemic risk measures by event-/decision-time horizona,b
Systemic risk measure Appendix Section
Ex ante measures: early warning
Costly asset price boom/bust cycles A.1
Property-price, equity-price, and credit-gap indicators A.2
The default intensity model B.1
Network analysis and systemic financial linkages B.2
Simulating the housing sector C.5
Consumer credit C.6
GDP stress tests D.1
DIP E.2
The leverage cycle F.2
Serial correlation and illiquidity in hedge-fund returns F.6
Broader hedge-fund-based systemic risk measures F.7
Ex ante measures: counterfactual simulation and stress tests
Lessons from the SCAP D.2
A 10-by-10-by-10 approach D.3
Marginal and systemic expected shortfall E.4
Contemporaneous measures: fragility
PCA and Granger-causality networks B.3
Contingent claims analysis C.1
The option iPoD C.3
Multivariate density estimators C.4
CoVaR E.1
Co-Risk E.3
Contemporaneous measures: crisis monitoring
Bank funding risk and shock transmission B.4
Mahalanobis distance C.2
Principal components analysis C.7
Noise as information for illiquidity F.3
(Continued)
272 Bisias et al.
Ann
u. R
ev. F
inan
c. E
con.
201
2.4:
255-
296.
Dow
nloa
ded
from
ww
w.a
nnua
lrev
iew
s.or
g A
cces
s pr
ovid
ed b
y M
assa
chus
etts
Ins
titut
e of
Tec
hnol
ogy
(MIT
) on
06/
19/1
7. F
or p
erso
nal u
se o
nly.

2.5.1. Ex ante measures: early warning. In an ideal world, systemic monitoring would
work like the National Weather Service, providing sufficiently advance notice of hurri-
canes for authorities and participants to intervene by prepositioning staff and resources,
minimizing exposures, and planning for the impending event and immediate aftermath.
This may be too much to hope for in the case of financial stability. Systemic shocks can
arrive from many directions, such as the sovereign default that triggered the LTCM crisis;
the algorithmic feedback loop of the May 6, 2010, Flash Crash; or the speculative attacks
that have repeatedly plagued small-country financial systems. Moreover, unlike hurricanes,
many significant threats involve active subterfuge and evasive behavior. For example,
institutions vulnerable to contagious runs, such as Lehman Brothers in the run-up to its
2008 collapse, have strong incentives to avoid revealing information that could trigger a
self-reinforcing attack.12 Therefore, tracking a multitude of threats will require a diversity
of monitoring techniques.
We define early-warning models as measures aspiring to a significant degree of forecast
power. Several of the macroprudential measures mentioned above are intended to identify
accumulating imbalances and thereby to have some forecast power for systemic events
while using an observation or update interval longer than daily or weekly. These include
Borio & Drehmann (2009b) and Alessi & Detken (2009), who use quarterly data, and
Alfaro & Drehmann (2009), whose model is updated only annually. Higher-frequency
measures with some potential forecast power include Khandani, Kim & Lo’s (2010) model
of consumer credit risk; the default intensity model of Giesecke & Kim (2011); Huang,
Zhou & Zhu’s (2009) DIP metric; the hedge-fund measures of Chan et al. (2006a,b); the
Table 3 (Continued)
Systemic risk measure Appendix Section
Contemporaneous measures: crisis monitoring
Crowded trades in currency funds F.4
Equity market illiquidity F.5
Ex post measures: forensic analysis
Macroprudential regulation A.3
Mark-to-market accounting and liquidity pricing B.5
Ex post measures: orderly resolution
Risk topography F.1
aAbbreviations: CoVaR: conditional value at risk; DIP: distressed insurance premium; iPoD: implied probability of
default; SCAP: Supervisory Capital Assessment Program.bSee Supplemental Appendixes A–F; follow the Supplemental Materials link in the online version of this article or at
http://www.annualreviews.org.
12Per the bankruptcy court report (Valukas 2010, p. 732), “Lehman employed off-balance-sheet devices, known
within Lehman as ‘Repo 105’ and ‘Repo 108’ transactions, to temporarily remove securities inventory from its
balance sheet, usually for a period of seven to ten days, and to create a materially misleading picture of the firm’s
financial condition in late 2007 and 2008.”
www.annualreviews.org � Systemic Risk Analytics 273
Supplemental Material
Ann
u. R
ev. F
inan
c. E
con.
201
2.4:
255-
296.
Dow
nloa
ded
from
ww
w.a
nnua
lrev
iew
s.or
g A
cces
s pr
ovid
ed b
y M
assa
chus
etts
Ins
titut
e of
Tec
hnol
ogy
(MIT
) on
06/
19/1
7. F
or p
erso
nal u
se o
nly.
mortgage-ratcheting model of Khandani, Lo & Merton (2012); the cross-funding network
analysis of Espinosa-Vega & Sole (2010); and Getmansky, Lo & Makarov’s (2004) model
of serial correlation and illiquidity in hedge-fund returns.
2.5.2. Ex ante measures: counterfactual simulation and stress tests. Predictive models
assign probabilities to possible future events, conditional on current and past observations
of the system. Another prospective approach to assessing the vulnerability of a system is to
examine its behavior under counterfactual conditions. Stress testing is codified in regula-
tion and international standards, including the Basel accord. It is applied, for example, in
the Federal Reserve’s (FRB 2009) Supervisory Capital Assessment Program (SCAP) study.
As a matter of both regulatory policy and traditional risk management, the process can be
viewed as a means to identify vulnerabilities in the portfolio—i.e., combinations of exter-
nal factor outcomes causing unacceptably large losses—and ways to defend against those
influences. A related approach is reverse stress testing, in which a portfolio outcome
(typically insolvency) is fixed, and a search is undertaken for scenarios that could provoke
this level of distress. A stress test typically either draws its scenarios from actual historical
stress episodes or hypothesizes them via expert opinion or other techniques. Breuer et al.
(2009), for example, emphasize three characteristics of well-designed stress scenarios—
plausibility, severity, and suggestiveness of risk-reducing action—and present an algorithm
for searching within a plausible subset of the space of external factor outcomes for the
scenario that generates the largest portfolio loss. Simultaneously targeting both severity
and plausibility introduces a natural tension, given that outlandish scenarios are likely to
have painful ramifications. As a policy matter, if the goal of the exercise is simply to
explore portfolio sensitivities (i.e., not to calibrate required capital or other regulatory
constraints), then this trade-off is less immediate.
Stress scenarios are frequently stated in terms of possible values for macroeconomic
fundamentals. A straightforward example is Alfaro & Drehmann (2009), who consider
the behavior of GDP around 43 post-1974 crises identified by the Reinhart & Rogoff
(2009) methodology. This is a high-level analysis that does not break out the detailed
composition of GDP or institutional portfolio holdings. Although GDP growth often
weakened ahead of banking crises, many banking crises are not preceded by weaken-
ing GDP, suggesting additional forces are at play, such as macroeconomic feedback
effects. Output drops substantially in nearly all the observed crises once stress emerges.
They next use a univariate autoregressive forecasting model of GDP growth in each
country and use its worst negative forecast error as a stress scenario to be compared with
the historical sample. In two-thirds of cases, the real crises were more severe than their
forecasts, suggesting that care should be taken in balancing the severity-versus-plausibility
trade-off.
Another policy application of stress testing is the identification of risky or vulner-
able institutions. The SCAP described by Hirtle, Schuermann & Stiroh (2009) also
applies macroeconomic scenarios—GDP growth, unemployment, and housing prices—
but is more sophisticated in several important respects. First, the SCAP was a regula-
tory exercise to determine capital adequacy of 19 large financial institutions in the
spring of 2009; the results had immediate implications for the calibration of required
capital. Second, the SCAP was applied to each participating institution individually,
assembling the macroprudential outcome from its microprudential parts. Third, the pro-
cess included a detailed bottom-up analysis of the risk profile of individual portfolios and
274 Bisias et al.
Ann
u. R
ev. F
inan
c. E
con.
201
2.4:
255-
296.
Dow
nloa
ded
from
ww
w.a
nnua
lrev
iew
s.or
g A
cces
s pr
ovid
ed b
y M
assa
chus
etts
Ins
titut
e of
Tec
hnol
ogy
(MIT
) on
06/
19/1
7. F
or p
erso
nal u
se o
nly.

positions, using the firms’ own data, models, and estimation techniques. This implies
mapping from scenarios defined in terms of macroeconomic variables to the concrete
inputs required by the analytics packages.
Duffie’s (2011) 10-by-10-by-10 policy proposal goes a step further. Here, a regulator
would analyze the exposures of N important institutions to M scenarios. For each stress
scenario, each institution would report its total gain or loss against its K largest counter-
party exposures for that scenario (as a rule of thumb, he suggests settingN¼M ¼ K¼ 10).
This would help clarify the joint exposure of the system to specific shocks and could
help identify additional important institutions via counterparty relationships to the
original set of N firms. He recommends considering severe but plausible stress scenarios
that are not covered by delta-based hedging and are conjectured to have potential
systemic importance. He offers the following examples, chosen to highlight broad-scope
scenarios that might include default of a large counterparty, a 4% shift in the yield curve
or credit spreads, a 25% shift in currency values or housing prices, or a 50% change in a
commodities or equity market index. As a caveat, note that many financial exposures are
hedged back to basis risk, which has nonlinear and nonmonotonic sensitivities to risk
factors, so that the magnitude of the shocks may not correlate simply with the severity of
losses for a particular firm. A shortcoming of a focus on a handful of “important” institu-
tions is the possibility of missing widely dispersed events, such as the US Savings and Loan
Crisis of the 1980s.
Systemic fragility metrics supporting stress testing include Acharya et al.’s (2010) SES
measure and Duffie’s (2011) 10-by-10-by-10 model. Espinosa-Vega & Sole (2010) simu-
late their model because of the lack of firm-level data.
2.5.3. Contemporaneous measures: fragility. Measuring financial fragility is not simply a
matter of obtaining advance warning of impending dangers; crisis response is an important
role for policymakers charged with systemic risk monitoring. Supervisory responsibilities
intensify when a systemic event occurs. These tasks include ongoing monitoring of the state
of the system; identification of fragile or failing institutions, markets, or sectors; the
development and implementation of regulatory interventions; and clear and regular com-
munication with the media and the public. All this will likely need to occur within com-
pressed time frames.
Forecasting measures that are updated on a daily or intradaily basis can be valuable as
real-time signals of fragility in an emerging crisis. For example, they may clarify the
possible ramifications and side effects of various interventions. Several models we consider
can be updated frequently, including the contingent claims analysis of Gray & Jobst (2010),
Adrian & Brunnermeier’s (2010) CoVaR model, Adrian & Brunnermeier’s (2010) and
Chan-Lau et al.’s (2009) related Co-Risk measures, the SES measure of Acharya et al.
(2010), and the iPoD measures of Capuano (2008) and Segoviano & Goodhart (2009).
2.5.4. Contemporaneous measures: crisis monitoring. Regardless of their forecast power,
some measures may still be useful in tracking a crisis as it unfolds, in the allocation of staff
and other resources, and in the crafting of policy responses. These include the liquidity
measures of Khandani & Lo (2011) and Hu, Pan & Wang (2010); the Mahalanobis
distance metric of Kritzman & Li (2010); and the absorption ratio of Kritzman et al.
(2010). In addition, several models cited above as short-horizon forecasting or fragility
measures might also be deployed as contemporaneous monitoring tools; these include
www.annualreviews.org � Systemic Risk Analytics 275
Ann
u. R
ev. F
inan
c. E
con.
201
2.4:
255-
296.
Dow
nloa
ded
from
ww
w.a
nnua
lrev
iew
s.or
g A
cces
s pr
ovid
ed b
y M
assa
chus
etts
Ins
titut
e of
Tec
hnol
ogy
(MIT
) on
06/
19/1
7. F
or p
erso
nal u
se o
nly.
Adrian & Brunnermeier (2010), IMF (2009), Segoviano & Goodhart (2009), Capuano
(2008), and Duffie (2011).
2.5.5. Ex post measures: forensic analysis. For policy purposes, measurement of the sys-
tem continues to occur even after a systemic event or regulatory intervention. Publication
of flash reports in the immediate aftermath (i.e., within hours or days) can help inform and
coordinate the responses of other regulators and market participants. Such immediate trans-
parency may have special significance in situations where panic or herd behavior is a factor. For
example, the CFTC and SEC (CFTC/SEC 2010) published a detailed analysis of the May 6,
2010, Flash Crash on September 30, 2010, which largely resolved the fear and uncertainty
created by the unusual events surrounding that market dislocation. Imagine the market reac-
tion if the report had been a halfhearted effort with inconsistent and inconclusive findings.
Understanding what went wrong can help in the redesign of market and regulatory
practices and institutions. Borio (2010) emphasizes the critical role that measurement plays
in maintaining accountability. Regulation is a repeated game, and monitoring performance
can help enforce diligent behavior. In some cases, civil and/or criminal legal remedies may
require thorough and unbiased explication of the sequence of events. Any of the models
described above as tools for ex ante or contemporaneous analysis would have value as tools
for ex post analysis. For example, Khandani, Lo & Merton (2012) use their risk-ratcheting
methodology in a historical analysis of the housing market; Getmansky, Lo & Makarov
(2004) offer an ex post analysis of serial correlation and illiquidity in hedge-fund returns.
2.5.6. Ex post measures: orderly resolution. Systemic risk analytics also have a role to
play in the orderly resolution of failed institutions. This is particularly true of network
models, such as Duffie (2011) or Brunnermeier, Gorton & Krishnamurthy (2010), where a
detailed understanding of the web of contractual connections can assist in the unwinding
of a complex portfolio.
3. RESEARCH PERSPECTIVE
In contrast to the supervisory perspective of Section 2 that involves practical challenges of
implementation and policy issues, the research perspective is focused primarily on theoretical
underpinnings and econometric methods. We define researchers as those skilled in developing
and applying analytical techniques to economic and financial questions. As a result, the
researcher’s taxonomy of the systemic risk analytics surveyed in this review is quite different
from those in Tables 1–3. However, before describing this new taxonomy in more detail, we
first propose in Section 3.1 a simple conceptual framework for organizing our measures of
systemic risk and raise the important econometric issue of nonstationarity in Section 3.2,
which is particularly relevant to systemic risk measurement. In Section 3.3, we provide a brief
discussion of other research directions that are not included in this survey but that may prove
useful and bear further investigation. We then present the research taxonomy in Section 3.4.
3.1. Conceptual Framework and Econometric Issues
Denote by Rt the vector of asset returns of all systemically relevant entities and/or securities
at date t, and let Xt denote the vector of state variables that capture the date-t economic
and business conditions. If we define Et to be a 0/1 indicator variable indicating the
276 Bisias et al.
Ann
u. R
ev. F
inan
c. E
con.
201
2.4:
255-
296.
Dow
nloa
ded
from
ww
w.a
nnua
lrev
iew
s.or
g A
cces
s pr
ovid
ed b
y M
assa
chus
etts
Ins
titut
e of
Tec
hnol
ogy
(MIT
) on
06/
19/1
7. F
or p
erso
nal u
se o
nly.

occurrence of a systemic event at date t, then the objective of any systemic risk measure is
to shed light on one or more of the following three probability distributions:
Prob (Et jRt�1,Xt�1,Rt�2,Xt�2, . . .) � Pre-Event Distribution ð1Þ
Prob (Rt,Xt,jEt�1) � Post-Event Distribution ð2Þ
Prob (Rt,Xt,Et) � Contemporaneous Distribution: ð3ÞThe first distribution is the most relevant from the regulatory perspective: What can
we say about the likelihood of a future systemic event given current and past conditions?
The second is critical for determining the appropriate responses to systemic shocks. And the
third is relevant for evaluating and refining our understanding of what a systemic event is.13
At this level of generality, probability distributions (1)–(3) are nearly vacuous, but they
do serve the useful purpose of motivating the need for additional structure—theoretical
and econometric specifications and constraints—to narrow the parameter space of these
highly nonlinear, high-dimensional, multivariate distributions. In particular, we must first
identify the relevant institutions and securities to study (Rt), narrow our field of vision to
a specific set of state variables (Xt) that are relevant to the particular notion of systemic
risk we wish to capture (Et), decide on the appropriate time horizon and sampling fre-
quency for these variables, and then formulate a suitable parameterization of the appro-
priate probability distribution in (1)–(3)—presumably guided by theory and practice—that
is amenable to parameter estimation and statistical inference.
When described in this formulaic way, it becomes obvious that we are unlikely to ever
develop a single measure of systemic risk; the dimensionality and complexity of (1)–(3) imply
that multiple measures must be used to piece together a coherent, albeit incomplete, view of
possible threats to financial stability. For example, if we specify the returns of publicly traded
financial institutions for Rt, and define a systemic event as simultaneous losses among multiple
financial institutions, then Adrian& Brunnermeier’s (2010) CoVaR, the IMF’s (2009) Co-Risk,
and Acharya et al.’s (2010) SES measures are the result. However, if our focus is on the
network topology of the asset returns of the financial system, then the Granger-causality
network measure of Billio et al. (2012) and the absorption ratio of Kritzman et al. (2010)
are more relevant. By narrowing the set of possible free parameters for the distributions in
(1)–(3), we can infer more precise information regarding specific aspects of systemic risk.
3.2. Nonstationarity
Even after doing the hard work of narrowing down the parameter space in (1)–(3) to yield
a tractable specification that can be estimated, there is still the remaining question of how
13We note two key assumptions implicit in this framework. First, given that the expectations and conditioning
revolve around past asset returns, we implicitly restrict attention away from data and methodologies that are not
traditional financial econometrics. Although financial econometrics should predominate, there are other sources of
information, and other techniques may warrant attention. For example, there are accounting measures (including the
flow-of-funds data), surveys of experts and industry insiders, visual analytics, linguistic analyses (e.g., sentiment
analyses of news reports), etc. Second, there is the reification of a systemic event, which occurs at a point in time, t,
because that is how systemic threats typically manifest their damage. Such a focus may discourage the analysis of
threats that do not play out abruptly in calendar time. Although abrupt discontinuities are important, these are not
the only outcomes to worry about. For example, Reinhart & Rogoff (2009) point to post-event episodes that play out
in historical time (i.e., over months and years).
www.annualreviews.org � Systemic Risk Analytics 277
Ann
u. R
ev. F
inan
c. E
con.
201
2.4:
255-
296.
Dow
nloa
ded
from
ww
w.a
nnua
lrev
iew
s.or
g A
cces
s pr
ovid
ed b
y M
assa
chus
etts
Ins
titut
e of
Tec
hnol
ogy
(MIT
) on
06/
19/1
7. F
or p
erso
nal u
se o
nly.

to conduct the estimation and statistical inference. Virtually all methods of estimation and
inference rely on the assumption of stationarity:
8t1, t2, t3,k: Prob (Rt1 ,Xt2 ,Et3 ) ¼ Prob (Rt1þk,Xt2þk,Et3þk). ð4ÞIn other words, the joint distribution of the relevant variables is stable over time.
The motivation for such an assumption is clear: We are attempting to use historical data
to infer something about the structure of systemic risk, and if that structure is not stable
over time, historical data may not be an accurate guide to what the future holds. The well-
known mutual-fund disclaimer that “past performance is no guarantee of future returns”
can take hold with a vengeance in such circumstances.
Nonstationarity is not a new challenge to econometrics, and a large literature has
developed to address specific types of nonstationarities, such as deterministic and stochas-
tic trends and cointegration relationships (see, for example, Hamilton 1994). However,
these are very specific types of nonstationarity, whereas the kind of nonstationarity that
affects systemic risk may be less easily parameterized, e.g., political, institutional, and
cultural changes. In fact, the very notion of systemic risk is a good illustration of non-
stationarity. Two decades ago, CDSs, collateralized debt obligations, exchange-traded
funds, strategic mortgage defaults, and high-frequency trading would not have been part
of any theoretical or empirical analysis of systemic risk. Today, they are systemically
relevant markets and activities that must be carefully monitored.
The very nature of systemic risk implies a certain degree of nonstationarity that may not
always be consistent with the econometric framework in which risk measures are typically
estimated. Although financial innovation can be useful in facing immediate challenges, it
can have unintended consequences by reducing transparency and increasing complexity in
the system. Significant innovations can disrupt empirical relationships, rendering reliable
statistical estimation difficult or impossible. Accordingly, the amount of data available for
addressing systemic risk may be intrinsically more limited than other areas of econometric
analysis. One concrete illustration of this limitation is the default-probability estimates of
mortgage-backed securities during the years immediately preceding the recent problems in
the US subprime mortgage market. A key parameter of those default-probability estimates
was the correlation of defaults of individual mortgages in a geographically diversified pool.
Because there had been no significant national decline in the value of residential real estate
in the trailing 20-year history of US housing prices, the estimated default correlations were
extremely low, leading to even lower default-probability estimates for the diversified pool
of mortgages and higher credit ratings.
However, spotting the danger of nonstationarity is considerably easier than addressing
it satisfactorily. Because nonstationarity has a vastly broader set of outcomes than its
complement, the curse of dimensionality suggests that there are no easy fixes. One com-
mon approach among financial industry practitioners is to use rolling windows of data in
estimating models and parameters, in some cases with exponentially declining weights to
give more emphasis to current observations and less to older ones. Although this practice
does capture simple nonstationarities, it does so in a very crude manner that can yield other
types of misleading inferences. For example, Lo & Newey (2011) show that if a time series
is indeed stationary, then an exponentially weighted mean is an inconsistent estimator of
the population expectation, implying that even as the sample size increases without bound,
the estimator will not converge in probability but will continue fluctuating randomly. This
suggests that even when economic conditions are stable, systemic risk measures estimated
278 Bisias et al.
Ann
u. R
ev. F
inan
c. E
con.
201
2.4:
255-
296.
Dow
nloa
ded
from
ww
w.a
nnua
lrev
iew
s.or
g A
cces
s pr
ovid
ed b
y M
assa
chus
etts
Ins
titut
e of
Tec
hnol
ogy
(MIT
) on
06/
19/1
7. F
or p
erso
nal u
se o
nly.
with exponential weights can yield false positives on a regular basis. These considerations
underscore the importance of incorporating realistic institutional features and constraints
in modeling and measuring systemic risk and also highlight the need for new econometric
methods that are able to address nonstationarity in more sophisticated ways.
3.3. Other Research Directions
Several other research directions that we did not include in this survey may yield additional
insights into systemic risk and bear further investigation. One of the most intriguing of
these nonstandard approaches is agent-based modeling (ABM) techniques, in which eco-
nomic agents with relatively simple behavioral rules are allowed to interact freely in a
computer simulation, with the objective of studying the dynamic properties of these inter-
actions over the course of the simulation. ABM has deep intellectual roots that go back to
the 1940s, with John von Neumann’s creation of cellular automata.14 The motivation is
compelling: Because the dynamics of realistic interactions between a large population of
economic agents are far too complicated to compute analytically, simulation is a natural
and efficient alternative, especially given the tremendous increase in computing power in
recent years. Axelrod (1997) provides a useful introduction to this literature, and there are
many online resources to help the uninitiated get started (see, in particular, Axelrod &
Tesfatsion 2006). Farmer & Foley (2009) have made a compelling case for using ABM
techniques in studying the financial crisis, and Farmer and colleagues have received several
large grants to develop new computational models for this purpose. In addition, ABM is a
topic that has engaged the interest of FSOC and OFR staff.
Another potentially relevant research area is the empirical properties of extreme returns
of financial assets, i.e., tail probabilities. Although several techniques in this survey do
involve tail probabilities and extreme events (see, for example, Sections C.2, C.4, E.1, E.3,
and E.4 of the Supplemental Appendix), the econophysics literature—a discipline that,
curiously, has been defined not so much by its focus but more by the techniques (scaling
arguments, power laws, and statistical mechanics) and occupations (physicists) of its
practitioners—has taken a very different tack. By carefully measuring the mathematical
properties of tail probabilities of financial data, econophysicists have documented power
laws that provide more accurate descriptions of how these non-Gaussian probabilities
decay for more extreme scenarios. These findings have important implications for tradi-
tional risk measures such as value-at-risk and expected-loss statistics, but also imply slowly
decaying autocorrelations, long-range dependence, and non-normal asymptotic distribu-
tions for most standard econometric estimators. Mantegna & Stanley (2000) provide an
excellent summary of this literature, and Bouchaud, Farmer & Lillo (2009) present a
fascinating market-microstructure application of these techniques that may be particularly
relevant for high-frequency trading contexts.
A third research direction that may be useful is behavioral economics and finance. This
may seem contrary to the quantitative focus of systemic risk measurement, but two con-
siderations should give even the most skeptical readers pause in dismissing this litera-
ture. The first is the observation that among the many nonstationarities that characterize
14Cellular automata are mathematical constructions involving a simple grid of cells that have two states, on and off,
with rules for how these states evolve over time. From a relatively spare set of assumptions, these cellular automata
can generate a surprisingly rich spectrum of patterns.
www.annualreviews.org � Systemic Risk Analytics 279
Supplemental Material
Ann
u. R
ev. F
inan
c. E
con.
201
2.4:
255-
296.
Dow
nloa
ded
from
ww
w.a
nnua
lrev
iew
s.or
g A
cces
s pr
ovid
ed b
y M
assa
chus
etts
Ins
titut
e of
Tec
hnol
ogy
(MIT
) on
06/
19/1
7. F
or p
erso
nal u
se o
nly.

financial markets and their regulatory environment, the one constant throughout is human
behavior—Homo sapiens has changed relatively little over the past 60,000 years. In fact, it
can be argued that the ultimate source of systemic risk is the inherent incompatibility of
human behavior (which has been adapted to the environment of the Neolithic ice age) with
the many technological innovations of modern civilization. For example, for the first time
in human history, at the click of a mouse button, we can wipe out a substantial portion of
our life savings with one bad trade.
The second observation is that the behavioral literature has progressed far beyond the
less analytical and more phenomenological approach of the early experimental studies of
behavioral biases and anomalies. Recent advances in the cognitive neurosciences have
provided more formal and specific underpinnings of human behavior and their implica-
tions for financial decision-making (see, for example, Bossaerts 2009), and the implica-
tions for systemic risk measurement may be significant. For example, in reviewing the
financial crisis from a cognitive neurosciences perspective, Lo (2011) observes that risk
perception may differ from risk reality, and because the former drives behavior, not the
latter, financial crises may be an inevitable outcome of free enterprise. In particular, he
cites the example of the so-called Peltzman effect (Peltzman 1975) in which regulations
mandating the installation of various automobile safety devices may have the unintended
consequence of encouraging people to drive more recklessly because they feel safer.
Although this effect has been challenged by several subsequent studies that control for
various confounding factors such as enforcement practices, driver age, rural versus urban
roads, and vehicle weight, in the more narrowly defined context of NASCAR drivers, the
Peltzman effect has been confirmed. This behavioral version of the Lucas critique is an
ironic twist of fate in which the cognitive neurosciences are now providing neuro-
physiological microfoundations for economic ideas such as rational expectations.15
By developing a better understanding of the cognitive foundations of such patterns of
behavior—including the subtleties of their context dependence—we may be able to con-
struct more informative measures of systemic risk, as well as more responsive policies
for promoting financial stability.
3.4. Research Taxonomy
Although no single classification scheme can encompass all of the relevant characteristics
of all of our systemic risk measures, and there is inevitable overlap among them, from the
research perspective, the taxonomy proposed in Table 4 may be more user-friendly for
researchers in allowing them to identify common themes, algorithms, and data structures
quickly within each category. The main differences between this taxonomy and those of
Tables 1–3 stem from the fact that the origin of systemic events throughout history seems
to be the four L’s of financial crisis: liquidity, leverage, losses, and linkages. When leverage
is used to boost returns, losses are also magnified, and when too much leverage is applied, a
small loss can easily turn into a broader liquidity crunch via the positive feedback loop of
forced liquidations of illiquid positions cascading through the network of linkages within
the financial system. From this stylized narrative of financial crisis, we can categorize our
systemic risk measures into five groups organized by the particular aspect of the four L’s
15In fact, the theory of mind literature in psychology is intimately related to the formation of expectations and what
economists consider to be rational behavior. See Lo (2011) for further discussion.
280 Bisias et al.
Ann
u. R
ev. F
inan
c. E
con.
201
2.4:
255-
296.
Dow
nloa
ded
from
ww
w.a
nnua
lrev
iew
s.or
g A
cces
s pr
ovid
ed b
y M
assa
chus
etts
Ins
titut
e of
Tec
hnol
ogy
(MIT
) on
06/
19/1
7. F
or p
erso
nal u
se o
nly.

Table 4 Taxonomy of systemic risk measures by research methoda,b
Systemic risk measure Appendix Section
Probability-distribution measures:
Mahalanobis distance C.2
Multivariate density estimators C.4
CoVaR E.1
Co-Risk E.3
Marginal and systemic expected shortfall E.4
Contingent claims and default measures:
The default intensity model B.1
Contingent claims analysis C.1
The option iPoD C.3
Simulating the housing sector C.5
Consumer credit C.6
DIP E.2
Illiquidity measures:
Mark-to-market accounting and liquidity pricing B.5
Noise as information for illiquidity F.3
Crowded trades in currency funds F.4
Equity market illiquidity F.5
Serial correlation and illiquidity in hedge-fund returns F.6
Broader hedge-fund-based systemic risk measures F.7
Network analysis measures:
Network analysis and systemic financial linkages B.2
PCA and Granger-causality networks B.3
Bank funding risk and shock transmission B.4
Principal components analysis C.7
Macroeconomic measures:
Costly asset price boom/bust cycles A.1
Property-price, equity-price, and credit-gap indicators A.2
Macroprudential regulation A.3
(Continued)
www.annualreviews.org � Systemic Risk Analytics 281
Ann
u. R
ev. F
inan
c. E
con.
201
2.4:
255-
296.
Dow
nloa
ded
from
ww
w.a
nnua
lrev
iew
s.or
g A
cces
s pr
ovid
ed b
y M
assa
chus
etts
Ins
titut
e of
Tec
hnol
ogy
(MIT
) on
06/
19/1
7. F
or p
erso
nal u
se o
nly.

they capture and the techniques used: probabilities of loss, default likelihood, illiquidity,
network effects, and macroeconomic conditions.
3.4.1. Probability-distribution measures. Perhaps the most direct measure of systemic
risk is simply the joint distribution of negative outcomes of a collection of SIFIs.
The financial turbulence model of Kritzman & Li (2010); the banking system’s multi-
variate density (BSMD) function of Segoviano & Goodhart (2009); and the codepen-
dence measures of Adrian & Brunnermeier (2010) (CoVaR), Chan-Lau et al. (2009)
(Co-Risk), and Acharya et al. (2010) (SES) are all examples based on the joint distribu-
tion of asset returns. These measures are largely atheoretical, but some may interpret
this as a virtue rather than a vice; regardless of one’s theoretical priors, these measures
can still provide informative estimates of correlated losses. Moreover, the probability
distributions on which these measures are based often serve as inputs to other measures
with more structure. For example, Segoviano & Goodhart’s (2009) measure is used to
produce the joint probability of default, the banking stability index, the distress depen-
dence matrix, and the probability of cascade effects.
3.4.2. Contingent claims and default measures. With additional structure regarding
an institution’s assets and liabilities, it is possible to construct measures of default like-
lihood for each institution and then link them either directly or indirectly through their
joint distribution, as in the IMF (2009) default intensity model. Using nonparametric
estimation techniques from the area of machine learning applied to bank transac-
tions and credit-bureau data for customers of a major US commercial bank, Khandani,
Kim & Lo (2010) construct nonlinear, nonparametric, out-of-sample forecasts of con-
sumer credit risk that significantly improve the classification rates of credit-card delin-
quencies and defaults.
For a more structural approach to modeling default, Merton (1973) shows that equity
can be viewed as a call option on a firm’s assets, and once a stochastic process for the
asset’s value is chosen, equity and debt contracts on those assets and implied default
Table 4 (Continued)
Systemic risk measure Appendix Section
Macroeconomic measures:
GDP stress tests D.1
Lessons from the SCAP D.2
A 10-by-10-by-10 approach D.3
Risk topography F.1
The leverage cycle F.2
aAbbreviations: CoVaR: conditional value at risk; DIP: distressed insurance premium; iPoD: implied probability
of default; SCAP: Supervisory Capital Assessment Program.bSee Supplemental Appendixes A–F; follow the Supplemental Materials link in the online version of this article
or at http://www.annualreviews.org.
282 Bisias et al.
Supplemental Material
Ann
u. R
ev. F
inan
c. E
con.
201
2.4:
255-
296.
Dow
nloa
ded
from
ww
w.a
nnua
lrev
iew
s.or
g A
cces
s pr
ovid
ed b
y M
assa
chus
etts
Ins
titut
e of
Tec
hnol
ogy
(MIT
) on
06/
19/1
7. F
or p
erso
nal u
se o
nly.

probabilities can easily be valued using contingent claims analysis (i.e., derivatives pricing
models). This is the approach taken by Capuano (2008); Gray & Jobst (2010); and Huang,
Zhou & Zhu (2009).
Contingent claims analysis can also be applied to measuring the implicit cost
of guarantees, as in Khandani, Lo & Merton’s (2012) simulation of the magnitude
of cumulative losses borne by mortgage lenders through the implicit put option in
nonrecourse mortgages.
3.4.3. Illiquidity measures. Illiquidity is an example of a highly specific measure of sys-
temic risk that often requires considerable structure. Because of their role in providing
maturity transformation as a valuable service, banks are vulnerable to funding illiquidity.
This fragility forms the rationale for some of the main weapons in the macroprudential
arsenal, including deposit insurance and the lender of last resort. These issues appear
repeatedly in the literature, including recent papers by Kapadia et al. (2009) and
Brunnermeier & Pedersen (2009). The Bank of England has developed its risk assess-
ment model for systemic institutions (RAMSI) to simulate the possibilities (Aikman
et al. 2010). Ricks (2010) and Pozsar et al. (2010) point out that funding troubles can
apply to both traditional intermediaries as well as shadow banks.
Liquidity also affects the other side of the ledger. A key aspect of asset liquidity is the
valuation methods used to mark positions, either to model or to market. Sapra (2008)
considers the trade-offs in the choice between these two valuation regimes and shows
benefits and costs to both. Hu, Pan & Wang (2010) propose a measure of illiquidity
by computing the deviation of observed market yields on Treasury bonds from their
model-based yields derived from a daily estimate of the zero-coupon curve and find
that deviations are typically quite low (and liquidity correspondingly high) but spike
during crises as arbitrage capital exits the marketplace. Pojarliev & Levich (2011) use a
proprietary high-frequency data set of currency funds’ returns to capture the crowded
trade phenomenon in currency markets. From a systemic perspective, the most interest-
ing results arise when funding illiquidity and asset illiquidity interact to generate self-
reinforcing feedback of funding shortfalls and asset fire sales, which propagate to
additional funding shortfalls elsewhere. Examples include Kapadia et al. (2009) and
Brunnermeier & Pedersen (2009).
Among the approaches described below, Khandani & Lo (2011) propose two distinct
measures of equity market liquidity, one of which is the profitability of an equity mean-
reversion strategy, and the other is a more direct measure of price impact based on Kyle
(1985). For assets that are not publicly traded, such as hedge-fund and private-equity
returns, Getmansky, Lo & Makarov (2004) propose using serial correlation as a proxy
for illiquidity. By definition, current prices in illiquid markets are frequently unavailable
or unreliable, forcing funds to report mark-to-model estimates that often rely on linear
extrapolation pricing methods. Serial correlation in observed returns is an artifact of this
autoregressive smoothing, thus providing an indication of illiquidity.
3.4.4. Network analysis measures. As with probability-distribution measures, measures
of connectedness are largely atheoretical, but they do offer more direct indications of
linkages between firms and are easily aggregated to produce overall measures of tight
coupling. One approach is to use principal components analysis (PCA) to gauge the degree
of commonality among a vector of asset returns. When the asset returns of a collection of
www.annualreviews.org � Systemic Risk Analytics 283
Ann
u. R
ev. F
inan
c. E
con.
201
2.4:
255-
296.
Dow
nloa
ded
from
ww
w.a
nnua
lrev
iew
s.or
g A
cces
s pr
ovid
ed b
y M
assa
chus
etts
Ins
titut
e of
Tec
hnol
ogy
(MIT
) on
06/
19/1
7. F
or p
erso
nal u
se o
nly.

entities are jointly driven by a small number of highly significant factors, fewer principal
components are needed to explain the variation in the vector of returns; hence, sharp
increases in the proportion of variability explained by the first n principal components are
a natural indication of systemic risk. The absorption ratio of Kritzman et al. (2010) and
the PCA measure of Billio et al. (2012) are based on this property.
More explicit measures of financial networks may be derived from graph theory, a
branch of discrete mathematics in which abstract nodes are connected to each other by
edges that represent a particular type of relationship. Such networks have been popularized
through social networking Web sites and degree-of-separation games, but there is a rich set
of analytics that has been developed for networks that can be drawn upon to measure
systemic risk. Espinosa-Vega & Sole (2010) and the IMF (2009) contain two network
models of interbank exposures to assess the network externalities of a bank failure using
institutional data. Using Granger-causality test statistics for asset returns to define the
edges of a network of hedge funds, banks, broker/dealers, and insurance companies, Billio
et al. (2012) show that Granger-causality networks are highly dynamic and become densely
interconnected prior to systemic shocks.
And the funding gap model of Fender & McGuire (2010a) reveals important linkages
within multinational banks that have many geographically dispersed offices. Although
aggregate balance sheet data at the banking-group level may not show much risk, a
network map of the exposures between offices within a banking group may yield a very
different picture, especially for large banking organizations that fund their local foreign
currency (especially USD) positions through their internal (i.e., within the banking group)
and external networks.
3.4.5. Macroeconomic measures. The diametric opposite of the atheoretical probability-
distribution measures of Section 3.4.1 are the macroeconomic models of systemic risk.
Because the macroeconomy is so complex, it is virtually impossible to derive useful infor-
mation from basic macro data without significant structural hypotheses. Accordingly,
there are a multitude of macroeconomic measures of systemic risk, corresponding to the
many macro models of business and credit cycles, unemployment, inflation, and growth.
The comprehensive volume by Reinhart & Rogoff (2009) provides useful comparisons
of broad macroeconomic aggregates, such as asset price indexes (equities, housing, etc.),
GDP growth rates, and public debt over many financial crises, which demonstrates several
common patterns. Alfaro & Drehmann (2009) use the Reinhart & Rogoff episodes as their
starting point for generating GDP stress tests.
A natural complement to systemic risk measurement is macroprudential regulation,
which Borio (2010) defines as calibrating supervision from the top down, rather than
building it up from supervision of individual institutions. Caruana (2010b) makes the
case for countercyclical regulation, arguing that if Basel III had existed at the time
of the crisis, banks would have had much stronger capital bases so that the negative
feedback from credit losses to credit supply—i.e., procyclical aggravation of the busi-
ness cycle from financial distress—would have been milder and the required bailouts
much smaller.
Alessi & Detken (2009) construct simple early-warning indicators from a broad range
of real and financial indicators—including GDP and its components, inflation, interest
rates, and monetary aggregates—for 18 OECD countries between 1970 and 2007. Extreme
values of these aggregates are taken as indications of pending booms or busts over the
284 Bisias et al.
Ann
u. R
ev. F
inan
c. E
con.
201
2.4:
255-
296.
Dow
nloa
ded
from
ww
w.a
nnua
lrev
iew
s.or
g A
cces
s pr
ovid
ed b
y M
assa
chus
etts
Ins
titut
e of
Tec
hnol
ogy
(MIT
) on
06/
19/1
7. F
or p
erso
nal u
se o
nly.
following six-quarter horizon. Borio & Drehmann (2009b) propose a related approach,
but with signals defined by simultaneous extreme values for pairs of property prices,
equity prices, and credit spreads, again drawn from 18 industrialized countries between
1970 and 2007.
4. DATA ISSUES
While this survey covers a diverse range of models of threats to financial stability, they
all have one feature in common: significant new data requirements. Although there is
still considerable controversy over the root causes of the Financial Crisis of 2007–2009,
there is little dispute that regulators, policymakers, and the financial industry did not
have ready access to information to generate early-warning signals or implement rapid
resolution plans. For example, prior to the Dodd-Frank Act, even SIFIs such as AIG
and Lehman Brothers were not obligated to report their amount of financial leverage,
asset illiquidity, counterparty risk exposures, market share, and other critical risk data
to any regulatory agency. If aggregated over the entire financial industry, such data
could have played a crucial role in providing regulators with advance notice of AIG’s
unusually concentrated position in CDSs and the broad exposure of money market
funds to Lehman bonds.
The Dodd-Frank Act mandates central reporting of large swaths of the OTC derivatives
market and has assigned to the OFR and FSOC the responsibility for coordinating data
collection, data sharing, and supervision of financial firms. Similar efforts are under way
in Europe, with the creation of the European Systemic Risk Board. The FSB and IMF are
spearheading an effort for the G-20 finance ministers and central bank governors to
address information gaps at the international level (see FSB/IMF 2010). These efforts will
undoubtedly raise many new issues surrounding data acquisition, archiving, and manage-
ment. In this section, we provide a brief introduction to some of these issues by summa-
rizing in Section 4.1 the data required by the risk analytics in this survey, reviewing in
Section 4.2 the issues surrounding the standardization of LEIs, and discussing in Section 4.3
recent advances in computer science that have significant implications for the trade-off
between transparency and privacy.
4.1. Data Requirements
To be able to implement the statistical models and algorithms for calculating various
systemic risk measures described in this review, risk regulators will have to collect, archive,
and access data on a regular basis, while addressing security and privacy concerns of all
stakeholders. To provide a concrete illustration of the scope of this effort, we provide in
Table 5 a detailed list of the data sources used by the measures in this survey.
4.2. Legal Entity Identifier Standards
Separately, the OFR and FSB are coordinating the development of a standardized LEI
registry, which would, for the first time, provide consistent global identification of obli-
gors in financial transactions. The LEI has special significance for systemic risk mea-
surement because it facilitates the implementation of many of the network measures
described in this survey.
www.annualreviews.org � Systemic Risk Analytics 285
Ann
u. R
ev. F
inan
c. E
con.
201
2.4:
255-
296.
Dow
nloa
ded
from
ww
w.a
nnua
lrev
iew
s.or
g A
cces
s pr
ovid
ed b
y M
assa
chus
etts
Ins
titut
e of
Tec
hnol
ogy
(MIT
) on
06/
19/1
7. F
or p
erso
nal u
se o
nly.

Table 5 Data requirements (including replicable studies covered in this review)a,b
Source Asset Type Frequency Start Stop
Asset price boom/bust cycle (Alessi & Detken 2009)
IMF international
financial statistics
Credit Price Quarterly Q1:1970 Q4:2007
OECD econ. outlook,main econ. indicators
Macro Macro Annual Q1:1970 Q4:2007
OECD econ. outlook,
main econ. indicators
Macro Macro Quarterly Q1:1970 Q4:2007
BIS and ECB sources Money market Return Quarterly Q1:1970 Q4:2007
BIS Real estate Price Quarterly Q1:1970 Q4:2007
Bank funding risk and shock transmission (Fender & McGuire 2010b)
BIS locational banking
statistics by nationality
Bank Accounting Quarterly Q1:2000 Q1:2010
BIS locational statistics
by residency
Bank Accounting Quarterly Q1:2000 Q1:2010
Consumer credit (Khandani, Kim & Lo 2010)
Proprietary commercial
bank data
Bank Misc. Monthly January 2005 April 2009
Contingent claims analysis (Gray & Jobst 2010)
Moody’s KMV creditEdge Bond Price Quarterly January 1, 2007 January 1, 2010
Bloomberg Option Price Daily January 1, 2007 January 1, 2010
MarkIt Swap Spread Daily January 1, 2007 January 1, 2010
Co-Risk (Chan-Lau et al. 2009)
FRB H15 release Bond Return Daily July 1, 2003 September 12, 2008
CRSP Equity Return Daily July 1, 2003 September 12, 2008
Bloomberg Money market Return Daily July 1, 2003 September 12, 2008
FRBNY Web site Money market Return Daily July 1, 2003 September 12, 2008
CBOE Web site Option Return Daily July 1, 2003 September 12, 2008
Bloomberg and
Primark Datastream
Swap Price Daily July 1, 2003 September 12, 2008
CoVaR (Adrian & Brunnermeier 2010)
FRBNY Web site Bond Return Weekly Q1:1986 Q1:2010
CRSP Equity Price Weekly Q1:1986 Q1:2010
Compustat Equity Accounting Quarterly Q1:1986 Q1:2010
Bloomberg Money market Return Weekly Q1:1986 Q1:2010
FRB H15 release Money market Return Weekly Q1:1986 Q1:2010
(Continued)
286 Bisias et al.
Ann
u. R
ev. F
inan
c. E
con.
201
2.4:
255-
296.
Dow
nloa
ded
from
ww
w.a
nnua
lrev
iew
s.or
g A
cces
s pr
ovid
ed b
y M
assa
chus
etts
Ins
titut
e of
Tec
hnol
ogy
(MIT
) on
06/
19/1
7. F
or p
erso
nal u
se o
nly.

Table 5 (Continued)
Source Asset Type Frequency Start Stop
CoVaR (Adrian & Brunnermeier 2010)
CBOE Web site Option Return Weekly Q1:1986 Q1:2010
CRSP Real estate Return Weekly Q1:1986 Q1:2010
Crowded currency trades (Pojarliev & Levich 2011)
DB G10 Currency
Harvest Index
Currency Return Weekly April 2005 June 2010
AFX CurrencyMgmt. Index
Currency Return Weekly April 2005 June 2010
DB Currency
Volatility Index
Currency Return Weekly April 2005 June 2010
DB G10 Valuation Index Equity Return Weekly April 2005 June 2010
Proprietary Private
partnership
Return Weekly April 2005 June 2010
Default intensity (Giesecke & Kim 2011)
Moody’s defaults
risk services
Bond Ratio Static January 1, 1970 December 31, 2008
DIP (Huang, Zhou & Zhu 2009)
Market participants Bond Probability Weekly January 2001 December 2008
Moody’s KMV Bond Probability Weekly January 2001 December 2008
FRB H15 release Bond Spread Weekly January 2001 December 2008
TAQ Database Equity Price Tick January 2001 December 2008
Bloomberg Equity Return Quarterly January 2001 December 2008
FRB H15 release Money market Return Weekly January 2001 December 2008
Bloomberg Option Implied vol. Weekly January 2001 December 2008
MarkIt Swap Spread Daily January 2001 December 2008
Early-warning macro indicators (Borio & Drehmann 2009b)
BIS Macro Price Annual 1970 2007
BIS Macro Misc. Static 1970 2007
Equity market liquidity (Khandani & Lo 2011)
NYSE TAQ Equity Price Tick July 2, 2007 September 28, 2007
GDP stress tests (Adrian & Drehmann 2009)
Authors’ estimates Macro Misc. Static Q1:1970 Q4:2007
BIS Macro Return Quarterly Q1:1970 Q4:2007
(Continued)
www.annualreviews.org � Systemic Risk Analytics 287
Ann
u. R
ev. F
inan
c. E
con.
201
2.4:
255-
296.
Dow
nloa
ded
from
ww
w.a
nnua
lrev
iew
s.or
g A
cces
s pr
ovid
ed b
y M
assa
chus
etts
Ins
titut
e of
Tec
hnol
ogy
(MIT
) on
06/
19/1
7. F
or p
erso
nal u
se o
nly.

Table 5 (Continued)
Source Asset Type Frequency Start Stop
Granger-causality networks and principal components analysis (Billio et al. 2012)
CRSP Equity Return Monthly January 1994 December 2008
CRSP/Compustat merged Equity Accounting Quarterly January 1994 December 2008
CS/Tremont HedgeFund Index
Privatepartnership
Return Monthly January 1994 December 2008
TASS Database Privatepartnership
Return Monthly January 1994 December 2008
TASS Database Private
partnership
Ratio Monthly January 1994 December 2008
Hedge-fund-based systemic risk measures (Chan et al. 2006a,b)
TASS Database Private
partnership
Return Monthly January 1977 August 2004
TASS Database Private
partnership
Return Mixed January 1994 August 2004
CSFB/TremontHedge-Fund
category indexes
Privatepartnership
Return Monthly January 1994 August 2004
Housing sector (Khandani, Lo & Merton 2012)
CRSP Bond Return Monthly February 1977 December 2008
Robert Shiller Web site Bond Return Annual January 1919 January 1977
S&P/Case-Shiller Home
Price Composite
Real estate Return Monthly January 1987 December 2008
FHFA National HousePrice Index
Real estate Return Quarterly Q1:1975 Q4: 1986
Nominal Home Price
Index collected byR. Shiller
Real estate Return Annual 1919 1974
US Census Bureau Real estate Number Monthly January 1963 December 2008
US Census Bureau Real estate Number Quarterly 1974 December 2008
US Census Bureau Real estate Price Monthly January 1963 December 2008
Freddie Mac Real estate Return Monthly April 1971 December 2008
Mahalanobis distance (Kritzman & Li 2010)
Not specified by authors Bond Return Monthly January 1973 December 2009
Not specified by authors Commodities Return Monthly January 1973 December 2009
S&P 500 Equity Return Monthly January 1973 December 2009
MSCI Non-US Index Equity Return Monthly January 1973 December 2009
Not specified by authors Real estate Return Monthly January 1973 December 2009
(Continued)
288 Bisias et al.
Ann
u. R
ev. F
inan
c. E
con.
201
2.4:
255-
296.
Dow
nloa
ded
from
ww
w.a
nnua
lrev
iew
s.or
g A
cces
s pr
ovid
ed b
y M
assa
chus
etts
Ins
titut
e of
Tec
hnol
ogy
(MIT
) on
06/
19/1
7. F
or p
erso
nal u
se o
nly.

Table 5 (Continued)
Source Asset Type Frequency Start Stop
Marginal and systemic expected shortfall (Acharya et al. 2010)
CRSP Equity Return Daily June 2006 June 2007
CRSP/Compustat merged Equity Accounting Static June 2007 June 2007
MarkIt Swap Spread Daily June 2006 June 2007
Multivariate density estimator (Segoviano & Goodhart 2009)
MarkIt Swap Spread Daily January 2005 October 2008
Network analysis of linkages (IMF 2009)
BIS Intl. Banking Statistics Mixed Price Static March 2008 March 2008
Noise as information for illiquidity (Hu, Pan & Wang 2010)
CRSP Daily Treasury
Database
Bond Price, Return Daily January 1987 December 2009
Option iPoD (Capuano 2008)
Bloomberg Option Price Daily February 12, 2008 June 21, 2008
Principal components (Kritzman et al. 2010)
MSCI US Index and
51 subindexes
Equity Return Daily January 1, 1998 January 31, 2010
For each country,the MSCI Index
and all subindexes
Equity Return Daily January 1, 1998 January 31, 2010
Case-Shiller USHousing Price Index
Real estate Return Monthly January 1987 December 2009
Serial correlation and illiquidity in hedge-fund returns (Getmansky, Lo & Makarov 2004)
CRSP Equity Price, Return Monthly November 1977 January 2001
TASS Database Private
partnership
Return Monthly November 1977 January 2001
CSFB/Tremont Hedge-
Fund category indexes
Private
partnership
Price, Return Monthly November 1977 January 2001
10-by-10-by-10 (Duffie 2011)
Bank Executive Survey Mixed Text Quarterly N/A N/A
aAbbreviations: BIS: Bank for International Settlements; CBOE: Chicago Board Options Exchange; CoVaR: conditional value at risk; CS:
Credit Suisse; CSFB: Credit Suisse First Boston; CRSP: Center for Research in Security Prices; DB: Deutsche Bank; DIP: distressed insurance
premium; ECB: European Central Bank; IMF: International Monetary Fund; FHFA: Federal Housing Finance Agency; FRB: Federal Reserve
Board; FRBNY: Federal Reserve Bank of New York; iPoD: implied probability of default; NYSE: New York Stock Exchange; OECD:
Organization for Economic Cooperation and Development; TAQ: Trade and Quote; TASS: Trading Advisor Selection System.bSee Supplemental Appendixes A–F; follow the Supplemental Materials link in the online version of this article or at http://www.annualreviews.org.
www.annualreviews.org � Systemic Risk Analytics 289
Supplemental Material
Ann
u. R
ev. F
inan
c. E
con.
201
2.4:
255-
296.
Dow
nloa
ded
from
ww
w.a
nnua
lrev
iew
s.or
g A
cces
s pr
ovid
ed b
y M
assa
chus
etts
Ins
titut
e of
Tec
hnol
ogy
(MIT
) on
06/
19/1
7. F
or p
erso
nal u
se o
nly.

The need for a standardized method of identification is easiest to see within—
but not limited to—the context of network or graph-theoretic measures such as
Espinosa-Vega & Sole (2010) and Duffie (2011), where the nodes in the graph repre-
sent legal entities, and edges represent individual or aggregated contractual relation-
ships. In practical implementations of such models, especially with systemic scope,
both entities and relationships will be first-class objects with persistent state. This fact
implies a need for an efficient, consistent, globally unique identification scheme for
both entities and relationships. An LEI is simply a systematically maintained tag or code
that uniquely identifies an entity in the system. Bottega & Powell (2011, p. 2) describe
LEIs in detail, noting that they are “a critical component for measuring and monitor-
ing systemic risk” because they enable the construction of the counterparty network
graph of linkages and interrelationships in the system. This is the foundation of net-
work analysis, as described in Section B of the Supplemental Appendix, and allows for
efficient and accurate aggregation when searching for concentrated exposures and pat-
terns of activity.
A move toward a globally standardized LEI is already under way, and the OFR is
helping to coordinate an international agreement around a standardized global registry of
LEIs [see OFR (2010, 2011) for further details]. A registry of globally unique LEIs has
ancillary benefits for the financial industry, which currently replicates this costly function
at each firm to support internal trading, compliance, and risk management functions.16
The set of instrument types defines the available contractual relationships within the
system—the attributes of the edges between nodes in a counterparty network graph.
By extension, the full set of instrument types establishes the universe of possible portfolios
for market participants. Because there are so many possible contracts, this universe is very
large indeed. The portfolio for a given participant at a particular point in time can be
represented by a vector of numbers, namely the amounts of each contract type contained in
the portfolio. This vector will have many elements; i.e., it will be very high-dimensional.
Moreover, for most participants, it will be very sparsely populated; i.e., it will have zeroes
in most elements, given that most participants have relatively specialized activities.
Measuring financial contracts will require the capture of much more detail about those
contracts than is the case under traditional firm-centric accounting systems.
To implement forward-looking risk metrics, the goals should be to capture and under-
stand each contract’s implied cash flow commitments between the counterparties to the
contract, noting that, in many cases, these cash flows are contingent on other factors.
The ability to work directly with the cash flows is crucial because, in practice, it is possible
for two contracts or portfolios to generate substantially identical cash flow patterns, even
when their legal or accounting representations differ widely. Much of financial engineering
is devoted to repackaging a fixed set of cash flow commitments into a different contractual
16In November 2010, the OFR (2010) issued a policy statement to promote the development of a global LEI system.
This included requirements for attributes of an LEI standard and associated reference data, as well as operational
attributes for a system to issue and maintain LEIs. Simultaneously, the SEC and CFTC issued Notices of Proposed
Rulemaking for reporting swap transactions to trade repositories and expressed a preference for using an LEI for
swap reporting. In January 2011, the International Organization for Standardization (ISO) launched a process to
establish an LEI standard. It developed a draft specification for the standard and selected a registration authority to
oversee assignment of LEIs: SWIFT, which is partnering with DTCC and its subsidiary Avox as facilities managers.
The initial vote on the LEI standard (17,442) being developed by ISO closed at the end of June. In September 2011,
the Financial Stability Board met in Basel to consider options for coordination around governance of a global
LEI infrastructure.
290 Bisias et al.
Ann
u. R
ev. F
inan
c. E
con.
201
2.4:
255-
296.
Dow
nloa
ded
from
ww
w.a
nnua
lrev
iew
s.or
g A
cces
s pr
ovid
ed b
y M
assa
chus
etts
Ins
titut
e of
Tec
hnol
ogy
(MIT
) on
06/
19/1
7. F
or p
erso
nal u
se o
nly.

configuration, perhaps to manage or lay off risk, avoid taxable events, reduce the market
impact of a trade, or simply obfuscate the activity.17
4.3. Privacy versus Transparency
Historically, government policy has trodden carefully on the financial industry’s disclo-
sure requirements because many of the industry’s data are considered highly proprietary.
Apart from the obvious privacy issues surrounding customer financial data, most intellec-
tual property in the financial industry consists of trade secrets. Unlike other industries in
which intellectual property is protected by patents, the financial industry consists primarily
of business processes that the US Patent Office deems unpatentable, at least until recently
(see, for example, Lerner 2002). Accordingly, trade secrecy is the preferred method by
which financial institutions protect the vast majority of their intellectual property, which
explains their desire to limit disclosure of their business processes, methods, and data.
Forcing a financial institution to publicly disclose its proprietary information—and with-
out the quid pro quo of 17-year exclusivity that a patent affords—will obviously dis-
courage innovation. Nevertheless, the recent crisis, as well as the skepticism with which
the financial industry has greeted current proposals for systemic risk surcharges, provides
even greater motivation for the OFR’s mandate to collect data from SIFIs and conduct
thorough empirical analysis on the efficacy of various analytics for capturing systemic risk.
These two seemingly irreconcilable objectives—protecting trade secrets while provid-
ing regulators with systemic risk transparency—are not as difficult to reconcile as they
may appear. In particular, the banking industry already provides a significant amount of
proprietary data to its regulator (the Office of the Comptroller of the Currency) without
jeopardizing its intellectual property; hence, some of these procedures may be applied to
SIFIs not currently regulated as banks. However, an even more significant development
for systemic risk management is the recent breakthroughs in cryptography that allow
third parties to compute aggregate statistics, such as a Herfindahl index of aggregate debt
outstanding, using encrypted data that preserve the privacy of each individual’s debt
holdings (see, for example, Abbe, Khandani & Lo 2012).
These algorithms will permit regulators to compute systemic risk exposures with-
out ever requiring individual institutions to reveal their proprietary data; only encrypted
information is used by the regulators. Although still in experimental stages of development,
these so-called secure multiparty computational and fully homomorphic encryption algo-
rithms will likely revolutionize the way in which systemic risk is measured and managed.
5. CONCLUSIONS
Regulators have been given a mandate by the Dodd-Frank Act to measure and monitor
systemic risk. Market participants have a complementary and immediate interest in better
measurement and management of systemic risk. Although the impact of systemic events is
widely felt, the burden of measuring and monitoring financial stability falls first and foremost
17Note that the Dodd-Frank Act [see especially section 153(c)(2)] mandates that the FSOC standardize data types
and formats for reporting. Separately, the Committee on Payment and Settlement Systems and the International
Organization of Securities Commission, at the direction of the FSB, established a task force to define requirements
for reporting and aggregation of OTC derivative information.
www.annualreviews.org � Systemic Risk Analytics 291
Ann
u. R
ev. F
inan
c. E
con.
201
2.4:
255-
296.
Dow
nloa
ded
from
ww
w.a
nnua
lrev
iew
s.or
g A
cces
s pr
ovid
ed b
y M
assa
chus
etts
Ins
titut
e of
Tec
hnol
ogy
(MIT
) on
06/
19/1
7. F
or p
erso
nal u
se o
nly.

on government regulators, given the unavoidable conflicts of interest faced by the private
sector. Because systemic risk is a multifaceted problem in an ever-changing financial environ-
ment, any single definition is likely to fall short and may create a false sense of security as
financial markets evolve in ways that escape the scrutiny of any one-dimensional perspective.
The scholarly literature is instructive in this regard. Various measurement techniques
have been proposed and implemented, attempting to capture systemic risk from diverse
perspectives. Ultimately, the specific measures regulators choose to deploy will become
the effective operational definition of systemic risk, and these metrics should be chosen
to tackle the problem from many different directions.
The data requirements to support these metrics are correspondingly wide-ranging.
In many cases, academic researchers have made do with publicly available data, adjusting
their modeling approaches accordingly. This is a constraint that regulators will not neces-
sarily face, given the mandates and authorities granted to them by recent legislation.
Although the scholarly literature serves as a useful introduction to the scope of possible
measurement approaches, it should be regarded only as a starting point, not a conclusion.
We hope this survey will expedite the process of discovery and innovation in systemic risk
measurement and look forward to future editions as more stakeholders engage in this
important research endeavor.
DISCLOSURE STATEMENT
A.W.L. is Chairman and Chief Investment Strategist at AlphaSimplex Group, LLC; Con-
sultant at the Office of Financial Research; Research Associate at the National Bureau of
Economic Analysis; an instructor for the Citigroup Executive Education Program; and a
member of the Financial Advisory Roundtable of the Federal Reserve Bank of New York,
Moody’s Academic Advisory and Research Committee, the Economic Advisory Committee
for FINRA, the Academic Advisory Board of the Consortium for Systemic Risk Analytics,
and the Board of Overseers at the Beth Israel Deaconness Medical Center.
ACKNOWLEDGMENTS
We thank Tobias Adrian, Lewis Alexander, Dick Berner, Markus Brunnermeier, Jayna
Cummings, Darrell Duffie, Doyne Farmer, Michael Gibson, Jeff King, Nellie Lang, Adam
LaVier, Bob Merton, Bill Nichols, Wayne Passmore, Patrick Pinschmidt, John Schindler,
Jonathan Sokobin, and Hao Zhou; participants at the 2011 OFR/FSOC Macroprudential
Toolkit Conference for helpful comments and discussion; and Alex Wang for excellent
research assistance. Research support from the Office of Financial Research is gratefully
acknowledged. The views and opinions expressed in this review are those of the authors
only and do not necessarily represent the views and opinions of AlphaSimplex Group,
MIT, any of their affiliates and employees, or any of the individuals acknowledged above.
Research support from the MIT Laboratory for Financial Engineering and the National
Science Foundation (grant no. ECCS-1027905) is gratefully acknowledged.
LITERATURE CITED
Abbe E, Khandani A, Lo AW. 2012. Privacy-preserving methods for sharing financial risk exposures.
Am. Econ. Rev.: Pap. Proc. 102:65–70
292 Bisias et al.
Ann
u. R
ev. F
inan
c. E
con.
201
2.4:
255-
296.
Dow
nloa
ded
from
ww
w.a
nnua
lrev
iew
s.or
g A
cces
s pr
ovid
ed b
y M
assa
chus
etts
Ins
titut
e of
Tec
hnol
ogy
(MIT
) on
06/
19/1
7. F
or p
erso
nal u
se o
nly.
Acharya V, Pedersen L, Philippon T, Richardson M. 2010. Measuring systemic risk. Work. Pap.,
New York Univ.
Acharya V, Richardson M, eds. 2009. Restoring Financial Stability: How to Repair a Failed System.
New York: Wiley
Adrian T, Brunnermeier M. 2010. CoVaR. Staff Rep. 348, Fed. Reserve Bank N.Y.
Adrian T, Shin HS. 2009. The shadow banking system: implications for financial regulation. Financ.
Stab. Rev. 19:1–10
Aikman D, Alessandri P, Eklund B, Gai P, Kapadia S, et al. 2010. Funding liquidity risk in a quantita-
tive model of systemic stability. In Financial Stability, Monetary Policy, and Central Banking:
An Overview, ed. RA Alfaro, pp. 371–410. Santiago, Chile: Cent. Bank Chile
Alessi L, Detken C. 2009. Real time early warning indicators for costly asset price boom/bust cycles:
a role for global liquidity. ECB Work. Pap. 1039, Eur. Cent. Bank
Alexander L. 2010. Opening remarks. Presented at Meas. Syst. Risk, Chicago
Alfaro R, DrehmannM. 2009. Macro stress tests and crises: What can we learn? BIS Q. Rev. Dec:29–41
Ashcraft A, Schuermann T. 2008. Understanding the securitization of subprime mortgage credit.
Staff Rep. 318, Fed. Reserve Bank N.Y.
Axelrod R. 1997. The Complexity of Cooperation: Agent-Based Models of Competition and Collab-
oration. Princeton, NJ: Princeton Univ. Press
Axelrod R, Tesfatsion L. 2006. On-line guide for newcomers to agent-based modeling in the social
sciences. In Handbook of Computational Economics, Vol. 2: Agent-Based Computational Eco-
nomics, ed. L Tesfatsion, KL Judd, pp. 1647–59. Amsterdam: Elsevier/North-Holland
Bank of England. 2009. The role of macroprudential policy. Discuss. Pap., Bank Engl.
Basel Committee on Banking Supervision (BCBS). 2011. Global systemically important banks: assess-
ment methodology and the additional loss absorbency requirement. BIS Consult. Doc.
Benston GJ, Kaufman GG. 1997. FDICIA after five years. J. Econ. Perspect. 11(3):139–58
Bignon V, Flandreau M, Ugolini S. 2009. Bagehot for beginners: the making of lending of last resort
operations in the mid-19th century. Work. Pap. 2009/22, Norges Bank
Billio M, Getmansky M, Lo AW, Pelizzon L. 2012. Econometric measures of connectedness and
systemic risk in the finance and insurance sectors. J. Financ. Econ. 104(3):535–59
Board of Governors of the Federal Reserve (FRB). 2009. The Supervisory Capital Assessment Program:
overview of results. Tech. Rep.,May 7. http://www.financialstability.gov/docs/SCAPresults.pdf
Boot A, Thakor A. 1993. Self-interested bank regulation. Am. Econ. Rev. 83(2):206–12
Bordo M. 1990. The lender of last resort: alternative views and historical experience. Fed. Reserve
Bank Richmond Econ. Rev. 1990:18–29
Borio C. 2010. Implementing a macroprudential framework: blending boldness and realism. Presented
at BIS-HKMA Res. Conf., Hong Kong
Borio C, Drehmann M. 2009a. Assessing the risk of banking crises—revisited. BIS Q. Rev.
2009(2):29–46
Borio C, Drehmann M. 2009b. Towards an operational framework for financial stability: ‘fuzzy’
measurement and its consequences. BIS Work. Pap. 284
Bossaerts P. 2009. What decision neuroscience teaches us about financial decision making. Annu. Rev.
Financ. Econ. 1:383–404
Bottega JA, Powell LF. 2011. Creating a linchpin for financial data: toward a universal legal entity
identifier. Work. Pap., Board Gov. Fed. Reserve
Bouchaud J-P, Farmer JD, Lillo F. 2009. How markets slowly digest changes in supply and demand.
In Handbook of Financial Markets: Dynamics and Evolution, ed. H Thorsten, KR Schenk-Hoppe,
pp. 57–160. New York: Elsevier
Boyd J, Gertler M. 1994. Are banks dead? Or are the reports greatly exaggerated? Fed. Reserve Bank
Minneap. Q. Rev. 18(3):2–23
Breuer T, Jandacka M, Rheinberger K, Summer M. 2009. How to find plausible, severe and useful
stress scenarios. Int. J. Cent. Bank. 5(3):205–24
www.annualreviews.org � Systemic Risk Analytics 293
Ann
u. R
ev. F
inan
c. E
con.
201
2.4:
255-
296.
Dow
nloa
ded
from
ww
w.a
nnua
lrev
iew
s.or
g A
cces
s pr
ovid
ed b
y M
assa
chus
etts
Ins
titut
e of
Tec
hnol
ogy
(MIT
) on
06/
19/1
7. F
or p
erso
nal u
se o
nly.

Brown CO, Din IS. 2011. Too many to fail? Evidence of regulatory forbearance when the banking
sector is weak. Rev. Financ. Stud. 24(4):1378–405
Brunnermeier M, Pedersen L. 2009. Market liquidity and funding liquidity. Rev. Financ. Stud.
22(6):2201–38
Brunnermeier MK, Crockett A, Goodhart CA, Persaud AD, Shin HS. 2009. The fundamental princi-
ples of financial regulation. Geneva Rep. World Econ. 11, Int. Cent. Monet. Bank. Stud.
Brunnermeier MK, Gorton G, Krishnamurthy A. 2010. Risk topography. Work. Pap., Princeton Univ.
Caballero RJ. 2009. The ‘other’ imbalance and the financial crisis. Work. Pap. 09-32, Dep.
Econ., MIT
Capuano C. 2008. The option-iPoD. The probability of default implied by option prices based on
entropy. IMF Work. Pap. 08/194
Caruana J. 2010a. Financial stability: ten questions and about seven answers. In Reserve Bank of
Australia 50th Anniversary Symposium, ed. C Kent, M Robson, pp. 53–76. Sydney: Res. Bank Aust.
Caruana J. 2010b. Macroprudential policy: Could it have been different this time? Presented at
People’s Rep. China Sem. Macroprud. Policy/IMF, Shanghai
Chan N, Getmansky M, Haas SM, Lo AW. 2006a. Do hedge funds increase systemic risk?
Fed. Reserve Bank Atlanta Econ. Rev. 91(4):49–80
Chan N, Getmansky M, Haas SM, Lo AW. 2006b. Systemic risk and hedge funds. In The Risks of
Financial Institutions, ed. M Carey, R Stulz, pp. 235–330. Chicago, IL: Univ. Chic. Press
Chan-Lau JA, Espinosa M, Giesecke K, Sole JA. 2009. Assessing the systemic implications of financial
linkages. Glob. Financ. Stab. Rep. Apr09:73–110, IMF, Washington, DC
Clement P. 2010. The term ‘macroprudential’: origins and evolution. BIS Q. Rev. 2010:59–67
Commodity Futures Trading Commission/Securities and Exchange Commission (CFTC/SEC).
2010. Findings regarding the market events of May 6, 2010. SEC/CFTC Staff Rep., Sep. 30.
http://www.sec.gov/news/studies/2010/marketevents-report.pdf
Danielsson J, Shin HS. 2003. Endogenous risk. In Modern Risk Management: A History, ed. P Field,
pp. 297–316. New York: Risk Books
De Bandt O, Hartmann P. 2000. Systemic risk: a survey. Work. Pap. 35, Eur. Cent. Bank
Demirguc-Kunt A, Kane E, Laeven L. 2008. Determinants of deposit-insurance adoption and design.
J. Financ. Intermed. 17(3):407–38
Duffie D. 2011. Systemic risk exposures: a 10-by-10-by-10 approach. Work. Pap., Stanf. Univ.
Espinosa-Vega M, Sole J. 2010. Cross-border financial surveillance: a network perspective. IMF
Work. Pap. WP/10/105, April
European Central Bank (ECB). 2010. Macro-prudential policy objectives and tools. Financ. Stab. Rev.
2010:129–37
Farmer JD, Foley D. 2009. The economy needs agent-based modelling. Nature 460:685–86
Feldman R, Lueck M. 2007. Are banks really dying this time? An update of Boyd and Gertler. Region
2007:6–51
Fender I, McGuire P. 2010a. Bank structure, funding risk and the transmission of shocks across
countries: concepts and measurement. BIS Q. Rev. 2010:63–79
Fender I, McGuire P. 2010b. European banks’ U.S. dollar funding pressures. BIS Q. Rev. 2010:57–64
Fielding E, Lo AW, Yang JH. 2011. The National Transportation Safety Board: a model for systemic
risk management. J. Invest. Manag. 9:18–50
Financial Stability Board (FSB). 2009. Guidance to assess the systemic importance of financial institu-
tions, markets and instruments: initial considerations. Rep. to g20 Finance Minist. Gov., IMF/
BIS/Sec. Financ. Stab. Board
Financial Stability Board / International Monetary Fund (FSB/IMF). 2010. The financial crisis and
information gaps progress report action plans and timetables. Work. Pap., Financ. Stab. Board
Flood M. 1992. The great deposit insurance debate. Fed. Reserve Bank St. Louis Rev. 74(4):51–77
Geanakoplos J. 2010. Solving the present crisis and managing the leverage cycle. FRBNY Econ. Policy
Rev. 16(1):101–31
294 Bisias et al.
Ann
u. R
ev. F
inan
c. E
con.
201
2.4:
255-
296.
Dow
nloa
ded
from
ww
w.a
nnua
lrev
iew
s.or
g A
cces
s pr
ovid
ed b
y M
assa
chus
etts
Ins
titut
e of
Tec
hnol
ogy
(MIT
) on
06/
19/1
7. F
or p
erso
nal u
se o
nly.

Getmansky M, Lo AW, Makarov I. 2004. An econometric model of serial correlation and illiquidity
in hedge fund returns. J. Financ. Econ. 74(3):529–609
Giesecke K, Kim B. 2011. Risk analysis of collateralized debt obligations. Oper. Res. 59(1):32–49
Gorton G, Metrick A. 2010. Regulating the shadow banking system. Brookings Pap. Econ. Act.
2010:261–312
Gray D, Jobst A. 2010. Systemic CCA—a model approach to systemic risk. Presented at Beyond Financ.
Crisis: Syst. Risk, Spillovers Regul., Deutsche Bundesbank/Technische Universitaet, Dresden
Group of Ten. 2001. Report on consolidation in the financial sector: Chapter III. Effects of consoli-
dation on financial risk. IMF Work. Pap.
Hamilton JD. 1994. Time Series Analysis. Princeton, NJ: Princeton Univ. Press
Hanson SG, Kashyap AK, Stein JC. 2011. A macroprudential approach to financial regulation.
J. Econ. Perspect. 25(1):3–28
Hirtle B, Schuermann T, Stiroh K. 2009. Macroprudential supervision of financial institutions: lessons
from the SCAP. Staff Rep. 409, Fed. Reserve Bank N.Y.
Hu X, Pan J, Wang J. 2010. Noise as information for illiquidity. Work. Pap., MIT
Huang X, Zhou H, Zhu H. 2009. Assessing the systemic risk of a heterogeneous portfolio of banks
during the recent financial crisis. Fed. Reserve Board Finance Econ. Discuss. Series 2009-44,
Board Gov. Fed. Reserve
Huizinga H, Laeven L. 2010. Bank valuation and regulatory forbearance during a financial crisis.
CEPRWork. Pap.
International Monetary Fund (IMF). 2009. Responding to the financial crisis and measuring systemic
risks. Glob. Financ. Stab. Rep. Apr-09:1–223, IMF, Washington, DC. http://www.imf.org/external/
pubs/ft/gfsr/2009/01/
International Monetary Fund (IMF). 2011. Grappling with crisis legacies. Glob. Financ. Stab.
Rep. Sep-11:1–178, IMF, Washington, DC. http://www.imf.org/external/pubs/ft/gfsr/2011/02/
index.htm
Kahneman D, Tversky A. 1979. Prospect theory: an analysis of decision under risk. Econometrica
47:263–91
Kane EJ. 1989. The S&L Insurance Mess: How Did It Happen? Washington, DC: Urban Inst. Press
Kapadia S, Drehmann M, Elliott J, Sterne G. 2009. Liquidity risk, cash flow constraints, and systemic
feedbacks. Work. Pap., Bank Engl.
Khandani AE, Kim AJ, Lo AW. 2010. Consumer credit risk models via machine-learning algorithms.
J. Bank. Finance 34(11):2767–87
Khandani AE, Lo AW. 2011. What happened to the quants in August 2007?: Evidence from factors
and transactions data. J. Financ. Mark. 14(1):1–46
Khandani AE, Lo AW, Merton RC. 2012. Systemic risk and the refinancing ratchet effect. J. Financ.
Econ. Forthcoming
Kocherlakota N. 2010. Modern macroeconomic models as tools for economic policy. Region
May:5–21
Kritzman M, Li Y. 2010. Skulls, financial turbulence, and risk management. Financ. Anal. J. 66(5):30–41
Kritzman M, Li Y, Page S, Rigobon R. 2010. Principal components as a measure of systemic risk.
Revere Str. Work. Pap. Ser. Financ. Econ. 272-28
Kyle A. 1985. Continuous auctions and insider trading. Econometrica 53:1315–35
Lerner J. 2002. Where does State Street lead?: A first look at financial patents, 1971–2000. J. Finance
57:901–30
Lo AW. 2011. Fear, greed, and financial crises: a cognitive neurosciences perspective. In Handbook on
Systemic Risk, ed. J Fouque, J Langsam. Cambridge, UK: Cambridge Univ. Press. Forthcoming
Lo AW, Newey WK. 2011. Temporal averaging and nonstationarity. Work. Pap., Lab. Financ. Eng., MIT
Loutskina E, Strahan PE. 2009. Securitization and the declining impact of bank finance on loan
supply: evidence from mortgage originations. J. Finance 64(2):861–89
Lucas D, ed. 2010. Measuring and Managing Federal Financial Risk. Chicago, IL: Univ. Chic. Press
www.annualreviews.org � Systemic Risk Analytics 295
Ann
u. R
ev. F
inan
c. E
con.
201
2.4:
255-
296.
Dow
nloa
ded
from
ww
w.a
nnua
lrev
iew
s.or
g A
cces
s pr
ovid
ed b
y M
assa
chus
etts
Ins
titut
e of
Tec
hnol
ogy
(MIT
) on
06/
19/1
7. F
or p
erso
nal u
se o
nly.

Lucas RE. 1976. Econometric policy evaluation: a critique. In The Phillips Curve and Labor Markets:
Carnegie-Rochester Conference Series on Public Policy 1, ed. K Brunner, A Meltzer, pp. 19–46.
New York: Elsevier
Mantegna R, Stanley E. 2000. An Introduction to Econophysics: Correlations and Complexity in
Finance. Cambridge, UK: Cambridge Univ. Press
Merton R. 1973. Theory of rational option pricing. J. Econ. Manag. Sci. 4:141–83
Merton R, Bodie Z. 1993. Deposit insurance reform: a functional approach. Carnegie-Rochester
Conf. Ser. Pub. Policy 38:1–34
Mishkin FS. 2007. Systemic risk and the international lender of last resort. Presented at Board Gov.
Int. Bank. Conf., 10th, Fed. Reserve Bank Chic.
Moussa A. 2011. Contagion and systemic risk in financial networks. PhD thesis. Columbia Univ.
Office of Financial Research (OFR). 2010. Statement on legal entity identification for financial
contracts. Fed. Reg. 75(229):74146–48
Office of Financial Research (OFR). 2011. Office of Financial Research Issues statement on progress to
date and next steps forward in the global initiative to establish a legal entity identifier (LEI). US Dep.
Treas. press release, Aug. 12. http://www.treasury.gov/press-center/press-releases/Pages/tg1275.aspx
Peltzman S. 1975. The effects of automobile safety regulation. J. Polit. Econ. 83:677–725
Pojarliev M, Levich RM. 2011. Detecting crowded trades in currency funds. Financ. Anal. J.
67(1):26–39
Pozsar Z, Adrian T, Ashcraft A, Boesky H. 2010. Shadow banking. Staff Rep. 458, Fed. Reserve
Bank N.Y.
Reinhart CM, Rogoff K. 2009. This Time Is Different: Eight Centuries of Financial Folly. Princeton,
NJ: Princeton Univ. Press
Ricks M. 2010. Shadow banking and financial regulation. Columbia Law Econ. Work. Pap. 370,
Law Sch., Harv. Univ.
Rochet J-C, Vives X. 2004. Coordination failures and the lender of last resort: Was Bagehot right
after all? J. Eur. Econ. Assoc. 2(6):1116–47
Rosengren ES. 2010. Asset bubbles and systemic risk. Presented at Glob. Interdepend. Cent. Conf.
Financ. Interdepend. World’s Post-Crisis Capital Mark., Philadelphia
Sapra H. 2008. Do accounting measurement regimes matter? A discussion of mark-to-market
accounting and liquidity pricing. J. Account. Econ. 45(2–3):379–87
Segoviano MA, Goodhart C. 2009. Banking stability measures. Financ. Mark. Group Discuss.
Pap. 627, Lond. Sch. Econ. Polit. Sci.
The ClearingHouse Association, Institute of International Bankers (TCH& IIB). 2011.Re: Assessment
of Methodology and Application of Surcharges to Global Systemically Important Banks, letter to
Basel Committee on Banking Supervision, August 26, 2011. http://www.theclearinghouse.org/
index.html?f=072754Valukas A. 2010. Report of Anton R. Valukas, Examiner, In re Lehman Brothers Holdings Inc., et al.,
Debtors. Chapter 11 Case No. 08-13555, Vol. 3. US Bankruptcy Court. South. Dist. NY Rep.
Vasicek O. 1991. Limiting loan loss probability distribution. KMV Work. Pap.
296 Bisias et al.
Ann
u. R
ev. F
inan
c. E
con.
201
2.4:
255-
296.
Dow
nloa
ded
from
ww
w.a
nnua
lrev
iew
s.or
g A
cces
s pr
ovid
ed b
y M
assa
chus
etts
Ins
titut
e of
Tec
hnol
ogy
(MIT
) on
06/
19/1
7. F
or p
erso
nal u
se o
nly.

vii
Annual Review of
Financial Economics
Volume 4, 2012Contents
Implications of the Dodd-Frank Act Viral V. Acharya and Matthew Richardson . . . . . . . . . . . . . . . . . . . . . . . . . 1
Valuation of Government Policies and ProjectsDeborah Lucas . . . . . . . . . . . . . . . . . . . . . . . . . . . . . . . . . . . . . . . . . . . . . 39
The Impacts of Automation and High Frequency Trading on Market QualityRobert Litzenberger, Jeff Castura, and Richard Gorelick . . . . . . . . . . . . . 59
Shadow Banking RegulationTobias Adrian and Adam B. Ashcraft . . . . . . . . . . . . . . . . . . . . . . . . . . . . 99
Narrow BankingGeorge Pennacchi . . . . . . . . . . . . . . . . . . . . . . . . . . . . . . . . . . . . . . . . . . 141
Federal Reserve Liquidity Provision during the Financial Crisis of 2007–2009Michael J. Fleming . . . . . . . . . . . . . . . . . . . . . . . . . . . . . . . . . . . . . . . . . 161
Effi cient Markets and the Law: A Predictable Past and an Uncertain FutureHenry T.C. Hu . . . . . . . . . . . . . . . . . . . . . . . . . . . . . . . . . . . . . . . . . . . . 179
Corporate Governance of Financial InstitutionsHamid Mehran and Lindsay Mollineaux . . . . . . . . . . . . . . . . . . . . . . . . 215
Corporate Finance and Financial InstitutionsMark J. Flannery. . . . . . . . . . . . . . . . . . . . . . . . . . . . . . . . . . . . . . . . . . . 233
A Survey of Systemic Risk Analytics Dimitrios Bisias, Mark Flood, Andrew W. Lo, and Stavros Valavanis . . . . . . . . . . . . . . . . . . . . . . . . . . . . . . . . . . . . . . . 255
Sovereign and Financial-Sector Risk: Measurement and InteractionsDale F. Gray and Samuel W. Malone . . . . . . . . . . . . . . . . . . . . . . . . . . . 297
Ann
u. R
ev. F
inan
c. E
con.
201
2.4:
255-
296.
Dow
nloa
ded
from
ww
w.a
nnua
lrev
iew
s.or
g A
cces
s pr
ovid
ed b
y M
assa
chus
etts
Ins
titut
e of
Tec
hnol
ogy
(MIT
) on
06/
19/1
7. F
or p
erso
nal u
se o
nly.

Regime Changes and Financial MarketsAndrew Ang and Allan Timmermann . . . . . . . . . . . . . . . . . . . . . . . . . . . 313
The Real Effects of Financial MarketsPhilip Bond, Alex Edmans, and Itay Goldstein. . . . . . . . . . . . . . . . . . . . 339
Economic Activity of Firms and Asset PricesLeonid Kogan and Dimitris Papanikolaou . . . . . . . . . . . . . . . . . . . . . . . 361
Consumption-Based Asset Pricing ModelsRajnish Mehra . . . . . . . . . . . . . . . . . . . . . . . . . . . . . . . . . . . . . . . . . . . . 385
Taxes and Investment ChoiceRobert M. Dammon and Chester S. Spatt . . . . . . . . . . . . . . . . . . . . . . . . 411
Closed-End Funds: A SurveyMartin Cherkes . . . . . . . . . . . . . . . . . . . . . . . . . . . . . . . . . . . . . . . . . . . . 431
Commodity InvestingK. Geert Rouwenhorst and Ke Tang . . . . . . . . . . . . . . . . . . . . . . . . . . . . 447
Market Microstructure and the Profi tability of Currency TradingCarol Osler. . . . . . . . . . . . . . . . . . . . . . . . . . . . . . . . . . . . . . . . . . . . . . . 469
Errata
An online log of corrections to Annual Review of Financial Economics articles may be found at http://fi nancial.annualreviews.org
viii Contents
Ann
u. R
ev. F
inan
c. E
con.
201
2.4:
255-
296.
Dow
nloa
ded
from
ww
w.a
nnua
lrev
iew
s.or
g A
cces
s pr
ovid
ed b
y M
assa
chus
etts
Ins
titut
e of
Tec
hnol
ogy
(MIT
) on
06/
19/1
7. F
or p
erso
nal u
se o
nly.


