

Report: D3.1:
A TYPOLOGY OF URBAN GREEN SPACES, ECO-
SYSTEM SERVICES PROVISIONING SERVICES
AND DEMANDS
Work package 3: Functional linkages Partners involved: UL, UBER, TUM, SRC, FCRA, UH, FFCUL
Researchers: C. Braquinho, R. Cvejić, K. Eler, P. Gonzales, D. Haase, R.Hansen, N. Kabisch, E.
Lorance Rall, J. Niemela, S. Pauleit, M. Pintar, R. Lafortezza, A. Santos, M.
Strohbach, K. Vierikko, Š. Železnikar Description: The report outlines the different types of urban green spaces, ESS provision-
ing and demand for green space as a part of the EU FP7 (ENV.2013.6.2-5-
603567) GREEN SURGE project (2013-2017)
Primary authors: Rozalija Cvejić, Klemen Eler, Marina Pintar, Špela Železnikar
(UL, Slovenia), Dagmar Haase, Nadja Kabisch, Michael Strohbach (UBER,
Germany)
V10 •May 13th2015

A TYPOLOGY OF URBAN GREEN SPACES, ECOSYSTEM SERVICES PROVISIONING SERVICES AND DEMANDS • WP3 • Page 2
LIST OF CONTRIBUTING PARTICIPANTS TO WP3
No. Legal name (short name) and working months Country Organisation type
1 Kobenhavns Universitet (UCPH) 5 Denmark Research Organisation
2 Helsingin Yliopisto (UH) 3 Finland Research Organisation
3 Humboldt Universität zu Berlin (UBER) 35 Germany Research Organisation
4 Technische Universität München (TUM) 6 Germany Research Organisation
5 Wageningen University (WU) 2 Netherlands Research Organisation
6 Stockholms Universitet (SRC) 8 Sweden Research Organisation
7 Forestry Commission Research Agency (FCRA) 10 United Kingdom Public Body
8 ICLEI European Secretariat (ICLEI Europe) 1 Germany SME
10 Università degli Studi di Bari 'Aldo Moro' (UNIBA) 1 Italy Research Organisation
13 Sveriges Lantbruksuniversitet (SLU) 6 Sweden Research Organisation
14 Fundação da Faculdade de Ciências 18
Da Universidade de Lisboa (FFCUL) Portugal Non-profit
Research Organisation
15 Univerza v Ljubljana (UL) 44 Slovenia Research Organisation
16 Technische Universität Berlin (TUB) 1 Germany Research Organisation
24 Eco-Metrica (ECO) 6 United Kingdom SME

A TYPOLOGY OF URBAN GREEN SPACES, ECOSYSTEM SERVICES PROVISIONING SERVICES AND DEMANDS • WP3 • Page 3
CONTENTS
1 INTRODUCTION 8
1.1 General introduction to the deliverable D3.1 8
1.2 Introduction to the urban green spaces inventory 9
1.3 Introduction to ecosystem service provisioning by urban green space 10
1.4 Introduction into the demand for urban green space 13
2 METHODOLOGY 14
2.1 Urban green space elements inventory 14
2.2 Assessment of urban green space demand for the two scale levels, European
Urban Atlas cities and Urban Learning Labs 15
2.2.1 European scale 15
2.2.2 Urban Learning Lab scale 17
3 RESULTS 18
3.1 Inventory of urban green space elements 18
3.1.1 Urban green space elements 18
3.1.2 Empirical evidence for functional links between urban green space elements
and ecosystem services 29
3.1.3 Assessments of selected urban green space elements for European and
Urban Learning Lab cities 46
3.2 Assessment of urban green space demand for the two scale levels, European
Urban Atlas cities and Urban Learning Labs 49
3.2.1 European scale 49
3.2.2 Urban Learning Lab scale 52
4 DISCUSSION 57
4.1 Urban green space elements inventory 57
4.2 Ecosystem service provisioning by urban green space 57
4.3 Assessment of urban green space demand for the two scale levels, Urban Learning
Lab and European Urban Atlas cities 58
5 REFERENCES 60
6 SUPPLEMENT 66
A TYPOLOGY OF URBAN GREEN SPACES, ECOSYSTEM SERVICES PROVISIONING SERVICES AND DEMANDS • WP3 • Page 4
LIST OF FIGURES
Figure 1: Green walls in the city of Augsburg, Germany. (Photo: M. Strohbach) 7
Figure 2: Ecosystem services as an integral of natural capital, goods and benefits for
human well-being and drivers of change (left) and different categories of ecosystem
services that ecosystems provide (right) (http://enviroatlas.epa.gov/enviroatlas) 12
Figure 3: Method for accessibility calculation in ARC GIS 16
Figure 4: The forest cover of the core city areas of Urban Atlas cities (EEA, 2010) in
percent shown for the bottom 20, top 20 and for the ULL cities Bari, Berlin,
Edinburgh, Ljubljana and Malmö. 46
Figure 5: The green urban areas cover of the core city areas of Urban Atlas cities (EEA,
2010) in percent shown for the bottom 20, top 20 and for the ULL cities Bari, Berlin,
Edinburgh, Ljubljana and Malmö. 46
Figure 6: The agricultural land, semi-natural areas, and wetland cover in the core city
areas of Urban Atlas cities (EEA, 2010) in percent shown for the bottom 20, top 20
and for the ULL cities Bari, Berlin, Edinburgh, Ljubljana and Malmö. 47
Figure 7: Share of city areas covered by forests. Calculation based on Urban Atlas data
(EEA 2010). 47
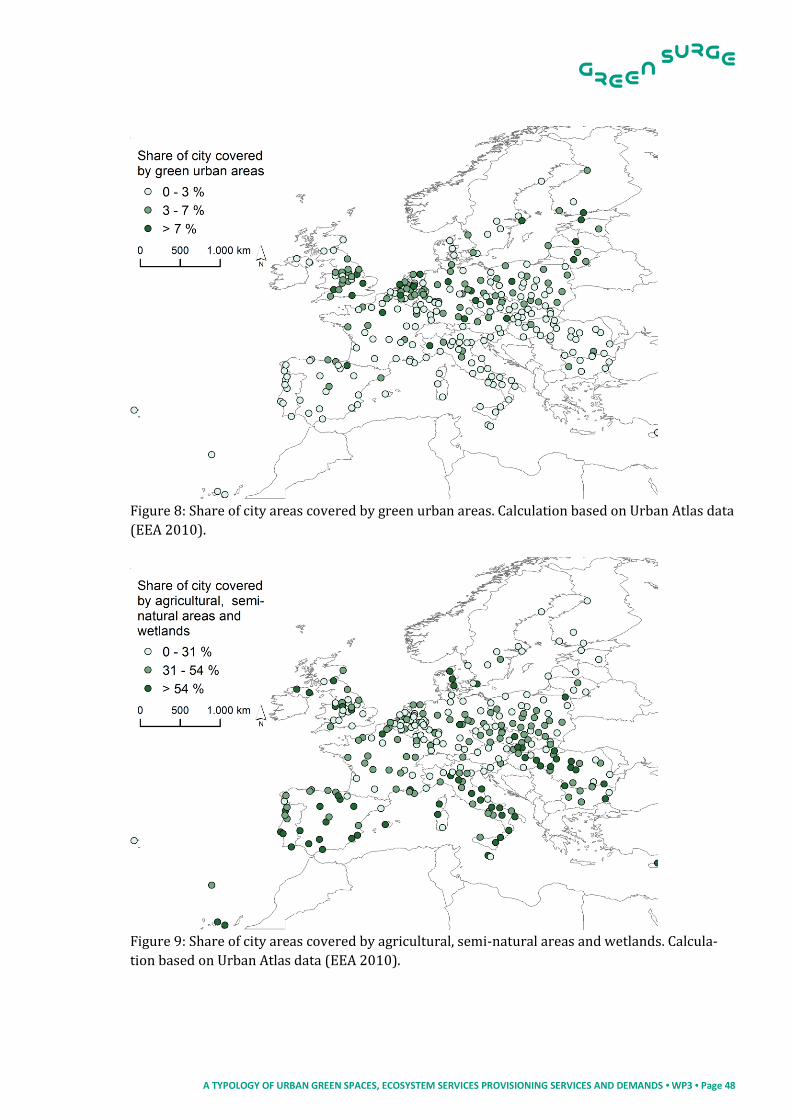
Figure 8: Share of city areas covered by green urban areas. Calculation based on Urban
Atlas data (EEA 2010). 48
Figure 9: Share of city areas covered by agricultural, semi-natural areas and wetlands.
Calculation based on Urban Atlas data (EEA 2010). 48
Figure 10: UGS in the ULL city Berlin. They cover 46 % of the city. Green roofs (detail in
frame on top right) cover only 0.1% of the city or 12% of the total building area
(Source: Senatsverwaltung für Stadtentwicklung und Umwelt Berlin). 49
Figure 11: Share of population with access to UGS (≥2 ha) within 500 m in administrative
city boundaries. Note: Calculation based on GEOSTAT 1 km² grid and Urban Atlas land
cover data. 52
Figure 12: Land use/cover as share of total area based on Urban Atlas 20006 (EEA,
2010). 54
Figure 13: Accessibility of urban green and forest areas of a minimum size of 2 ha within
500 m distance. Note: In colour are only those grid cells which are within a distance
to a 2ha green space. The respective colour of those grid cells represents the number
of people living in that grid cell. Calculation is based on GEOSTAT 1km² grid and
Urban Atlas land cover data. No street or public transport net was included in the
analysis. 55
Figure 14: Per capita green space (m²/inh.) and population density at district level for
the ULL cities Berlin and Ljubljana. 56

A TYPOLOGY OF URBAN GREEN SPACES, ECOSYSTEM SERVICES PROVISIONING SERVICES AND DEMANDS • WP3 • Page 5
LIST OF TABLES
Table 1: Data used for calculation of demand for UGS at European scale. 17
Table 2: Data used for calculation of demand for UGS at ULL scale 17
Table 3: The elements of the UGS inventory with a description and photos of examples.
The full inventory is stored in an excel spreadsheet. 18
Table 4: Empirical evidence for the connection between UGS and provisioning services.
Because no link between UGS and medicinal resources was found in this review, the
column is also not shown here. 31
Table 5: Empirical evidence for the connection between UGS and regulating services.
Pollination and biological control were removed from table because they are usually
provided by organisms and not particular UGS. Because no link between UGS and
erosion prevention and maintenance of soil fertility was found in this review, the
column is also not shown here. 34
Table 6: Empirical evidence for the connection between UGS and habitat or supporting
services. Because no link between UGS and maintenance of genetic diversity was
found in this review, the column is not shown here. 38
Table 7: Empirical evidence for the connection between UGS and cultural services. 42
Table 8: Land use/land cover area and per capita values for European urban regions 51
Table 9: Area of land cover/land use in the ULL case study cities. 53

A TYPOLOGY OF URBAN GREEN SPACES, ECOSYSTEM SERVICES PROVISIONING SERVICES AND DEMANDS • WP3 • Page 6
LIST OF ABBREVIATIONS
ESS ecosystem service
ULL Urban Learning Lab/ Urban Learning Labs
UGS urban green space/ urban green spaces
GI green infrastructure
DOW description of work
UGI urban green infrastructure
WP work package
PPP public private partnership
EU European Union

A TYPOLOGY OF URBAN GREEN SPACES, ECOSYSTEM SERVICES PROVISIONING SERVICES AND DEMANDS • WP3 • Page 7
Figure 1: Green walls in the city of Augsburg, Germany. (Photo: M. Strohbach)

A TYPOLOGY OF URBAN GREEN SPACES, ECOSYSTEM SERVICES PROVISIONING SERVICES AND DEMANDS • WP3 • Page 8
1 INTRODUCTION
1.1 General introduction to the deliverable D3.1
The concept of Green Infrastructure (GI) became increasingly important and prominent in the
last decade and across the different spheres of science, policy and planning. It is understood as a
strategic approach to develop “an interconnected network of green space that conserves natural
ecosystem values and functions, and that provides associated benefits to human populations”
(Benedict and McMahon, 2002). At the pan-European scale, the GI approach can be central to
achieving the 2020 biodiversity target (SCU-UWE, 2012; European Commission, 2013). Accord-
ing to the DOW of GREEN SURGE, “[…] urban GI is a planning approach aimed at creating net-
works of multifunctional green space in urban environments” (DOW, p11 and Milestone 34).
Historically, most cities were almost devoid of green spaces, but cities were relatively small and
most people lived in rural areas. It wasn’t until the 19th century that the importance of parks and
other urban green for residents was recognized to some extent (Swanwick et al., 2003). Today, it
is understood that urban green spaces (UGS) are essential for well-functioning and liveable cities
because they (1) play a recreational role in everyday life; (2) contribute to the conservation of
biodiversity; (3) contribute to the cultural identity of the city; (4) help maintaining and improv-
ing the environmental quality of the city; and (5) bring natural solutions to technical problems
(e.g., sewage treatment) in cities (Sandström 2002). Besides an ever growing evidence base for
the benefits of UGS, the increasing interest in them is driven by several other factors according to
Swanwick et all. (2003):
Widespread concern at the decline in the quality and condition of many parks and other ur-
ban green spaces due in part to their generally low priority in the political agenda at both
national and local levels;
Growing emphasis on the need for more intensive development in urban areas, focused
around the concept of the high-density 'compact city' as the model for future cities in Eu-
rope, raising questions about the role of green space in this model;
Parallel emphasis on the development of brownfield rather than greenfield land, and a
recognition that more intensive urban development may sometimes involve the sacrifice of
existing areas of urban green space […]
Within the strategy or the approach of urban green infrastructure (UGI), green space elements as
parts of the urban ecosystem, ranging from larger woodland and nature areas to private gardens,
green roofs to sustainable urban drainage systems, play a major role. Some of these elements, in
particular those which are privately owned, as well as vertical green elements, have been rarely
investigated in quantitative and functional terms. This is part of the work in WP3.
A TYPOLOGY OF URBAN GREEN SPACES, ECOSYSTEM SERVICES PROVISIONING SERVICES AND DEMANDS • WP3 • Page 9
According to the DOW of the GREEN SURGE project, WP3 studies the functional linkages be-
tween UGS and respective types of green infrastructure and the ecosystem services (ESS) pro-
vided by them on one hand, and their impacts on biodiversity, human health and well-being, so-
cial cohesion and green economy on the other hand.
The deliverable D3.1 is based on the results achieved with the fulfilment of the two following
tasks, and on the Milestones 23 and 24, dedicated to these tasks in the DOW:
Task 3.1: Identification, description and quantification of the full range of urban green spaces
This task will develop a comprehensive concept and listing of urban green spaces (i.e. different
types of urban green spaces) in urban settings varying from larger public parks, urban woodlands,
green fields and street/park trees to private green spaces such as gardens, allotments, and roof,
wall and domestic greenery as well as blue components such as lakes, rivers, riparian zones etc.
(joint task with WP2). Methods will include a specific literature and data review on urban green
space descriptions and analysis from different European cities including results from our own field
work, remote sensing results and relevant case studies from other continents for comparison
Task 3.2: Identification and quantification of the demand on ESS provided by urban green spaces
This task will involve identification and quantification of the demand on ESS provided by urban
green space at two scales, ULLs and Europe (Urban Atlas cities) (joint task with WP2). Methods will
include an extensive and criteria-based literature review on the demand on urban ESS at the spatial
level of specific cities (ULL and 15 reference cities) and across Europe using the Urban Atlas cities.
The review will result in quantitative rankings and qualitative models of urban ESS use by different
groups of beneficiaries including residents, planning institutions, economic actors and interest
groups.
The main part of this deliverable, consequently, includes the inventory of green space elements,
a list and a discussion of the potential ESS provisioning by different green space elements and an
analysis of the demand/accessibility of green spaces in European cities. In addition, for the pan-
European dataset of the Urban Atlas we show which UGS elements can be identified and quanti-
fied using data provided by the European Environment Agency (EEA).
1.2 Introduction to the urban green spaces inventory
Well-designed, well-managed, and well-connected green spaces are integral to the urban green
infrastructure (UGI) approach studied within GREEN SURGE. Green spaces, however, are very
diverse, ranging from city parks to green walls and rooftop gardens, from urban forests to allot-
ment gardens. They basically encompass all vegetation found in the urban environment but they
also include blue spaces such as lakes or rivers and their adjacent green. Because of this diversi-
ty, as a prerequisite for understanding how green spaces can be functionally connected with
each other and with the built environment as green infrastructure, an inventory of UGS elements
was compiled for the use within the entire GREEN SURGE project.

A TYPOLOGY OF URBAN GREEN SPACES, ECOSYSTEM SERVICES PROVISIONING SERVICES AND DEMANDS • WP3 • Page 10
Several inventories have been proposed, for example by Bell et al. (2007), who differentiated
between parks and gardens; natural and semi-natural spaces; green corridors; allotments, com-
munity gardens and urban farms; outdoor sport facilities; amenity green spaces; provision for chil-
dren and young people; cemeteries, disused churchyards and other burial grounds; other public
spaces. Swanwick et al. (2003) produced an inventory of 25 UGS types, falling into 10 subgroups
and four main groups (amenity green space, functional green space, semi-natural habitats, and
linear green space). Other inventories are grouped based on usage (Hofmann and Gerstenberg,
2014), based mainly on scale (Byrne and Sipe, 2010), or cover informal UGS (Rupperch and Byr-
ne, 2014). Some typologies combine UGS with other open spaces such as squares, pedestrian
areas, cycling areas (DTLR, 2002; Bell et al., 2006).
Probably no inventory can cover all the peculiarities that exist in European cities due to their
natural conditions (geomorphological, climatic, biological), historical backgrounds and social
demand. In addition, no inventory can be final – social initiatives, technological progress, envi-
ronmental awareness and creativity of city planners, urban dwellers and others perpetually lead
to new types of UGS (e.g., community gardens, roof allotments, rain gardens, bioswales, con-
structed wetlands but also mobile backyard gardens or different forms of guerrilla gardening).
The great diversity of UGS made it necessary to establish an inventory for the use within GREEN
SURGE, which has a distinct green-infrastructure-perspective as compared to existing invento-
ries. The resulting inventory in Milestone 23, which is part of this deliverable, is based on exiting
inventories, internal project meetings and discussions, and a commented draft disseminated to
all GREEN SURGE partners. Hence, it includes all UGS considered relevant for GREEN SURGE and
particularly for assessing the functional linkages between UGI on the one hand and ecosystem
services and biodiversity on the other.
1.3 Introduction to ecosystem service provisioning by urban green space
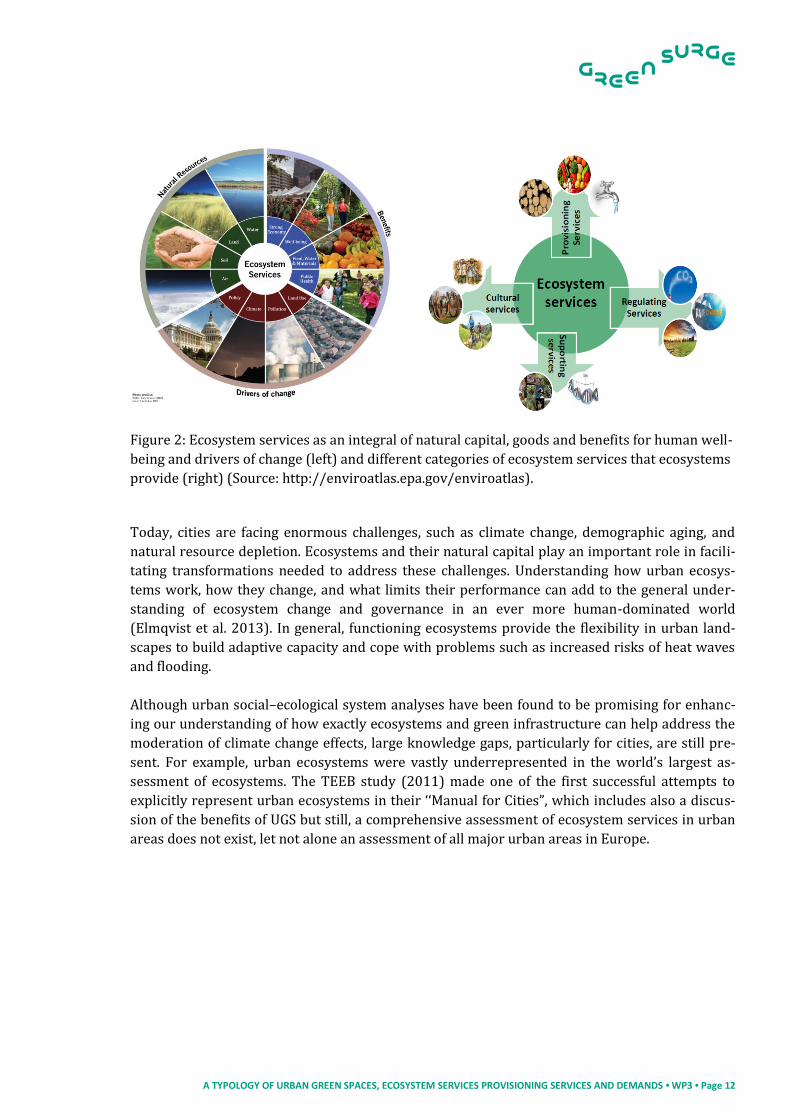
Ecosystem services are benefits people derive from the functioning of nature or from ecosystem
processes (Figure 2). In cities, we call these services urban ecosystem services (urban ESS; TEEB
2011; Haase et al., 2014). Urban ESS have been classified in a variety of ways; most commonly,
they are divided into four categories: provisioning services, regulating services, habitat or sup-
porting services, and cultural services (MEA 2005; Cowling et al. 2008; TEEB 2011). In more
detail, UES can be grouped into the following categories (EASAC, 2009; TEEB, 2011):
1. Provisioning Services are ecosystem services that describe the material or energy out-
puts from ecosystems. They include: Raw materials: Ecosystems provide a diversity of materials for fuel and con-
struction (plant oils, biofuels and wood that are directly derived from wild and cultivated plant species).
Fresh water: Ecosystems play a vital role in the global hydrological cycle, as they regulate the flow and purification of water.
Food: Ecosystems provide the conditions for growing food. Medicinal resources: Ecosystems provide plants used as traditional medi-
cines and raw materials for the pharmaceutical industry.

A TYPOLOGY OF URBAN GREEN SPACES, ECOSYSTEM SERVICES PROVISIONING SERVICES AND DEMANDS • WP3 • Page 11
2. Regulating Services are the services that ecosystems provide by acting as regulators.
Local climate and air quality: Ecosystems regulate air quality, provide
shade and influence rainfall and water availability, removing pollutants from
the atmosphere,
Carbon sequestration and storage: Ecosystems store and sequester green-
house gases, remove carbon dioxide from the atmosphere, improve the capac-
ity of ecosystems to adapt to the effects of climate change.
Moderation of extreme events: Ecosystems moderate extreme weather
events or natural hazards (storms, tsunamis, floods, avalanches,...), ecosys-
tems and living organisms create buffers against natural disasters.
Waste-water treatment: Ecosystems filter both animal and human waste
and act as a natural buffer to the surrounding environment.
3. Cultural services include the non-material, socio-ecological benefits (including psycho-
logical and cognitive benefits) people obtain from contact with the environment.
Recreation, physical and mental health (for example walking or play-
ing sports in green areas)
Tourism
Aesthetic appreciation and inspiration for culture, art and design
Spiritual experience and sense of place: different sacred places or plac-
es with a religious meaning.
4. Habitat and supporting services underpin almost all other services by providing living
spaces for organisms.
Habitats for species
Maintenance of genetic diversity.
The Millennium Ecosystem Assessment concluded that 60 % of the world’s ecosystems are de-
graded or used unsustainably, having adverse effects on ESS provisioning and human well-being
(MEA 2005). Because almost no ecosystem remains un-impacted by humans and humans cannot
exist without ecosystems, protection and sustainable use of ecosystems are no longer an isolated
interest but a key element of global sustainable development. The observed rapid degradation of
the ability of ecosystems to generate services not only necessitates a better understanding of
how to maintain important ecosystem functions but also requires that this knowledge is put into
a broad institutional and governance context (TEEB 2011).
A TYPOLOGY OF URBAN GREEN SPACES, ECOSYSTEM SERVICES PROVISIONING SERVICES AND DEMANDS • WP3 • Page 12
Figure 2: Ecosystem services as an integral of natural capital, goods and benefits for human well-
being and drivers of change (left) and different categories of ecosystem services that ecosystems
provide (right) (Source: http://enviroatlas.epa.gov/enviroatlas).
Today, cities are facing enormous challenges, such as climate change, demographic aging, and
natural resource depletion. Ecosystems and their natural capital play an important role in facili-
tating transformations needed to address these challenges. Understanding how urban ecosys-
tems work, how they change, and what limits their performance can add to the general under-
standing of ecosystem change and governance in an ever more human-dominated world
(Elmqvist et al. 2013). In general, functioning ecosystems provide the flexibility in urban land-
scapes to build adaptive capacity and cope with problems such as increased risks of heat waves
and flooding.
Although urban social–ecological system analyses have been found to be promising for enhanc-
ing our understanding of how exactly ecosystems and green infrastructure can help address the
moderation of climate change effects, large knowledge gaps, particularly for cities, are still pre-
sent. For example, urban ecosystems were vastly underrepresented in the world’s largest as-
sessment of ecosystems. The TEEB study (2011) made one of the first successful attempts to
explicitly represent urban ecosystems in their ‘‘Manual for Cities”, which includes also a discus-
sion of the benefits of UGS but still, a comprehensive assessment of ecosystem services in urban
areas does not exist, let not alone an assessment of all major urban areas in Europe.

A TYPOLOGY OF URBAN GREEN SPACES, ECOSYSTEM SERVICES PROVISIONING SERVICES AND DEMANDS • WP3 • Page 13
1.4 Introduction into the demand for urban green space
Urban residents’ mental and physical health and well-being can benefit from the ecosystem ser-
vices provided by green spaces. The demand for UGS can therefore be roughly approximated by
the number of urban population. The application of per capita UGS values and accessibility
threshold values can provide a broad overview-kind of assessment of green space provision for a
whole city without looking into the inner differentiation of the city itself (Larondelle and Haase,
2013). Green spaces can be broadly defined as any vegetated areas found in the urban environ-
ment, including parks, forests, open spaces, lawns, residential gardens, or street trees (see 1.2).
For the purpose of this analysis, a narrower definition is used (see 2.2).
The benefits of green space are broad and diverse (for an overview see a review by Kabisch et al.,
2015): UGS help to preserve and enhance biodiversity within urban ecosystems (Tzoulas et al.,
2007). Green spaces provide fresh air, reduce noise and elevated air temperatures through their
cooling capabilities (Bowler et al., 2010; Spronken-Smith and Oke, 1998). Social benefits include
positive influence on psychological and mental health (Ulrich et al., 1991; Völker and Kistemann,
2013) via stress reduction (Chiesura, 2004; Kaplan, 1985) and relaxation (Kuo et al., 1998).
Within a broader social view, UGS act as meeting places in neighbourhoods (Martin et al., 2004)
and play an important role in the interactions of residents of different population groups with
others in their community by providing space (Kabisch and Haase, 2014). Finally, UGS often pro-
vide the primary contact with local flora and fauna and the natural environment for urban resi-
dents and thus increase environmental learning (Krasny et al., 2013).
Because of the many benefits green spaces provide, their availability and accessibility to resi-
dents in cities have been the focus of planning and research for some time. Van Herzele and
Wiedemann (2003) applied a spatial GIS (Geographical Information System)-based indicator
system to cities in Belgium to plan accessible and attractive green spaces. Germann-Chiari and
Seeland (2004) used GIS and regression analyses to assess the distribution and access of UGS by
social target groups in three cities in Switzerland. Comber et al. (2008) used a GIS approach for
Leicester, UK, to assess UGS accessibility for different ethnic and religious groups. Balram and
Dragićević (2005) used multiple methods involving semi-structured interviews and a collabora-
tive GIS workshop for accessibility assessments. In the US, the focus of research and planning has
been on the distribution of tree canopy rather than green space. Heynen (2003) for example,
found that minorities and residents with low socio-economic status had a lower canopy cover in
their neighbourhood. Danford et al. (2014) studied the difficulties in reaching an equitable tree
canopy distribution in Boston, MA, USA.
Some European cities provide per capita threshold values for UGS or for minimum accessibility
for a defined area. For instance, the city of Berlin, Germany, aims at providing at least 6 m² urban
green per person (Senatsverwaltung für Stadtentwicklung und Umwelt, 2013), while Leipzig,
Germany, aims at 10 m² per capita (Stadt Leipzig, 2003). In the UK, it is recommended that – as a
national target – city residents should have access to a natural green space of minimum 2 ha
within a distance of 300 m from home (Handley et al., 2003). Berlin’s Department of Urban De-
velopment and the Environment recommends that every resident should have access to urban
green of minimum 0.5 ha within a 500 m distance from home. Similarly, Hutter et al., (2004) rec-
ommend green space of 1.0 – 10 ha for every resident within 500 m.
A TYPOLOGY OF URBAN GREEN SPACES, ECOSYSTEM SERVICES PROVISIONING SERVICES AND DEMANDS • WP3 • Page 14
2 METHODOLOGY
2.1 Urban green space elements inventory
The inventory is based on existing inventories and general literature on UGS1, internal project
meetings and discussions, and a commented draft disseminated to all GREEN SURGE partners.
Moreover, several revisions of the database prepared for Milestone 23 were included in the cur-
rent typology. Thus, the inventory reflects the needs of GREEN SURGE but can also serve needs
from outside the project. As it is linked to Urban Atlas and Corine land use/ land cover, it bridges
scales from regional to local. It also supports cross-city comparisons. The inventory includes
green, partly green and grey as well as blue spaces (waters, wetlands). It also includes green
space usually not considered urban, but which can be located close to the city or even within the
city itself (like arable land, forests, grasslands, sparsely vegetated areas). Thus, the inventory can
also be applied to larger urban regions.
The UGS inventory is contained in a spreadsheet with four tabs: Definitions, UGS elements, Urban
Atlas legend and the Corine land cover (CLC) legend. The main tab of the spreadsheet is UGS ele-
ments. There, each UGS is listed and grouped into one of eight broader categories (based mainly
on scale, location within city and function). Additional columns in the spreadsheet are:
synonyms if available;
a description of each element;
a column where it is indicated if the element concerns a green or a blue space;
a column indicating the type of management of the UGS, either in form of state, coopera-
tions, institutions, PPP, associations, private etc.;
a column indicating whether the UGS element is private or publicly accessible;
a column which indicates if public engagement or stewardship is generally possible in
regards to the respective element;
a column highlighting possible data sources if data is used for certain purposes;
column indicating data availability for ULL;
column indicating data availability at European scale (i.e. if an element can be identified
on the European data level (Urban Atlas) scale);
three columns that show corresponding land cover types (CORINE), land use types (Ur-
ban Atlas) and habitat types (EUNIS);
urban ecosystem services based on the TEEB for city categories (TEEB 2011). The col-
umns contain empirical evidence from the literature for functional links between the UGS
elements and ESS.
1 Ahern (2007); Alberti (2008); Baycan-Levent et al. (2009); Bell et al. (2006); Bell et al. (2007); Benedict and McMahon (2001); Bolund and Hunhammar (1999); Botkin and Beveridge(1997); Byrne and Sipe (2010); Cameron et al. (2012); Carr et al. (1992); Comber et al. (2008); DTLR (2002); Dunnett et al. (2002); EEA (2007); EEA (n.d.); Hofmann et al. (2014); Kabisch et al. (2015); Keeley et al. (2013); Kowarik et al. (2011); Landscape Institute (2009); McMahon (2000); Natural England (2009); Neuenschwander et al. (2014); Niemelä et al. (2010); Pfoser (2012); Rupprecht et al. (2014); Sadler et al. (2010); Sandström et al. (2002); Swanwick et al. (2003); Tzoulas et al. (2007); Van Herzele and Wiedemann (2003); Van Leeuwen et al. (2010); Völker and Kistemann (2013); Wooley (2003)

A TYPOLOGY OF URBAN GREEN SPACES, ECOSYSTEM SERVICES PROVISIONING SERVICES AND DEMANDS • WP3 • Page 15
We include the corresponding Urban Atlas and Corine land cover classes, because these two pub-
licly available land use/cover data sets are used for UGS and related ESS analysis and quantifica-
tion on EU level. Some of the columns are still empty and need input after extensive discussion
with project partners and also in-depth analyses during the project. Therefore, we emphasize
that this work and the whole inventory is a living document which will be further developed and
completed during the whole project time.
2.2 Assessment of urban green space demand for the two scale levels, European Urban Atlas cities and Urban
Learning Labs
2.2.1 European scale
To assess the demand for UGS, both land use data (land cover data) and demographic data are
used for calculation of statistical and GIS models. Land cover data stem from the European Urban
Atlas land cover dataset obtained from (EEA 2010). The data in the Urban Atlas refer to 301
larger urban zones which refer to commuting zones around cities. Urban Atlas data are based on
satellite images with a 2.5 m spatial resolution and, thus it provides comparable land use data for
all of the European core cities and respective larger urban zones with more than 100,000 inhab-
itants. The analyses in Milestone 24 and this deliverable focus exclusively on the core cities.
Therefore, core cities were delineated using the core city layer from the Urban Audit (European
Commission, 2004), which refers to administrative city boundaries.
In the Urban Atlas, 21 thematic classes, including diverse urban fabric, transportation, industrial
and environmental classes, are distinguished (EEA, 2010). This classification of urban land cover
and land use is, thus, finer than commonly used datasets of land-cover/land use. In particular,
the Urban Atlas includes groups of different urban fabric classes according to density and a ‘‘land
without current use’’ class, which represents brown fields. For green assessments the classes
“green urban areas” and “forest areas” are used. Unfortunately, the class “agricultural areas,
semi-natural areas and wetlands” combines land that can potentially serves as green space (i.e.
grasslands, semi-natural land) with land of low recreational value (i.e. arable land). We therefore
excluded it from our analysis. We also decided not to include Urban Atlas class 142 “sports and
leisure facilities” in our definition of UGS because “sports and leisure facilities” includes race
courses and areas of sport compounds (e.g., football stadiums, tennis courts, golf courses), which
a) can be covered by hard surfaces (except of golf courses) to a high degree, and b) might be not
publicly available and thus not accessible to all urban residents (they may provide other im-
portant ESS, nevertheless). Both restrictions might lead to an underestimation of both per capita
green space values and its accessibility. The Urban Atlas land use data refer to the year 2006 (a
follow-up version that should be based on 2012 imagery is in preparation and expected to be
published in 2015).
Population data is provided by the Urban Audit Data Explorer (http://www.eea.europa.eu/data-
and-maps/data/external/urban-audit-database) and by national statistical agencies and are
used to calculate per capita values. The data refer to the selection period 2012/2013 and are
provided for core cities and are, thus, comparable to the Urban Atlas spatial delineation (see

A TYPOLOGY OF URBAN GREEN SPACES, ECOSYSTEM SERVICES PROVISIONING SERVICES AND DEMANDS • WP3 • Page 16
Kabisch and Haase, 2013 for a methodological comparison). In total, 290 cities in 26 countries
are part of this analysis. We had to exclude some of the Urban Atlas cities were no or insufficient
population data was available.
Using both, Urban Atlas data and population data, we calculated the total amount of the land use
classes per city and the per capita values of green spaces provision on city level.
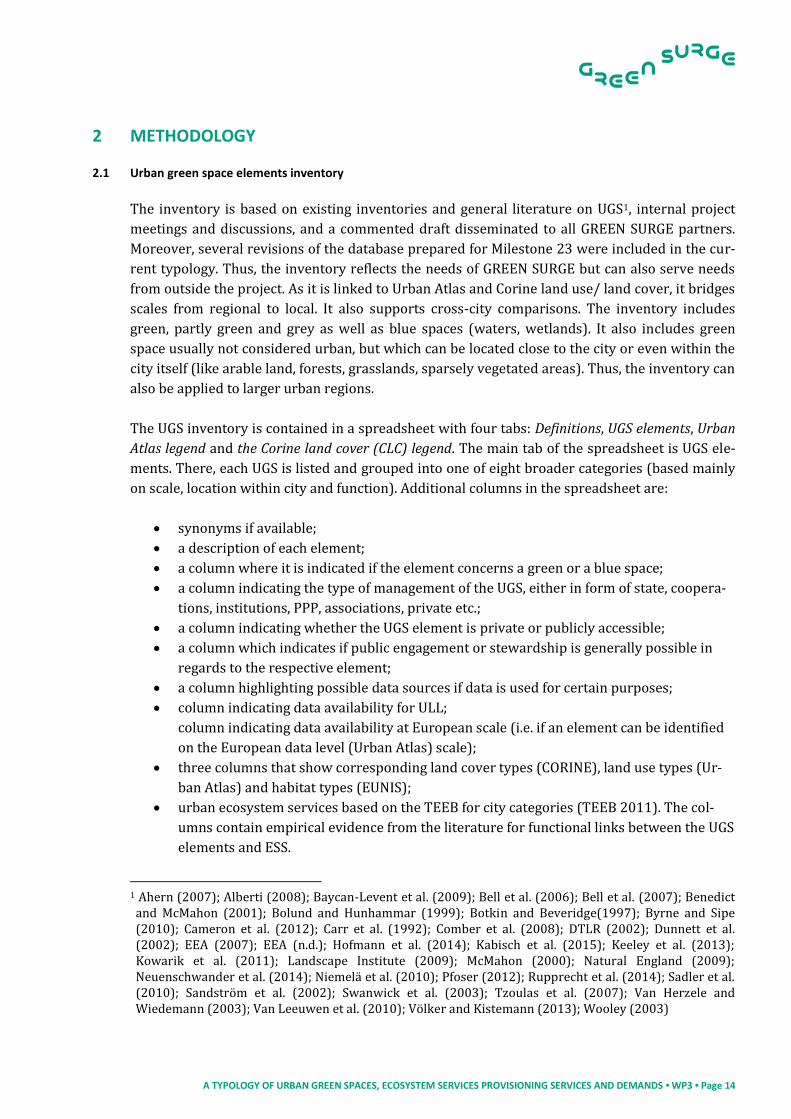
Finally, the 1 km² grid dataset of population data for the EU from 2011 was used for calculating
the access to green space (≥ 2 ha) within a 500 m distance. The grid dataset was produced by the
ESSnet project GEOSTAT which was launched in co-operation with the European Forum for Geo-
Statistics (EFGS). For accessibility calculations, a 500 m buffer around green and forest areas
within administrative boundaries of cities was calculated within GIS (ARCMap 10.0, Figure 3). All
grid cells which had their centroids within the city area were selected and respective population
numbers were aggregated per cities. Then the grid cells were combined with the buffer of the
green space (using the Arc Map toolbox function “intersect”). If a grid cell was only partly within
the buffer zone, percentage share of area within buffer was calculated and used for calculating
the respective population numbers within this part of the grid cell. All data used for calculation
at European scale is presented in Table 1.
Figure 3: Method for accessibility calculation in ARC GIS
A TYPOLOGY OF URBAN GREEN SPACES, ECOSYSTEM SERVICES PROVISIONING SERVICES AND DEMANDS • WP3 • Page 17
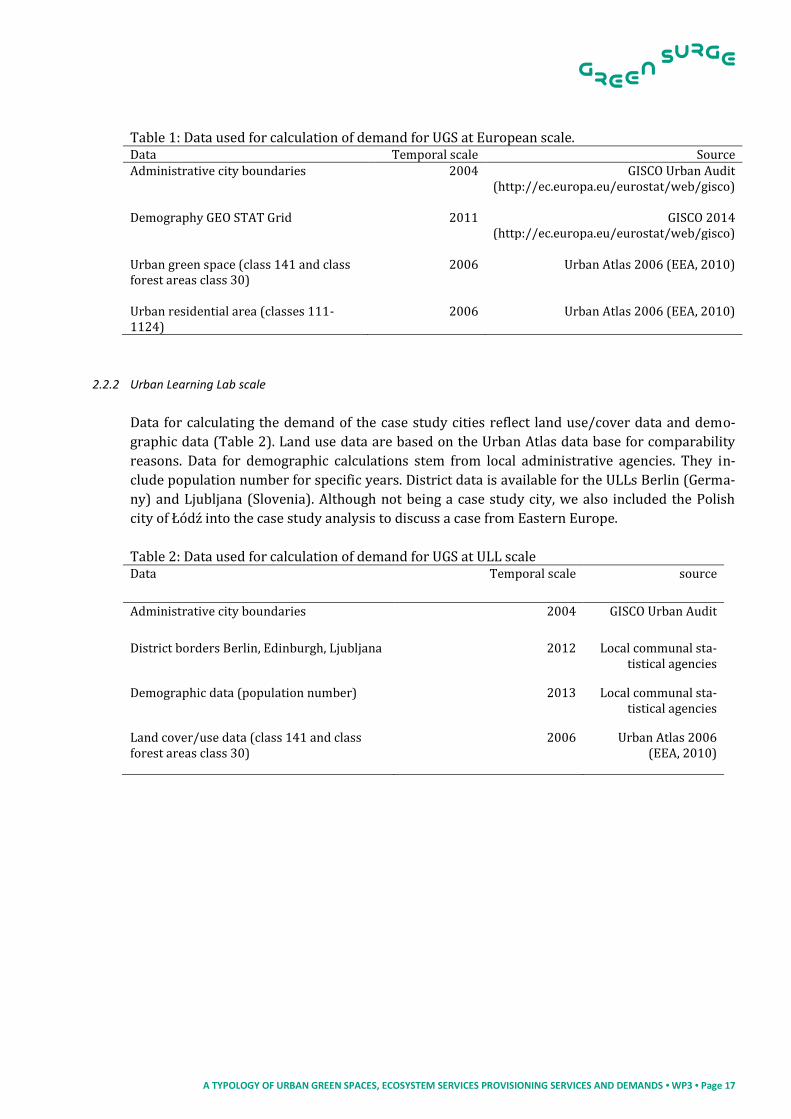
Table 1: Data used for calculation of demand for UGS at European scale. Data Temporal scale Source Administrative city boundaries 2004 GISCO Urban Audit
(http://ec.europa.eu/eurostat/web/gisco) Demography GEO STAT Grid
2011
GISCO 2014
(http://ec.europa.eu/eurostat/web/gisco) Urban green space (class 141 and class forest areas class 30)
2006
Urban Atlas 2006 (EEA, 2010)
Urban residential area (classes 111-1124)
2006 Urban Atlas 2006 (EEA, 2010)
2.2.2 Urban Learning Lab scale
Data for calculating the demand of the case study cities reflect land use/cover data and demo-
graphic data (Table 2). Land use data are based on the Urban Atlas data base for comparability
reasons. Data for demographic calculations stem from local administrative agencies. They in-
clude population number for specific years. District data is available for the ULLs Berlin (Germa-
ny) and Ljubljana (Slovenia). Although not being a case study city, we also included the Polish
city of Łódź into the case study analysis to discuss a case from Eastern Europe.
Table 2: Data used for calculation of demand for UGS at ULL scale Data Temporal scale source
Administrative city boundaries 2004 GISCO Urban Audit
District borders Berlin, Edinburgh, Ljubljana 2012 Local communal sta-tistical agencies
Demographic data (population number) 2013 Local communal sta-tistical agencies
Land cover/use data (class 141 and class forest areas class 30)
2006 Urban Atlas 2006 (EEA, 2010)

A TYPOLOGY OF URBAN GREEN SPACES, ECOSYSTEM SERVICES PROVISIONING SERVICES AND DEMANDS • WP3 • Page 18
3 RESULTS
3.1 Inventory of urban green space elements
3.1.1 Urban green space elements
The inventory contains 44 UGS elements (Table 3). They fall into eight categories (Table 4). More
detail can be found in the living document spreadsheet.
Table 3: The elements of the UGS inventory with a description and photos of examples. The full
inventory is stored in an excel spreadsheet.
No. UGS element Description Example
01 balcony green Plants in balcony and ter-
races, planted mostly in
pots.
02 ground based green wall Ground based climbing
plants intended for orna-
mental (and sometimes
food production) purposes.
03 facade-bound green wall Plants growing in facade-
bound substrate, e.g. con-
tainers or textile-systems.

A TYPOLOGY OF URBAN GREEN SPACES, ECOSYSTEM SERVICES PROVISIONING SERVICES AND DEMANDS • WP3 • Page 19
No. UGS element Description Example
04 extensive green roof Roof vegetation on thin
substrate with little or no
irrigation and management.
Vegetation established ei-
ther artificially by seeding or
planting or naturally: moss-
es, succulents, few herbs
and grasses.
05 intensive green roof Roof vegetation on thick
substrate with irrigation and
management. Vegetation
established either artificially
by seeding or planting or
naturally: perennials, grass-
es, small tress, rooftop
farming.
06 atrium Green area surrounded /
enclosed in a building
planted mostly with orna-
mental plants.
07 bioswale Vegetated and gently
sloped pit for filtering sur-
face runoff.

A TYPOLOGY OF URBAN GREEN SPACES, ECOSYSTEM SERVICES PROVISIONING SERVICES AND DEMANDS • WP3 • Page 20
No. UGS element Description Example
08 tree alley and street tree,
hedge Trees planted along roads
and paths either solitary or
in rows. Hedges along roads
or paths.
9 street green and green
verge Non-tree, mostly shrubby or
grassy verges along roads or
other built or natural ele-
ment
10 house garden Areas in immediate vicinity
of private houses cultivated
mainly for ornamental pur-
poses and/or non-
commercial food produc-
tion.
11 railroad bank Green space along railroads.
A TYPOLOGY OF URBAN GREEN SPACES, ECOSYSTEM SERVICES PROVISIONING SERVICES AND DEMANDS • WP3 • Page 21
No. UGS element Description Example
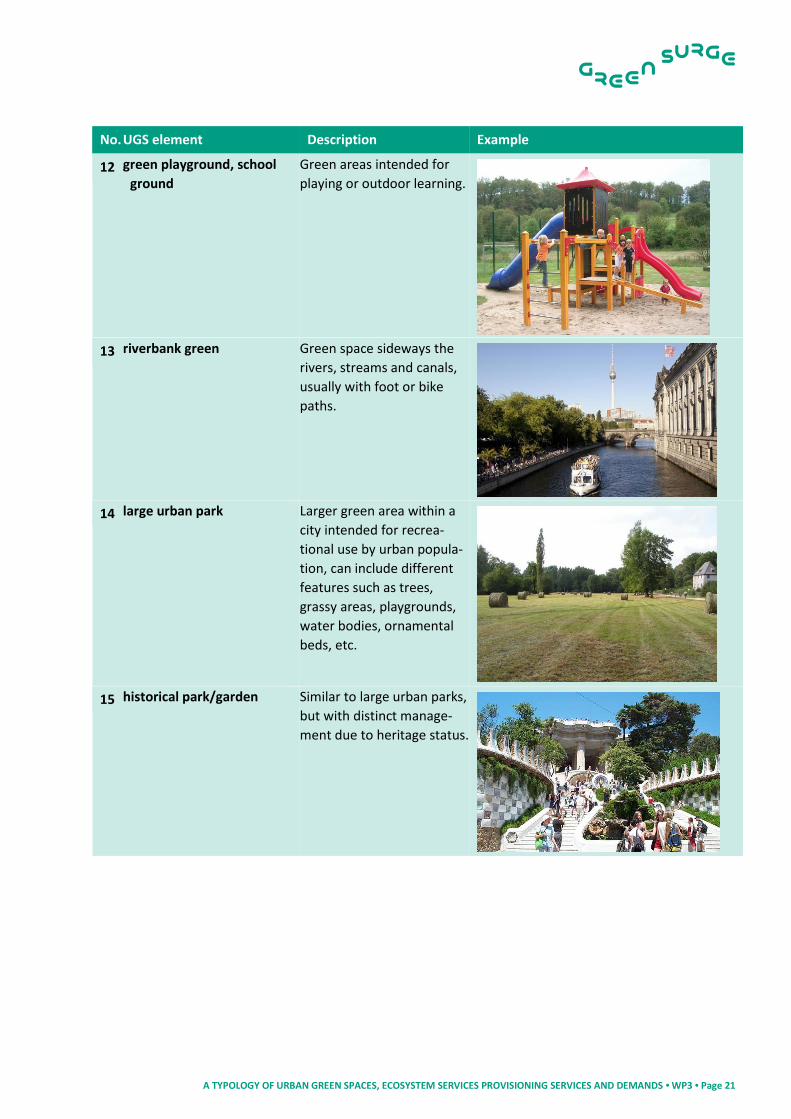
12 green playground, school
ground Green areas intended for
playing or outdoor learning.
13 riverbank green Green space sideways the
rivers, streams and canals,
usually with foot or bike
paths.
14 large urban park Larger green area within a
city intended for recrea-
tional use by urban popula-
tion, can include different
features such as trees,
grassy areas, playgrounds,
water bodies, ornamental
beds, etc.
15 historical park/garden Similar to large urban parks,
but with distinct manage-
ment due to heritage status.

A TYPOLOGY OF URBAN GREEN SPACES, ECOSYSTEM SERVICES PROVISIONING SERVICES AND DEMANDS • WP3 • Page 22
No. UGS element Description Example
16 pocket park Small park-like areas around
and between buildings veg-
etated by ornamental trees
and grass, publicly accessi-
ble.
17 botanical garden Educational and ornamental
areas planted with large
diversity of plant species.
18 zoological garden Areas with animals kept in
cages and enclosures often
combined with planted
trees, ornamental beds and
cultivated grass.
19 neighbourhood green
space Semi-public green spaces,
vegetated by grass, trees
and shrubs in multi-story
residential areas.

A TYPOLOGY OF URBAN GREEN SPACES, ECOSYSTEM SERVICES PROVISIONING SERVICES AND DEMANDS • WP3 • Page 23
No. UGS element Description Example
20 institutional green space Green spaces surrounding
public and private institu-
tions and corporation build-
ings.
21 cemetery and churchyard Burial ground often with
covered by lawns, trees and
other ornamental plants.
22 green sport facility Intensively cultivated and fertilized grass turf toler-ant to frequent trampling for sport activities (e.g., golf courses, football fields).
23 camping area Green areas reserved for
camping.

A TYPOLOGY OF URBAN GREEN SPACES, ECOSYSTEM SERVICES PROVISIONING SERVICES AND DEMANDS • WP3 • Page 24
No. UGS element Description Example
24 allotment Small garden parcels culti-
vated by different people,
intended for non-
commercial food production
and recreation.
25 community garden Areas, collectively gardened
by a community for food
and recreation.
26 arable land Regularly ploughed arable
land for crop production.
27 grassland Pastures or meadows.

A TYPOLOGY OF URBAN GREEN SPACES, ECOSYSTEM SERVICES PROVISIONING SERVICES AND DEMANDS • WP3 • Page 25
No. UGS element Description Example
28 tree meadow/ meadow
orchard Fruit and nut trees, mixed
agricultural and fruit or
biofuel production.
29 biofuel production / agro-
forestry
Land devoted to dedicated
biofuels like short rotation
coppice.
30 horticulture Land devoted to growing
vegetables, flowers, berries,
etc.
31 forest (remnant woodland,
managed forest, mixed
forms)
Natural or planted areas of
dense tree vegetation.

A TYPOLOGY OF URBAN GREEN SPACES, ECOSYSTEM SERVICES PROVISIONING SERVICES AND DEMANDS • WP3 • Page 26
No. UGS element Description Example
32 shrubland Natural or secondary shrub-
land, e.g., heath, macchia,
etc.
33 abandoned, ruderal and
derelict area Recently abandoned areas,
construction sites, etc. With
spontaneously occurring
pioneer or ruderal vegeta-
tion.
34 rocks Areas covered by sparsely
vegetated rocky areas.
35 sand dunes Areas covered by sparsely
vegetated sandy areas,
shaped by wind or water.

A TYPOLOGY OF URBAN GREEN SPACES, ECOSYSTEM SERVICES PROVISIONING SERVICES AND DEMANDS • WP3 • Page 27
No. UGS element Description Example
36 sand pit, quarry, open cast
mine
Sites with removed top soil
and vegetation for resource
extraction.
37 wetland, bog, fen, marsh Areas with soil permanently
or periodically saturated
with water and characteris-
tic flora and fauna.
38 lake, pond Natural and artificial stand-
ing water bodies containing
non-saline water with
(semi)natural aquatic com-
munities, banks artifi-
cial/managed or natural.
39 river, stream Running waters, including
springs, streams and tem-
porary water courses,
riverbanks artificial/ man-
aged or natural.
40 dry riverbed, rambla Land depression formed by
flowing water but usually
dry. Can be managed or
unmanaged and is usually
rich in biodiversity and of-
ten used for recreation.
A TYPOLOGY OF URBAN GREEN SPACES, ECOSYSTEM SERVICES PROVISIONING SERVICES AND DEMANDS • WP3 • Page 28
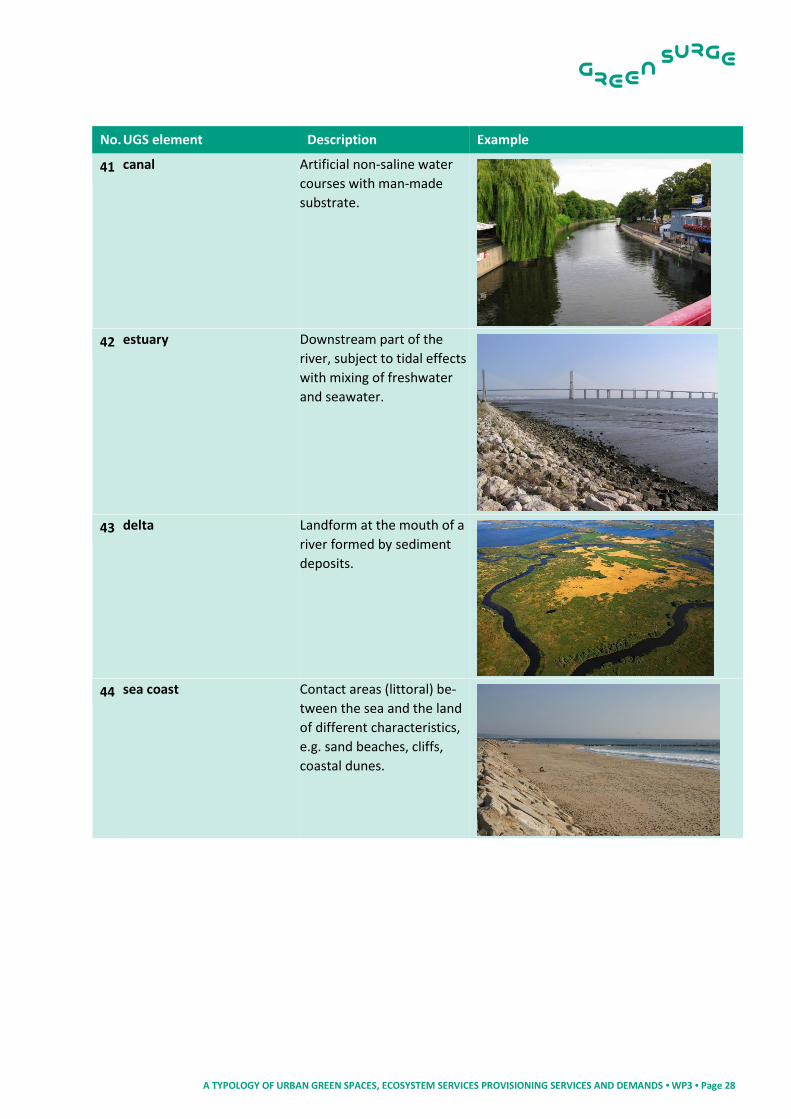
No. UGS element Description Example
41 canal Artificial non-saline water
courses with man-made
substrate.
42 estuary Downstream part of the
river, subject to tidal effects
with mixing of freshwater
and seawater.
43 delta Landform at the mouth of a
river formed by sediment
deposits.
44 sea coast Contact areas (littoral) be-
tween the sea and the land
of different characteristics,
e.g. sand beaches, cliffs,
coastal dunes.

A TYPOLOGY OF URBAN GREEN SPACES, ECOSYSTEM SERVICES PROVISIONING SERVICES AND DEMANDS • WP3 • Page 29
3.1.2 Empirical evidence for functional links between urban green space elements and ecosystem services
In the following section, we present evidence from the literature for functional links between
UGS elements and ESS (Table 4 -

A TYPOLOGY OF URBAN GREEN SPACES, ECOSYSTEM SERVICES PROVISIONING SERVICES AND DEMANDS • WP3 • Page 30
Table 7). There are several field studies and modelling attempts running in GREEN SURGE that
will identify estimates of ecosystem services provisioning of single elements of UGS in more de-
tail, such as allotment gardens, parks, brownfields and meadows. The quantitative results of
these studies will be included into the living documents spreadsheet of UGS elements later in the
project. So far, we highlight the contribution of UGS types to ESS provisioning in a semi-
quantitative, more qualitative way based on a selective review of literature which includes the
paper database of a large review about urban ecosystem services (Haase et al., 2014). The refer-
ences are provided in the supplement.
A TYPOLOGY OF URBAN GREEN SPACES, ECOSYSTEM SERVICES PROVISIONING SERVICES AND DEMANDS • WP3 • Page 31
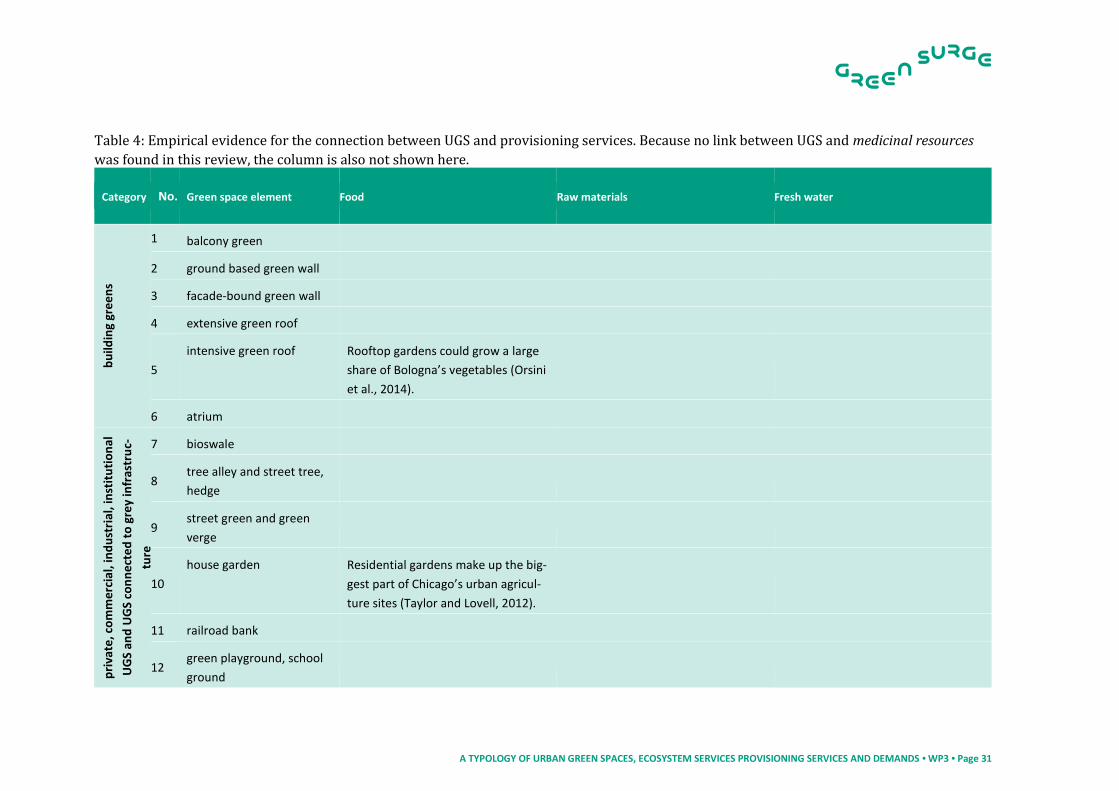
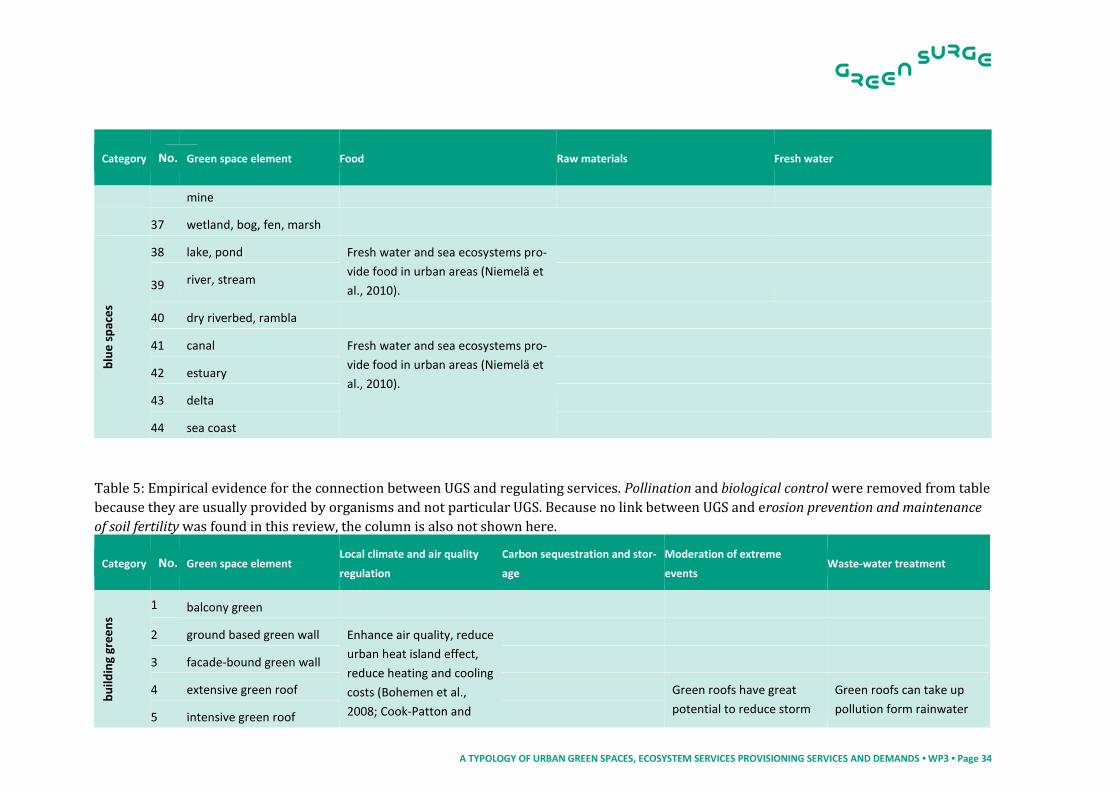
Table 4: Empirical evidence for the connection between UGS and provisioning services. Because no link between UGS and medicinal resources
was found in this review, the column is also not shown here.
Category No. Green space element Food Raw materials Fresh water
bu
ildin
g gr
ee
ns
1 balcony green
2 ground based green wall
3 facade-bound green wall
4 extensive green roof
5
intensive green roof Rooftop gardens could grow a large
share of Bologna’s vegetables (Orsini
et al., 2014).
6 atrium
pri
vate
, co
mm
erc
ial,
ind
ust
rial
, in
stit
uti
on
al
UG
S an
d U
GS
con
ne
cte
d t
o g
rey
infr
astr
uc-
ture
7 bioswale
8 tree alley and street tree,
hedge
9 street green and green
verge
10
house garden Residential gardens make up the big-
gest part of Chicago’s urban agricul-
ture sites (Taylor and Lovell, 2012).
11 railroad bank
12 green playground, school
ground

A TYPOLOGY OF URBAN GREEN SPACES, ECOSYSTEM SERVICES PROVISIONING SERVICES AND DEMANDS • WP3 • Page 32
Category No. Green space element Food Raw materials Fresh water
rive
rban
k
gre
en
13
riverbank green
par
ks a
nd
rec
reat
ion
14 large urban park
15 historical park/garden
16 pocket park
17 botanical garden/arboreta
18 zoological garden
19
neighbourhood green
space
During WW II, neighbourhood green
was changed into tenant gardens
(Zerbe et al., 2003).
20 institutional green space
21 cemetery and churchyard
22 green sport facility
23 camping area
allo
tme
nts
an
d c
om
-
mu
nit
y ga
rde
ns
24
allotment Large quantities of vegetables can be
grown in allotment and community
gardens. In Chicago, community gar-
dens make up 20% of the urban agri-
culture area (TEEB, 2011; Taylor and
Lovell, 2012).
25
community garden

A TYPOLOGY OF URBAN GREEN SPACES, ECOSYSTEM SERVICES PROVISIONING SERVICES AND DEMANDS • WP3 • Page 33
Category No. Green space element Food Raw materials Fresh water
agri
cult
ura
l lan
d
26 arable land
27 grassland
28 tree meadow / orchard
29 biofuel production / agro-
forestry
30
horticulture Urban farms used for growth of veg-
etables make up 4.7% of Chicago’s
urban agriculture area (Taylor and
Lovell, 2012).
nat
ura
l, se
mi-
nat
ura
l an
d f
era
l are
as
31
forest (remnant wood-
land, managed forests,
mixed forms)
Forests provide food in urban areas
(Niemelä et al., 2010; Yokohari and
Bolthouse, 2011).
Forests provide raw materials in ur-
ban areas (Niemelä et al., 2010;
Yokohari and Bolthouse, 2011).
32 shrubland
33
abandoned, ruderal and
derelict area
Land conversion on brownfields of-
fers great potential for food produc-
tion, except for on polluted sites. In
Chicago, gardens on vacant lots
make up 27% of Chicago’s urban ag-
riculture area (Taylor and Lovell,
2012; Haase et al., 2014).
Marginal land can be sustainably
used for biofuel production under
certain conditions, e.g., low contam-
ination (Zhao et al., 2014).
34 rocks
35 sand dunes
36 sand pit, quarry, open cast
A TYPOLOGY OF URBAN GREEN SPACES, ECOSYSTEM SERVICES PROVISIONING SERVICES AND DEMANDS • WP3 • Page 34
Category No. Green space element Food Raw materials Fresh water
mine
37 wetland, bog, fen, marsh
blu
e s
pac
es
38 lake, pond Fresh water and sea ecosystems pro-
vide food in urban areas (Niemelä et
al., 2010).
39 river, stream
40 dry riverbed, rambla
41 canal Fresh water and sea ecosystems pro-
vide food in urban areas (Niemelä et
al., 2010).
42 estuary
43 delta
44 sea coast
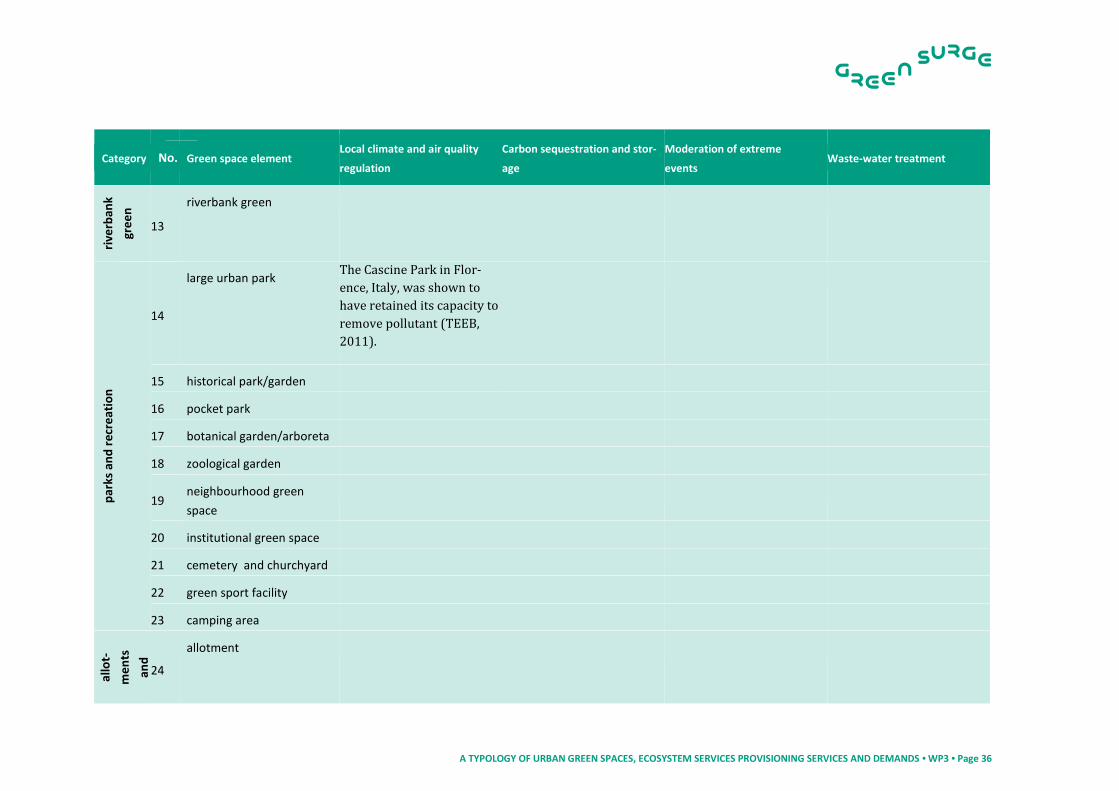
Table 5: Empirical evidence for the connection between UGS and regulating services. Pollination and biological control were removed from table
because they are usually provided by organisms and not particular UGS. Because no link between UGS and erosion prevention and maintenance
of soil fertility was found in this review, the column is also not shown here.
Category No. Green space element Local climate and air quality
regulation
Carbon sequestration and stor-
age
Moderation of extreme
events Waste-water treatment
bu
ildin
g gr
ee
ns
1 balcony green
2 ground based green wall Enhance air quality, reduce
urban heat island effect,
reduce heating and cooling
costs (Bohemen et al.,
2008; Cook-Patton and
3 facade-bound green wall
4 extensive green roof Green roofs have great
potential to reduce storm
Green roofs can take up
pollution form rainwater 5 intensive green roof

A TYPOLOGY OF URBAN GREEN SPACES, ECOSYSTEM SERVICES PROVISIONING SERVICES AND DEMANDS • WP3 • Page 35
Category No. Green space element Local climate and air quality
regulation
Carbon sequestration and stor-
age
Moderation of extreme
events Waste-water treatment
Bauerle, 2010; Sternberg
et al. 2010 and 2011;
Wong et al. 2010).
water runoff in low rainfall
events (Mentens et al.,
2006; Cook-Patton and
Bauerle, 2010).
(Cook-Patton and Bauerle,
2010).
6 atrium
pri
vate
, co
mm
erc
ial,
ind
ust
rial
, in
stit
uti
on
al U
GS
and
UG
S co
nn
ect
-
ed
to
gre
y in
fras
tru
ctu
re
7
bioswale Bioswales reduce the
amount of stormwater
runoff (Pataki et al., 2011).
Bioswales reduce the pol-
lution load of stormwater
runoff (Pataki et al., 2011).
8
tree alley and street tree,
hedge
Provide cooling, wind con-
trol and air pollution re-
moval (Tyrväinen et al.,
2005).
Street trees can store car-
bon under certain condi-
tions (Novak, 2002).
9 street green and green
verge
10
house garden Gardens improve localised
air cooling (Cameron et al.,
2012).
Private gardens store low
amounts of carbon in trees
in Leicester, UK, and Leip-
zig, Germany (Davies et al.,
2011, Strohbach and
Haase, 2012).
Gardens help mitigate
flooding (Cameron et al.,
2012).
11 railroad bank
12 green playground, school
ground
A TYPOLOGY OF URBAN GREEN SPACES, ECOSYSTEM SERVICES PROVISIONING SERVICES AND DEMANDS • WP3 • Page 36
Category No. Green space element Local climate and air quality
regulation
Carbon sequestration and stor-
age
Moderation of extreme
events Waste-water treatment
rive
rban
k
gre
en
13
riverbank green
par
ks a
nd
rec
reat
ion
14
large urban park The Cascine Park in Flor-
ence, Italy, was shown to
have retained its capacity to
remove pollutant (TEEB,
2011).
15 historical park/garden
16 pocket park
17 botanical garden/arboreta
18 zoological garden
19 neighbourhood green
space
20 institutional green space
21 cemetery and churchyard
22 green sport facility
23 camping area
allo
t-
me
nts
and
com
mu
ni-
ty g
ar-
de
ns
24
allotment

A TYPOLOGY OF URBAN GREEN SPACES, ECOSYSTEM SERVICES PROVISIONING SERVICES AND DEMANDS • WP3 • Page 37
Category No. Green space element Local climate and air quality
regulation
Carbon sequestration and stor-
age
Moderation of extreme
events Waste-water treatment
25
community garden
agri
cult
ura
l lan
d
26 arable land
27 grassland
28 tree meadow / orchard
29 biofuel production / agro-
forestry
30 horticulture
nat
ura
l, se
mi-
nat
ura
l an
d f
era
l are
as
31
forest (remnant wood-
land, managed forests,
mixed forms)
Forests provide cooling,
wind control and air pollu-
tion removal (Tyrväinen et
al., 2005).
Forests in cities can store
large amounts of carbon
(Strohbach and Haase,
2012).
32 shrubland
33 abandoned, ruderal and
derelict area
34 rocks
35 sand dunes
36 sand pit, quarry, open cast
mine
37 wetland, bog, fen, marsh Wetlands in Berlin are
used for carbon mitigation
Upstream wetlands reduce
flooding after heavy rain-
Functioning urban wet-
lands contribute strongly

A TYPOLOGY OF URBAN GREEN SPACES, ECOSYSTEM SERVICES PROVISIONING SERVICES AND DEMANDS • WP3 • Page 38
Category No. Green space element Local climate and air quality
regulation
Carbon sequestration and stor-
age
Moderation of extreme
events Waste-water treatment
(Klingenfuß, 2013). fall events (TEEB, 2011). to waste water treatment
(Cairns and Palmer, 1995;
Niemelä et al., 2010; TEEB,
2011).
blu
e s
pac
es
38 lake, pond
39 river, stream
40 dry riverbed, rambla
41 canal
42 estuary
43 delta
44 sea coast
Table 6: Empirical evidence for the connection between UGS and habitat or supporting services. Because no link between UGS and maintenance
of genetic diversity was found in this review, the column is not shown here.
Category No. Green space element Habitats for species
bu
ildin
g gr
ee
ns
1 balcony green Balconies provide habitat for wild bees in Leipzig, Germany (Everaars et al., 2011).
2 ground based green wall Green walls enhanced the habitat of house sparrows and European starlings in Stoke-on-Trent and Newcastle-under-
Lyme, UK, (Chiquet et al., 2012).
3 facade-bound green wall
4 extensive green roof Diverse roofs can support diverse communities (Cook-Patton and Bauerle, 2010; Fernandez-Canero and Gonzales-

A TYPOLOGY OF URBAN GREEN SPACES, ECOSYSTEM SERVICES PROVISIONING SERVICES AND DEMANDS • WP3 • Page 39
Category No. Green space element Habitats for species
5 intensive green roof Redondo, 2010).
6 atrium
pri
vate
, co
mm
erc
ial,
ind
ust
rial
, in
stit
u-
tio
nal
UG
S an
d U
GS
con
ne
cte
d t
o g
rey
infr
astr
uct
ure
7 bioswale
8 tree alley and street tree,
hedge
Streetscapes with old trees supported a higher abundance and richness of bird species than other streets in Mel-
bourne, Australia (White et al., 2005).
9 street green and green
verge
Diverse streetscapes with native vegetation enhance abundance and richness of species (Leather, 2004; White et al.,
2005; Lososová et al. 2011).
10 house garden Diverse gardens enhance abundance and richness of species (Smith et al., 2006; Goddard et al., 2010; Lososová et al.,
2011; Cameron et al., 2012).
11 railroad bank
12 green playground, school
ground
rive
rban
k
gre
en
13
riverbank green
par
ks a
nd
rec
reat
ion
14 large urban park Large parks have an outstanding value for urban biodiversity (Donnelly and Marzluff, 2004; Lososová et al. 2011;
Strohbach et al., 2013).
15 historical park/garden
16 pocket park Pockets parks slightly increase number of observed bird species (Strohbach et al., 2013).
17 botanical garden/arboreta
18 zoological garden
19 neighbourhood green

A TYPOLOGY OF URBAN GREEN SPACES, ECOSYSTEM SERVICES PROVISIONING SERVICES AND DEMANDS • WP3 • Page 40
Category No. Green space element Habitats for species
space
20 institutional green space
21 cemetery and churchyard
22 green sport facility
23 camping area
allo
tme
nts
an
d c
om
-
mu
nit
y ga
rde
ns
24
allotment Tenant gardens showed relatively high plant species richness in a study in Berlin, Germany (Zerbe et al., 2003).
25
community garden
agri
cult
ura
l lan
d
26 arable land
27 grassland In a study in Leipzig Germany, high bird species richness was associated with grassland (Strohbach et al., 2009).
28 tree meadow / orchard
29 biofuel production / agro-
forestry
30 horticulture
nat
ura
l, se
mi-
nat
ura
l an
d f
era
l
are
as
31
forest (remnant wood-
land, managed forests,
mixed forms)
Urban forests are biodiversity hot-spots (Tyrväinen et al., 2005; Strohbach et al., 2009).
32 shrubland Mid successional sites with grassland and shrub vegetation host diverse assemblages (Lososová et al., 2011).
33 abandoned, ruderal and

A TYPOLOGY OF URBAN GREEN SPACES, ECOSYSTEM SERVICES PROVISIONING SERVICES AND DEMANDS • WP3 • Page 41
Category No. Green space element Habitats for species
derelict area
34 rocks
35 sand dunes
36 sand pit, quarry, open cast
mine
37 wetland, bog, fen, marsh
blu
e s
pac
es
38 lake, pond In a study in Leipzig Germany, high bird species richness was associated with lakes and ponds (Strohbach et al., 2009).
39 river, stream In a study in Leipzig Germany, high bird species richness was associated with rivers and streams (Strohbach et al.,
2009).
40 dry riverbed, rambla
41 canal
42 estuary
43 delta
44 sea coast

A TYPOLOGY OF URBAN GREEN SPACES, ECOSYSTEM SERVICES PROVISIONING SERVICES AND DEMANDS • WP3 • Page 42
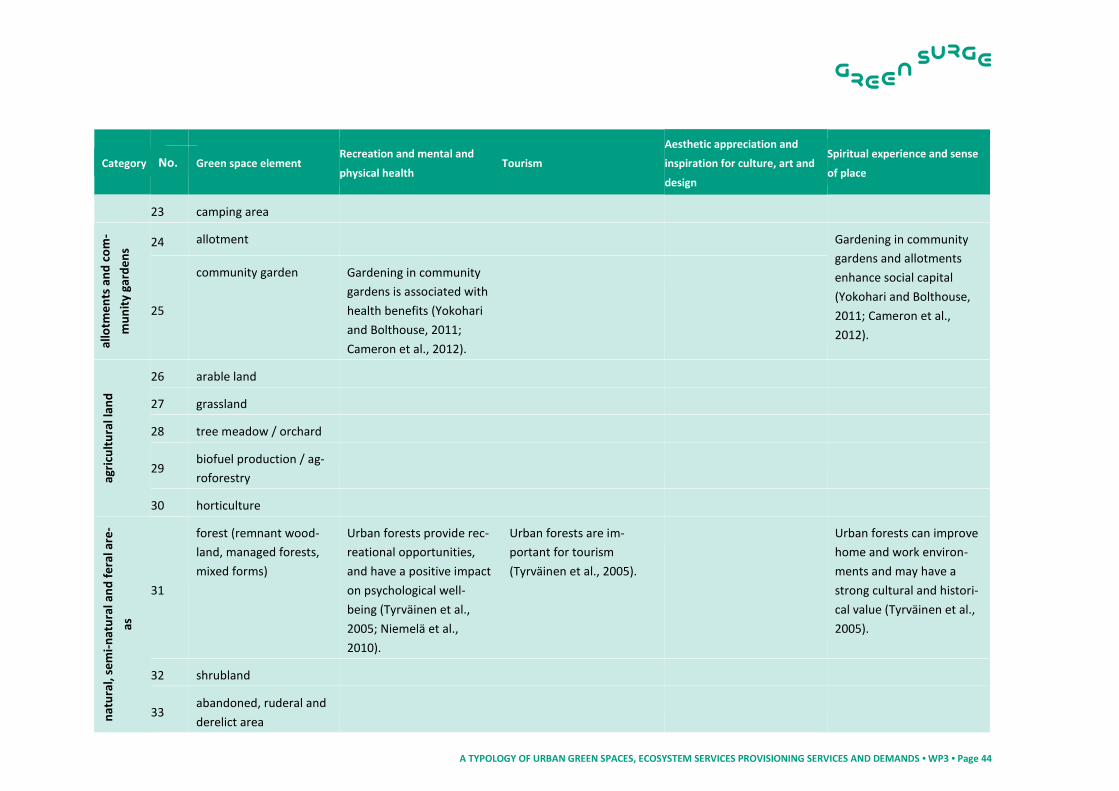
Table 7: Empirical evidence for the connection between UGS and cultural services.
Category No. Green space element Recreation and mental and
physical health Tourism
Aesthetic appreciation and
inspiration for culture, art and
design
Spiritual experience and sense
of place
bu
ildin
g gr
ee
ns
1 balcony green
2 ground based green wall
3 facade-bound green wall
4 extensive green roof Green roofs can enhance
overall human well-being
(Cook-Patton and Bauerle,
2010).
Green roofs can enhance
the aesthetic environment
(Cook-Patton and Bauerle,
2010).
5 intensive green roof
6 atrium
pri
vate
, co
mm
erc
ial,
ind
ust
rial
, in
stit
uti
on
al U
GS
and
UG
S co
nn
ect
ed
to
gre
y in
fras
tru
ctu
re
7 bioswale
8 tree alley and street
tree, hedge
9 street green and green
verge
10
house garden Gardens can provide stress
relief (Cameron et al.,
2012).
Gardens are shaped by
aesthetic desires (Cameron
et al., 2012).
Positive memories of
childhood are often linked
to gardens and provide
strong sense of place
(Cameron et al., 2012).
11 railroad bank
12 green playground,
school ground

A TYPOLOGY OF URBAN GREEN SPACES, ECOSYSTEM SERVICES PROVISIONING SERVICES AND DEMANDS • WP3 • Page 43
Category No. Green space element Recreation and mental and
physical health Tourism
Aesthetic appreciation and
inspiration for culture, art and
design
Spiritual experience and sense
of place
rive
rban
k
gre
en
13
riverbank green Structurally rich riverbanks
are associated with psy-
chological well-being (Dal-
limer et al., 2012).
par
ks a
nd
rec
reat
ion
14
large urban park Parks contribute to the
physical and psychological
well-being (Fuller et al.,
2007; Niemelä et al.,
2010).
15 historical park/garden
16
pocket park Small public are used pri-
marily for rest and restitu-
tion and socialising (Pes-
chard et al., 2012).
17 botanical gar-
den/arboreta
18 zoological garden
19 neighbourhood green
space
20 institutional green space
21 cemetery and church-
yard
22 green sport facility
A TYPOLOGY OF URBAN GREEN SPACES, ECOSYSTEM SERVICES PROVISIONING SERVICES AND DEMANDS • WP3 • Page 44
Category No. Green space element Recreation and mental and
physical health Tourism
Aesthetic appreciation and
inspiration for culture, art and
design
Spiritual experience and sense
of place
23 camping area
allo
tme
nts
an
d c
om
-
mu
nit
y ga
rde
ns
24 allotment Gardening in community
gardens and allotments
enhance social capital
(Yokohari and Bolthouse,
2011; Cameron et al.,
2012).
25
community garden Gardening in community
gardens is associated with
health benefits (Yokohari
and Bolthouse, 2011;
Cameron et al., 2012).
agri
cult
ura
l lan
d
26 arable land
27 grassland
28 tree meadow / orchard
29 biofuel production / ag-
roforestry
30 horticulture
nat
ura
l, se
mi-
nat
ura
l an
d f
era
l are
-
as
31
forest (remnant wood-
land, managed forests,
mixed forms)
Urban forests provide rec-
reational opportunities,
and have a positive impact
on psychological well-
being (Tyrväinen et al.,
2005; Niemelä et al.,
2010).
Urban forests are im-
portant for tourism
(Tyrväinen et al., 2005).
Urban forests can improve
home and work environ-
ments and may have a
strong cultural and histori-
cal value (Tyrväinen et al.,
2005).
32 shrubland
33 abandoned, ruderal and
derelict area

A TYPOLOGY OF URBAN GREEN SPACES, ECOSYSTEM SERVICES PROVISIONING SERVICES AND DEMANDS • WP3 • Page 45
Category No. Green space element Recreation and mental and
physical health Tourism
Aesthetic appreciation and
inspiration for culture, art and
design
Spiritual experience and sense
of place
34 rocks
35 sand dunes
36 sand pit, quarry, open
cast mine
37 wetland, bog, fen, marsh
blu
e s
pac
es
38 lake, pond Recreational opportunities
are provided especially by
water ecosystems (Nie-
melä et al., 2010).
39 river, stream
40 dry riverbed, rambla
41 canal Recreational opportunities
are provided especially by
water ecosystems (Nie-
melä et al., 2010).
42 estuary
43 delta
44 sea coast

A TYPOLOGY OF URBAN GREEN SPACES, ECOSYSTEM SERVICES PROVISIONING SERVICES AND DEMANDS • WP3 • Page 46
3.1.3 Assessments of selected urban green space elements for European and Urban Learning Lab cities
For an overview on the amount of green space in European cities, we quantified some of the UGS
components using the Urban Atlas data (EEA, 2010). Maps and plots are shown for forests (UGS
class 31; Figure 4; Figure 7), green urban areas (UGS classes 13 - 20; Figure 5; Figure 8) and agri-
cultural, semi-natural areas, wetlands (UGS class 26-30, 32, 34, 35, 37; Figure 6; Figure 9). In
addition, we created a map of UGS for Berlin (Figure 10).
Figure 4: The forest cover of the core city areas of Urban Atlas cities (EEA, 2010) in percent
shown for the bottom 20, top 20 and for the ULL cities Bari, Berlin, Edinburgh, Ljubljana and
Malmö.
Figure 5: The green urban areas cover of the core city areas of Urban Atlas cities (EEA, 2010) in
percent shown for the bottom 20, top 20 and for the ULL cities Bari, Berlin, Edinburgh, Ljubljana
and Malmö.

A TYPOLOGY OF URBAN GREEN SPACES, ECOSYSTEM SERVICES PROVISIONING SERVICES AND DEMANDS • WP3 • Page 47
Figure 6: The agricultural land, semi-natural areas, and wetland cover in the core city areas of
Urban Atlas cities (EEA, 2010) in percent shown for the bottom 20, top 20 and for the ULL cities
Bari, Berlin, Edinburgh, Ljubljana and Malmö.
Figure 7: Share of city areas covered by forests. Calculation based on Urban Atlas data (EEA
2010).
A TYPOLOGY OF URBAN GREEN SPACES, ECOSYSTEM SERVICES PROVISIONING SERVICES AND DEMANDS • WP3 • Page 48
Figure 8: Share of city areas covered by green urban areas. Calculation based on Urban Atlas data
(EEA 2010).
Figure 9: Share of city areas covered by agricultural, semi-natural areas and wetlands. Calcula-
tion based on Urban Atlas data (EEA 2010).

A TYPOLOGY OF URBAN GREEN SPACES, ECOSYSTEM SERVICES PROVISIONING SERVICES AND DEMANDS • WP3 • Page 49
Figure 10: UGS in the ULL city Berlin. They cover 46 % of the city. Green roofs (detail in frame on
top right) cover only 0.1% of the city or 12% of the total building area (Source: Senatsverwal-
tung für Stadtentwicklung und Umwelt Berlin).
3.2 Assessment of urban green space demand for the two scale levels, European Urban Atlas cities and Urban
Learning Labs
3.2.1 European scale

A TYPOLOGY OF URBAN GREEN SPACES, ECOSYSTEM SERVICES PROVISIONING SERVICES AND DEMANDS • WP3 • Page 50
Table 8 shows mean values for total area, residential area, forest areas, and green urban areas
for Northern, Southern, Eastern and Western European cities. The sample was grouped accord-
ing to macro-geographical regions (United Nations Institute of Social Affairs, 2010). In Western
and Northern Europe, the share of residential area is comparatively higher which gives a first
hint on the long and ongoing sprawl process after WW II there. Not surprisingly, forest areas are
most frequent in Northern European cities. Cities in Eastern and Southern Europe show lowest
values for green areas within their city boundaries. This reflects the ideal of the dense southern
European city where in a number of cities narrow roads have been most important to provide
shadow during hot summers. This is also represented in comparatively low values for per capita
green space.

A TYPOLOGY OF URBAN GREEN SPACES, ECOSYSTEM SERVICES PROVISIONING SERVICES AND DEMANDS • WP3 • Page 51
Table 8: Land use/land cover area and per capita values for European urban regions
Indicator Western
Europe Southern
Europe Eastern Europe
Northern Europe
Total area (ha) 29625.04 25595.24 18958.96 48816.15
Total residential area 4936.69 2489.48 2665.92 5661.93
Forest 4168.85 2487.7 3035.86 16700.32
Green urban areas 853.24 399.2 462.06 1288.32
Water bodies 842.72 639.52 518.87 3096.19
Per capita green space (m² per inh.)
27.25 10.97 13.71 32.95
Per capita green +forest (m² per inh.)
233.97 137.39 157.52 1277.95
per capita water area (m² per inh.)
32.52 28.01 27.05 229.18
The spatial differentiation of total urban green and forest areas in the different European regions
is also reflected in accessibility values. Figure 11 shows a European map in which the share of
population which has access to green and forest areas of a minimum size of 2 ha within a 500 m
distance. More than two thirds of the population living in Scandinavian countries or in countries
in Western Europe such as Austria or North-Western Germany has access to green space in their
vicinity. In addition, a number of cities in the Eastern European countries of Poland, Slovakia and
the Czech Republic show high values. Notably cities in Southern-Eastern or Southern European
countries show comparatively low values. In a number of cities in Hungary, Bulgaria or Romania
only one third or less have access to UGS ≥ 2 ha within a 500 m distance from their home. This is
also the case for Southern European cities notably in Greece and some cities in Italy and Spain.
Those cities in Eastern and South-Eastern European countries with lower accessibility values
may lack a sound green space management after their entry into the market economy and new
construction dominates the land use change. For Southern Europe, the traditional built density of
the cities comes together with higher efforts to maintain green spaces under conditions of con-
siderable summer aridity. Moreover, Southern European cities’ area contains considerable rock
surface.

A TYPOLOGY OF URBAN GREEN SPACES, ECOSYSTEM SERVICES PROVISIONING SERVICES AND DEMANDS • WP3 • Page 52
Figure 11: Share of population with access to UGS (≥2 ha) within 500 m in administrative city
boundaries. Note: Calculation based on GEOSTAT 1 km² grid and Urban Atlas land cover data.
3.2.2 Urban Learning Lab scale
The ULL cities in GREEN SURGE are Berlin, Malmö, Ljubljana, Edinburgh, and Bari. In this Mile-
stone, we additionally studied Łódź as an Eastern European city.
Berlin is the largest city with more than 89,000 ha (Table 9). Residential area in Berlin comprises
nearly 30 % of the city area while open spaces including forest areas, green spaces and water
bodies do also represent nearly 30 %. Among all case study cities, Berlin has the highest popula-
tion number with more than 3.5 million inhabitants. Per capita green space (including forest and
urban green) is high with more than 60 m² per inhabitant.
Malmö in Sweden is one of the smaller case study cities. The city had around 313,000 inhabitants
by 2013. Share of UGS is comparatively high which results in a value of 36 m² per capita green
space (including forest areas).
Ljubljana is the capital of Slovenia. The city has only 248 ha of UGS but a very high forest area of
more than 11,000 ha which is based on its topographical situation. Ljubljana’s population was
A TYPOLOGY OF URBAN GREEN SPACES, ECOSYSTEM SERVICES PROVISIONING SERVICES AND DEMANDS • WP3 • Page 53
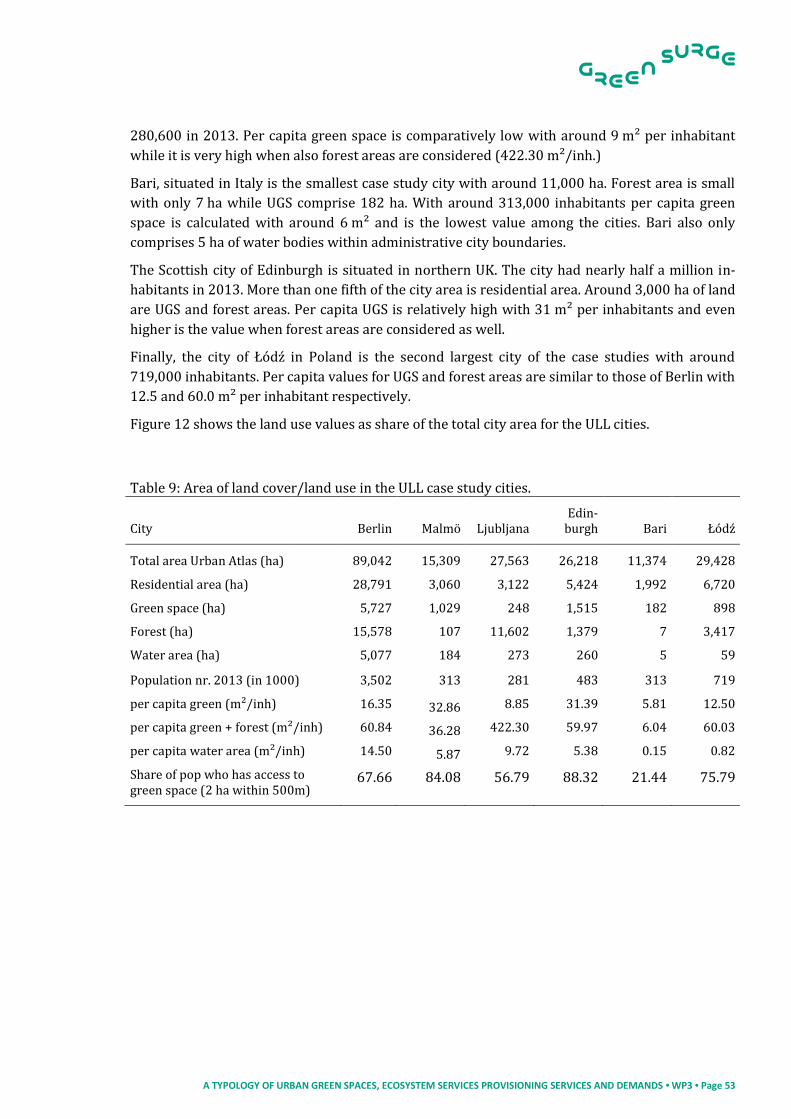
280,600 in 2013. Per capita green space is comparatively low with around 9 m² per inhabitant
while it is very high when also forest areas are considered (422.30 m²/inh.)
Bari, situated in Italy is the smallest case study city with around 11,000 ha. Forest area is small
with only 7 ha while UGS comprise 182 ha. With around 313,000 inhabitants per capita green
space is calculated with around 6 m² and is the lowest value among the cities. Bari also only
comprises 5 ha of water bodies within administrative city boundaries.
The Scottish city of Edinburgh is situated in northern UK. The city had nearly half a million in-
habitants in 2013. More than one fifth of the city area is residential area. Around 3,000 ha of land
are UGS and forest areas. Per capita UGS is relatively high with 31 m² per inhabitants and even
higher is the value when forest areas are considered as well.
Finally, the city of Łódź in Poland is the second largest city of the case studies with around
719,000 inhabitants. Per capita values for UGS and forest areas are similar to those of Berlin with
12.5 and 60.0 m² per inhabitant respectively.
Figure 12 shows the land use values as share of the total city area for the ULL cities.
Table 9: Area of land cover/land use in the ULL case study cities.
City Berlin Malmö Ljubljana Edin-
burgh Bari Łódź
Total area Urban Atlas (ha) 89,042 15,309 27,563 26,218 11,374 29,428
Residential area (ha) 28,791 3,060 3,122 5,424 1,992 6,720
Green space (ha) 5,727 1,029 248 1,515 182 898
Forest (ha) 15,578 107 11,602 1,379 7 3,417
Water area (ha) 5,077 184 273 260 5 59
Population nr. 2013 (in 1000) 3,502 313 281 483 313 719
per capita green (m²/inh) 16.35 32.86 8.85 31.39 5.81 12.50
per capita green + forest (m²/inh) 60.84 36.28 422.30 59.97 6.04 60.03
per capita water area (m²/inh) 14.50 5.87 9.72 5.38 0.15 0.82
Share of pop who has access to green space (2 ha within 500m)
67.66 84.08 56.79 88.32 21.44 75.79

A TYPOLOGY OF URBAN GREEN SPACES, ECOSYSTEM SERVICES PROVISIONING SERVICES AND DEMANDS • WP3 • Page 54
Figure 12: Land use/cover as share of total area based on Urban Atlas 20006 (EEA, 2010).
Figure 13 shows the results of the accessibility calculations for the case study cities. For the in-
terpretation of the accessibility values presented in the maps it has to be noted that they show all
grid cells in colour which are within a distance to a 2ha green space. The respective colour of the
grid cell (from yellow to red) shows the number of people living in that grid cell. Thus, the colour
simply represents the number of people in that cell but says nothing about quality of access (in
terms of “good” or “bad” access) or a certain share of people with access. As an example: if a grid
cell is within a 2ha green space distance of 500m and has a high population number (of more
than 6000), this grid cell is represented in red.
Again, they reflect the results from the total and per capita values. Berlin as the largest city of the
sample has a high share of UGS. Over the whole city area, high numbers of residents have access
to green space in their vicinity. Similar results were found for Ljubljana, Edinburgh and Malmö.
In Łódź, notably people living near the city border have access to forest areas and those living in
the inner parts of the city to green urban areas. Bari shows only some areas in which people have
access to urban green of a minimum size of 2 ha.
For any conclusions in terms of green space provision within the ULL cities, it needs to be men-
tioned again that in the calculation of all cases only the Urban Atlas classes “forest” and “green
urban areas” were included because of the mentioned shortcomings in the data base. Therefore,
cemeteries, allotment gardens, green sports areas and brownfield sites could not be included.
These land uses are summarized in other classes such as “industrial, commercial, public, military
and private units” where no further distinction is made. The raster-based type of analysis does
not include the road and path network of the cities and show always the “bird’s eye view”.

A TYPOLOGY OF URBAN GREEN SPACES, ECOSYSTEM SERVICES PROVISIONING SERVICES AND DEMANDS • WP3 • Page 55
Figure 13: Accessibility of urban green and forest areas of a minimum size of 2 ha within 500 m
distance. Note: In colour are only those grid cells which are within a distance to a 2ha green
space. The respective colour of those grid cells represents the number of people living in that
grid cell. Calculation is based on GEOSTAT 1km² grid and Urban Atlas land cover data. No street
or public transport net was included in the analysis. At district level, UGS distribution (including forest areas) is different. Figure 14 shows per capita
green space and population density values for the districts of Berlin, Germany and Ljubljana,
Slovenia. In Berlin, districts situated near the city border have higher shares of urban green and
notably forest areas as in the southwest of the city. Accordingly, per capita values are high in
these districts. By comparison, the map of the population density shows that density is highest in
inner city areas. This is also the case for Ljubljana although population density values are overall
lower than in Berlin. Per capita values for urban green and forest areas are highest in the north
and the east of the city with values of more than 500 m² per inhabitant. These per capita values
represent the land use distribution in the city. Share of forest area is high in those districts near
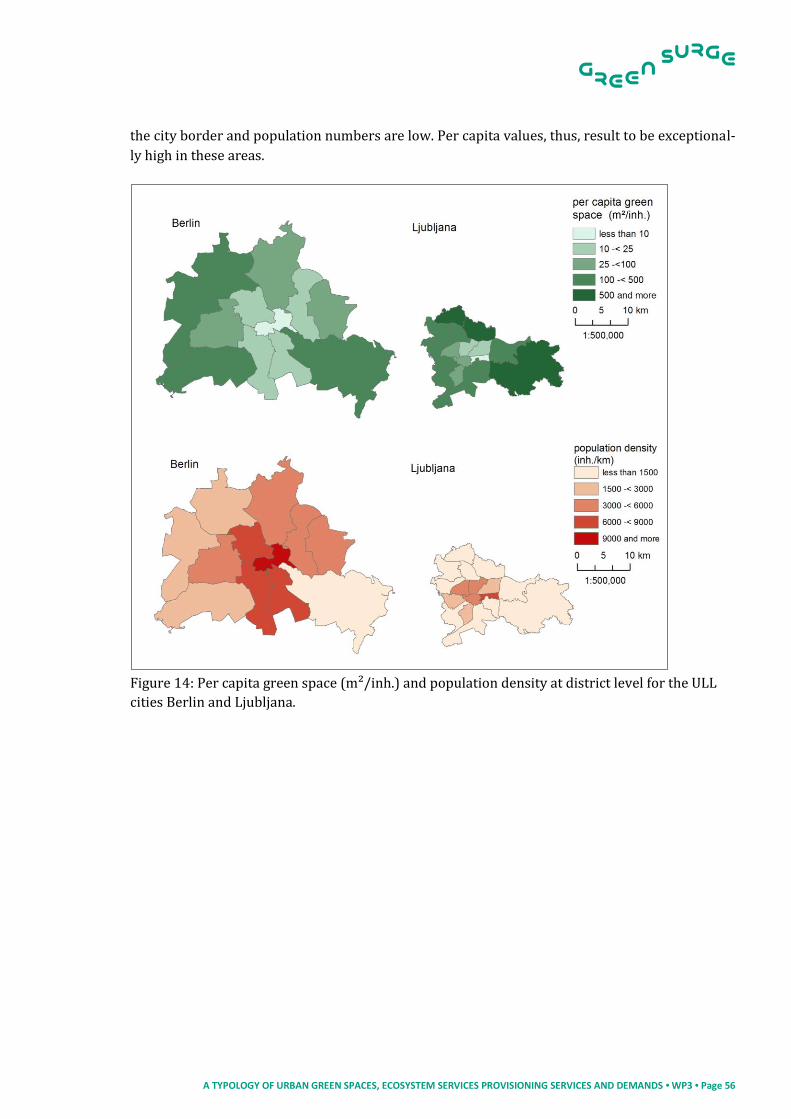
A TYPOLOGY OF URBAN GREEN SPACES, ECOSYSTEM SERVICES PROVISIONING SERVICES AND DEMANDS • WP3 • Page 56
the city border and population numbers are low. Per capita values, thus, result to be exceptional-
ly high in these areas.
Figure 14: Per capita green space (m²/inh.) and population density at district level for the ULL
cities Berlin and Ljubljana.
A TYPOLOGY OF URBAN GREEN SPACES, ECOSYSTEM SERVICES PROVISIONING SERVICES AND DEMANDS • WP3 • Page 57
4 DISCUSSION
4.1 Urban green space elements inventory
In total, 44 UGS elements were identified and grouped into eight broad categories (see, e.g., Table
4). This categorisation is not a typology in a strict sense and alternative ways of grouping the
UGS elements are possible and legitimate. Alternative possibilities for structuring could include
physical appearance, spatial extent and spatial complexity, social function, ownership and access,
quantity and quality of ecosystem services they provide, role for biodiversity conservation, the
intensity of human influence, or relevant planning purpose and open space strategy. The eight
groups identified here help structuring the inventory, but the focus of this deliverable and
GREEN SURGE in general is on the single UGS elements and not on the categories. We defined the
categories building greens; riverbank green; parks and recreation; allotments and community gar-
dens; agricultural land; natural, semi-natural and feral areas; blue infrastructure; private, com-
mercial, industrial, institutional UGS; and UGS connected to grey infrastructure.
Many UGS elements are too small to appear in data that covers the whole EU (e.g. green roofs).
Some categories are probably to fine for the ULL level of GREEN SURGE (e.g., it might not be
known whether green roofs are extensive of intensive). In that case, the UGS elements can be
combined with each other (intensive and extensive green roofs green roofs). Other UGS ele-
ments might be too broad for some purposes, in particular forests2. Here we recommend split-
ting these elements into sub-elements (e.g., forest coniferous and deciduous forest). Larger
UGS, like parks are often composed of many structurally and functionally different subunits such
as playgrounds, sport grounds, forest patches, small botanical gardens, lakes and streams, me-
morial sites, orchards, etc. Such UGS, however, possess ecosystem services stretching beyond the
services of individual subunits and it is reasonable to maintain in the inventory both levels of
scale.
4.2 Ecosystem service provisioning by urban green space
As shown in Table 4 - Table 6, a wide range of ESS are provided by various UGS elements. Not all
ESS are equally well represented in terms of empirical or model-based knowledge about their
performance. The performance of UGS very much depends on the specific configuration and the
spatial context (Ahern 2007), so tables provide a simplified picture. Nevertheless, the knowledge
about the effects of some UGS elements is considerable, for example for green roofs and green
walls and of more classical elements of UGS like forests and parks. Particularly green roofs pro-
vide a number of ESS, ranging from air temperature regulation and respective cost savings for
heating and cooling up to rainwater infiltration and habitat provision. They have the potential to
act as a kind of “second green skin” of cities with dense centres and limited open space on the
ground. The assessment also shows the importance of many UGS for habitat provisioning.
2 Forests can be categorized according to their age, species composition, usage, etc. For some aspects, like recreation, it may not make a difference whether a forest is deciduous or coniferous, and therefore the UGS element “forest” is sufficient. For other aspects, like ecosystem service provisioning, the species composition or age of a forest is highly influential and the UGS element should be further divided.

A TYPOLOGY OF URBAN GREEN SPACES, ECOSYSTEM SERVICES PROVISIONING SERVICES AND DEMANDS • WP3 • Page 58
For most UGS elements, more information on ecosystems service provisioning will be filled in
throughout the project as empirical and modelling analyses in GREEEN SURGE are ongoing.
Looking forward, D3.2 will provide more knowledge about the health effects of UGS in cities as
one specific and upcoming issue in the urban ESS and UGI discussion. In addition, assessments of
ecosystem services and biodiversity for combinations of different UGS in GI will also be made
throughout the project. For some elements, however, the link to ecosystem service production
and biodiversity depends on a range of factors (e.g., the bird diversity of parks depends on man-
agement and vegetation structure) and on how they are integrated into UGI.
4.3 Assessment of urban green space demand for the two scale levels, Urban Learning Lab and European Urban
Atlas cities
The results of the calculation for the demand of UGS show a heterogeneous picture across the
EU. The ULL cities, which act as case studies in the GREEN SURGE project stand as an representa-
tive example for the general trend of values in Western, Southern, Eastern and Northern urban
Europe.
Accordingly, the low forest and tree cover in Southern Europe explains the below-average per
capita urban green and accessibility values in Southern European cities such as in Bari. Addition-
ally, cities along the Mediterranean coastline have a high degree of soil sealing and rock surface,
which further explains lower values for green space accessibility (Kasanko et al., 2006).
The above-average values for green, forest and water areas in Northern European cities result
from the biophysical conditions and the forest richness of the respective countries in general.
Malmö as the Swedish case study city in Northern Europe is situated at the Baltic see. It has the
highest share of water area and respectively high per capita water area.
Western European cities present a diverse picture. Whereas in many cities, urban sprawl reduc-
es green space of any type outside the core cities, in their inner parts, green spaces have been
started to be better preserved and enhanced. Some cities do have a very high share of UGSs such
as Berlin. This is mainly due to an increased awareness of planning, protecting and investing in
nature has been developing in the last years. Further, an increase in ecological ‘‘green’’ lifestyles
such as urban gardening activities are appearing in cities such as Berlin and may lead to the di-
verse picture of green space provision and access.
Łódź is an example of an Eastern European city. Per capita values are below average but still
represent a certain provision of urban green and forest areas for city residents. The accessibility
map however shows that a number of inhabitants benefit from access to green. Larondelle et al.
(2014) concluded that for the case of Eastern European cities, the ecosystem services provision
based on green land use is very dynamic and hard to predict. Authors noted that biophysical pre-
conditions are different according to location in Europe making comparisons between, for exam-
ple, the more Mediterranean Bulgarian cities and semi-continental cities in Poland and the Czech
Republic difficult.

A TYPOLOGY OF URBAN GREEN SPACES, ECOSYSTEM SERVICES PROVISIONING SERVICES AND DEMANDS • WP3 • Page 59
Data issues
Due to the broad focus of this Milestone, green space was defined rather narrowly based on Ur-
ban Atlas classification. Only those areas were included in the analyses which are represented in
the two Urban Atlas classes “forest” and “green urban areas”. Due to the classification in Urban
Atlas, which summarizes different land uses in one class, important green spaces such as ceme-
teries, allotment gardens or green brownfield sites could not be included. Future research within
GREEN SURGE will look at how different green spaces (including cemeteries or allotment gar-
dens) can supply the demand for ecosystem services by residents. For a detailed analysis, land
use maps with higher resolution will be used at ULL scale.
Finally, accessibility threshold values are differently used in literature. Thus, a comparative anal-
ysis using different threshold values such as a 300 m distance for 2 ha or a 1500 m distance for
50 ha as well as the inclusions of a street network is planned for future work.
A TYPOLOGY OF URBAN GREEN SPACES, ECOSYSTEM SERVICES PROVISIONING SERVICES AND DEMANDS • WP3 • Page 60
5 REFERENCES
Ahern, J. (2007). Green infrastructure for cities: The spatial dimension. Pp. 267–283. in Cities of
the Future Towards Integrated Sustainable Water and Landscape (V. Novotny and P. Brown,
eds.). IWA Publishing, London, UK.
Alberti, M. (2008). Advances in Urban Ecology. (p. 374). New York, USA: Springer.
Balram, S., and Dragićević, S. (2005). Attitudes toward urban green spaces: integrating question-
naire survey and collaborative GIS techniques to improve attitude measurements. Landscape
and Urban Planning, 71(2-4), 147–162. doi:10.1016/j.landurbplan.2004.02.007
Baycan-Levent T., Vreeker R., Nijkamp P. (2009). A multi-criteria evaluation of green spaces in
European cities. European Urban and Regional Studies, 16, 2: 193-213
Bell S., Montarzino A., Travlou P. (2006). Green and Public Space Research: Mapping and Priori-
ties. Department for Communities and Local Government, London: p. 11-12. Retrieved from
http://www.openspace.eca.ac.uk/pdf/appendixf/OPENspacewebsite_APPENDIX_F_resource
_17.pdf
Bell S., Montarzino A., Travlou P. (2007). Mapping research priorities for green public urban
space in UK. Urban Forestry and Urban Greening, 6, 2: 103–115
Benedict, M. A. and McMahon, E. T. (2001). Green Infrastructure. Sprawl Watch Clearinghouse
Monograph Series.
Botkin D., Beveridge C. E. (1997). Cities as environment. Urban Ecosystems, 1: 3–19
Bowler, D. E., Buyung-Ali, L., Knight, T. M., and Pullin, A. S. (2010). Urban greening to cool towns
and cities: A systematic review of the empirical evidence. Landscape and Urban Planning,
97(3), 147–155. doi:10.1016/j.landurbplan.2010.05.006
Byrne J. and Sipe, N. (2010). Green and open space planning for urban consolidation – A review
of the literature and best practice. urban Research Program, Issues paper 11. p. 13.
Cameron, R. W. F., Blanusa, T., Taylor, J. E., Salisbury, A., Halstead, A. J., Henricot, B., et al. (2012).
The domestic garden - Its contribution to urban green infrastructure. Urban Forestry & Ur-
ban Greening VL - 11:129–137.
Carr, S., Francis, M., Rivlin, L. G, and Stone, A. M. (1992). Public Space. Cambridge: Cambridge
University Press.
Chiesura, A. (2004). The role of urban parks for the sustainable city. Landscape and Urban Plan-
ning, 68(1), 129–138. doi:10.1016/j.landurbplan.2003.08.003
Stadt Leipzig. (2003). Umweltqualitätsziele und -standards für die Stadt Leipzig. Leipzig.

A TYPOLOGY OF URBAN GREEN SPACES, ECOSYSTEM SERVICES PROVISIONING SERVICES AND DEMANDS • WP3 • Page 61
Comber, A., Brunsdon, C., and Green, E. (2008). Using a GIS-based network analysis to determine
urban greenspace accessibility for different ethnic and religious groups. Landscape and Ur-
ban Planning, 86(1), 103–114. doi:10.1016/j.landurbplan.2008.01.002
Cowling, R.M., Egoh, B., Knight, A.T., O’Farrell, P.J., Reyers, B., Rouget, M., Roux, D.J., Welz, A., et al.
(2008). An operational model for mainstreaming ecosystem services for implementation.
Proceedings of the National Academy of Sciences of the United States of America 105: 9483–
9488.
Danford, R. S., Strohbach, M. W., Ryan, R., Nicolson, C., and Warren, P. S. (2014). What Does It
Take to Achieve Equitable Urban Tree Canopy Distribution? A Boston Case Study. What Does
It Take to Achieve Equitable Urban Tree Canopy, 7(1).
DTLR – Department for Transport, Local Government and the Regions (2002). Green Spaces,
Better Places. Final Report of the Urban Green Spaces Taskforce, London. p. 43.
Dunnett, N., C. Swanwick, and H. Woolley. (2002). Improving urban parks, play areas and green
spaces (p. 214). Rotherham: Department for Transport, Local Government and the Regions.
Retrieved from http://www.communities.gov.uk/documents/communities/pdf/131021.pdf
EASAC - European Academies Science Advisory Council (2009). policy report 09. London. Availa-
ble at: http://link.springer.com/article/10.1007/s10640-010-9418-x (20th January 2015)
EEA - European Environment Agency (2010). Urban Atlas. Retrieved from
http://www.eea.europa.eu/data-and-maps/data/urban-atlas
EEA - European Environment Agency (2007). CLC2006 technical guidelines (No. 17/2007).
EEA - European Environment Agency. (n.d.). EUNIS database. http://eunis.eea.europa.eu.
Elmqvist, T., et al. (eds.) (2013) Urbanization, Biodiversity and Ecosystem Services: Challenges
and Opportunities. A Global Assessment. [Online] Dordrecht: Springer. Available from:
http://link.springer.com/book/10.1007%2F978-94-007-7088-1 [Accessed 14/01/2015].
European Union (2013): Building a Green Infrastructure for Europe.
European Commission. (2004). Urban audit — methodological handbook. Luxembourg: Office for
Official Publications of the European Communities.
Germann-Chiari, C., and Seeland, K. (2004). Are urban green spaces optimally distributed to act
as places for social integration? Results of a geographical information system (GIS) approach
for urban forestry research. Forest Policy and Economics, 6(1), 3–13. doi:10.1016/S1389-
9341(02)00067-9
Haase, D., Larondelle, N., Andersson, E., Artmann, M., Borgstrom, S., Breuste, J., Gomez-
Baggethun, E., Gren, A., Hamstead, Z., Hansen, R., Kabisch, N., et. al. (2014) A Quantitative Re-
A TYPOLOGY OF URBAN GREEN SPACES, ECOSYSTEM SERVICES PROVISIONING SERVICES AND DEMANDS • WP3 • Page 62
view of Urban Ecosystem Service Assessments: Concepts, Models, and Implementation. AM-
BIO, 43: 413-433.
Handley, J., Pauleit, S., Slinn, P., Barber, A., Baker, M., Jones, C., and Lindley, S. (2003). Accessible
Natural Green Space Standards in Towns and Cities: A Review and Toolkit for their Imple-
mentation. English Nature Research Reports, Report Nr. 526, (526).
Heynen, N. C. (2003). The Scalar Production of Injustice within the Urban Forest. Antipode, 980–
998.
Hofmann M., Gerstenberg T. (2014). A user-generated typology of urban green spaces. 17th In-
ternational Conference of the European Forum on Urban Forestry (EFUF), 3 – 7 June 2014,
Lausanne, Switzerland
http://www.efuf2014.org/download/pictures/e0/43mdhfjiscqm5fvm4jp8keddvd15vf/b2_h
ofmann.pdf
Hutter, G., Westphal, C., Siedentop, S., Janssen, G., and Müller, B. (2004). Handlungsansätze zur
Berücksichtigung der Umwelt-, Aufenthalts und Lebensqualität im Rahmen der Innenentwick-
lung von Städten und Gemeinden – Fallstudien. Umweltbundesamt Texte 41. Berlin, Germany.
Kabisch, N., and Haase, D. (2013). Green spaces of European cities revisited for 1990–2006.
Landscape and Urban Planning, 110, 113–122. doi:10.1016/j.landurbplan.2012.10.017
Kabisch, N., and Haase, D. (2014). Green justice or just green? Provision of urban green spaces in
Berlin, Germany. Landscape and Urban Planning, 122, 129–139.
doi:10.1016/j.landurbplan.2013.11.016
Kabisch, N., Qureshi, S., and Haase, D. (2015). Human–environment interactions in urban green
spaces — A systematic review of contemporary issues and prospects for future research. En-
vironmental Impact Assessment Review, 50, 25–34. doi:10.1016/j.eiar.2014.08.007
Kaplan, R. (1985). The analysis of perception via preference: a strategy for studying how the en-
vironment is experienced. Landscape Planning, 12, 161–176.
Kasanko, M., Barredo, I. J., Lavalle, C., McCormick, N., Demicheli, L., Sagris, V., and Brezger, A.
(2006). Are European cities becoming dispersed? A comparative analysis of 15 European ur-
ban areas. Landscape and Urban Planning, 77, 111–130.
Keeley, M., Koburger, A., Dolowitz, D. P., Medearis, D., Nickel, D., and Shuster, W. (2013). Perspec-
tives on the Use of Green Infrastructure for Stormwater Management in Cleveland and Mil-
waukee. Environmental Management 51:1093–1108.
Kowarik, I., Fischer, L. K., Säumel, I., von der Lippe, M., Weber, F., and Westerman, J. R. (2011).
Plants in Urban Settings: From Patterns to Mechanisms and Ecosystem Services. In W. Endli-
cher (Ed.), Perspectives in Urban Ecology (pp. 135–166). Berlin, Heidelberg: Springer Berlin
Heidelberg.

A TYPOLOGY OF URBAN GREEN SPACES, ECOSYSTEM SERVICES PROVISIONING SERVICES AND DEMANDS • WP3 • Page 63
Krasny, E. M., Lundholm, C., Shava, S., Lee, E., and Kobori, H. (2013). Urban Landscapes as Learn-
ing Arenas for Biodiversity and Ecosystem Services Management. In T. Elmqvist, M. Fragkias,
J. Goodness, B. Güneralp, P. J. Marcotullio, R. I. McDonald, C. Wilkinson (Eds.), Urbanization,
Biodiversity and Ecosystem Services: Challenges and Opportunities, A global assessment (pp.
629–665). Springer.
Kuo, F. E., Bacaicoa, M., and Sullivan, W. C. (1998). Transforming Inner-City Landscapes: Trees,
Sense of Safety, and Preference. Environment and Behavior, 30(1), 28–59.
doi:10.1177/0013916598301002
Landscape Institute. (2009). Green infrastructure: connected and multifunctional landscapes,
London, UK.
Larondelle, N., and Haase, D. (2013). Urban ecosystem services assessment along a rural – urban
gradient : A cross-analysis of European cities. Ecological Indicators, 29, 179–190.
Larondelle, N., Haase, D., and Kabisch, N. (2014). Mapping the diversity of regulating ecosystem
services in European cities. Global Environmental Change, 26, 119–129.
doi:10.1016/j.gloenvcha.2014.04.008
Martin, C. A., Warren, P. S., and Kinzig, A. P. (2004). Neighborhood socioeconomic status is a use-
ful predictor of perennial landscape vegetation in residential neighborhoods and embedded
small parks of Phoenix, AZ. Landscape and Urban Planning, 69(4), 355–368.
doi:10.1016/j.landurbplan.2003.10.034
McMahon, E. T. (2000). Green Infrastructure. Planning Commissioners Journal:4–7.
MEA – Millennium ecosystem assessment. (2005). Ecosystems and human well-being: Synthesis.
Island Press. Washington DC.
Natural England. (2009). Green Infrastructure Guidance.
Neuenschwander N., Wissen Hayek U., Gret-Regamey A. (2014). Integrating an urban green
space typology into procedural 3D visualization for collaborative planning. Computers, En-
vironment and Urban Systems 48: 99-110.
Niemelä J., Saarela S. R., Söderman T., Kopperoinen L., Yli-Pelkonen V., Väre S., Kotze D. J. (2010).
Using the ecosystem approach for better planning and conservation of urban green spaces: a
Finland case study. Biodiversity Conservation, 19: 3225–3243
Pfoser, N. (2012): Advanced classification of facade greening – Characteristics and differences of
soil-bound and facade greening systems, In: Biotope City – International Journal for City as
Nature, Amsterdam.
Rupprecht C.D.D., Byrne J.A. (2014). Informal urban green space: A typology and trilingual sys-
tematic review of its role for urban residents and trends in the literature. Urban Forestry &
Urban Greening 13, 597-611.
A TYPOLOGY OF URBAN GREEN SPACES, ECOSYSTEM SERVICES PROVISIONING SERVICES AND DEMANDS • WP3 • Page 64
Sadler, J., Bates, A., Hale, J., and James, P. (2010). Bringing cities alive: the importance of urban
green spaces for people and biodiversity. In K. J. Gaston (Ed.), Urban Ecology (Ecological., p.
327). Cambridge: Cambridge University Press.
Sandström G.U. (2002). Green infrastructure planning in urban Sweden. Planning practice and
Research, 17, 4: 373-385
Science Communication Unit – University of the West of England (SCU-UWE), Bristol. 2012.
Senatsverwaltung für Stadtentwicklung und Umwelt (2013). Urban Green. Retrieved from
http://www.stadtentwicklung.berlin.de/umwelt/stadtgruen/gruenanlagen/index.shtml
Spronken-Smith, R. A., and Oke, T. R. (1998). The thermal regime of urban parks in two cities
with different summer climates. International Journal for Remote Sensing, 19, 2085–2107.
Swanwick, C., Dunnett, N., and Woolley, H. (2003). Nature, role and value of green space in towns
and cities: an overview. Built Environment, 29(2), 94–106.
TEEB – The Economics of Ecosystems and Biodiversity (2011). TEEB Manual for Cities: Ecosys-
tem Services in Urban Management. www.teebweb.org
Tzoulas, K., Korpela, K., Venn, S., Yli-Pelkonen, V., Kazmierczak, A., Niemela, J., and James, P.
(2007). Promoting ecosystem and human health in urban areas using Green Infrastructure: A
literature review. Landscape and Urban Planning, 81, 167–178.
Ulrich, R. S., Simons, R. F., Losito, B. D., Fiorito, E., Miles, M. a., and Zelson, M. (1991). Stress recov-
ery during exposure to natural and urban environments. Journal of Environmental Psycholo-
gy, 11(3), 201–230. doi:10.1016/S0272-4944(05)80184-7
United Nations Institute of Social Affairs. (2010). Composition of macro geographical (continen-
tal) regions, geographical sub-regions, and selected economic and other groupings. Retrieved
from http://unstats.un.org/unsd/methods/m49/m49regin.htm
Van Herzele, A., and Wiedemann, T. (2003). A monitoring tool for the provision of accessible and
attractive urban green spaces. Landscape and Urban Planning, 63(2), 109–126.
doi:10.1016/S0169-2046(02)00192-5
Van Leeuwen, E., Nijkamp, P., and de Noronha Vaz, T. (2010). The multi-functional use of urban
green space. International Journal of Agricultural Sustainability, 8(1-2), 20–25.
Voigt A., Kabisch N., Wurster D., Haase D., and Breuste J (2014). Structural diversity as a key fac-
tor for the provision of recreational services in urban parks – a new and straightforward
method for assessment. AMBIO 43(4), 480–491.
Völker, S., and Kistemann, T. (2013). “I’m always entirely happy when I'm here!” Urban blue en-
hancing human health and well-being in Cologne and Düsseldorf, Germany. Social Science &
Medicine (1982), 78, 113–24. doi:10.1016/j.socscimed.2012.09.047

A TYPOLOGY OF URBAN GREEN SPACES, ECOSYSTEM SERVICES PROVISIONING SERVICES AND DEMANDS • WP3 • Page 65
Weeks J.R. (2010). Defining urban areas. In: Remote sensing of urban and suburban areas.
Rashed T., Jürgens C. (eds.). Springer, Dordrecht, Heidelberg, London, New York: p. 33-45.
Wooley, H. (2003). Urban Open Spaces. London: Taylor and Francis Group.

A TYPOLOGY OF URBAN GREEN SPACES, ECOSYSTEM SERVICES PROVISIONING SERVICES AND DEMANDS • WP3 • Page 66
6 SUPPLEMENT
Bohemen, H.D., Fraaij, A.L.A., Ottelé, M. (2008). Green roofs and the greening of vertical walls of buildings in urban areas. Ecocity World Summit 2008 Proceedings.
Cairns Jr., J., and Palmer, S. E (1995). Restoration of urban waterways and vacant areas: the first steps toward sustainability. Environmental Health Perspectives, 103(5), 452-453.
Cameron, R. W. F., Blanusa, T., Taylor, J. E., Salisbury, A., Halstead, A. J., Henricot, B., and Thomp-son, K (2012). The domestic garden - Its contribution to urban green infrastructure. Urban Forestry & Urban Greening, 11(2), 129-137.
Chiquet, C., Dover, J., and Mitchell, P (2012). Birds and the urban environment: the value of green walls. Urban Ecosystems, 1-10.
Cook-Patton, S. C., and Bauerle, T. L (2012). Potential benefits of plant diversity on vegetated roofs: A literature review. Journal of Environmental Management, 106, 85-92.
Dallimer, M., Irvine, K. N., Skinner, A. M. J., Davies, Z. G., Rouquette, J. R., Maltby, L. L., u. a (2012). Biodiversity and the Feel-Good Factor: Understanding Associations between Self-Reported Human Well-being and Species Richness. Bioscience, 62(1), 47-55.
Davies, Z. G., Edmondson, J. L., Heinemeyer, A., Leake, J. R., and Gaston, K. J (2011). Mapping an urban ecosystem service: quantifying above-ground carbon storage at a city-wide scale. Jour-nal of Applied Ecology, 48(5), 1125-1134.
Donnelly, R., and Marzluff, J. M (2004). Importance of reserve size and landscape context to ur-ban bird conservation. Conservation Biology, 18(3), 733-745.
Everaars, J., Strohbach, M. W., Gruber, B., and Dormann, C. F (2011). Microsite conditions domi-nate habitat selection of the red mason bee (Osmia bicornis, Hymenoptera: Megachilidae) in an urban environment: A case study from Leipzig, Germany. Landscape and Urban Planning, 103(1), 15-23.
Fernandez-Canero, R., and Gonzalez-Redondo, P (2010). Green Roofs as a Habitat for Birds: A Review. Journal of Animal and Veterinary Advances, 9(15), 2041-2052.
Fuller, R. A., Irvine, K. N., Devine-Wright, P., Warren, P. H., and Gaston, K. J (2007). Psychological benefits of greenspace increase with biodiversity. Biology Letters, 3(4), 390-394.
Goddard, M. A., Dougill, A. J., and Benton, T. G (2010). Scaling up from gardens: biodiversity con-servation in urban environments. Trends In Ecology & Evolution, 25(2), 90-98.
Haase, D., Haase, A., and Rink, D. (2014). Conceptualising the nexus between urban shrinkage and ecosystem services. Landscape and Urban Planning 132, 159–169.
Klingenfuß, C (2013). Was „leisten“ die Berliner Moore. Naturmagazin Berlin-Brandenburg, 27(4), 40-42.
Leather, S (2004). Biodiversity on urban roundabouts - Hemiptera, management and the species-area relationship. Basic and Applied Ecology, 5(4), 367-377.
Lososová, Z., Horsák, M., Chytrý, M., Čejka, T., Danihelka, J., Fajmon, K., et al. (2011). Diversity of Central European urban biota: effects of human-made habitat types on plants and land snails. Journal of Biogeography, 38(6), 1152-1163.
Mentens, J. ,Raes, D., Hermy, M. (2006). Green roofs as a tool for solving the rainwater runoff problem in the urbanized 21st century? Landscape and Urban Planning, 77 , 217–226,
A TYPOLOGY OF URBAN GREEN SPACES, ECOSYSTEM SERVICES PROVISIONING SERVICES AND DEMANDS • WP3 • Page 67
Niemelä, J., Saarela, S., Söderman, T., Kopperoinen, L., Yli-Pelkonen, V., Väre, S., and Kotze, D. J (2010). Using the ecosystem services approach for better planning and conservation of urban green spaces: a Finland case study. Biodiversity and Conservation, 19(11), 3225-3243.
Nowak, D. J., Stevens, J. C., Sisinni, S. M., and Luley, C. J (2002). Effects of urban tree management and species selection on atmospheric carbon dioxide. Journal of Arboriculture, 28(3), 113-122.
Orsini, F., Gasperi, D., Marchetti, L., Piovene, C., Draghetti, S., Ramazzotti, S., et al. (2014). Explor-ing the production capacity of rooftop gardens (RTGs) in urban agriculture: the potential im-pact on food and nutrition security, biodiversity and other ecosystem services in the city of Bologna. Food Security, 6(6), 781-792.
Pataki, D. E., Carreiro, M. M., Cherrier, J., Grulke, N. E., Jennings, V., Pincetl, S., et al. (2011). Cou-pling biogeochemical cycles in urban environments: ecosystem services, green solutions, and misconceptions. Frontiers In Ecology and the Environment, 9(1), 27-36.
Peschardt, K. K., Schipperijn, J., and Stigsdotter, U. K (2012). Use of Small Public Urban Green Spaces (SPUGS). Urban Forestry & Urban Greening, 11(3), 235-244.
Smith, R. M., Thompson, K., Hodgson, J. G., Warren, P. H., and Gaston, K. J (2006). Urban domestic gardens (IX): Composition and richness of the vascular plant flora, and implications for native biodiversity. Biological Conservation, 129(3), 312-322.
Sternberg, T., Viles, H., Cathersides, A., Edwards, M. (2010). Dust particulate absorption by ivy (Hedera helix L) on historic walls in urban environments. Science of the Total Environment, 409, 162–168
Sternberg, T., Viles, H., Cathersides, A. 2011. Evaluating the role of ivy (Hedera helix) in moderat-ing wall surface microclimates and contributing to the bioprotection of historic buildings. Building and Environment, 46, 293-297
Strohbach, M. W., and Haase, D (2012). Above-ground carbon storage by urban trees in Leipzig, Germany: Analysis of patterns in a European city. Landscape and Urban Planning, 104(1), 95-104.
Strohbach, M. W., Lerman, S. B., and Warren, P. S (2013). Are small greening areas enhancing bird diversity? Insights from community-driven greening projects in Boston. Landscape and Urban Planning, 114, 69-79.
Strohbach, M., Haase, D., and Kabisch, N (2009). Birds and the city: urban biodiversity, land use, and socioeconomics. Ecology and Society, 14(2).
TEEB – The Economics of Ecosystems and Biodiversity. (2011). TEEB Manual for Cities: Ecosys-tem Services in Urban Management. http://www.teebweb.org/
Taylor, J. R., and Lovell, S. T (2012). Mapping public and private spaces of urban agriculture in Chicago through the analysis of high-resolution aerial images in Google Earth. Landscape and Urban Planning, 108(1), 57-70.
Tyrväinen, L., Pauleit, S., Seeland, K., and de Vries, S (2005). Benefits and Uses of Urban Forests and Trees. In C. C. Konijnendijk, K. Nilsson, T. Randrup, and J. Schipperijn, Urban Forests and Trees (P. 81-114). Springer.
White, J., Antos, M., Fitzsimons, J., and Palmer, G (2005). Non-uniform bird assemblages in urban environments: the influence of streetscape vegetation. Landscape and Urban Planning, 71, 123-135.
Wong, N.H. (2010). Thermal evaluation of vertical greenery systems for building walls. Building and Environment, 45, 663-672

A TYPOLOGY OF URBAN GREEN SPACES, ECOSYSTEM SERVICES PROVISIONING SERVICES AND DEMANDS • WP3 • Page 68
Yokohari, M., and Bolthouse, J (2011). Planning for the slow lane: The need to restore working greenspaces in maturing contexts. Landscape and Urban Planning, 100(4), 421-424.
Zerbe, S., Maurer, U., Schmitz, S., and Sukopp, H (2003). Biodiversity in Berlin and its potential for nature conservation. Landscape and Urban Planning, 62(3), 139-148.
Zhao, X., Monnell, J. D., Niblick, B., Rovensky, C. D., and Landis, A. E (2014). The viability of biofuel production on urban marginal land: An analysis of metal contaminants and energy balance for Pittsburgh’s Sunflower Gardens. Landscape and Urban Planning, 124, 22-33.


