
ABSTRACT
Title of dissertation: Propellant Injection Strategy for SuppressingAcoustic Combustion Instability
Qina Diao, Doctor of Philosophy, 2010
Dissertation directed by: Associate Professor Kenneth YuDepartment of Aerospace Engineering
Shear-coaxial injector elements are often used in liquid-propellant-rocket thrust
chambers, where combustion instabilities remain a significant problem. A conven-
tional solution to the combustion instability problem relies on passive control tech-
niques that use empirically-developed hardware such as acoustic baffles and tuned
cavities. In addition to adding weight and decreasing engine performance, these de-
vices are designed using trial-and-error methods, which do not provide the capability
to predict the overall system stability characteristics in advance. In this thesis, two
novel control strategies that are based on propellant fluid dynamics were investigated
for mitigating acoustic instability involving shear-coaxial injector elements.
The new control strategies would use a set of controlled injectors allowing
local adjustment of propellant flow patterns for each operating condition, partic-
ularly when instability could become a problem. One strategy relies on reducing
the oxidizer-fuel density gradient by blending heavier methane with the main fuel,
hydrogen. Another strategy utilizes modifying the equivalence ratio to affect the
acoustic impedance through mixing and reaction rate changes. The potential ef-
fectiveness of these strategies was assessed by conducting unit-physics experiments.
Two different model combustors, one simulating a single-element injector test and
the other a double-element injector test, were designed and tested for flame-acoustic
interaction. For these experiments, the Reynolds number of the central oxygen jet
was kept between 4700 and 5500 making the injector flames sufficiently turbulent. A
compression driver, mounted on one side of the combustor wall, provided controlled
acoustic excitation to the injector flames, simulating the initial phase of flame-
acoustic interaction. Acoustic excitation was applied either as band-limited white
noise forcing between 100 Hz and 5000 Hz or as single-frequency, fixed-amplitude
forcing at 1150 Hz which represented a frequency least amplified by any resonance.
Effects of each control strategy on flame-acoustic interaction were assessed in terms
of modifying the acoustic resonance characteristics subject to white-noise excitation
and changes in flame brush thickness under single-frequency excitation.
In the methane blending experiments, the methane mole fraction was varied
between 0% and 63%. Under white noise excitation, up to 16% shift in a resonant
frequency was observed but the acoustic pressure spectra remained qualitatively
similar. For the fixed frequency forcing, the spatial extent of flame-acoustic inter-
action was substantially reduced. In the other experiments, the equivalence ratio of
the control injector was varied between zero and ∞, causing up to 40% shift in a
resonant frequency as well as changes in the acoustic pressure spectrum. These re-
sults open up the possibility of employing flow-based control to prevent combustion
instabilities in liquid-fueled rockets.
Propellant Injection Strategy for Suppressing Acoustic CombustionInstability
by
Qina Diao
Dissertation submitted to the Faculty of the Graduate School of theUniversity of Maryland, College Park in partial fulfillment
of the requirements for the degree ofDoctor of Philosophy
2010
Advisory Committee:Associate Professor Kenneth H. Yu, Chair/AdvisorAssociate Professor Robert M. Sanner, Co-Chair/Co-AdvisorProfessor Ashwani K. GuptaAssistant Professor J. Sean HumbertAssistant Professor Ray Sedwick

c© Copyright byQina Diao
2010

Dedication
To my dearest grandma and parents for their love and support.
ii
Acknowledgments
I am grateful to all the people who have made this thesis possible and because
of whom my Ph.D graduate experience has been one that I will cherish forever.
First of all I would like to sincerely thank my faculty advisor, Dr. Kenneth
Yu, for giving me the opportunity to work on this challenging project and for his
insightful guidance over the past five years. His enthusiasm and great knowledge
have been invaluable in opening my eyes and helping carry out my research. My
attitude and ability for research, from which I can benefit for the rest of my life,
have been significantly improved with his enormous help and patience.
I am also grateful to my co-advisor, Dr. Robert Sanner, for his deep thoughts,
discussions and the helpful comments he has provided regarding this dissertation.
All the courses I took with him rank as the best I have had. Dr. Sanner taught us
not only by providing knowledge, but also by broadening our views on all control
topics. I would like to thank my committee members Dr. Ashwani Gupta, Dr. Ray
Sedwick and Dr. Sean Humbert for their invaluable time reviewing this manuscript
and for providing critical feedback.
Thanks are due to Dr. Bin Pang for helping me to start my graduate student
life in University of Maryland. I am grateful to Dr. Amardip Ghosh for his constant
advice and help on this project and all my presentations. He is also a great friend
and time with him is always a learning experience. I own my most special thanks to
Vijay Ramasubramanian for his patience and encouragement. He always supports
me like a family not only on my research but also on my life. I owe many thanks to
iii
David Gers for providing me CFD simulation results and conducting experiments
with me for this research.
My colleagues, Camilo Aguilera, Sammy Park, and Colin VanDercreek in the
advanced propulsion research lab (APRL) have enriched my graduate life in many
ways and deserve a special mention. I would also like to thank my officemates Roland
Probst, Neal Smith, Justin Richeson, Jared Grauer and Jamie Meeroff. Additionally,
I express my gratitude to Gang Wang, Wei Hu, Min Mao, Chao Liu, Yunsheng Tang,
Lian Duan, Donglei Yu, Chen Zhang and Yi Wang for their friendship and support.
I would like to gratefully acknowledge financial support from NASA SVTI with
Claudia Meyer as program manager.
iv
Contents
1 Introduction 11.1 Background and Motivation . . . . . . . . . . . . . . . . . . . . . . . 1
1.1.1 Combustion Instability . . . . . . . . . . . . . . . . . . . . . . 11.1.2 Combustion Instability and Control in Liquid Rocket Engines 6
1.2 Technical Objectives . . . . . . . . . . . . . . . . . . . . . . . . . . . 81.3 Scope of Present Work . . . . . . . . . . . . . . . . . . . . . . . . . . 9
2 Literature Review 142.1 Combustion Instability . . . . . . . . . . . . . . . . . . . . . . . . . . 14
2.1.1 Mechanisms of Combustion Instability . . . . . . . . . . . . . 142.1.2 Combustion Instability in Liquid Rocket Engines . . . . . . . 22
2.2 Control of Combustion Instability . . . . . . . . . . . . . . . . . . . . 252.2.1 Passive Combustion Control . . . . . . . . . . . . . . . . . . . 252.2.2 Active Combustion Control . . . . . . . . . . . . . . . . . . . 29
3 Control Methodology and Experimental Strategy 363.1 Prior State-of-the-Art Control Methodologies: Passive Approaches . . 363.2 Selective Injectant Control Methodology and Experimental Strategy . 40
3.2.1 Control Methodology . . . . . . . . . . . . . . . . . . . . . . . 403.2.2 Experimental Strategy . . . . . . . . . . . . . . . . . . . . . . 42
4 Experimental Setup and Techniques 484.1 Description of Apparatus . . . . . . . . . . . . . . . . . . . . . . . . . 48
4.1.1 Combustor Design . . . . . . . . . . . . . . . . . . . . . . . . 504.1.2 Supply System for Fuel and Oxidizer . . . . . . . . . . . . . . 534.1.3 Acoustic Excitation System . . . . . . . . . . . . . . . . . . . 544.1.4 Data Acquisition System . . . . . . . . . . . . . . . . . . . . . 55
4.2 Test Techniques and Approaches . . . . . . . . . . . . . . . . . . . . 554.2.1 Acoustic Characterization . . . . . . . . . . . . . . . . . . . . 554.2.2 Rayleigh Index Measurements . . . . . . . . . . . . . . . . . . 564.2.3 Flow Visualization . . . . . . . . . . . . . . . . . . . . . . . . 58
5 Flame-Acoustic Interaction in Single-Injector Combustor 695.1 Introduction . . . . . . . . . . . . . . . . . . . . . . . . . . . . . . . . 695.2 Acoustic Characterization of Chamber . . . . . . . . . . . . . . . . . 70
v

5.2.1 Non-Reacting Flow . . . . . . . . . . . . . . . . . . . . . . . . 705.2.2 Reacting Flow . . . . . . . . . . . . . . . . . . . . . . . . . . . 74
5.3 Blended Fuel Effect on Acoustic Characterization of Chamber . . . . 765.3.1 Non-Reacting Flow . . . . . . . . . . . . . . . . . . . . . . . . 765.3.2 Reacting Flow . . . . . . . . . . . . . . . . . . . . . . . . . . . 79
5.4 Blended Fuel Effect on Flame Ignition Characteristics . . . . . . . . . 825.5 Blended Fuel Effect on Flame-Acoustic Interaction with Single Fre-
quency Forcing . . . . . . . . . . . . . . . . . . . . . . . . . . . . . . 825.5.1 OH* Chemiluminescence . . . . . . . . . . . . . . . . . . . . . 835.5.2 Rayleigh Index . . . . . . . . . . . . . . . . . . . . . . . . . . 845.5.3 Transition Process . . . . . . . . . . . . . . . . . . . . . . . . 87
5.6 Summary and Discussions . . . . . . . . . . . . . . . . . . . . . . . . 89
6 Control Demonstration in Double-Injector Combustor 1216.1 Introduction . . . . . . . . . . . . . . . . . . . . . . . . . . . . . . . . 1216.2 Acoustic Characterization of Chamber . . . . . . . . . . . . . . . . . 1226.3 Blended Fuel Effect on Acoustic Characterization of Chamber . . . . 1246.4 H2-O2 Equivalence Ratio Effect . . . . . . . . . . . . . . . . . . . . . 126
6.4.1 Effect on Acoustic Characterization of Chamber . . . . . . . . 1276.4.2 Effect on Flame Structure . . . . . . . . . . . . . . . . . . . . 130
6.5 Summary and Discussions . . . . . . . . . . . . . . . . . . . . . . . . 130
7 Conclusions and Future Work 1517.1 Conclusions . . . . . . . . . . . . . . . . . . . . . . . . . . . . . . . . 1517.2 Findings and Key Contributions . . . . . . . . . . . . . . . . . . . . . 155
7.2.1 New Control Strategies for Suppressing Combustion Instability 1557.2.2 Physical Mechanisms of the Strategies . . . . . . . . . . . . . 1567.2.3 Effectiveness of the Strategies . . . . . . . . . . . . . . . . . . 157
7.3 Future Work . . . . . . . . . . . . . . . . . . . . . . . . . . . . . . . . 158
vi

List of Tables
4.1 Coordinates of various tap locations in single-injector combustor . . . 51
4.2 Coordinates of various tap locations in double-injector combustor . . 52
5.1 Flow conditions for the tests in this chapter. . . . . . . . . . . . . . . 72
5.2 Comparison of measured spectral peak frequencies and calculated res-onance frequencies. . . . . . . . . . . . . . . . . . . . . . . . . . . . . 75
5.3 Comparison of measured spectral peak frequencies and calculated res-onance frequencies. . . . . . . . . . . . . . . . . . . . . . . . . . . . . 80
6.1 Flow conditions for fuel mixture tests . . . . . . . . . . . . . . . . . . 123
6.2 Comparison of measured spectral peak minimum frequencies and cal-culated resonance frequencies . . . . . . . . . . . . . . . . . . . . . . 124
6.3 Flow conditions for equivalence ratio tests . . . . . . . . . . . . . . . 127
vii

List of Figures
1.1 Schematic diagram of thermo-acoustic interaction as a feedback loop. 12
1.2 Flame stabilized in a straight duct. . . . . . . . . . . . . . . . . . . . 12
1.3 Thermo-acoustic block diagram of duct flame. . . . . . . . . . . . . . 13
1.4 Feedback cycle between heat release and combustion chamber acous-tics for duct flame. . . . . . . . . . . . . . . . . . . . . . . . . . . . . 13
2.1 Reacting fluid flow with heat added in a tube. . . . . . . . . . . . . . 33
2.2 The pressure fields for the lowest order modes commonly encounteredin circular cylindrical combustion chambers (Figure 8.2.2b of Harrjeand Reardon [1]). . . . . . . . . . . . . . . . . . . . . . . . . . . . . . 34
2.3 Examples of the arrangement and shapes of baffles fixed to the in-jector face of a liquid rocket(Figure 8.2.2d of Harrje and Reardon[1]). . . . . . . . . . . . . . . . . . . . . . . . . . . . . . . . . . . . . 35
3.1 Typical baffles are installed in the liquid rocket engine. . . . . . . . . 44
3.2 Acoustic pressure and velocity distributions for the fundamental modein a closed tube without baffles. . . . . . . . . . . . . . . . . . . . . . 45
3.3 Acoustic pressure and velocity distributions for the fundamental modein a closed tube with baffles placed at L/3 and 2L/3. . . . . . . . . . 45
3.4 F-1 engine and baffles on the injector plate (Oefelein and Yang 1993). 46
3.5 Typical baffles on the Apollo SPS engine injector plate. . . . . . . . . 47
3.6 Fluidic baffle: replacing the hardware baffle with controlled propel-lant injectors. . . . . . . . . . . . . . . . . . . . . . . . . . . . . . . . 47
viii

4.1 Overall setup of the single-injector shear coax combustor. . . . . . . . 60
4.2 Dimensions of the single-injector shear coax combustor. . . . . . . . . 61
4.3 Schematic drawing dimensions for the air, oxidizer and fuel inlets tosingle-injector combustor. Unit:inch. . . . . . . . . . . . . . . . . . . 62
4.4 Flow configuration for H2-O2 and H2-CH4-O2 flames in the single-injector combustor. . . . . . . . . . . . . . . . . . . . . . . . . . . . . 63
4.5 A close-up view of the injector flames and tap locations in the single-injector combustor. . . . . . . . . . . . . . . . . . . . . . . . . . . . . 64
4.6 Overall setup of the double-injector shear coax combustor. . . . . . . 65
4.7 Schematic view of the double-injector shear coax combustor for in-jector dimensions. Unit:inch. . . . . . . . . . . . . . . . . . . . . . . . 66
4.8 Schematic view of the double-injector shear coax combustor for oxi-dizer and fuel inlet. Unit:inch. . . . . . . . . . . . . . . . . . . . . . . 67
4.9 Dimensions of the injectors in the double-injector shear coax combus-tor, Unit:inch. . . . . . . . . . . . . . . . . . . . . . . . . . . . . . . . 68
4.10 Flow configuration for H2 and O2 flames in the double-injector com-bustor. . . . . . . . . . . . . . . . . . . . . . . . . . . . . . . . . . . . 68
5.1 Dynamic pressure spectrum of the “no-flow” case under white noiseacoustic excitation . . . . . . . . . . . . . . . . . . . . . . . . . . . . 92
5.2 Pressure spectrum of H2-O2 non-reacting case excited with whitenoise. . . . . . . . . . . . . . . . . . . . . . . . . . . . . . . . . . . . 93
5.3 Schematic illustration showing distribution of acoustic media in thecombustor. . . . . . . . . . . . . . . . . . . . . . . . . . . . . . . . . . 94
5.4 Pressure spectrum of H2-O2 reacting case excited with white noise. . 95
5.5 Pressure spectrum of non-reacting case excited with white noise. H2
mole fraction = 94% . . . . . . . . . . . . . . . . . . . . . . . . . . . 96
5.6 Pressure spectrum of non-reacting case excited with white noise. H2
mole fraction = 82% . . . . . . . . . . . . . . . . . . . . . . . . . . . 97
5.7 Pressure spectrum of non-reacting case excited with white noise. H2
mole fraction = 37% . . . . . . . . . . . . . . . . . . . . . . . . . . . 98
ix

5.8 The effect of fuel mixture composition on the frequency shift in thenon-reacting case. . . . . . . . . . . . . . . . . . . . . . . . . . . . . . 99
5.9 Pressure spectrum of reacting case excited with white noise. H2 molefraction = 94% . . . . . . . . . . . . . . . . . . . . . . . . . . . . . . 100
5.10 Pressure spectrum of reacting case excited with white noise. H2 molefraction = 82% . . . . . . . . . . . . . . . . . . . . . . . . . . . . . . 101
5.11 Pressure spectrum of reacting case excited with white noise. H2 molefraction = 37% . . . . . . . . . . . . . . . . . . . . . . . . . . . . . . 102
5.12 The effect of fuel mixture composition on the frequency shift in thereacting case. . . . . . . . . . . . . . . . . . . . . . . . . . . . . . . . 103
5.13 The effect of total heat release on pressure spectrum. H2 mole fraction= 99%. . . . . . . . . . . . . . . . . . . . . . . . . . . . . . . . . . . . 104
5.14 Chemiluminescence images of lifted flames using only CH4 as fuelwithout acoustic excitation. . . . . . . . . . . . . . . . . . . . . . . . 105
5.15 Choice of single forcing frequency from pressure spectrum. . . . . . . 106
5.16 OH* chemiluminescence images showing stability of acoustically forcedflames. Left columns are instantaneous images, right columns aretime-averaged images . . . . . . . . . . . . . . . . . . . . . . . . . . . 107
5.17 Comparison of behavior between forced at 1150 Hz and natural caseat Tap #9. H2 mole fraction = 99%. . . . . . . . . . . . . . . . . . . 108
5.18 Comparison of behavior between forced at 1150 Hz and natural caseat Tap #10. H2 mole fraction = 99%. . . . . . . . . . . . . . . . . . . 109
5.19 Comparison of behavior between forced at 1150 Hz and natural caseat Tap #11. H2 mole fraction = 99%. . . . . . . . . . . . . . . . . . . 110
5.20 Comparison of local OH* chemiluminescence fluctuations respondingto pressure oscillation. H2 mole fraction = 99% . . . . . . . . . . . . 111
5.21 Comparison of local OH* chemiluminescence fluctuations respondingto pressure oscillation. H2 mole fraction = 37% . . . . . . . . . . . . 112
5.22 Time traces of OH* chemiluminescence intensity, oscillation and localRayleigh index. Shaded region is positive Rayleigh index. . . . . . . . 113
5.23 Rayleigh index measurements showing stability of acoustically forcedflames for pure H2 and H2-CH4 blended fuel. . . . . . . . . . . . . . . 114
x
5.24 Transient behavior of flames with H2 mole fraction from 99% to 37%. 115
5.25 Transient behavior of flames with H2 mole fraction from 37% to 99%. 116
5.26 Time trace of heat release at Tap #9 associated with CH4 injectionat t = 0. . . . . . . . . . . . . . . . . . . . . . . . . . . . . . . . . . . 117
5.27 Transient behavior at Tap #9 associated with CH4 injection at t = 0. 118
5.28 Transient behavior at Tap #10 associated with CH4 injection at t = 0.119
5.29 Transient behavior at Tap #11 associated with CH4 injection at t = 0.120
6.1 Pressure spectrum for baseline case. . . . . . . . . . . . . . . . . . . . 133
6.2 Direction of acoustic excitation and pressure tap locations. . . . . . . 134
6.3 Frequency shift from fuel mixture with acoustic excitation from thespecially-controlled injector side. . . . . . . . . . . . . . . . . . . . . . 135
6.4 Frequency shift from fuel mixture with acoustic excitation from thestandard injector side. . . . . . . . . . . . . . . . . . . . . . . . . . . 136
6.5 Effect of equivalence ratio from modifying H2 mass flowrate withacoustic excitation from the specially-controlled injector side. . . . . . 137
6.6 Effect of equivalence ratio from shutting down H2 mass flow withacoustic excitation from the specially-controlled injector side. . . . . . 138
6.7 Effect of equivalence ratio from modifying H2 mass flowrate withacoustic excitation from the standard injector side. . . . . . . . . . . 139
6.8 Effect of equivalence ratio from shutting down H2 mass flow withacoustic excitation from the standard injector side. . . . . . . . . . . 140
6.9 Effect of equivalence ratio from modifying O2 mass flowrate withacoustic excitation from the specially-controlled injector side. . . . . . 141
6.10 Effect of equivalence ratio from shutting down O2 mass flow withacoustic excitation from the specially-controlled injector side. . . . . . 142
6.11 Effect of equivalence ratio from modifying O2 mass flowrate withacoustic excitation from the standard injector side. . . . . . . . . . . 143
6.12 Effect of equivalence ratio from shutting down O2 mass flow withacoustic excitation from the standard injector side. . . . . . . . . . . 144
xi

6.13 Frequency shift due to equivalence ratio between the fuel and oxidizer.145
6.14 Flame structure for the baseline case. Acoustic driver is on the leftside. . . . . . . . . . . . . . . . . . . . . . . . . . . . . . . . . . . . . 146
6.15 Flame structure with H2 mass flow shut down and acoustic excitationfrom the specially-controlled injector side. Acoustic driver is on theleft side. . . . . . . . . . . . . . . . . . . . . . . . . . . . . . . . . . . 147
6.16 Flame structure with H2 mass flow shut down and acoustic excitationfrom the standard injector side. Acoustic driver is on the left side. . . 148
6.17 Flame structure with O2 mass flow shut down and acoustic excitationfrom the specially-controlled injector side. Acoustic driver is on theleft side. . . . . . . . . . . . . . . . . . . . . . . . . . . . . . . . . . . 149
6.18 Flame structure with O2 mass flow shut down and acoustic excitationfrom the standard injector side. Acoustic driver is on the left side. . . 150
xii

Chapter 1
Introduction
1.1 Background and Motivation
1.1.1 Combustion Instability
Combustion instability poses serious risk to most power and propulsion sys-
tems. It has been intensively studied since the 1900s, but is still not completely un-
derstood. In most propulsion systems, the combustion processes are never perfectly
smooth. A certain amount of unsteadiness in the combustion is always present even
though it may be considered steady for analytical purposes. In general, combustion
can be considered “smooth” when pressure fluctuations during steady operation do
not exceed about ±5% of the mean chamber pressure. Combustion that exceeds
this level of pressure fluctuations at random intervals is regarded as rough combus-
tion. The severity of combustion roughness determines its impact during engine
operation. If the roughness lies within a certain range, the engine can still operate
1

successfully. At particular operating conditions, when the fluctuations of pressure
and velocity interact with the natural frequencies of the propellant supply system or
the chamber acoustics, periodic superimposed oscillations occur. In general, “com-
bustion instability” means a large amplitude oscillation of pressure, which occurs in
a organized pattern.
If the combustion oscillations exceed a certain threshold, they can cause detri-
mental effects, such as excessive pressure vibration forces, mechanical failure of
parts, or burn-through of the combustor walls. Such levels of combustion instabil-
ity can result in combustion system failures and destruction of vehicles or mission
failures. However, the existing body of theory and experiment has not provided a
sufficiently strong foundation to understand and predict these processes. Current
mathematical and computational tools in widespread use have also failed to yield
reliable techniques for predicting and controlling such problems. Hence, there are
at present only a few guidelines, based on painstaking trial-and-error, available to
help designers avoid combustion instabilities. It is therefore important to gain some
understanding of the underlying processes and attempt to suppress the combustion
instability to tolerable levels.
Combustion instability can be considered an unsteady motion of a dynamical
system, which sustains the oscillation behaviors over a broad range of frequencies.
The basic mechanisms of combustion instabilities are very similar, although com-
bustion instabilities occur in different types of engines, such as solid rockets, liquid
rockets, gas turbines and thrust augmentors or afterburners. Thermo-acoustic in-
stabilities, which are characterized by an interaction between the acoustic field and
2

periodic heat release, are the major cause of unstable combustion in combustors.
The combustion instability only occurs when the combustion processes couple with
the gas-dynamical motions, both of which may be stable themselves. However, the
entire system including the propellants, the propellant feed systems, the combus-
tion products that support the unsteady motions, and the chamber structure, is
unstable.
A combustion system consists of two dynamical systems: the chamber dynam-
ics and the combustion dynamics. The combustion chamber, a confined geometry,
possesses certain acoustic properties and acts as an amplifier of acoustical motions.
It can be considered analogous to an oscillator, in which the medium supports un-
steady wave motions. Thus, the geometry of the chamber and the speed of sound
in the flow medium are key factors, which have dominant influence on the acoustic
modes. The combustion process is very sensitive to pressure, density, and velocity
fluctuations. Flame fluctuation, which is due to burning process, can produce local
changes in the properties of flow. Those fluctuations propagate in the medium and
convert the local fluctuations to global unsteady behavior in the chamber. A feed-
back loop exists between the chamber acoustics and combustion dynamics, giving
the possibility for unstable oscillations. Figure 1.1 shows a model of the thermal sys-
tem with unsteady heat release in analogy to a feedback amplifier. In the language of
control theory, the oscillator is the medium in the combustion chamber, and the un-
steady motion of the combustion dynamics is considered the amplifier. Instabilities
will develop under certain conditions, which are addressed by Rayleigh’s Criterion.
It states that if the heat-release rate from the combustion process is in phase with
3

pressure oscillations, the system is unstable, and when the heat-release rate is out
of phase with the pressure oscillations, the system becomes stable. Rayleigh’s Cri-
terion will be discussed in detail in Section 2.1.1. A relatively small part of the
available energy is sufficient to produce unacceptably large unsteady motions due
to the feedback loop. Unsteady motions do not tend to attenuate easily, mainly
because combustion chambers are nearly closed in most applications. This fact sug-
gests that combustion instability can happen even with apparently slight changes
in the system.
The mechanism of thermo-acoustic instability is explained here by investigat-
ing a flame stabilized in a straight duct, shown in Figure 1.2. The acoustic properties
of the pieces of duct upstream and downstream of the flame are characterized by
the ducts acoustic impedance. The specific acoustic impedance is a ratio of acoustic
pressure, where ”acoustic” refers to oscillating component, to flow velocity, defined
as
Z =p′
u′
where p′ is pressure oscillation and u′ is velocity fluctuation. In Figure 1.2, the
upstream specific acoustic impedance is defined by Z1 =p′1
u′1
and the downstream
specific acoustic impedance is defined by Z2 =p′2
u′2. The characteristic impedance of
a medium for acoustic waves is analogous to the index of refraction of a transparent
medium for light waves. It is important in the determination of acoustic transmission
and reflection at the boundary of two materials having different acoustic impedances.
When combustion is present, the fluctuating heat release is mainly affected by the
4
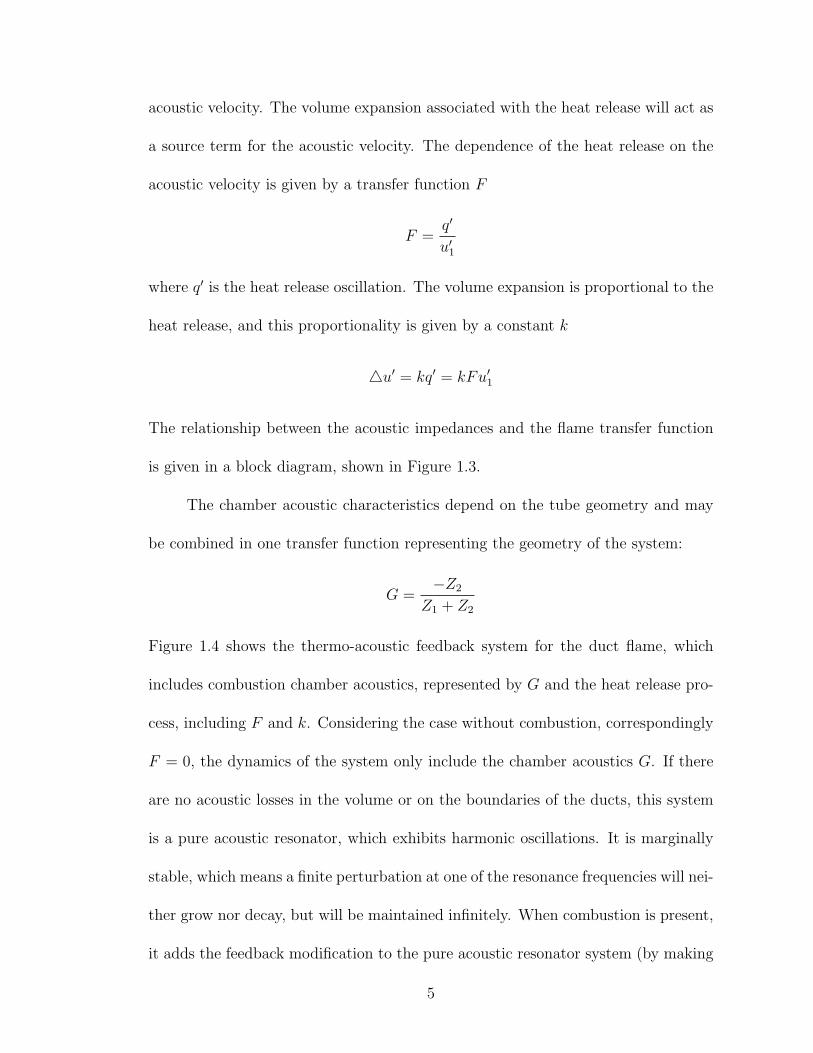
acoustic velocity. The volume expansion associated with the heat release will act as
a source term for the acoustic velocity. The dependence of the heat release on the
acoustic velocity is given by a transfer function F
F =q′
u′1
where q′ is the heat release oscillation. The volume expansion is proportional to the
heat release, and this proportionality is given by a constant k
4u′ = kq′ = kFu′1
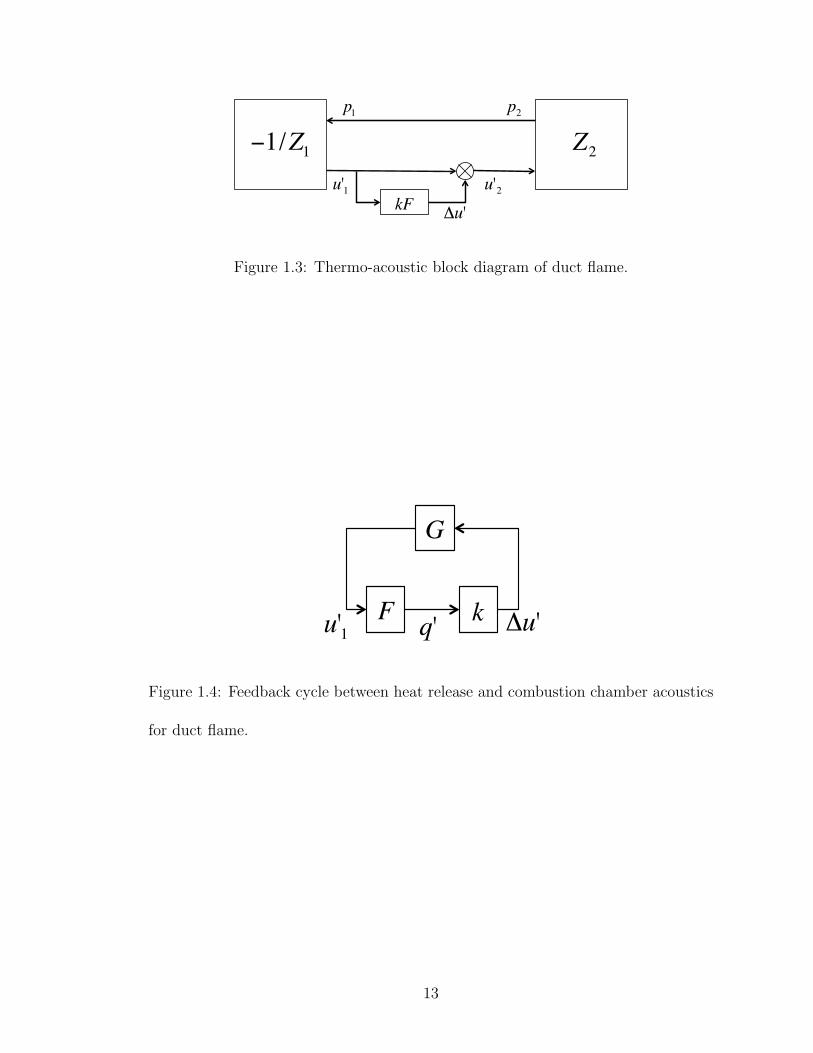
The relationship between the acoustic impedances and the flame transfer function
is given in a block diagram, shown in Figure 1.3.
The chamber acoustic characteristics depend on the tube geometry and may
be combined in one transfer function representing the geometry of the system:
G =−Z2
Z1 + Z2
Figure 1.4 shows the thermo-acoustic feedback system for the duct flame, which
includes combustion chamber acoustics, represented by G and the heat release pro-
cess, including F and k. Considering the case without combustion, correspondingly
F = 0, the dynamics of the system only include the chamber acoustics G. If there
are no acoustic losses in the volume or on the boundaries of the ducts, this system
is a pure acoustic resonator, which exhibits harmonic oscillations. It is marginally
stable, which means a finite perturbation at one of the resonance frequencies will nei-
ther grow nor decay, but will be maintained infinitely. When combustion is present,
it adds the feedback modification to the pure acoustic resonator system (by making
5
F non-zero). The combustion factor determines the system stability. Either acous-
tic impedance or flame dynamics can be manipulated to obtain a stable feedback
loop.
1.1.2 Combustion Instability and Control in Liquid Rocket
Engines
The problem of instabilities in liquid rockets has received great attention since
1930. For the combustion in liquid rocket engines, the chief mechanisms are associ-
ated with the propellant feed system; the injection system; the processes required
for conversion from liquid to gas; and combustion dynamics. The possibility of in-
stabilities occurring during development of a new device must always be recognized
and anticipated. Treating combustion instabilities is part of the cost for developing
liquid rockets.
The current and useful way to suppress combustion instability in liquid rocket
engine is hardware modifications based on trial-and-error testing, which is time con-
suming and expensive. For example, during the development of the F-1 engine from
October 1962 to September 1966, more than 3200 full-scale tests were involved.
Approximately 2000 of those tests were conducted to address the problems arising
with combustion instability. Effort to understand the basic physics of the instability
through the laboratory-scale or sub-scale tests is necessary for the design and devel-
opment of the liquid rocket engine. Significant complications in liquid rocket engines
are introduced by the flow and mixing of reactants, which occurs in the region near
6
the injectors. Thus interaction between flames and the flowfield near the injector
plays a key role to causing combustion instability in liquid rocket engines. This
work will study the flame-acoustic interaction near the injector in the laboratory
scale model combustors.
Typical methods of addressing combustion instability in liquid rocket engines
are the installation of baffles, resonators, or acoustic liners that suppress the for-
mation of resonant acoustic wave structures in the chamber. The essential point is
to force the resonance to occur in frequency ranges where the driving mechanisms
are inadequate to sustain oscillations, or to directly damp the mechanical energy
of unsteady motions. These are fixed hardware modifications made to the basic
physical configuration of the system, designed and implemented based on empirical
experience. Combustion instability is typically a critical issue only at some par-
ticular operating conditions, but hardware modifications must be carried through
the whole mission. Thus, such devices impose an undesirable penalty. From this
research, a novel combustion instability control method is suggested. Metal baffles
and similar devices may be replaced by specifically-modulated propellant injectors.
These controlled injectors can be used as standard injectors (i.e. stoichiometric)
during stable operation. Once the combustion tends to become unstable, the con-
trolled injectors would be modulated to steadily emit a different flow composition,
which would act like a baffle, thereby altering the acoustic characteristics of the
combustor.
7

1.2 Technical Objectives
The present work studies acoustically-driven combustion instability and the
overall goal is to explore the feasibility of a new control methodology for LOX-LH2
rocket engines using shear coaxial injectors. The technical objectives are as follows:
1. Study the basic physics of flame-acoustic interaction involving shear-coaxial
injector flow-field.
(a) Examine the characteristic response of flames subject to the standing
wave resonance modes.
(b) Assess the interaction between the flame fronts and acoustic traveling
waves.
(c) Investigate the effect of the fuel density by using CH4-H2 blended fuel
on flame-acoustic interaction with standing waves and acoustic traveling
waves during the onset of combustion instability.
2. Develop flow-based control approaches for combustion instability suppression,
which may replace the hardware-based passive-control approaches currently
being used.
(a) Investigate the feasibility of control flame-acoustic interaction by injec-
tion with different reactants at the hardware baffles location.
(b) Study the experimental approaches to characterize the control authority
for the new flow-based methodology.
8
3. Assess and analyze the potential effectiveness of these new approaches.
(a) Examine the approach with CH4-H2 blended fuel in the specially-modulated
injector in the double-element injector model combustor.
(b) Investigate the approach of using the original reactants, modifying the
equivalence ratio at the specially-modulated injector by altering the mass
flowrate of the individual reactants.
1.3 Scope of Present Work
This work experimentally investigates basic mechanisms of flame-acoustic in-
stabilities near the injectors and the feasibility of replacing hardware baffles with
controlled flow injection in two laboratory-scale combustors employing shear coaxial
injectors. Rocket engines intended for flight typically have hundreds of coaxial in-
jectors on the injector plates, while only one or two injectors are studied in this work
due to facility limitations. Two-dimensional cross-section models of the injectors are
used, as they offer ease of diagnostics, making it possible to study the relevant pro-
cesses with multiple detailed measurements. The experiments are limited to gaseous
oxygen and gaseous fuel mixtures, not just because of facility limitations but also in
an effort to minimize any complexity associated with atomization and vaporization
coupling. Because flames are formed between vaporized propellants in shear-coaxial
injectors, the use of non-cryogenic propellants in this study is not expected to affect
the essential features of the flame-acoustic coupling. In the experimental setup the
combustion chamber is open to the atmosphere due to safety consideration, while
9
working rocket engines operate with high pressures,up to 100 bar. The result
The model combustors have an acoustic driver unit mounted transversely,
which supplies the acoustic pressure necessary to simulate the flame acoustic inter-
actions that could occur near the injector plate of a typical liquid rocket engine.
The input signal to the acoustic driver can be manipulated to obtain the flame re-
sponse to different pressure wave patterns. Band-limited white noise gives a flame
interaction with standing waves, i.e. acoustic modes. In contrast, single forcing fre-
quency excitation produces a traveling wave response. Since the acoustic output of
the driver unit is limited, the experimental conditions are scaled-down, guarantee-
ing similar levels of acoustic excitation compared to natural turbulent fluctuations
of fluids. Consequently, the design in this work maintains some dominant aspects
of fluid behavior which happen in rocket engines and the analysis and results ob-
tained from this study should provide a better understanding of the problem under
consideration.
Passive control is currently the most popular and practical control method for
combustion instability in liquid rocket engines. Among all passive control methods,
baffles are a widely accepted design practice for overcoming or preventing high-
frequency instability. In this work, a new approach is suggested to simulate the
effect of the baffles by using selective controlled flow injection during operation.
Two different methods for employing controlled injectors were investigated. One
method used a specialized fuel consisting of CH4-H2 blend in the controlled injector,
while the other uses the same fuel as in the constant-flow injector, but changed the
injectant flow rates. For the first approach, the goal was to characterize the response
10
of acoustically-excited hydrogen-methane-oxygen flames as a function of mixture
composition with CH4 mole fraction from 0% to 63%, corresponding to oxidizer-fuel
density ratio from 16 to 3. For the second approach, only the equivalence ratio
between the fuel and oxidizer was varied from 0 to ∞ at the controlled injector
while retaining only H2-O2 as fuel and oxidizer.
In this dissertation, Chapter 2 gives the background and previous studies about
combustion instability, as well as control methods related to the current work. Chap-
ter 3 presents the new control methodology of modifying the reactant injection to
simulate the effect of baffles. Chapter 4 describes the experimental setup and ap-
proaches used in this study. Chapter 5 shows the effect of fuel density by introducing
CH4-H2 blended fuel on the flame-acoustic interaction in the single-element injector
combustor to assess the feasibility of the control methods proposed in Chapter 3.
Chapter 6 demonstrates the effectiveness of the two different ways of modifying flow
injection for the new control methodology in a double-element injector combustor.
Chapter 7 concludes the findings of this research and provides suggestions for future
work to apply this control methodology to flight-worthy liquid rocket engines.
11

Chamber Acoustics p’
Combustion Dynamics
Σ -
External Inputs
Figure 1.1: Schematic diagram of thermo-acoustic interaction as a feedback loop.
p1’
u1’
p2’
u2’q’
Figure 1.2: Flame stabilized in a straight duct.
12
€
−1/Z1
€
Z2€
p1
€
p2
€
kF
€
u'1
€
u'2
€
Δu'
Figure 1.3: Thermo-acoustic block diagram of duct flame.
€
F€
G
€
k
€
u'1
€
q'
€
Δu'
Figure 1.4: Feedback cycle between heat release and combustion chamber acoustics
for duct flame.
13

Chapter 2
Literature Review
2.1 Combustion Instability
2.1.1 Mechanisms of Combustion Instability
Thermo-acoustic combustion instabilities have been widely studied over a long
time because they lead to performance degradation and structural damage. These
instabilities have been observed in a variety of combustion applications, including
liquid and solid rocket engines [1, 2, 3, 4, 5, 6], ramjet engines [7, 8, 9, 10, 11, 12], jet
engine afterburners [13, 14], and land-based turbine engines [15]. Although these are
different propulsion systems and applications, the mechanism of these instabilities
is similar, namely the interaction between flames and acoustics.
Lord Rayleigh was one of the first scholarly investigators of thermo-acoustic
instability to develop a theoretical treatment of it as part of his research on the
excitation of acoustic waves by heat addition in chambers in 1878 [16]. He stated:
14

“If heat be periodically communicated to, and abstracted from, a mass of air
vibrating (for example) in a cylinder bounded by a piston, the effect produced will
depend upon the phase of the vibration at which the transfer of heat takes place. If
heat be given to the air at the moment of greatest condensation, or to be taken from
it at the moment of greatest rarefaction, the vibration is encouraged. On the other
hand, if heat be given at the moment of greatest rarefaction, or abstracted at the
moment of greatest condensation, the vibration is discouraged”.
This explanation for the presence of combustion instability is referred to as
“Rayleigh’s Criterion”, which is the most widely used tool for understanding the
susceptibility of a combustor to instability. Rayleigh addressed only the conditions
under which unsteady heat addition can encourage oscillations in the feedback loop
with acoustic pressure waves.
The mathematical representation of the Rayleigh’s criterion was first proposed
by Putnam and Dennis [17, 15] as
∫To
q′(t) · p′(t)dt > 0 (2.1)
where To represents the time period of one oscillation cycle, q′(t) is the instanta-
neous heat release oscillation and p′(t) is the instantaneous pressure fluctuation. If
the heat-release rate q′(t) from the combustion process is in phase with pressure
oscillations p′(t), the system is unstable, and when the heat-release rate is out of
phase with the pressure oscillations, the system becomes stable. The Rayleigh Index
G(x) is a mathematical way to quantify the coupling between unsteady heat release
and acoustic pressure fields, and is defined as
15
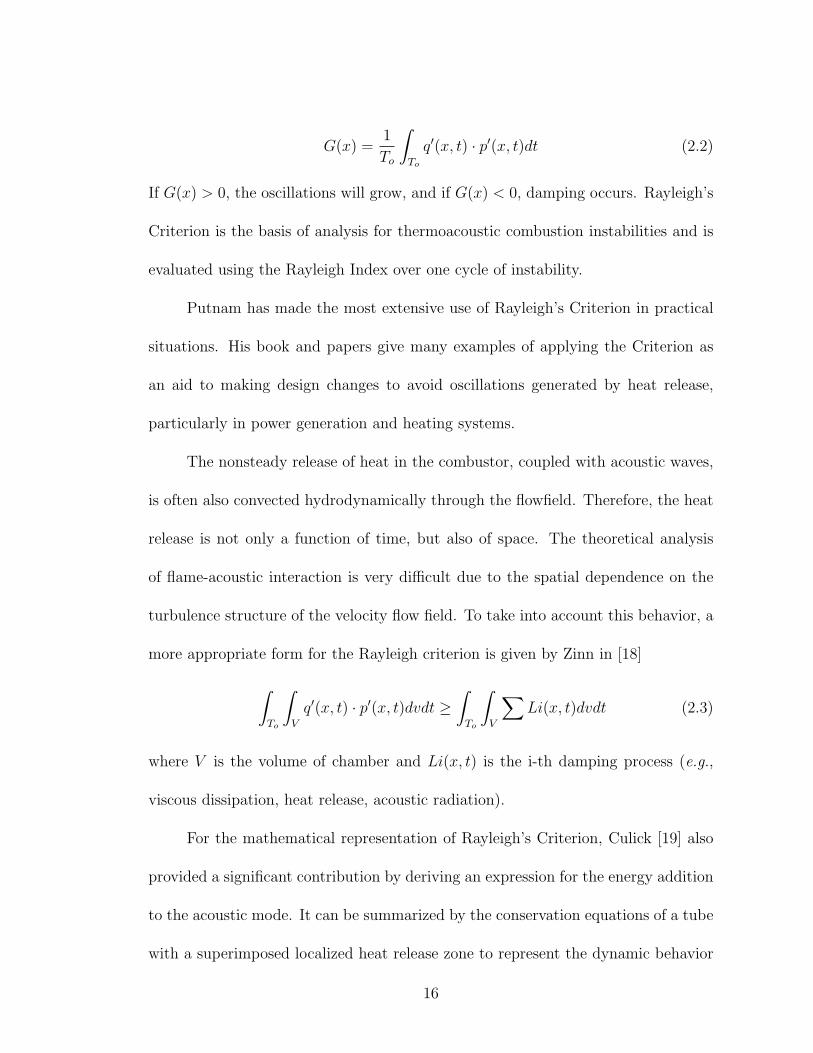
G(x) =1
To
∫To
q′(x, t) · p′(x, t)dt (2.2)
If G(x) > 0, the oscillations will grow, and if G(x) < 0, damping occurs. Rayleigh’s
Criterion is the basis of analysis for thermoacoustic combustion instabilities and is
evaluated using the Rayleigh Index over one cycle of instability.
Putnam has made the most extensive use of Rayleigh’s Criterion in practical
situations. His book and papers give many examples of applying the Criterion as
an aid to making design changes to avoid oscillations generated by heat release,
particularly in power generation and heating systems.
The nonsteady release of heat in the combustor, coupled with acoustic waves,
is often also convected hydrodynamically through the flowfield. Therefore, the heat
release is not only a function of time, but also of space. The theoretical analysis
of flame-acoustic interaction is very difficult due to the spatial dependence on the
turbulence structure of the velocity flow field. To take into account this behavior, a
more appropriate form for the Rayleigh criterion is given by Zinn in [18]
∫To
∫V
q′(x, t) · p′(x, t)dvdt ≥∫To
∫V
∑Li(x, t)dvdt (2.3)
where V is the volume of chamber and Li(x, t) is the i-th damping process (e.g.,
viscous dissipation, heat release, acoustic radiation).
For the mathematical representation of Rayleigh’s Criterion, Culick [19] also
provided a significant contribution by deriving an expression for the energy addition
to the acoustic mode. It can be summarized by the conservation equations of a tube
with a superimposed localized heat release zone to represent the dynamic behavior
16

of a combustion chamber as shown in Figure 2.1.
Assuming the flow is inviscid, stationary, perfect, and has negligible thermal
conductivity to the surroundings, the reactive gas dynamics conservation equations
for this one-dimensional flow in the longitudinal direction of the combustor are
Continuity:
∂ρ
∂t+∂(ρu)
∂x= 0 (2.4)
Momentum:
ρ∂u
∂t+ ρu
∂u
∂x+∂p
∂x= 0 (2.5)
Energy:
ρ∂e
∂t+ ρu
∂e
∂x= −p∂u
∂x+ q (2.6)
and the Equation of State:
p = ρRT (2.7)
where t is time, x is space, ρ is density, u is velocity, p is pressure, e is specific
internal energy, q is the heat release rate per unit volume, R is the gas constant,
and T is temperature.
Since only the small perturbation behavior at the onset of the instability is
under consideration here, the system can be linearized by separating the variables
into their mean value and small perturbation components.
p(x, t) = p(x) + p′(x, t) (2.8)
u(x, t) = u(x) + u′(x, t) (2.9)
ρ(x, t) = ρ(x) + ρ′(x, t) (2.10)
17
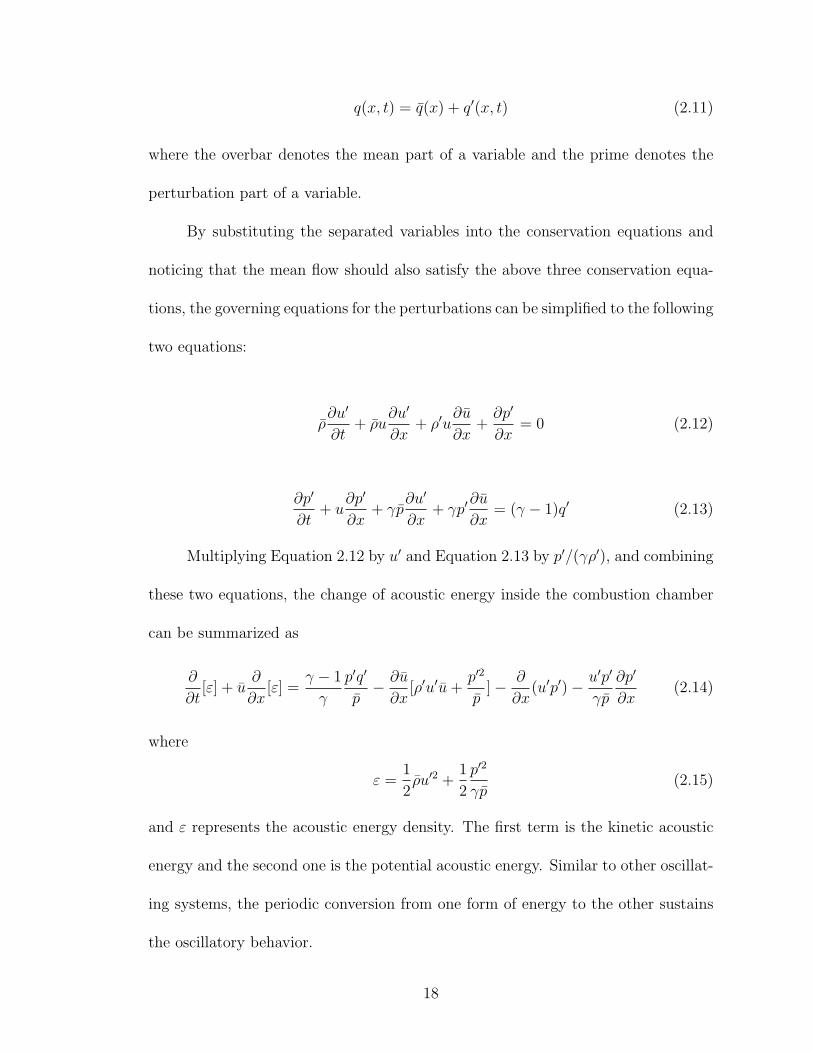
q(x, t) = q(x) + q′(x, t) (2.11)
where the overbar denotes the mean part of a variable and the prime denotes the
perturbation part of a variable.
By substituting the separated variables into the conservation equations and
noticing that the mean flow should also satisfy the above three conservation equa-
tions, the governing equations for the perturbations can be simplified to the following
two equations:
ρ∂u′
∂t+ ρu
∂u′
∂x+ ρ′u
∂u
∂x+∂p′
∂x= 0 (2.12)
∂p′
∂t+ u
∂p′
∂x+ γp
∂u′
∂x+ γp′
∂u
∂x= (γ − 1)q′ (2.13)
Multiplying Equation 2.12 by u′ and Equation 2.13 by p′/(γρ′), and combining
these two equations, the change of acoustic energy inside the combustion chamber
can be summarized as
∂
∂t[ε] + u
∂
∂x[ε] =
γ − 1
γ
p′q′
p− ∂u
∂x[ρ′u′u+
p′2
p]− ∂
∂x(u′p′)− u′p′
γp
∂p′
∂x(2.14)
where
ε =1
2ρu′2 +
1
2
p′2
γp(2.15)
and ε represents the acoustic energy density. The first term is the kinetic acoustic
energy and the second one is the potential acoustic energy. Similar to other oscillat-
ing systems, the periodic conversion from one form of energy to the other sustains
the oscillatory behavior.
18
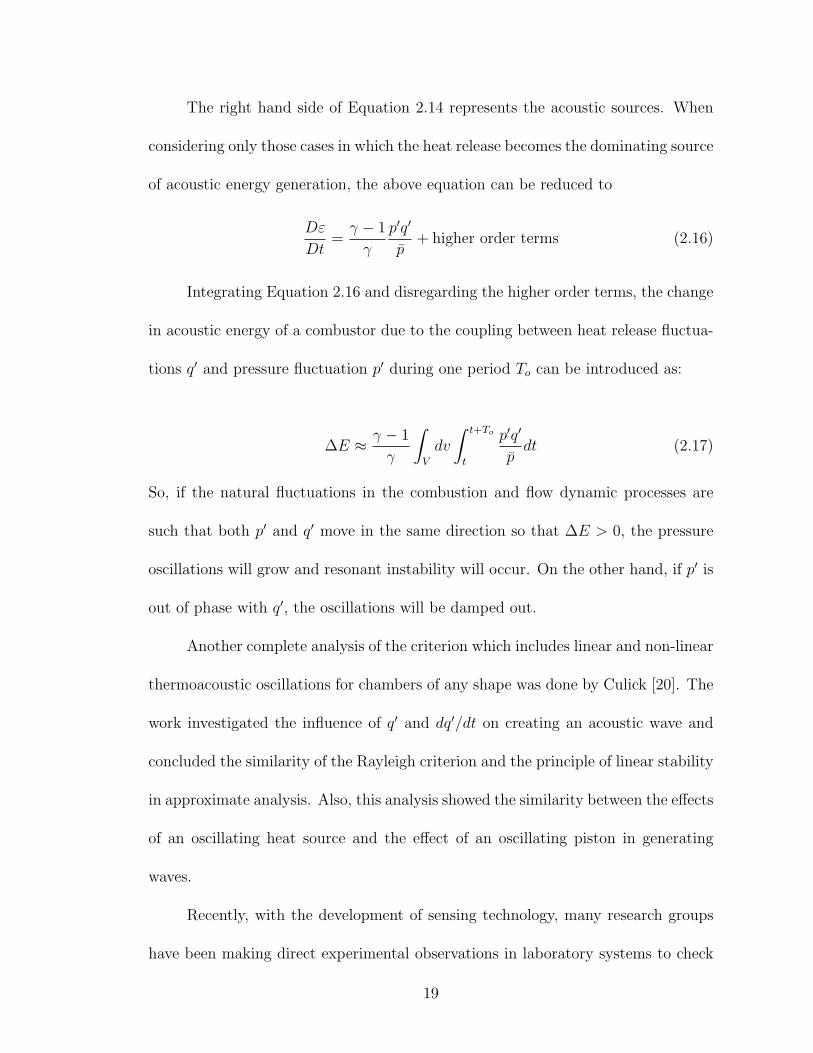
The right hand side of Equation 2.14 represents the acoustic sources. When
considering only those cases in which the heat release becomes the dominating source
of acoustic energy generation, the above equation can be reduced to
Dε
Dt=γ − 1
γ
p′q′
p+ higher order terms (2.16)
Integrating Equation 2.16 and disregarding the higher order terms, the change
in acoustic energy of a combustor due to the coupling between heat release fluctua-
tions q′ and pressure fluctuation p′ during one period To can be introduced as:
∆E ≈ γ − 1
γ
∫V
dv
∫ t+To
t
p′q′
pdt (2.17)
So, if the natural fluctuations in the combustion and flow dynamic processes are
such that both p′ and q′ move in the same direction so that ∆E > 0, the pressure
oscillations will grow and resonant instability will occur. On the other hand, if p′ is
out of phase with q′, the oscillations will be damped out.
Another complete analysis of the criterion which includes linear and non-linear
thermoacoustic oscillations for chambers of any shape was done by Culick [20]. The
work investigated the influence of q′ and dq′/dt on creating an acoustic wave and
concluded the similarity of the Rayleigh criterion and the principle of linear stability
in approximate analysis. Also, this analysis showed the similarity between the effects
of an oscillating heat source and the effect of an oscillating piston in generating
waves.
Recently, with the development of sensing technology, many research groups
have been making direct experimental observations in laboratory systems to check
19

the validity of the Criterion’s implications. The key assumption is that radiation
by certain intermediate species in reactions (OH* and CH* are the most common
identifiers) can be interpreted as a measure of the rate of chemical reactions taking
place and hence of the rate at which energy is released. Simultaneous measurements
of radiation in a system and the pressure oscillation can be obtained for calculating
the local Rayleigh Index. The results qualitatively assess the extent to which the
oscillations are being driven by the energy released in the combustion field. The
first report of simultaneous measurements of pressure and radiation allowing confir-
mation of Rayleigh’s Criterion appeared in a Ph.D. dissertation by Sterling [21, 22].
In Sterling’s work longitudinal instabilities were studied in a dump combustor, and
the integral of ∆E over the volume of the chamber was used as a measure of the
severity of oscillations. In this work, the local Rayleigh Index will be calculated by
simultaneous pressure measurements and OH* chemiluminescence measurements to
gain insight into flame-acoustic interaction.
A great deal of publications on the topic of combustion instability were put
forth in the latter half of the twentieth century. In 1960, Gaydon and Wolfhard [23]
reviewed earlier literature on the topic of unstable flames. Mechanisms by which
flames could trigger and amplify or suppress acoustic waves were studied and dis-
cussed by Toong, et al.[24]. Further, Toong, et al. noted that both linear and
non-linear flame-acoustic interaction modes were possible. As treatment of combus-
tion instability in the literature grew, occurrences in different types of combustion
applications initially received treatment as domain-specific issues. For example,
Price [25], Marxman and Wooldridge [26], and Sirignano [27] specifically discussed
20
combustion instability in solid rocket engines. On the other hand, Thring [28] con-
sidered combustion oscillations in industrial applications and classified these oscil-
lations into the categories of combustion roar, acoustic oscillations, and Helmholtz
resonator oscillations. In his comments regarding Thring’s paper, Zinn [28] made the
observation that the types of instabilities discussed bore similarity to instabilities
observed in solid and liquid rocket engines, and suggested a universal classification
system for the instabilities seen amongst various combustion systems. Papers on
combustion instability in gas turbines, such as Kydd’s [29], were also common.
In a book published in 1985, Williams [30] provided in-depth explanations
of combustion instabilities in rocket engines, both liquid and solid, detailing am-
plification and attenuation mechanisms. The discussion included topics such as
hydrodynamic and diffusive instabilities, nonlinear effects, and oscillatory burning
in liquid rocket engines. Additionally, 233 references on combustion instability were
cited. Laverdant, et al.[31] performed an analysis starting with the conservation
equations for mass, momentum, energy, and species, arriving at an expression for
the pressure perturbation in a combustion chamber with two source terms. Hydro-
dynamic processes leading to in-phase pressure and heat-release oscillations were
elaborated on by Candel [32]. Kendrick, et al. [33] predicted acoustic modes and
mode shapes in a laboratory dump combustor through the use of a one-dimensional
acoustic model. The effect of species generation on combustion instability was con-
sidered by Sreenivasan and Raghu [34], as an extension of work published by Chu
[35] in 1965.
21

2.1.2 Combustion Instability in Liquid Rocket Engines
During the initial development of rocket motors, many failures were caused
by combustion instabilities and the topic became of central importance. Reviews
of the early work on rocket instabilities were established by Crocco and Cheng
[2, 36, 37, 38]. Initially, there was a focus on the effect of “time lag”, i.e. the
inherent delay between the introduction of a particular volume element of propellant
into the combustion chamber and the subsequent heat release associated with that
element [39]. Within the time lag framework, the coupling between oscillations in the
propellant feed systems and combustion instability was studied by many, including
Gunder and Friant[40], Yachter [41], and Summerfield [39]. Crocco considered high-
frequency instability using the notion of a combination of constant time lag and
time-varying lag dependent on chamber conditions [42, 43].
Early experimental work, e.g., that of Berman and Cheney [44], involved the
use of methods such as photographic observation through window slits. Berman and
Cheney’s experiments allowed the observation of small disturbances developing into
high-amplitude waves with frequencies approaching the resonant frequencies of the
combustor. The optical data were correlated with pressure measurements in work by
Ellis et al [45]. Optical methods were further used to study transverse mode instabil-
ities by Ellis [46]. At NASA’s Lewis Research Center, Male, Kerslake, and Tischler
conducted optical studies of screaming combustion in liquid rocket engines[47]. In
these NASA Lewis studies, high wall heat transfer rates were observed, consistent
with today’s empirical experience with transverse instability modes. Interaction
22
between longitudinal and transverse oscillation modes was also witnessed.
Several key findings were made in Maslen and Moore’s work [48], wherein the
effects of damping in a cylindrical combustion chamber were considered analyti-
cally. The results indicated that if viscosity were neglected, large-amplitude waves
could exist in the form of the spinning tangential mode. Strong transverse waves
were found to potentially have highly destructive strength if coupled with energy in-
put from unsteady combustion. Osborn and Bonnell [49] performed experiments to
ascertain the effects of chamber pressure, chamber geometry, and propellant chem-
istry on combustion instability. With some propellants, it was found that when the
chamber was lengthened to the point that longitudinal instabilities were possible,
the stability of the transverse modes exhibited a distinct change in behavior. Ad-
ditionally, for propellants having greater heat-release rates, the instability region
tended to grow.
In 1960, Pickford et al. [50] employed the concept of available energy to at-
tempt calculations of stability behavior from prior understanding of the physical
and chemical nature of the propellants, the injection process, and related param-
eters. Reardon used Crocco’s time-varying lag theory to examine high-frequency
transverse modes in liquid rocket engines [51]. Both theoretical and experimen-
tal findings indicated standing tangential modes were more stable than spinning
tangential modes.
A full-scale M1 liquid O2-H2 rocket chamber was studied by Barsotti et al.[52].
Their experiments showed the fuel-to-oxidizer injection velocity ratio heavily influ-
enced the chamber stability. Increasing the hydrogen injection temperature, as well
23

as the velocity ratio, promoted greater operating stability. In 1969, Crocco [38]
noted that peak transverse mode oscillation amplitudes tended to occur close to the
injector.
Many types of instabilities are described in Putnam [15]. A comprehensive
reference on liquid rocket instabilities was assembled in the mid 1970s by Harrje
and Reardon [1]. This review provided the analytical models for low and high
frequency instabilities, experimental aspects of the study of instability and practical
guide to designers focusing on the aspects of excitation and damping. Williams also
presented a detailed examination [30] with special attention to studies of laminar
flame instabilities.
Modern reviews of combustion instabilities in liquid rocket engines have been
comprehensively undertaken by Culick [53] and Candel [32]. Mitchell specifically
reviewed the state of analytical modeling efforts, tracing back to the 1970s [54].
Included in Mitchell’s discussion was a treatment of contemporary developments in
liquid rocket combustion instability modeling. The methods considered included
both linear and nonlinear frameworks. Culick and Yang [5] presented a chronologi-
cal overview of research in liquid rocket combustion instability, covering linear and
nonlinear behaviors, as well as examples of combustion instability in operational
engines. An explanation of the elementary components in the dynamic combus-
tion system which can result in combustion instability was also included. A basic
classification of instabilities was proposed by Barrere and Williams [55].
24
2.2 Control of Combustion Instability
2.2.1 Passive Combustion Control
Passive control methods [53, 15, 56, 8] are the earliest developed control strate-
gies for combustion instability, and are still the most commonly used methods
amongst engine developers. All passive control strategies fall into two major cate-
gories. One involves changes in hardware design (e.g., in the composition or types
of reactants, injection system, chamber geometry) to reduce the susceptibility of the
combustion process to acoustic excitation. The other method removes energy from
the sound waves by the use of suitable resonators to introduce a dissipative process,
such as Helmholtz resonators, quarter wave tubes, perforated plates, or acoustic
liners. The drawback with passive approaches is that they tend to be effective only
over a limited range of operating conditions.
A baffle is a structure placed in a combustion chamber in such a fashion as
to reduce the amplitude of an unacceptable oscillation. Chapter 8 of the volume by
Harrje and Reardon [1] contains an extensive discussion of baffles. More detailed
considerations of particular applications and of special characteristics are covered
in the references cited. Baffles tend to prevent the transverse modes of oscillation
through geometric design. The standing transverse modes of instability, including
tangential and radial modes, are depicted in Figure 2.2. The particle paths and
the pressure antinodes for the first two tangential and radial modes are shown,
as well as three common combined modes: the first tangential-first radial; first
tangential-second radial; and second tangential-first radial modes. The shape and
25

optimum number of blades for any baffle configuration depends primarily on the
characteristics of the modes to which the system is most susceptible. Once these
are known or anticipated, a configuration of baffles may be chosen to interrupt the
motions, thus preventing formation of the mode in question. A variety of baffle
configurations used in liquid rockets have been considered, as shown in Figure 2.3.
Mitchell et al. [57, 58] investigated the effects of different configurations of
baffles on the acoustic field, without consideration of mean flow, using linear theory.
The most extensive published calculations for a simple configuration to determine
the main nonlinear acoustical effects of baffles were done by Wicker, Yoon, and
Yang [59]. It is infeasible to predict from first principles the stability and nonlinear
behavior of combustion systems due to intrinsic complexities and inevitable uncer-
tainties in basic information, such as material properties, chemical dynamics, and
the turbulent behavior of the flow flied. Hence the theories provide a framework for
interpreting observations, both in the laboratory and full-scale devices, to suggest
experiments to produce required data, to improve the empirical base for understand-
ing, to formulate guidelines for designing full-scale systems, and to understand the
fundamental principles governing the physical behavior. All theoretical work in this
field has been carried out in response to observational and experimental results.
Male and Kerslake [60] at NASA Lewis Research Center studied experimentally
the effectiveness of longitudinal fins in attenuating transverse mode instabilities in
rocket engines. They observed that “lateral oscillations appeared first at the injector
end and then spread throughout the chamber”. Also at Lewis Research Center, the
design criteria and practical considerations of baffles and acoustic absorbers were
26

explained in detail [56].
With respect to changes in the chamber geometry, Crocco and Sirignano [38]
showed that increasing the length of the convergent section of the nozzle could sup-
press the linear axial oscillations in the rocket chamber. In contrast, the transverse
modes were almost ineffectively damped.
The actual performance of a resonator in suppressing the combustion instabil-
ities depends on the resonator geometry and the operating conditions. Harrje et al.
[61] explored the effectiveness of acoustic cavities. When the passages connecting
the cavity with the chamber occurred at the pressure antinodes of a given mode, the
effectiveness increased. An increase in effectiveness also occurred when the acoustic
cavities were placed closer to the injectors. Laudien et al. [62] assessed the effec-
tiveness of both resonators and baffles in a model with cold flow (isothermal flow)
and showed that rounded corners at the resonator/combustor connection produce a
significant difference from square corners in the acoustic response. Two methods for
measuring the damping factor were suggested, including decay rate and bandwidth.
The values for the decay rate measured at room temperature will not be the same
as those applicable under operating conditions at high temperature and with flow.
However, as a qualitative indication, room temperature measurements and observa-
tions are extremely useful. Wanhainen et al. [63] studied Helmholtz type acoustic
damping devices in suppressing high frequency combustion instability in Hydrogen-
Oxygen rocket engines. Susceptibility to self-triggering under varying Hydrogen
injection temperatures was used as the criterion for assessing stability. The low-
est self-triggering temperature liner gave the most stable flame-acoustic interaction.
27

Also acoustically absorbent chamber walls were found to change the stability limits
and even the frequencies of the instability. Sirignano et al. [64] showed (for acoustic
cavity resonators derived from the Helmholtz resonator principle, typically used to
dampen oscillations in a combustor) that a jet is formed at the exit of the channel
connecting the combustion chamber with the resonant cavity. The eventual dissipa-
tion of the kinetic energy of the jet provides a non-linear damping mechanism whose
effectiveness improves with the oscillation amplitude.
More recently Gysling et al. [65] examined the use of Helmholtz resonators on
a sector rig combustor. Based on both theoretical modeling and experimental data,
several design variables, such as the ratio of the resonator to combustor volume, the
resonator frequency, and the loss coefficient at the resonator mouth were proven very
important in the design of resonators. They successfully demonstrated that using
two resonators tuned to two different frequencies can provide damping over a range
of frequencies. This is of critical importance since a given engine can experience
frequency shifts in resonant modes between different operating conditions. Bellucci
et al. [66] used a Helmholtz resonator model to design dampers that were added to
the silo combustor of a stationary gas turbine. The resonator model included more
physical detail for loss mechanisms than in Gysling [65]. Experimental testing was
used to establish the model parameters and then design resonators for the actual
combustion system, but this paper did not report the resonator performance at
other frequencies or operating conditions. Pandalai and Mongia [67] studied the
use of acoustic dampers on a lean premixed combustion system. They installed
damper tubes, whose length was one-quarter of a wavelength of the combustor
28

resonant frequency observed from engine tests, upstream of the combustor, just
prior to the fuel-air mixer. A perforated plate at the resonator mouth was used
to control the resonator impedance. These devices have functioned satisfactorily
and have accumulated over 100,000 hours of engine operation in factory testing and
commercial operation. Richards summarizes passive methods used to improve the
stability of low-emission combustors in stationary power gas turbines [68].
2.2.2 Active Combustion Control
Passive combustion control is an effective approach, but it can restrict the con-
trol performance to a narrow operating window. It may be ineffective at the low fre-
quencies at which some of the most damaging instabilities occur, and often changes
in hardware design to address such shortcomings are costly and time-consuming. In
contrast to passive control, the term “active control” implies control of a system
involving expenditure of energy from a source external to the system. Some system
input, such as the fuel flow rate or the combustor boundary condition, is varied
in response to a system measurement, such as a pressure or heat release signal.
Generally, the purpose is to minimize the difference of error between the instan-
taneous desired and actual behavior of the system so that the interaction between
the unsteady heat release and acoustic waves leads to decaying rather than growing
oscillations. The control input can be decided either without feedback (open loop
control) or with the feedback information about the actual response of the system
(closed loop control).
29
Active control theories were initially conceptually applied by Tsien [69] to
suppress the chugging instability in a liquid rocket engine. A combustion model
based on a pressure-dependent time lag between the instants of propellant injec-
tion and burning was used. The propellant injection rate was modulated through a
capacitor controlled by a servomechanism with the feedback of pressure signal. A
Nyquist plot was used to determine suitable servo coefficients for intrinsic stability.
Marble and Cox [70] and Lee et al. [71] also studied similar approaches for the con-
trol of low-frequency combustion instabilities in bipropellant liquid rocket engines.
Tsien’s method of active control was not applied in practice due to the limitations
of instrumentation at that time.
In the most recent five decades, active combustion control has been stud-
ied intensively as fast-response sensors and actuators have been developed rapidly.
Ffowcs-Williams described the concept of “anti-sound” in [72]. The basic idea is to
eliminate unwanted oscillations in an acoustic field by means of acoustic interference.
Control is achieved by producing waves out of phase with the unwanted oscillations.
Although this wave-cancellation technique is applicable to combustion systems in
principle, it is not practical to implement on a full-scale combustor because acous-
tic actuators such as loudspeakers cannot offer energy density comparable to levels
present in the oscillatory flow field. At Cambridge University, Dine [73] showed the
elimination of flame-acoustic instability in a Rijke tube with a phase-shift controller.
The unsteady heat-release rate was measured by CH* chemiluminescence and fed
back to a loudspeaker placed near one end of the tube to increase the acoustic energy
dissipation from the boundary. The same problem was also studied using a micro-
30

phone as a sensor, instead of a photo-multiplier [74, 75]. Results indicated that the
instabilities could be suppressed over a wide range of phase difference between un-
steady oscillations and actuating pressure waves with sufficiently large control gain.
These results implied that feasible active control of combustion instabilities is not
limited to the anti-sound technique, which would require the control excitation to
be precisely out of phase with existing oscillations.
Bloxsidge et al. explored the control of low-frequency combustion instabilities
in a laboratory jet-engine afterburner [76, 77]. Boundary condition variation was
achieved using a variable inlet nozzle area downstream of a choked plate. The peak
due to combustion instability in the pressure spectrum was reduced by 20 dB. Lang
et al. [78] and Poinsot et al. [79, 80] used a loudspeaker to control the instabilities in
a small laboratory burner with acoustic pressure measurement. The pressure signal,
obtained from a microphone located upstream of the chamber, was filtered, phase-
shifted, amplified, and then applied to the actuator. Their work demonstrated not
only the control system but also that active control techniques can be used effectively
to study the initial transient behavior of instabilities.
All the aforementioned active approaches suppress combustion instabilities by
mechanical means, such as loudspeakers or moving bodies. However for practical
systems containing high energy density, the power requirements of mechanical ac-
tuators become prohibitive at larger scales. A more attractive control methodology
is to vary the Rayleigh energy sources of oscillatory flow fields by fuel modulation.
Langhorne et al. [81] experimentally achieved feedback control through modulation
of the fuel supply in a laboratory afterburner. The phase-shift controller was de-
31

signed using Nyquist methods. Unsteady addition of just 3% excess fuel reduced the
spectral peak corresponding to the main instability mode by 12 dB. This method
offers a promising solution to problems of low-frequency oscillations in full-scale
combustors. Chu [82] studied a system consisting of a premixed ducted flame with
a pressure transducer upstream of the flame zone and fuel injection system for ac-
tuation. An H∞ robust controller was designed based on the constant flame speed
combustion model.
Many active combustion controllers for use on combustion models and laboratory-
scale rigs have been reported upon. However, only a few feedback control approaches
have been applied to full-scale engines thus far. Only fuel modulation and very sim-
ple controller designs were employed in these full-scale demonstrations. In 1988
Moran, et al. [83] showed feedback control on the afterburner of a Rolls-Royce
RB199 military turbofan engine. High-response electro-hydraulic servo valves were
used to spill fuel from the engine, rather than adding it. The modulated fuel was ap-
proximately 5-10% of the mean. They designed a simple gain/time-delay controller.
The results gave a 12dB reduction in the dominant low “buzz” frequency. Seume et
al. [84] and Hoffmann et al. [85] performed active combustion control on a Siemens
heavy duty industrial gas turbine. Actuation was performed by modulating the fuel
to the pilot flames using a Moog solenoid valve. The feedback signals were pres-
sure measurements at several locations around the combustor circumference. Simple
gain/phase-shift controllers were used. The dominant frequency was reduced by 17
dB. Researchers at United Technologies Research Center [86, 87] also demonstrated
active control on full-scale liquid fuel lean premixed combustors. Using a solenoid
32

valve to modulate the fuel supply, a 16 dB reduction of the dominant mode in a
single combustor and a 6.5 dB reduction in a 67.5 degree sector cut from a full
combustor annulus were obtained. The adaptive phase-shift controller designed by
Neumeier & Zinn [88] was also applied at full scale to a Siemens-Westinghouse Dry
Low NOx (DLN) combustor [89]. The dominant mode was reduced by 15 dB and
the NOx emissions were reduced by approximately 10%.
q
€
ρ
€
p
€
u
€
x = x f
Figure 2.1: Reacting fluid flow with heat added in a tube.
33
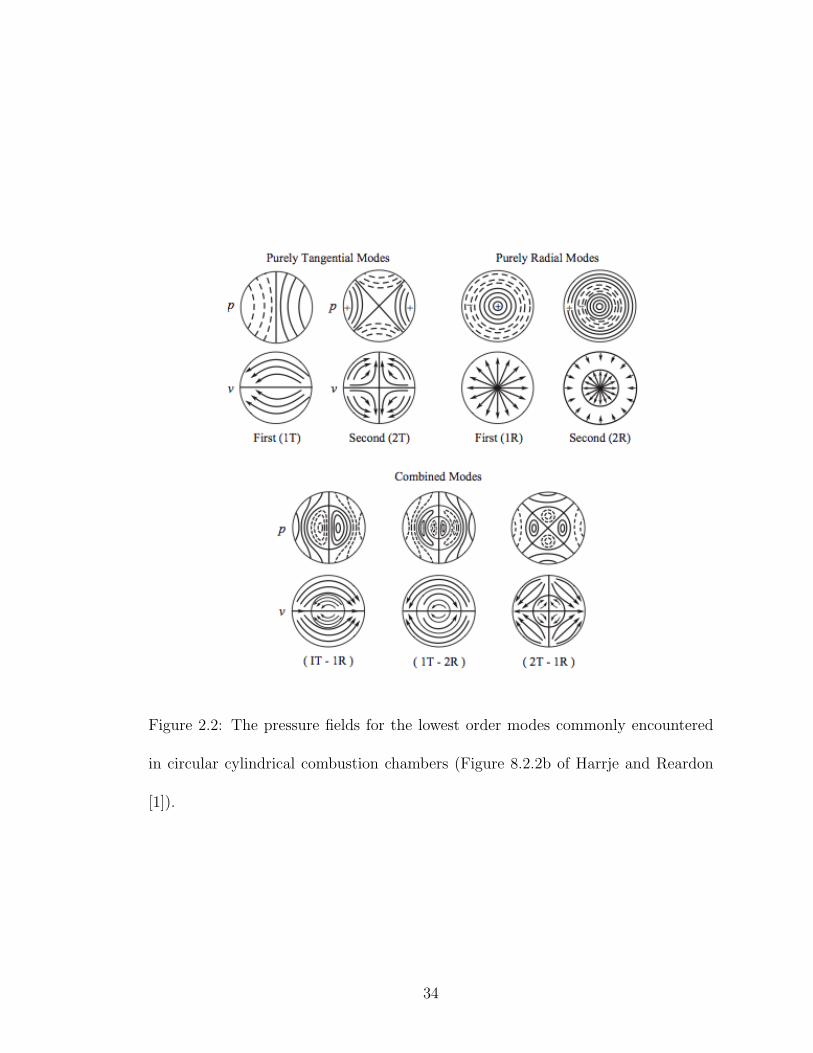
Figure 2.2: The pressure fields for the lowest order modes commonly encountered
in circular cylindrical combustion chambers (Figure 8.2.2b of Harrje and Reardon
[1]).
34

Figure 2.3: Examples of the arrangement and shapes of baffles fixed to the injector
face of a liquid rocket(Figure 8.2.2d of Harrje and Reardon [1]).
35
Chapter 3
Control Methodology and
Experimental Strategy
3.1 Prior State-of-the-Art Control Methodologies:
Passive Approaches
As previously discussed, combustion instability in liquid Hydrogen-Oxygen
rocket engines has been intensively studied for several decades[5, 6, 90]. Such insta-
bilities arise when pressure perturbations within the combustor couple sufficiently
in phase with heat release oscillations. When these phenomena occur, they can
cause severe increases in heat transfer rates and vibratory mechanical loads, which
can eventually lead to catastrophic failure of the engine. For rocket engine design-
ers, the goal is to ensure stable combustion with increasing system pressures and
temperatures over a wide range of operating conditions, while decreasing hardware
36
weight to optimize the overall flight system performance.
Typical methods of addressing combustion instability in liquid rocket engines
are the installation of baffles, resonators, or acoustic liners that suppress the forma-
tion of resonant acoustic wave structures in the chamber[5, 91]. Baffles are devices
that reduce the coupling between the combustion process and the fluid dynamics
of the engine system. Another method is to modify the combustion process by
changing the injection element characteristics to achieve stable combustion. These
methods all fall under the category of passive control techniques, because they are
fixed hardware modifications made to the basic physical design of the system. The
design of passive control elements is mainly qualitative and empirical, founded on
understanding the basic processes. To develop these practical means of passive con-
trol, trial and testing are necessary and the only effective way to achieve the desired
performance.
Baffles will be discussed in detail here because one application of the current
work is to simulate the effect of baffles in suppressing combustion oscillation in the
liquid rocket engines. Baffles suppress combustion instabilities by interfering with
the formation of the naturally preferred acoustic resonance in the combustion cham-
ber near the injectors. Baffles are physical barriers installed on the injector plate,
which divide the region close to injectors to several distinct sectors by changing
the boundary conditions. The local acoustic impedance of the baffle is drastically
different from the injector with reactants. Each sector has its own acoustic charac-
teristics, preventing the formation of the naturally preferred acoustic modes across
the injectors [92]. Figure 3.1 shows the baffles installed in the engine. Even though
37
there is still the potential to form the naturally preferred modes downstream in the
combustor, the acoustic modes of the whole combustor are changed substantially
by baffles. The oscillations of the flames interact less with the acoustic resonance
modes of the chamber with the baffles installed.
Changes in the acoustic environment effected by baffles can be visualized in
the case of a one-dimensional closed tube in Figures 3.2 and 3.3. In the closed
tube without baffles, the amplitudes of acoustic pressure oscillations are at their
minimum at the closed ends, while the amplitudes of acoustic velocity oscillations
are at their maximum. If baffles are installed in locations that are neither the node
nor anti-node of the pressure oscillation, the mode shapes are modified. The new
mode shapes are determined by the locations of the baffles, which change the acoustic
impedance boundary conditions. Different acoustic characteristics are obtained with
various baffle configurations. Figure 3.3 shows the pressure and velocity oscillations
with baffles at L/3 and 2L/3. However the baffles’ acoustic impedance must be
substantially different from that the medium in the tube.
Effective design and configuration of baffles require substantial testing and
experience. To eliminate instability, baffles must protrude into the chamber enough
to be effective. On the other hand, they should not extend too far, otherwise each
baffled compartment would act like an individual combustion chamber with its own
acoustic characteristics. For example the baffle design for the F-1 engine is shown
in Figure 3.4. The whole F-1 engine is about 19 feet long and the diameter of
the injector plate is around 3.3 feet, while the baffles extend about 0.25 feet. The
amplitudes of the pressure oscillation at the instability frequency are greater than
38

the mean chamber pressure in the chamber without baffles, while they are about
65% of the mean pressure with baffles.
Baffles are most effective on the transverse acoustic modes of instability which
includes tangential and radial modes. Transverse modes are characterized by os-
cillatory pressure waves and gas-particle motion parallel to the propellant injector
face. The first tangential mode is typically the major source of instability, which
can be subdued by the downstream extension of the baffles from the injector face.
However baffles have little impact on feed-system induced instabilities or longitudi-
nal instability modes. The control methods developed in the current work focus on
the transverse mode in the model combustor.
Whereas baffles are fixed hardware modifications made to the basic physical
configuration of the system, and designed and implemented based on empirical ex-
perience, combustion instability is typically a critical issue only at some particular
operating condition. Nonetheless hardware modifications must be carried through-
out the whole mission. Thus, such devices impose an undesirable penalty. In this
research, a novel combustion instability control method has been identified. Metal
baffles and similar devices may be replaced by specifically-modulated propellant
injectors.
39
3.2 Selective Injectant Control Methodology and
Experimental Strategy
3.2.1 Control Methodology
The current research aims to damp combustion instability in liquid rocket en-
gines that are nominally designed for Hydrogen and Oxygen propellants. The new
combustion instability control strategy is to simulate the effect of baffles by carefully
regulating the propellant mixture and quantity in selected injectors. For instance,
Figure 3.5 shows a typical configuration, with five radial baffles connected to a hub
baffle. Figure 3.6 illustrates a system of “fluidic baffles”: controlled injectors replace
the hardware baffles. In such a scheme, the specially-regulated injectors would be
arranged in a pattern similar to baffles. They can play a similar role as hardware
baffles in changing the acoustic characteristics within the combustor if these selec-
tive injectors offer a substantially different acoustic impedance from the standard
injectors. However, these controlled injectors can be used as standard injectors (i.e.
stoichiometric) during stable operation. Once the combustion tends to become un-
stable at some particular operating conditions, the controlled injectors would be
modulated to steadily emit a different flow composition, intended to substantially
change the acoustic impedance, thereby altering the acoustic characteristics of the
combustor.
Acoustic impedance is the main factor differentiating the controlled injectors
from the standard injectors. Varying injectant composition serves to change the
40
acoustic impedance characteristics of the column of fluid associated with the injec-
tor. In turn, the columns with modified acoustic impedance characteristics affect
the overall acoustic environment within the combustor. The effectiveness of these
changes in suppressing flame-acoustic interaction can be assessed by examining the
pressure spectra under forced excitation.
Two different approaches to regulate the propellant injection were investigated
to change the acoustic impedance. One approach used a specialized fuel consisting of
a H2-CH4 mixture in the controlled injector while retaining the same O2 as standard
injectors. However H2-CH4 blended fuel may not always be a practical solution, since
an extra tank for CH4 would have to be added to an H2-O2 system solely for control
purposes. Another possibility consists of using only the original reactants, but
operating the controlled injectors at a different equivalence ratio than the majority
of the injectors.
For the blended fuel method, modification of the density of the fuel can alter
the speed of sound in the fuel and the combustion products, so that the acoustic
impedance of the injected fluid is changed. To increase the overall density of the
fuel, CH4 was chosen to be blended with H2. The density of CH4 is eight times
that of H2, making it a good candidate by this criterion. Also, CH4 is compar-
atively cheap, and plentiful in the Martian environment, making it attractive for
future space exploration missions. Among the common hydrocarbons, CH4 has the
best specific impulse. Therefore, CH4 is selected as a candidate fuel to be used to
take advantage of the density difference to change the acoustic impedance of these
controlled injectors.
41

The other approach is to manipulate the mass flow rate of the original re-
actants, H2 and O2. This method removes the complications associated with the
supplying the additional CH4 fuel. In order to determine the potential effectiveness
of this approach, the effect of equivalence ratio on the acoustic characteristics of the
same multiple-element combustor was also examined. However, there remain some
practical issues that require consideration prior to the application of this control
method to flight hardware. Turning off the fuel and operating with only O2 can
lead to damage of the combustion chamber walls.
Real-time feedback control would be problematic due to the poor survivability
of sensors in the harsh operating environment. Even if suitable sensors could be
employed, most active control strategies rely on high-frequency fuel modulation on
the order of combustion instability frequencies. It would be difficult and impractical
to valve rocket reactant supplies in this fashion. The methods explored in this work
do not suffer such disadvantages and provide sufficient flexibility and adaptability
to allow their use in many applications.
3.2.2 Experimental Strategy
For the facilities in the Advanced Propulsion Research Lab at the Univer-
sity of Maryland, two model combustors were designed to study the feasibility of
the selective injectant control method for liquid rocket engines. Both models are
two-dimensional shear coaxial injector combustors. One involved a single injector
element, while the other involved two injector elements. Experiments were con-
42
ducted to characterize the flame-acoustic interaction and study the effect of the
fluid injection on the acoustic impedance.
In the single-injector combustor, experiments were conducted to estimate the
acoustic impedance variation with injected fuel. The results of these tests indicated
the possibility of tailored fluid injection being a good replacement for hardware baf-
fles as shown in Figure 3.3. If the acoustic impedance associated with the modified
fluid injection is substantially different from the standard H2-O2 operating condi-
tion, the modified injection is considered a promising control approach. Pressure
spectral measurements taken during combustor operation are good indicators of lo-
cal acoustic impedances since they are related to the local speed of sound. The
effect of the CH4-H2 blended fuel on chamber pressure spectra were investigated in
the single-injector model combustor.
The selective injection control method was experimentally demonstrated in
the double-injector combustor, in which one injector was operated in a standard
(stoichiometric H2-O2) configuration and the other was specifically-modulated. The
baseline case was both injectors operating with stoichiometric H2-O2 flow. Various
fluid configurations were tested in the specifically-modulated injector. The com-
parison between each controlled case and baseline case allowed evaluation of the
effectiveness of the control method.
43
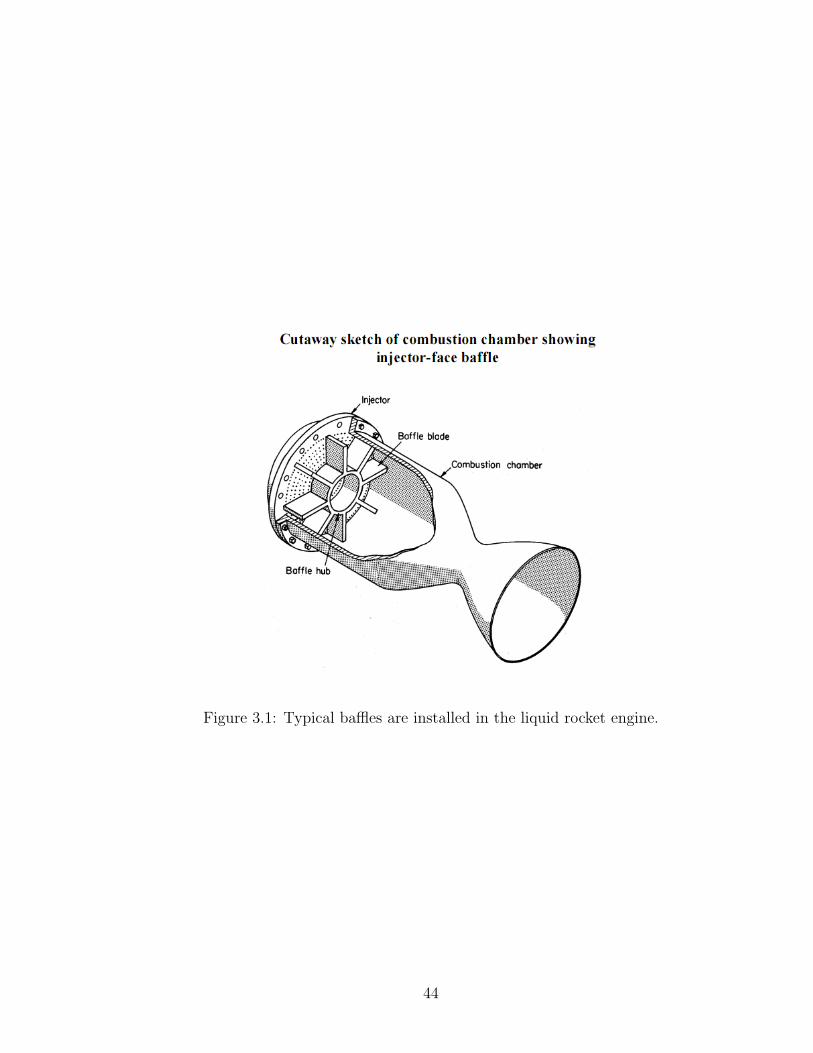
Figure 3.1: Typical baffles are installed in the liquid rocket engine.
44
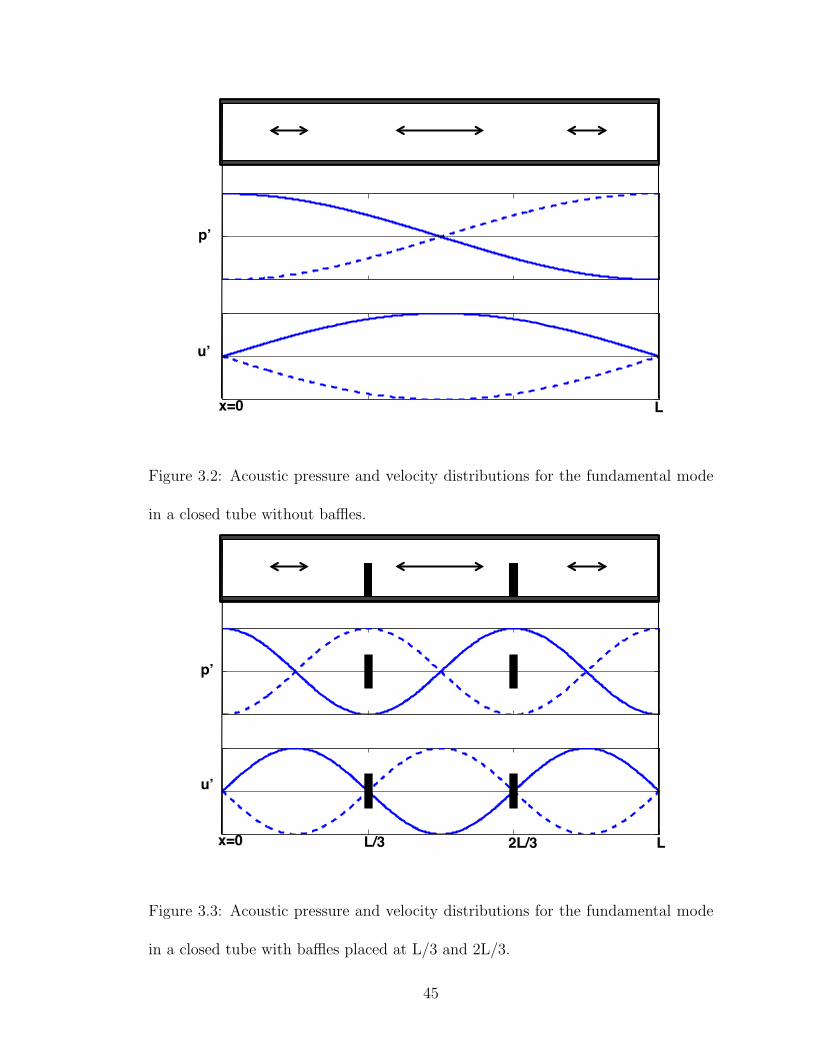
p’
u’
x=0 L
Figure 3.2: Acoustic pressure and velocity distributions for the fundamental mode
in a closed tube without baffles.
p’
u’
x=0 L/3 L2L/3
Figure 3.3: Acoustic pressure and velocity distributions for the fundamental mode
in a closed tube with baffles placed at L/3 and 2L/3.
45

(a) The F-1 engine
(b) The face of the injector showing the fourteen baffles
Figure 3.4: F-1 engine and baffles on the injector plate (Oefelein and Yang 1993).
46

Figure 3.5: Typical baffles on the Apollo SPS engine injector plate.
Figure 3.6: Fluidic baffle: replacing the hardware baffle with controlled propellant
injectors.
47
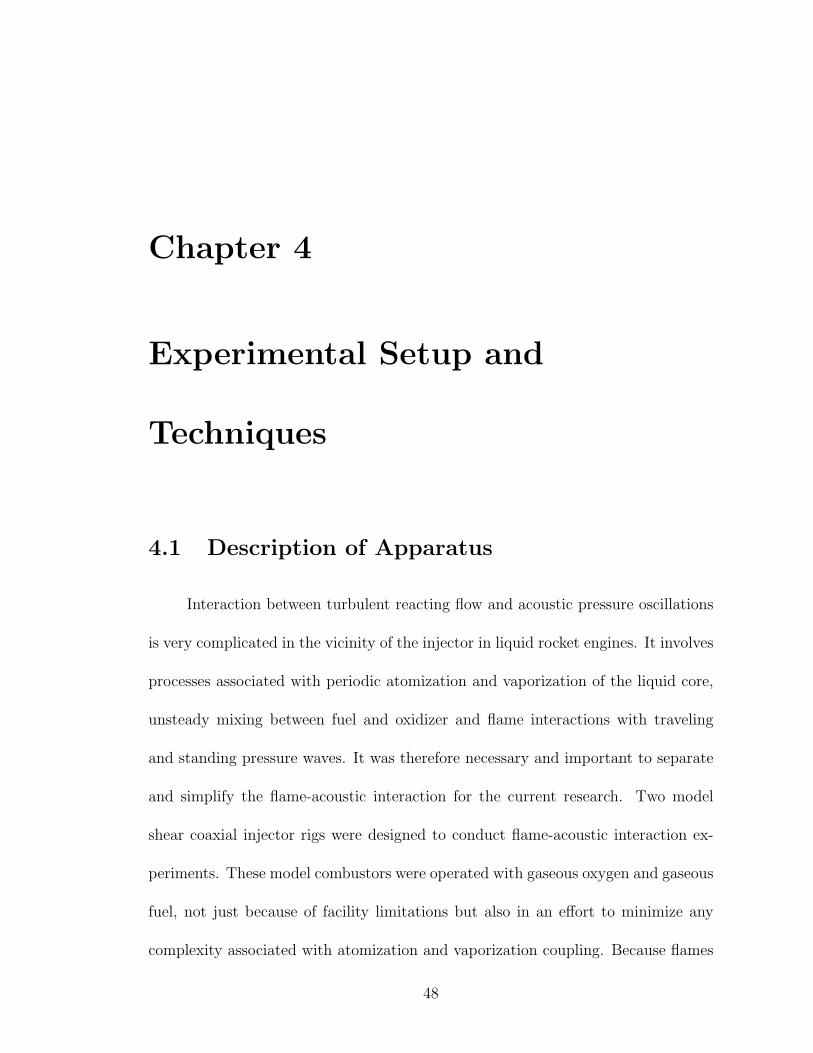
Chapter 4
Experimental Setup and
Techniques
4.1 Description of Apparatus
Interaction between turbulent reacting flow and acoustic pressure oscillations
is very complicated in the vicinity of the injector in liquid rocket engines. It involves
processes associated with periodic atomization and vaporization of the liquid core,
unsteady mixing between fuel and oxidizer and flame interactions with traveling
and standing pressure waves. It was therefore necessary and important to separate
and simplify the flame-acoustic interaction for the current research. Two model
shear coaxial injector rigs were designed to conduct flame-acoustic interaction ex-
periments. These model combustors were operated with gaseous oxygen and gaseous
fuel, not just because of facility limitations but also in an effort to minimize any
complexity associated with atomization and vaporization coupling. Because flames
48
are formed between vaporized propellants in shear-coaxial injectors even in full-scale
LOX-LH2 rocket engines, the use of non-cryogenic propellants in this study was not
expected to affect the essential features of the flame-acoustic coupling. The 2-D
models were chosen mainly for ease of diagnostics. A transversely mounted acoustic
driver was used to simulate acoustic conditions occurring in the neighborhood of
such injectors. As the acoustic output of the driver unit was limited, the model
experiments were conducted at scaled-down conditions, ensuring relatively strong
levels of acoustic excitation compared to the level of natural turbulent fluctuations.
Two experimental rigs, a single-injector combustor and a double-injector com-
bustor, were designed to study the mechanisms and demonstrate the control effec-
tiveness of the fluidic baffles. Different oxidizer and fuel configurations were applied
to the single-injector combustor to investigate the effect on the flame-acoustic in-
teraction. The objective was to understand the physical mechanisms that affect the
acoustic stability of shear-coaxial injector flames. The other combustor featured a
pair of shear-coaxial injector models, consisting of one controlled injector placed next
to a constant-flow GO2-GH2 injector. The objective was to quantify the changes in
acoustic resonance characteristics and to explore the feasibility of replacing acoustic
baffles with a series of controlled injectors.
49

4.1.1 Combustor Design
Single-Injector Combustor
A schematic drawing of the single-injector combustor setup is shown in Figure
4.1 and 4.2. The combustion chamber is rectangular with 3.5 in. width, 15 in. length,
and 0.375 in. depth. The central oxidizer jet is 0.75 in. wide at the base, while the
two co-flowing outer jets of fuel are each 0.25 in. wide. The flow configuration for
H2 and O2 is shown in Figure 4.4. The lip thickness between the center and outer
jets is 0.125 in. on each side. The injector end of the combustor was also provided
with 0.125 in. slots near the side walls for wall jet injection. Wall jets were only
used for igniting the combustor and were turned off once the diffusion flame system
between the center and the co-flowing jets was established. A pair of 1 in. thick
quartz windows provide optical access of the test section, thereby allowing direct
examination of the flame structure as well as chemiluminescence measurements.
One of the quartz windows can be replaced with a stainless steel metal window
fitted with a number of pressure taps for measuring local pressure fluctuations for
studies involving pressure measurements. The tap locations and name designations
are shown in Figure 4.5 and also summarized in Table 4.1.
Double-Injector Combustor
The double-injector combustor was designed in a similar pattern to the single-
injector combustor. Figure 4.6 is an overall schematic drawing of the double-injector
combustor. The combustion chamber is rectangular with 6.0 in. width, 15.0 in.
50
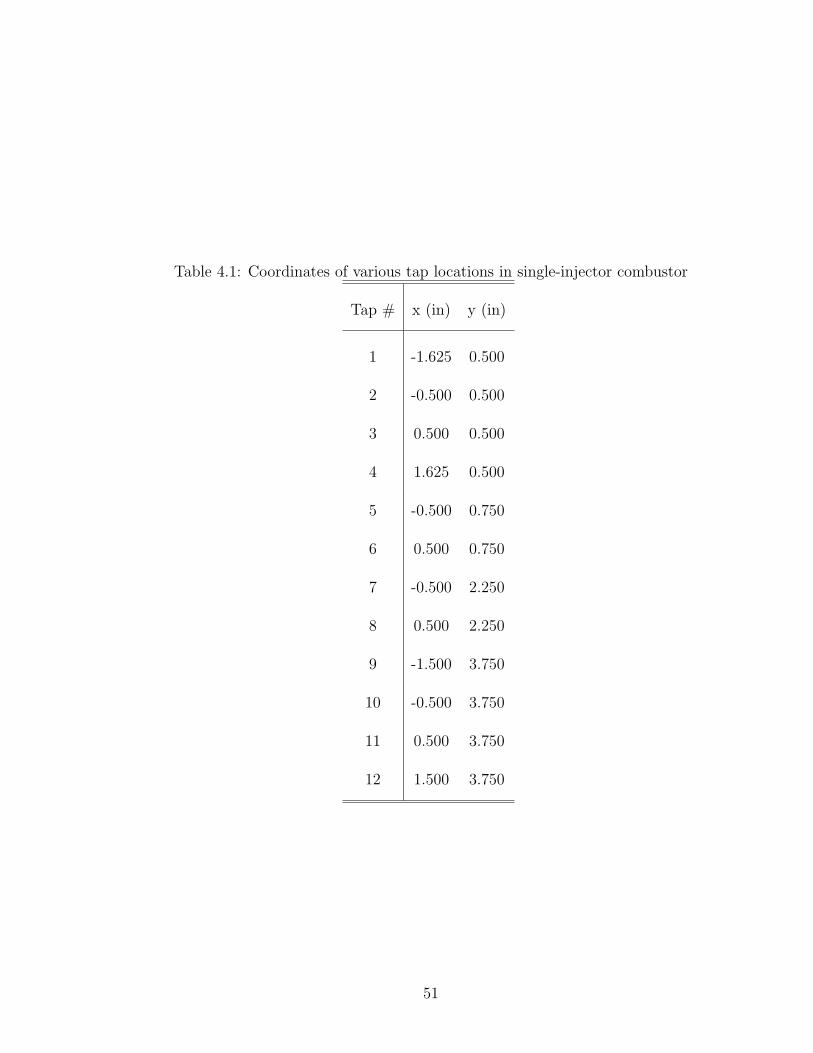
Table 4.1: Coordinates of various tap locations in single-injector combustor
Tap # x (in) y (in)
1 -1.625 0.500
2 -0.500 0.500
3 0.500 0.500
4 1.625 0.500
5 -0.500 0.750
6 0.500 0.750
7 -0.500 2.250
8 0.500 2.250
9 -1.500 3.750
10 -0.500 3.750
11 0.500 3.750
12 1.500 3.750
51

Table 4.2: Coordinates of various tap locations in double-injector combustor
Tap # x (in) y (in)
1 -2.400 0.500
2 0.000 0.500
3 2.400 0.500
length, and 0.5 in. depth. There are two complete injector elements in the combus-
tor. Each element is 1.2 in. wide. In each element, the central oxygen post is 0.6 in.,
the wall thickness between the center and outer jets is 0.1 in., and the co-flowing
outer jets of fuel are each 0.2 in. wide. The center-to-center spacing between the
two elements is 2.4 in. The dimensions of the injectors and the flow configuration
of H2 and O2 flames are shown in Figure 4.9 and 4.10. The side-wall thickness is
1.0 in. Similar to the single-injector combustor, there are 0.1 in. slots for air at the
injector end of the combustor near the side walls for wall jet injection. In total,
the rig width is 8.0 in. One side of the combustor is a 1.0 in. thick quartz window
which provides optical access to the test section. The other side of the combustor
is a stainless steel metal window fitted with three pressure taps for measuring local
pressure oscillations. The taps are positioned and designated as shown in Figure 4.6
and summarized in Table 4.2. Tap #2 is centered between the two oxidizer posts,
and the other two taps are each centered between their respective side walls and
outer jets.
52

4.1.2 Supply System for Fuel and Oxidizer
For both single-injector combustor and double-injector combustor experimen-
tal setups, test gases of hydrogen, oxygen, and methane were supplied from high-
pressure gas cylinders. The flow rates were metered using choked orifices. Stainless
steel honeycomb sections were placed in the injector tube to provide uniform inlet
velocity profiles and reduce the turbulence level at the injector exit. Setra pres-
sure transducers (Setra model - 206) were used to monitor the upstream stagnation
pressures of the metering orifices and the pressure values were read directly from
Setra Datum 2000 metering units. Pressure and choked orifice area values were used
to calculate mass flow rates. Electrically operated, normally-closed Parker Skinner
valves with 0.25 in orifices were used for switching purposes on the gas supply lines.
For experiments in which transient behavior was characterized, fuel lines were
modulated by two HR Textron R-DDV (Rotary-Direct Drive Valve) linear propor-
tional servo-valves (Part 27A50FV1E02). The limited angle, rotary torque motor
drives a valve spool directly through an ”eccentric” which is built into the motor
shaft. Rotary operation of the motor results in a linear spool motion which mod-
ulates fluid flow through the cylinder ports of the valve. The R-DDV servo-valve
utilizes an integrated electronic controller which is packaged into the motor enclo-
sure. The controller compares spool position, which is monitored by an electronic
device within the motor, with the input command signal. The resulting differ-
ence generates a current signal which drives the motor to the commanded position.
This signal is electronically enhanced to provide optimum valve performance and
53
linearity. The command signal of 0-10 volts is used to linearly control each servo-
valve’s effective open area. This property is used to control the mass flow rate of
the compressible gas, by holding the supply pressure constant. However, the servo
valves have some inevitable leakage even when the command signal is 0 volts. Thus,
normally-closed Parker Skinner valves were still used upstream to turn off the gas
flows completely.
4.1.3 Acoustic Excitation System
The model injector setup was acoustically forced using a 100 watt maximum
power compression driver with a nominal impedance of 16 ohms, mounted on one
side of the combustion chamber. Controlled pressure waves were applied through a
1 in by 0.125 in rectangular slot on the side wall. The acoustic driver had a range
of optimal operability between 100 Hz to 100,000 Hz.
A Wavetek 40 MHz Universal Waveform generator was used to excite the
chamber acoustically at various frequencies and amplitudes. This signal generator
provided various monotone and swept signals which were amplified through a Bogen
C-100 amplifier and fed into the compression driver. For the experiments where
broadband signals and band-limited white noise signals were required, LabVIEW-
based signal generators were also used. The average power used was 9 W for white
noise forcing and 12.5 W for fixed-frequency forcing.
54

4.1.4 Data Acquisition System
Data acquisition and computer-based experiment control were performed using
a Pentium IV PC equipped with a National Instruments PCI-6251 Multifunction
DAQ card, which was connected to a BNC 2120 Data Acquisition Board. National
Instruments’ LabVIEW 8 software was used to initiate the experiment and digitize
the measurement signals. A sampling frequency of 20 kHz was used in LabVIEW-
based Virtual Instruments.
In order to have maximum control and clarity over the experiment and the
data acquisition for transient process tests, a C-based software approach was chosen
over the LabVIEW implementations. The COMEDI (COntrol and MEasurement
Device Interface) software package was used with the GNU/Linux operating system
under a 2.6.20-family kernel. Customized C programs were written and evolved for
each type of experiment.
4.2 Test Techniques and Approaches
4.2.1 Acoustic Characterization
Acoustic resonance characteristics were investigated by probing the combus-
tion chamber using white noise acoustic excitation. This was done using a LabVIEW
software package to generate band-limited white noise, which was then fed into the
compression driver unit. Input acoustic energy from the driver was further amplified
or suppressed by flame-generated acoustics and system resonance characteristics.
55

The resulting output energy spectrum then reflected both the flame stability and
acoustic resonance characteristics of the combustion chamber.
The frequency range of the band-limited white noise was 100 Hz - 5000 Hz. A
Kistler 211B5 piezoelectric transducer, with a measurement range of 0 to 250 psi,
connected to a Kistler 5134A1 Piezotron coupler, was used for dynamic pressure
measurements. The transducer was flush-mounted on the side wall at the locations
shown in Figure 4.2 and 4.6 using Kistler 228P water-cooled adapters to protect
the transducers. The Piezotron coupler allowed filtering and amplification of signal
from the sensors. A low-pass filter of 10 kHz and a gain of 100 on the coupler were
typically used for examining pressure fluctuations. Data was sampled at rate of 20
kHz. The LabVIEW VI not only performed a runtime FFT on the sampled data but
also saved the data in files which were subsequently loaded into and analyzed with
FFT codes in MATLAB. About 400 spectra were averaged to obtain the results,
which show distinctive spectral peaks corresponding to various acoustic resonance
modes.
4.2.2 Rayleigh Index Measurements
When acoustic forcing is applied at a fixed frequency, the Rayleigh index
becomes a valuable tool by which flame-acoustic stability can be evaluated. Com-
putation of the Rayleigh index is performed using the simultaneous pressure oscil-
lation p′ and heat-release oscillation q′ measurements taken over one forcing cycle.
Local fluctuating pressures were measured using Kistler 211B5 piezoelectric trans-
56

ducers flush mounted on the metal window via water-cooled adapters, as described
in the previous section. Local heat release fluctuations were estimated using the
OH* chemiluminescence technique [79, 13, 93], which utilizes a custom-built setup
consisting of a Hamamatsu R3788 photomultiplier tube (PMT) featuring a high-
sensitivity Bi-Alkali Photocathode with good spectral response between 185 nm -
750 nm. It was integrated with a 308 nm band-pass filter for measuring the oscil-
lations of the diffusion flames. The sensor viewing area was a 0.44 in. radius circle
centered around each pressure tap location. A TENMA Regulated DC Power Sup-
ply provided the required 15 V DC for stable PMT operation while a potentiometer
allowed adjustable amplification of the voltage signal from the PMT to a level suit-
able for data acquisition. The chemiluminescence measurements were made at the
specified locations on the flame front where dynamic pressure sensor Taps #5 - #11
were located in the single-injector combustor, as shown in Figure 4.2. The PMT is
set up on a graduated mounting rail so that the precise position of the sensor area
with respect to the injector could be recorded.
To obtain the information from the digitized pressure transducer and PMT
signals, a high-pass FIR filter designed in the MATLAB software package’s fdatool
(Filter Design & Analysis Tool), was used. In experiments where the Rayleigh index
was computed, the sampling frequency was 11.5 kHz, which is ten times the forcing
frequency at 1150 Hz. The filter’s cut-off frequency was 1120 Hz, the order 1578
and it had a pass frequency of 1140 Hz. To eliminate the unwanted phase shift due
to simply applying the filter, a zero-phase filter was desired. MATLAB’s filtfilt.m
function was therefore used to effectively turn the given FIR filter into a zero-phase
57
filter by first filtering the sensor output in the forward direction, then taking the
filtered output, reversing it, and re-running the reversed output through the filter.
The final filtered sensor output contained the desired amplification or attenuation
of the specified frequencies, but no phase shifts.
Once the fluctuating components p′ and q′ were obtained from the filter rou-
tine, they were used in a MATLAB code to calculate the value of the local Rayleigh
index during each period. As the sampling frequency was chosen to be ten times
the forcing frequency, there were ten data points in each period. Consequently, for
each data point, the Rayleigh index was calculated as the sum of the products of
pressure oscillation p′ and heat release oscillation q′ over ten data points prior to
and including the current point.
4.2.3 Flow Visualization
OH*/CH* Chemiluminescence Visualizations
Chemiluminescence is often used in experiments to track the heat release os-
cillation [93]. Optical radiation from free OH* radicals is considered linearly related
to the chemical reaction rate, or equivalently, the heat release rate . In this work, a
DiCam Pro ICCD camera with a UV lens and a 308 nm band pass filter were used
to pick OH* chemiluminescence emissions from the flame. Images with exposure
times as low as 8 µs were recorded for instantaneous imaging. For the ensemble
averaged images, the camera exposure was increased to the order of 500 ms - 750
ms and a neutral density filter was used along with the bandpass filters to control
58
the net amount of light falling on the CCD sensor. For the flames involving CH4, a
430 nm band pass filter was used to detect the CH* chemiluminescence,
High Speed Cinematographic Imaging
To study the transient process, a Photron FASTCAM-Ultima 1024 high speed
camera was used to take high speed image sequences of flame front oscillations.
These images were used to observe the rollup of the diffusion flame front under trans-
verse acoustic forcing and subsequent pairing and merging of vortices. A desktop
PC running the Photron Fastcam software was used to capture and record images.
The camera had an acquisition rate of 60-16000 frames per second (monochrome)
and shutter speeds from 0.016 ms to 7.8 ms. For the requirements of the current
investigation, the high speed camera was operated at a frame rate of 1000 fps with
an associated exposure of 1 ms.
59
Figure 4.1: Overall setup of the single-injector shear coax combustor.
60
Figure 4.2: Dimensions of the single-injector shear coax combustor.
61

Figure 4.3: Schematic drawing dimensions for the air, oxidizer and fuel inlets to
single-injector combustor. Unit:inch.
62
(a) H2 and O2 flames
(b) CH4-H2 and O2 flames
Figure 4.4: Flow configuration for H2-O2 and H2-CH4-O2 flames in the single-injector
combustor.
63
Figure 4.5: A close-up view of the injector flames and tap locations in the single-
injector combustor.
64

Tp
Tp
Tp
O2 H2 CH4
Combustor6” x 15”
AcousticDriver
SignalGenerator
Amplifier
choked orifice
solenoid valve
regulator
fuel
(0.2
'')
fuel
(0.2
'')
fuel
(0.2
'')
fuel
(0.2
'')O
2 (0.
6'')
O2 (
0.6'
')
O2 H2 CH4
Tp
Tp
Tp
Tap 1 Tap 2 Tap 3
Figure 4.6: Overall setup of the double-injector shear coax combustor.
65
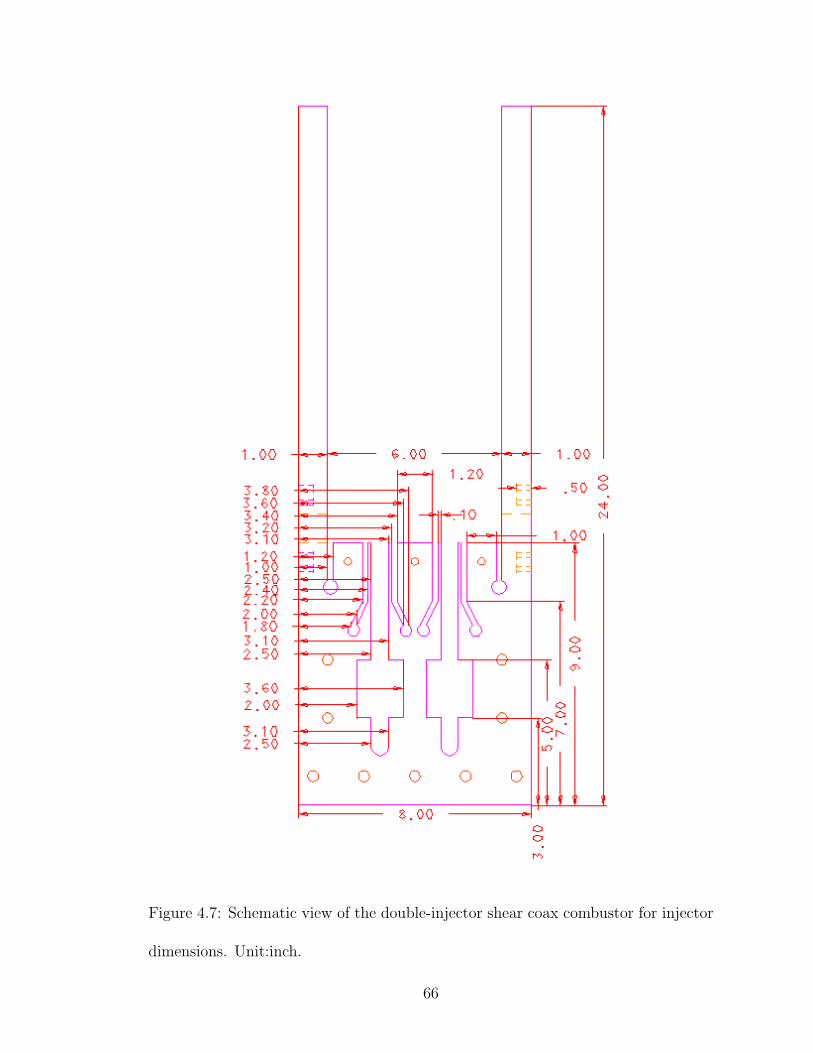
Figure 4.7: Schematic view of the double-injector shear coax combustor for injector
dimensions. Unit:inch.
66
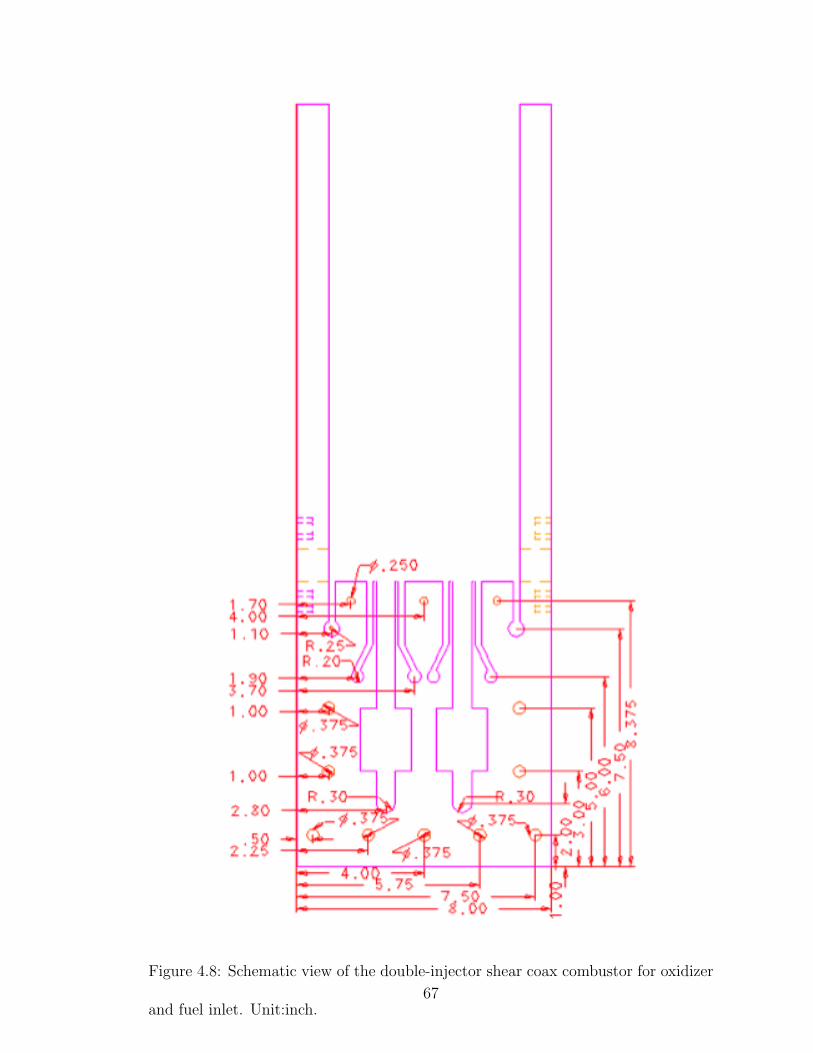
Figure 4.8: Schematic view of the double-injector shear coax combustor for oxidizer
and fuel inlet. Unit:inch.67
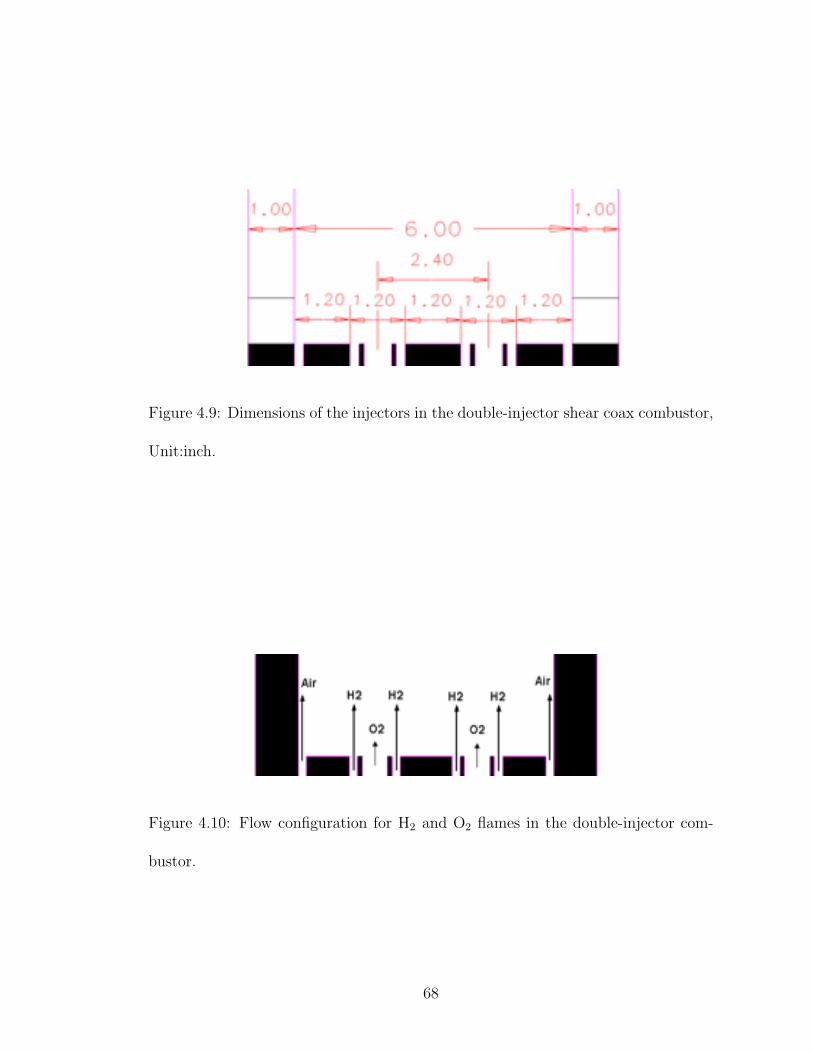
Figure 4.9: Dimensions of the injectors in the double-injector shear coax combustor,
Unit:inch.
Figure 4.10: Flow configuration for H2 and O2 flames in the double-injector com-
bustor.
68
Chapter 5
Flame-Acoustic Interaction in
Single-Injector Combustor
5.1 Introduction
Experimental investigations of acoustic characteristics and flame-acoustic in-
teraction in the single-injector model combustor are presented. Firstly, it was im-
portant to characterize the acoustic modes of the chamber so that interactions at
different frequencies and amplitudes could be better interpreted. This is discussed in
Section 5.2. The effect of fuel density on the acoustic resonance in the chamber was
studied by introducing CH4 as a secondary fuel, mixing it with H2, as discussed in
Section 5.3. Section 5.4 describes the ignition characteristics with H2-CH4 blended
fuel. To gain insight into the physical mechanisms that affect acoustic stability,
flames were excited using periodic forcing at a frequency not connected with acous-
tic resonances, as detailed in Section 5.5. The effect of the fuel density on the flame
69
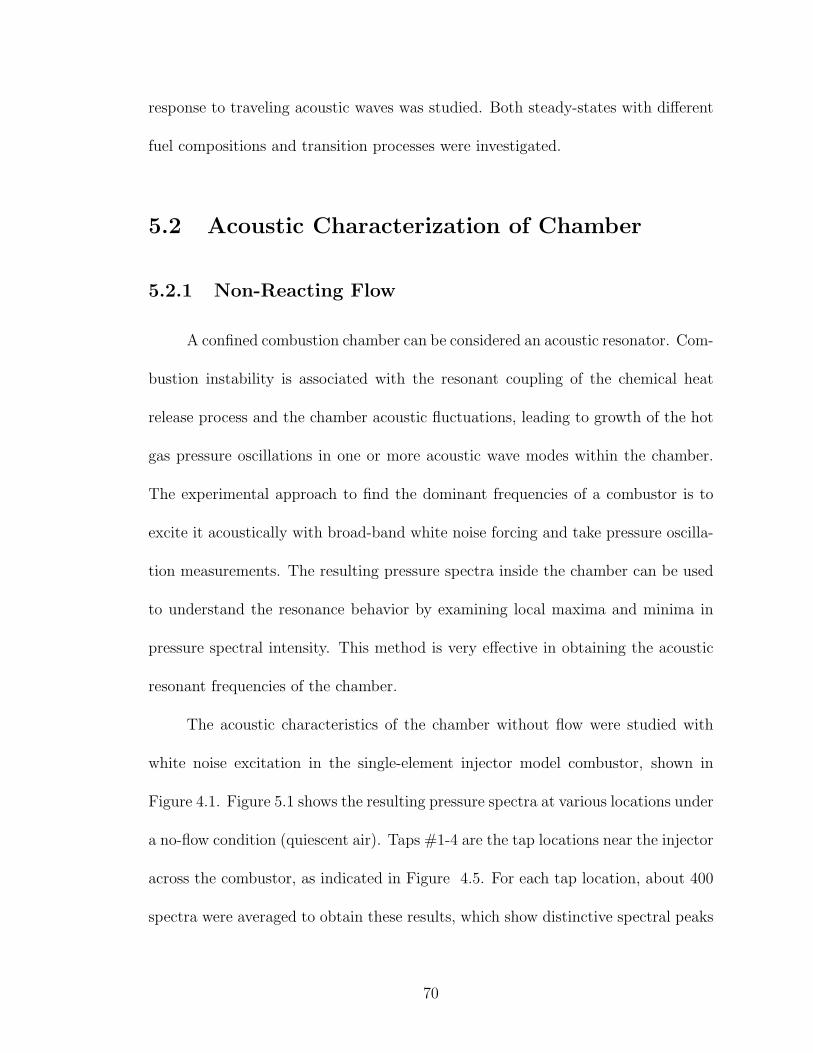
response to traveling acoustic waves was studied. Both steady-states with different
fuel compositions and transition processes were investigated.
5.2 Acoustic Characterization of Chamber
5.2.1 Non-Reacting Flow
A confined combustion chamber can be considered an acoustic resonator. Com-
bustion instability is associated with the resonant coupling of the chemical heat
release process and the chamber acoustic fluctuations, leading to growth of the hot
gas pressure oscillations in one or more acoustic wave modes within the chamber.
The experimental approach to find the dominant frequencies of a combustor is to
excite it acoustically with broad-band white noise forcing and take pressure oscilla-
tion measurements. The resulting pressure spectra inside the chamber can be used
to understand the resonance behavior by examining local maxima and minima in
pressure spectral intensity. This method is very effective in obtaining the acoustic
resonant frequencies of the chamber.
The acoustic characteristics of the chamber without flow were studied with
white noise excitation in the single-element injector model combustor, shown in
Figure 4.1. Figure 5.1 shows the resulting pressure spectra at various locations under
a no-flow condition (quiescent air). Taps #1-4 are the tap locations near the injector
across the combustor, as indicated in Figure 4.5. For each tap location, about 400
spectra were averaged to obtain these results, which show distinctive spectral peaks
70
corresponding to various acoustic resonance modes. While these spectra have many
spectral peaks, usually there are only a few dominant acoustic modes interacting
with the fluid injection. The coupling resonant modes are the key modes which can
interact with combustion oscillation in the reacting tests. Thus the acoustic modes
were identified with fluid injection experiments in these non-reacting flow tests.
With fuel and oxidizer injected, non-reacting experiments were conducted to
identify the various acoustic modes in the single-element injector model combustor
at room temperature. For the baseline case, involving only H2 and O2, the center jet
was O2, and the co-flowing jets were the fuel H2, as illustrated in Figure 4.4(a). The
flow conditions for all experiments in the single-injector combustor are summarized
in Table 5.1. For this set of experiments, the reactants injected are marked as
flow conditions A in Table 5.1. The fuel-oxidizer ratio was stoichiometric, and the
velocity of O2 was 4.5 m/s, which gave turbulent flow with a Reynolds number of
approximately 5500. Local pressure oscillations were also measured at Taps #1-4,
shown in the single-element combustor setup in Figure 4.2. The resulting pressure
spectra at these four tap locations are shown in Figure 5.2. These pressure spectra
show distinctive spectral peaks corresponding to various acoustic resonance modes
which couple with the fluid in the chamber. These modes have potential to interact
with the flame oscillation in the reacting flow cases. There are up to three distinctive
spectral peaks worth noting and they are denoted as f1, f2, and f3 in ascending order
of frequency.
For estimating these three acoustic resonance modes, a simple analytical mix-
ing model was used, as shown in Figure 5.3. The basic idea was to model distribution
71

Table 5.1: Flow conditions for the tests in this chapter.
Flow conditions A B C D E F G
H2 mole fraction (%) 100 99 99 94 82 37 0
CH4 mole fraction (%) 0 1 1 6 18 63 100%
H2 flowrate (g/s) 0.130 0.125 0.108 0.104 0.070 0.018 0
CH4 flowrate (g/s) 0 0.015 0.013 0.058 0.126 0.231 0.265
Fuel velocity (m/s) 13.5 13.0 11.3 11.3 8.7 4.6 3.8
O2 flowrate (g/s) 1.06 1.06 0.92 1.06 1.06 1.06 1.06
O2 velocity (m/s) 4.5 4.5 3.9 4.5 4.5 4.5 4.5
O2 Reynolds number 5500 5500 4700 5500 5500 5500 5500
Density ratio ρo/ρf 16.0 14.5 14.5 11.0 7.0 3.0 2.0
Velocity ratio uf/uo 3.0 2.9 2.9 2.5 1.9 1.0 0.8
Rate of heat release (kW) 16.1 15.9 13.8 15.5 14.9 13.8 11.9
72

of the fuel, the oxidizer and the fuel-oxidizer mixture within the combustor in a phys-
ically meaningful way in different regions of the combustor. The speed of sound in a
given region’s medium along with the boundary conditions could thus be obtained.
With the known dimensions of the combustor, the resonant frequencies could be
evaluated for various acoustic modes. The products were simply assumed to be a
stoichiometric mixture of fuel and oxidizer as dictated by initial flow rates. For the
cold flow tests, the temperature was considered room temperature. For instance,
since acoustic waves travel through different media in the transverse direction, the
quarter-wave mode in the transverse direction is evaluated as follows:
fλ/4 =1
4[(
Wo
ao
)+ 2
(Wf
af
)+(W−Wo−2Wf
ap
)] (5.1)
where ao, af , and ap denote the speed of sound as it travels through oxidizer, fuel
and products respectively, and where W , Wo and Wf denote the chamber width,
width of the oxidizer jet and width of the individual fuel jet respectively. In this
equation, the frequency of the transverse mode depends on the assumptions for
product composition and the regions of the fuel, oxidizer and product. For the
baseline case being considered here, the products were simply the stoichiometric
H2 and O2 mixture as dictated by the initial flow rates. Both longitudinal and
transverse modes were calculated by this methodology. Comparing the calculated
results and experimental data allowed identification of these acoustic modes.
On the basis of the isothermal flow investigations, the following findings were
made:
• The observed frequency f1 appears to be the quarter-wave mode of the oxi-
73
dizer post. The calculated frequency is in good agreement with the measured
frequencies.
• The observed frequency f2 appears to be the longitudinal three-quarter-wave
mode of the combustion chamber. While the accuracy of the frequency cal-
culation depends on how well the mixture composition can be predicted as a
function of spatial location, a full-mixing assumption results in a close approx-
imation of the frequency.
• The observed frequency f3 appears to be the transverse quarter-wave mode
of the combustor at the measured axial location. Assuming that this is the
transverse mode, the mode shape is also well predicted.
Table 5.2 lists and compares various spectral peaks obtained at these four tap
locations from the experimental data and the model analysis. The comparison of the
measured and calculated resonance frequencies is in good agreement and supports
the suggested physical mechanisms.
5.2.2 Reacting Flow
In a similar manner as in the non-reacting flow tests, reacting flow experiments
were conducted with band-limited white noise excitation. Again, the same flow
condition resulted in well-defined spectral peaks at Tap #1-4 as shown in Figure 5.4.
In these experiments, only two spectral peaks are worth noting and they are marked
as f1 and f2, while in the non-reacting flow tests, there are three spectral peaks.
Although the actual frequencies are obviously different from those in the isothermal
74

Table 5.2: Comparison of measured spectral peak frequencies and calculated reso-
nance frequencies.
Location Mode Measured (Hz) Calculated (Hz)
Tap #1
f1 434 ±10 430
f2 900 ±10 980
f3 1508 ±10 1430
Tap #2
f1 434 ±10 430
f2 933 ±10 980
f3 1508 ±10 1430
Tap #3
f1 433 ±10 430
f2 1017 ±10 980
f3 1580±10 1430
Tap #4
f1 438 ±10 430
f2 1011 ±10 980
f3 1528 ±10 1430
75
experiments due to the temperature change, the nature of the two dominant modes
appears to be the same. More precisely, the frequency f1 appears to be related to
the longitudinal quarter-wave mode of the oxygen post and the frequency f2 appears
to be the longitudinal three-quarter-wave mode of the combustion chamber. The
combustion temperature can be calculated from the difference between the speed
of sound in the isothermal case and reacting case. The estimated temperature is
within reasonable bounds.
Another interesting observation for the reacting flow spectra is that the spec-
tral peak shapes and frequencies are more dependent on the measurement location
than the non-reacting flow spectra. A likely explanation is the high sensitivity of
product temperature on reactant composition. Because different amounts of ther-
mal energy can be added to the flow at different locations, the product temperature
will not be uniform within the combustion chamber. Thus, a large variation in speed
of sound is expected.
5.3 Blended Fuel Effect on Acoustic Characteri-
zation of Chamber
5.3.1 Non-Reacting Flow
In these experiments, the effect of the fuel density on the flame-acoustic in-
teraction in the flowfield near the injector was examined by introducing CH4 as a
secondary fuel and mixing it with H2. By tailoring the CH4 mole fraction in the
76

blended H2-CH4 fuel, the density of the fuel changes substantially, which of course
alters the density ratio between fuel and oxidizer commensurately. The chamber’s
acoustic impedance depends on the injected fluid within a fixed geometry. Modi-
fications of the acoustic impedance resulting from different fuel compositions were
studied using white noise excitation. Non-reacting experiments were conducted with
the three different flow conditions D, E, and F shown in Table 5.1. For each flow
condition, about 400 averaged pressure spectra corresponding to the first four tap
locations, Tap #1-4, are presented. Figure 5.5, 5.6 and 5.7 show the local pressure
spectra under flow conditions D, E and F. From these plots under the flow condi-
tions D and E, it is obvious that the acoustic resonance characteristics of the model
injector remained qualitatively similar under fuel composition variation. However,
for the flow condition F with 37% mole fraction of H2 in the blended fuel, both
the density ratio and velocity ratio between the fuel and oxidizer were small, and
the resulting spectra had numerous spectral peaks, which was similar to the case
without flow injected, shown in Figure 5.1.
The acoustic impedance is affected by the fuel density change due to the speed
of sound at given temperature. The frequency shift associated with different fuel
densities for the isothermal case is shown in Figure 5.8. From the plot, it can be
seen that the resonance at the lowest frequency f1 was relatively unaffected by both
tap location and flow conditions, as it only shifted 7% within the tested range. This
frequency is considered the quarter-wave mode of the oxidizer post. Since the O2
flow rate was held constant, this frequency would not be affected by fuel mixture
modulation. Resonance at the second lowest frequency f2 changed substantially
77
between the different flow conditions, but relatively little between the tap locations.
Only 18% CH4 addition (by mole fraction) causes this modal frequency to change
19%. As discussed before, this frequency was identified to be the longitudinal three-
quarter-wave mode of the chamber. Resonance at the third lowest frequency f3 also
changed substantially amongst different flow conditions but was practically constant
across the tap locations, which agrees with the hypothesis that it was related to
the transverse mode. This transverse mode frequency shifted 18% with the flow
conditions in these tests.
The trends of the resonant frequencies decreasing with increasing CH4 mole
fraction in the H2-CH4 blended fuel are in good agreement with the physical ex-
planation. Each fuel composition represents a particular molecular weight of the
fuel, which in turn means each fuel mixture has a different speed of sound at room
temperature. With more CH4 in the blended fuel, the density of the fuel increases,
resulting in a lower speed of the sound in the medium and lower resonant frequencies
within the same geometry. Acoustic impedance therefore changes due to the CH4
addition. This suggests a potential method to control the combustion instability is
to modify the acoustic impedance in the combustor by the injection of a different
fuel composition.
An analytical model, similar to the one discussed in Section 5.2 was used to
calculate the resonant frequencies for the different flow configurations. The products
in each case were the stoichiometric fuel-oxidizer mixture as dictated by the initial
flow rates of the H2-CH4 blended fuel and O2. The temperature was assumed to be
room temperature. The speed of sound in each flow configuration was calculated.
78

Table 5.3 lists and compares various spectral peaks obtained from the experimental
data and the model analysis at flow conditions D and E. The calculated frequencies
agree well with the experimental results for each case, and the model analysis pre-
dicts the trend as well. This simple model doesn’t include the effect of the acoustic
excitation, thus it cannot predict the variation between the tap locations.
5.3.2 Reacting Flow
For the same flow conditions D, E, and F, as the non-reacting tests, reacting
flow experiments were conducted to study the effect of fuel composition on the
acoustic impedance in the combustor. The results are shown in Figure 5.9-5.11. For
flow conditions D and E, two well-defined peaks, similar to the H2-O2 flames, appear
in the pressure spectra. However, for the case with 37% H2 mole fraction, there are
more peaks due to the smaller density and velocity ratios between the oxidizer and
blended fuel. This is also observed in non-reacting flow.
In Figure 5.12, the shift in frequencies associated with the two dominant spec-
tral peaks are plotted as a function of density ratio between oxidizer and fuel. Again,
the quarter-wave mode associated with the oxygen post shifts only slightly, presum-
ably due to the same mass flowrate of O2 and minor changes in heat transfer into the
oxygen post. However, the other identified spectral peak for the longitudinal three-
quarter-wave mode of the combustion chamber goes through a significant 15% shift
in frequency. This is related to the fuel density change and combustion heat release
due to different reactants and combustion products. When more CH4 is involved in
79

Table 5.3: Comparison of measured spectral peak frequencies and calculated reso-
nance frequencies.
Location Mode Flow conditions D Flow conditions E
Measured (Hz) Calculated (Hz) Measured (Hz) Calculated (Hz)
Tap #1
f1 423 ±10 430 423 ±10 430
f2 868 ±10 928 752 ±10 843
f3 1453 ±10 1370 1270 ±10 1269
Tap #2
f1 434 ±10 430 423 ±10 430
f2 868 ±10 928 770 ±10 843
f3 1453 ±10 1370 1269 ±10 1269
Tap #3
f1 434 ±10 430 423 ±10 430
f2 889 ±10 928 791/900 ±10 843
f3 1518 ±10 1370 1400 ±10 1269
Tap #4
f1 434 ±10 430 423 ±10 430
f2 911 ±10 928 781/900 ±10 843
f3 1453 ±10 1370 1399 ±10 1269
80

the blend, the density of the fuel increases and the heat release of combustion de-
creases, both of which cause the speed of sound to decrease, leading to lower acoustic
resonance frequencies in the chamber. Note that the pressure spectra at Tap #2
and 3 are omitted because the taps were located directly on the flame fronts, causing
thermally induced errors in the transducers even with water cooling. The accuracy
of the data for each test depends on the flame locations. Another observation is that
the difference between the tap locations seems to increase with density ratio, which
is related to the acoustic excitation from one side of the combustor causing slightly
variance of the flowfield at two sides of the flames. The entrainment of the center
O2 jet determines the difference between the tap locations across the combustor.
To investigate the effect of total heat release magnitude on the combustor
acoustic response, another set of tests were performed in which the total heat release
level was varied while maintaining the fuel mixture ratio. This was accomplished by
decreasing all reactant mass flow rates by the same proportion. The corresponding
flow configurations for these tests are B and C in Table 5.1. The effect on flame-
acoustic interaction associated with heat release can be separated from the fuel
density. The results are given in Figure 5.13, which shows that except for the
amplitude at frequency f2, the pressure spectra are insensitive to the level of the
total heat release. The modification of the pressure spectra, especially the frequency
shift, shown in Figure 5.12, is mainly due to the change of the acoustic resonance in
the chamber caused by the variation of fuel density corresponding to the different
blended H2-CH4 fuel compositions.
81
5.4 Blended Fuel Effect on Flame Ignition Char-
acteristics
When the fuel was exclusively CH4, corresponding to flow conditions G in
Table 5.1, the flame was lifted because the ignition time of CH4 is longer than that
of H2. Thus for the same fuel and oxidizer velocities, the location of ignition of pure
CH4 is farther from the injector than H2. This effect is illustrated in Figure 5.14,
showing the flames are lifted from the injector. The general flame characteristics in
terms of unforced flame shape and heat release behavior were relatively unaffected
by a moderate amount of CH4 addition. As long as there is a small quantity of H2
in the blended fuel, the flame ignition characteristics are dominated by the faster
response of the H2 gas. In this set of tests, there was no acoustic excitation.
5.5 Blended Fuel Effect on Flame-Acoustic Inter-
action with Single Frequency Forcing
Acoustic forcing at one of the resonant frequencies will set up a standing wave
pattern inside the combustion chamber resulting in a spatially varying amplitude
pattern known as the mode shape. To study the potential interaction between flames
and traveling acoustic waves, the flames were forced at frequencies sufficiently far
away from the resonant modes. By avoiding resonant frequencies, the behavior
of flames interacting with imposed traveling waves could be isolated. The results
could provide additional insight into the physical mechanisms that affect acoustic
82
stability of the fuel mixture. The frequency of the spectral minimum between the
two spectral peaks at Tap #4 for the flow condition A case, 1150 Hz, was considered
a non-resonant forcing frequency ff as indicated in Figure 5.15. This single forcing
frequency was used for all the experiments in this section. The acoustic forcing level
was fixed at 12.5 watts (40 V peak-to-peak).
5.5.1 OH* Chemiluminescence
Periodic single frequency (1150 Hz) forcing was used to excite flames with
both pure H2 and H2-CH4 blended fuel. The flow conditions for O2/H2 are listed in
Table 5.1, denoted as A. The blended fuel mixture is marked as flow condition D
in Table 5.1. Figure 5.16 shows the direct comparison of OH* chemiluminescence
between O2/H2 flames and O2/H2-CH4 flames under the same amount of acoustic
excitation at 1150 Hz.
The O2/H2 flames show interesting asymmetric flame-acoustic interaction.
The left side flame, closer to the acoustic driver, was wrinkled severely due to flame-
acoustic coupling, while the right side, farther away from the acoustic excitation,
was relatively unaffected. The origin of such asymmetric response was investigated
and it was determined that intermittent baroclinic torque made the left side unsta-
ble while the right side was stable [94]. The density ratio between oxidizer and fuel
plays a key role in the flame-acoustic interaction. When a blended H2-CH4 fuel was
used, with an oxidizer-fuel density ratio of 3, marked as flow condition D, the inter-
action became much weaker as shown in Figure 5.16(b). This is a clear indication
83

that the flames from a blended H2-CH4 fuel are more stable against acoustic exci-
tation at this single forcing frequency than those from a pure H2 fuel. These results
suggest that using a blended H2-CH4 can reduce the susceptibility to combustion
instability at some single forcing frequency. By changing the acoustic impedance
in the combustor, the blended H2-CH4 fuel can modify the flame response to the
acoustic traveling wave at specific frequency.
5.5.2 Rayleigh Index
The Rayleigh index is a mathematical way to quantify the coupling between
unsteady heat release and acoustic pressure fields. The local Rayleigh index at dif-
ferent spatial locations in the combustor and at various points in time with respect
to the injection of blended fuel have been detailed to provide a better understanding
regarding acoustically-driven combustion instability and how it is impacted by using
a blended fuel. Localized simultaneous measurements of pressure and OH* chemi-
luminescence were made at selected tap locations along the two flame fronts, Tap
#5-11, as summarized in Table 4.1. These specified sensor locations were carefully
selected to probe various regions of interest, including the immediate wake of the
injector post where the flames first ignite, the intermediate wake region where the
flame brush starts thickening, and a region further downstream where flame wrin-
kling can be severely affected. In the last region, an additional sensor was placed
to probe the external edge of the wrinkled flames. From these measurements, the
spatial distribution of the local Rayleigh index was obtained. The Rayleigh in-
84
dex measurements can be evaluated to reveal various regions of flame-acoustic in-
teraction, including instability-driving, instability-damping and instability-neutral
regions within the injector flowfield. The local Rayleigh index at different spatial
locations in the combustor and at various points in time with respect to the injec-
tion of blended fuel have been examined in detail to provide a better understanding
regarding acoustically-driven combustion instability and how it is impacted with the
use of blended fuel.
Tests were initially conducted to study combustion without acoustic excitation.
The pressure oscillation, heat-release oscillation and corresponding local Rayleigh
index at the three spatial locations, Tap #9-11, are shown in Figure 5.17 - 5.19
(marked as Natural). Without acoustic excitation, both sides of flames show similar
response. Thus measurements were taken with the left flame. For all three loca-
tions, the pressure oscillation and heat release fluctuation were very small, and the
Rayleigh index is almost zero without acoustic excitation. This shows this combus-
tion system is not self-excited. Without external forcing, the combustion is stable,
and it does not go to an unstable state by itself. Only when acoustic excitation is
superimposed to the system does it have potential to develop combustion instability.
When the H2 composition of 99% was forced at 1150 Hz, pressure oscillations
and OH* chemiluminescence fluctuations were simultaneously observed from the
flames on the driver and wall sides. These are shown in Figure 5.20. In Figure
5.20(a) and 5.20(b), although both flames are responding to a similar level of acoustic
excitation, the amplitude of flame response is much larger on the driver side of the
flames than on the wall side. Even near the injector exit, shown in Figure 5.20(c),
85

the driver side flames exhibit a more unstable response than the wall side flames.
The density ratio associated with these flames is high, at 14.5. Figure 5.21 presents
a comparison of the identical forcing configuration but at a lower density ratio
of 3, with more CH4 mole fraction. Again, the flame on the driver side exhibits a
stronger response than the wall side flame to the same amount of pressure oscillation.
However, the amount of OH* chemiluminescence fluctuation is much lower than in
the 14.5 density ratio case.
The local Rayleigh index measurements also demonstrated an intriguing phe-
nomenon in that neither the driving nor the damping of the instability took place
continuously, but rather in a more sporadic fashion. Figure 5.22 shows time traces
for locations corresponding to acoustically damping, driving, and neutral regions,
respectively. One typical aspect seen is the appearance of high forcing frequency
(1150 Hz) components of heat release riding on selective edges of a low frequency (97
Hz) heat release component. Both driving and damping regions experience extended
periods of acoustic energy build-up and reduction that spans over 10-12 oscillation
cycles. When flame-acoustic interaction is occurring, it can be seen that most of
such interactions actively change the acoustic energy balance in one direction. This
selective occurrence of high forcing frequency components on falling edges in Fig-
ure 5.22(a) and rising edges in Figure 5.22(b) of the underlying low frequency
component are stimulated by the local Rayleigh-Taylor instabilities arising from ac-
celerations of heavier oxidizer into lighter fuel. In the neutral regions, there appears
to be no effect of acoustic excitation on flame or pressure oscillations.
A graphical summary of the category to which each tap belonged (instability-
86

damping, driving, or neutral) is presented in Figure 5.23, which shows the sensor
locations with respect to a time-averaged OH* chemiluminescence image on the
background. From the measurements, it appears that the ignition zone close to the
injector post (Tap #5) was stable, while further downstream the flames became
highly unstable (Tap #7, #10). Also near the combustor wall on the driver side
(Tap #9), it appears that the flame-acoustic interaction was once again suppressed.
The flames on the wall side seemed to be unaffected at the present level of acoustic
excitation. In contrast to the pure H2 case, which resulted in highly unstable flames
on one side, blended H2-CH4 fuel yielded instability-neutral regions everywhere.
This demonstrates that acoustic stability response to the travelling wave at this
frequency was improved with the blended H2-CH4 fuel.
5.5.3 Transition Process
In order to gain insight into the transient behavior of the combustion process
due to the addition of CH4, experiments were performed using two fast-response
R-DDV (rotary direct-drive valve) as actuators and a high speed camera for diag-
nostics. Both H2 and CH4 mass flow were controlled by two solenoid valves. These
experiments started with the combustor operating at an equivalence ratio of unity
with virtually all the fuel as H2. The acoustic driver was turned on for excitation
of the instability mode at 1150 Hz. After operating for a predetermined amount of
time with no commanded CH4 fuel, valve control signals were generated from the
PC to instantaneously command the servo-valves to reduce the H2 mass flow while
87
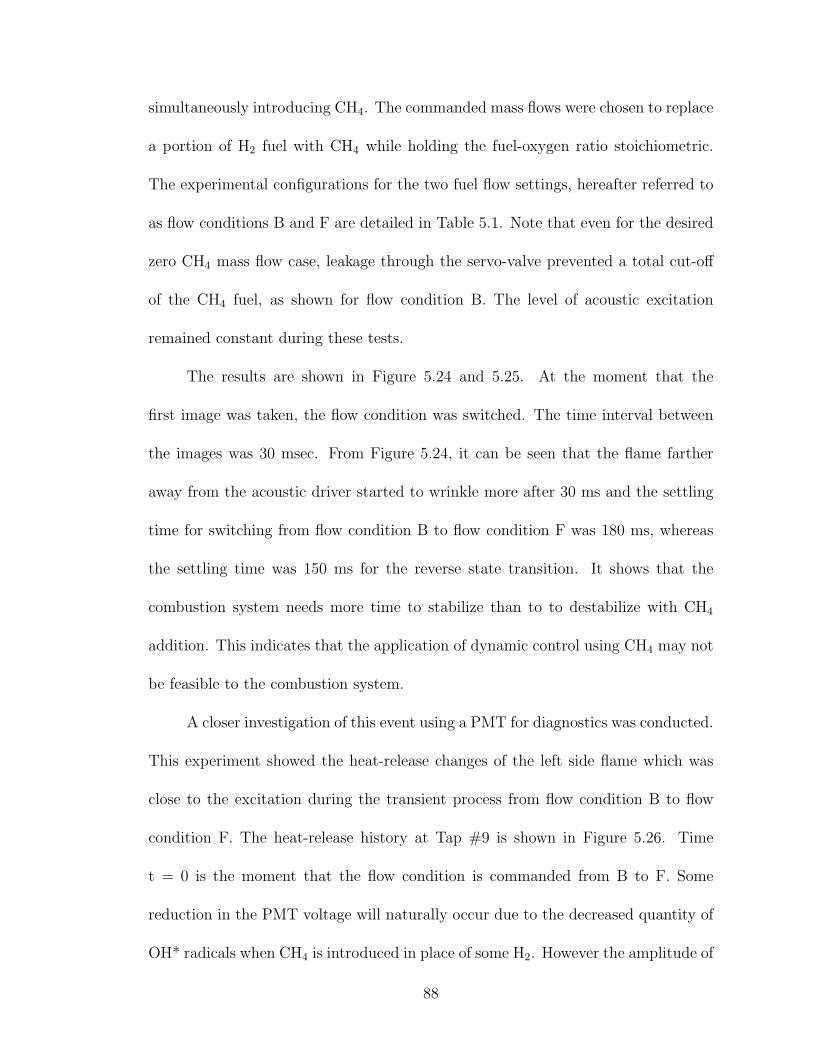
simultaneously introducing CH4. The commanded mass flows were chosen to replace
a portion of H2 fuel with CH4 while holding the fuel-oxygen ratio stoichiometric.
The experimental configurations for the two fuel flow settings, hereafter referred to
as flow conditions B and F are detailed in Table 5.1. Note that even for the desired
zero CH4 mass flow case, leakage through the servo-valve prevented a total cut-off
of the CH4 fuel, as shown for flow condition B. The level of acoustic excitation
remained constant during these tests.
The results are shown in Figure 5.24 and 5.25. At the moment that the
first image was taken, the flow condition was switched. The time interval between
the images was 30 msec. From Figure 5.24, it can be seen that the flame farther
away from the acoustic driver started to wrinkle more after 30 ms and the settling
time for switching from flow condition B to flow condition F was 180 ms, whereas
the settling time was 150 ms for the reverse state transition. It shows that the
combustion system needs more time to stabilize than to to destabilize with CH4
addition. This indicates that the application of dynamic control using CH4 may not
be feasible to the combustion system.
A closer investigation of this event using a PMT for diagnostics was conducted.
This experiment showed the heat-release changes of the left side flame which was
close to the excitation during the transient process from flow condition B to flow
condition F. The heat-release history at Tap #9 is shown in Figure 5.26. Time
t = 0 is the moment that the flow condition is commanded from B to F. Some
reduction in the PMT voltage will naturally occur due to the decreased quantity of
OH* radicals when CH4 is introduced in place of some H2. However the amplitude of
88

flame perturbations decreases due to the favorable density tailoring, leading to less
visibility of the perturbed flame to the PMT sensor, resulting in further decreases
of the sensed chemiluminescence intensity. Moreover, not only does the sensed
intensity go down in amplitude, but the fluctuating component of heat release is
also diminished, as is evident in Figures 5.27 - 5.29. The settling time is 180 ms for
the flame portion close to the excitation. This time delay is mainly due to the flow
time from the servo-valves to the location in the combustor where the PMT sensor
is located. It is not practical to apply active fast response control to this system
because of this time delay. Most active combustion control requires high frequency
response actuators to catch the unstable modes.
5.6 Summary and Discussions
Experimental investigations were conducted to explore the effect of fuel den-
sity on the flame-acoustic interaction with a combination of O2 and H2-CH4 fuel
mixture as propellants. Two different types of acoustic characterization experi-
ments were conducted. The first utilized band-limited white noise forcing to ob-
tain acoustic response spectra, from which resonance characteristics were evaluated.
This method was shown to be very effective in obtaining resonant frequencies for
both non-reacting flow and reacting flow. A simple analytical model was devel-
oped to identify the acoustic modes. Three dominant acoustic modes observed in
non-reacting flow were the quarter-wave mode of the oxygen post, the three-quarter-
wave longitudinal mode of the combustion chamber and the transverse first-quarter
89

wave mode of the chamber, while only two of them were observed in the reacting
flow case: the quarter-wave mode of the oxygen post and the three-quarter-wave
longitudinal mode of the combustion chamber. The resonant frequencies of these
modes compared well with analytically obtained values. The acoustic resonance
characteristics of the model injector remained qualitatively similar under blended
fuel composition variation, but some of the resonant frequencies shifted to lower
values with increasing CH4 content, most likely due to the density of the fuel and
product of combustion. Total heat release was not a key factor in this modification
of the acoustic characteristics.
The second type of experiment was based on acoustic forcing at a fixed fre-
quency different from the resonant modes. The interaction between the flame front
and acoustic traveling wave was studied. Both global and local measurements of
OH* chemiluminescence were made that indicated periodic heat release modulation
with this single frequency forcing. Furthermore, simultaneous measurements of lo-
cal pressure fluctuations showed that acoustic pressure oscillations were responsible
for spatial fluctuations in OH* chemiluminescence. The general flame character-
istics in terms of unforced flame shape and heat release behavior were relatively
unaffected by a moderate amount of CH4 addition. However, the flames from a
hydrogen-methane blended fuel and oxygen were much more stable against acoustic
excitation than those from a pure H2 fuel and O2 at this forcing frequency. It was
shown in this experiment that the blended fuel flames wrinkled very little under
acoustic forcing while the hydrogen flames wrinkled heavily under the same inten-
sity of acoustic forcing. To further assess the active control potential of real-time
90

in-situ CH4 addition, both transient and steady state characteristics of CH4 addition
into primary H2 flow were investigated using high speed imaging and simultaneous
dynamic pressure and chemiluminescence measurements. Local Rayleigh indices at
selected points on the flame oscillation path before and after CH4 addition were
tracked. In the present experiment, the settling time for suppressing flame oscilla-
tions completely was as large as 180 ms, most likely due to convection delays caused
by the control valve location. If this delay could be further shortened, it may be
possible to consider an active control strategy using high-density fuel as an acoustic
shield for preventing flame-acoustic interaction.
91

0
0.001
0.002
0.003
0.004
0 1000 2000 3000 4000 5000
Spe
ctra
l Am
p (p
si)
Frequency (Hz)
(a) Tap #1
0
0.001
0.002
0.003
0.004
0 1000 2000 3000 4000 5000
Spe
ctra
l Am
p (p
si)
Frequency (Hz)
(b) Tap #2
0
0.001
0.002
0.003
0.004
0 1000 2000 3000 4000 5000
Spe
ctra
l Am
p (p
si)
Frequency (Hz)
(c) Tap #3
0
0.001
0.002
0.003
0.004
0 1000 2000 3000 4000 5000
Spe
ctra
l Am
p (p
si)
Frequency (Hz)
(d) Tap #4
Figure 5.1: Dynamic pressure spectrum of the “no-flow” case under white noise
acoustic excitation
92

0
0.001
0.002
0.003
0.004
0 1000 2000 3000 4000 5000
Spe
ctra
l Am
p (p
si)
Frequency (Hz)
f1
f2
f3
(a) Tap #1
0
0.001
0.002
0.003
0.004
0 1000 2000 3000 4000 5000
Spe
ctra
l Am
p (p
si)
Frequency (Hz)
f1
f2
f3
(b) Tap #2
0
0.001
0.002
0.003
0.004
0 1000 2000 3000 4000 5000
Spe
ctra
l Am
p (p
si)
Frequency (Hz)
f1
f2
f3
(c) Tap #3
0
0.001
0.002
0.003
0.004
0 1000 2000 3000 4000 5000
Spe
ctra
l Am
p (p
si)
Frequency (Hz)
f1 f
2
f3
(d) Tap #4
Figure 5.2: Pressure spectrum of H2-O2 non-reacting case excited with white noise.
93

Figure 5.3: Schematic illustration showing distribution of acoustic media in the
combustor.
94
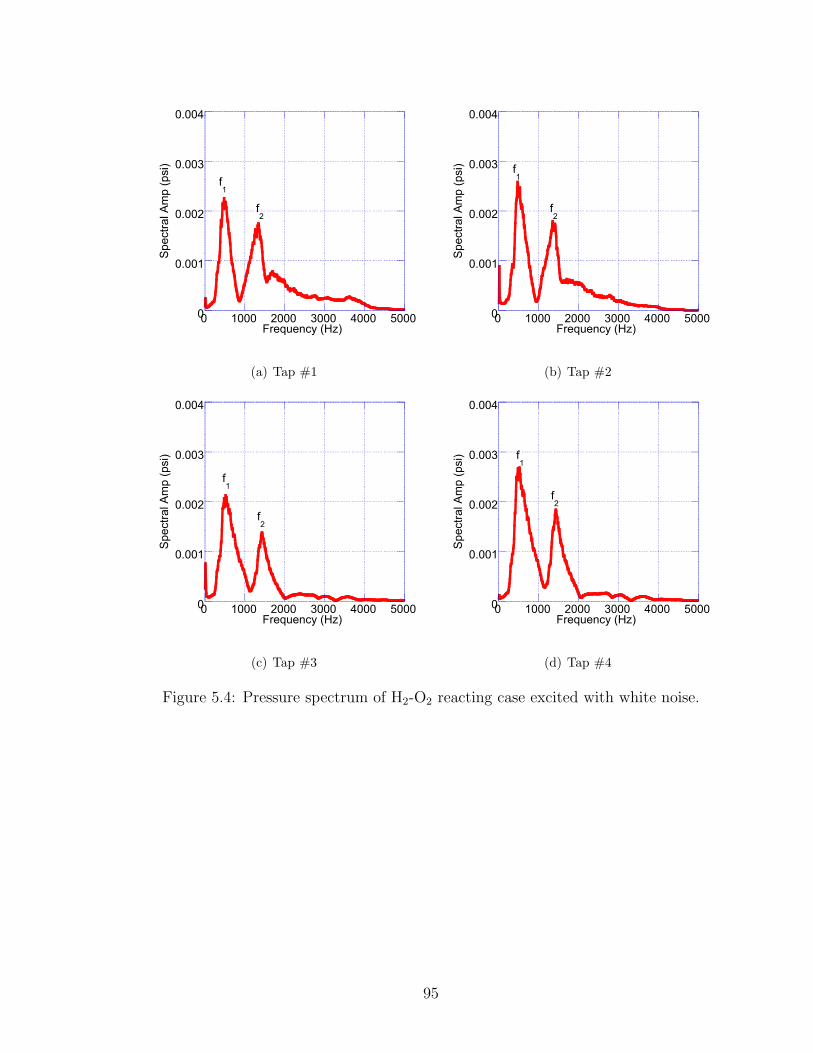
0
0.001
0.002
0.003
0.004
0 1000 2000 3000 4000 5000
Spe
ctra
l Am
p (p
si)
Frequency (Hz)
f1
f2
(a) Tap #1
0
0.001
0.002
0.003
0.004
0 1000 2000 3000 4000 5000
Spe
ctra
l Am
p (p
si)
Frequency (Hz)
f1
f2
(b) Tap #2
0
0.001
0.002
0.003
0.004
0 1000 2000 3000 4000 5000
Spe
ctra
l Am
p (p
si)
Frequency (Hz)
f1
f2
(c) Tap #3
0
0.001
0.002
0.003
0.004
0 1000 2000 3000 4000 5000
Spe
ctra
l Am
p (p
si)
Frequency (Hz)
f1
f2
(d) Tap #4
Figure 5.4: Pressure spectrum of H2-O2 reacting case excited with white noise.
95

0
0.001
0.002
0.003
0.004
0 1000 2000 3000 4000 5000
Spe
ctra
l Am
p (p
si)
Frequency (Hz)
f1
f2
f3
(a) Tap #1
0
0.001
0.002
0.003
0.004
0 1000 2000 3000 4000 5000
Spe
ctra
l Am
p (p
si)
Frequency (Hz)
f1
f2
f3
(b) Tap #2
0
0.001
0.002
0.003
0.004
0 1000 2000 3000 4000 5000
Spe
ctra
l Am
p (p
si)
Frequency (Hz)
f1
f2
f3
(c) Tap #3
0
0.001
0.002
0.003
0.004
0 1000 2000 3000 4000 5000
Spe
ctra
l Am
p (p
si)
Frequency (Hz)
f1
f2
f3
(d) Tap #4
Figure 5.5: Pressure spectrum of non-reacting case excited with white noise. H2
mole fraction = 94%
96
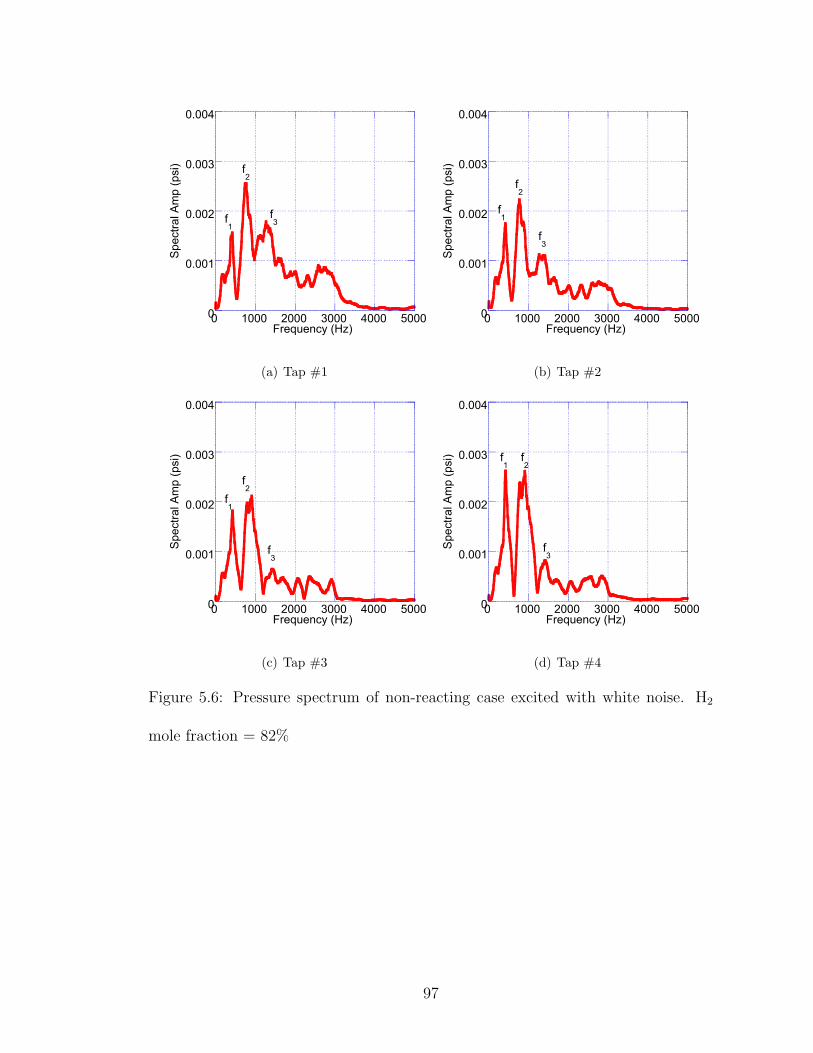
0
0.001
0.002
0.003
0.004
0 1000 2000 3000 4000 5000
Spe
ctra
l Am
p (p
si)
Frequency (Hz)
f1
f2
f3
(a) Tap #1
0
0.001
0.002
0.003
0.004
0 1000 2000 3000 4000 5000
Spe
ctra
l Am
p (p
si)
Frequency (Hz)
f1
f2
f3
(b) Tap #2
0
0.001
0.002
0.003
0.004
0 1000 2000 3000 4000 5000
Spe
ctra
l Am
p (p
si)
Frequency (Hz)
f1
f2
f3
(c) Tap #3
0
0.001
0.002
0.003
0.004
0 1000 2000 3000 4000 5000
Spe
ctra
l Am
p (p
si)
Frequency (Hz)
f1
f2
f3
(d) Tap #4
Figure 5.6: Pressure spectrum of non-reacting case excited with white noise. H2
mole fraction = 82%
97

0
0.001
0.002
0.003
0.004
0 1000 2000 3000 4000 5000
Spe
ctra
l Am
p (p
si)
Frequency (Hz)
(a) Tap #1
0
0.001
0.002
0.003
0.004
0 1000 2000 3000 4000 5000
Spe
ctra
l Am
p (p
si)
Frequency (Hz)
(b) Tap #2
0
0.001
0.002
0.003
0.004
0 1000 2000 3000 4000 5000
Spe
ctra
l Am
p (p
si)
Frequency (Hz)
(c) Tap #3
0
0.001
0.002
0.003
0.004
0 1000 2000 3000 4000 5000
Spe
ctra
l Am
p (p
si)
Frequency (Hz)
(d) Tap #4
Figure 5.7: Pressure spectrum of non-reacting case excited with white noise. H2
mole fraction = 37%
98

0
400
800
1200
1600
6 8 10 12 14 16
Tap #1Tap #2
Tap #3Tap #4
Peak
Fre
quen
cy (H
z)
Density Ratio
f1
f2
f3
Figure 5.8: The effect of fuel mixture composition on the frequency shift in the
non-reacting case.
99
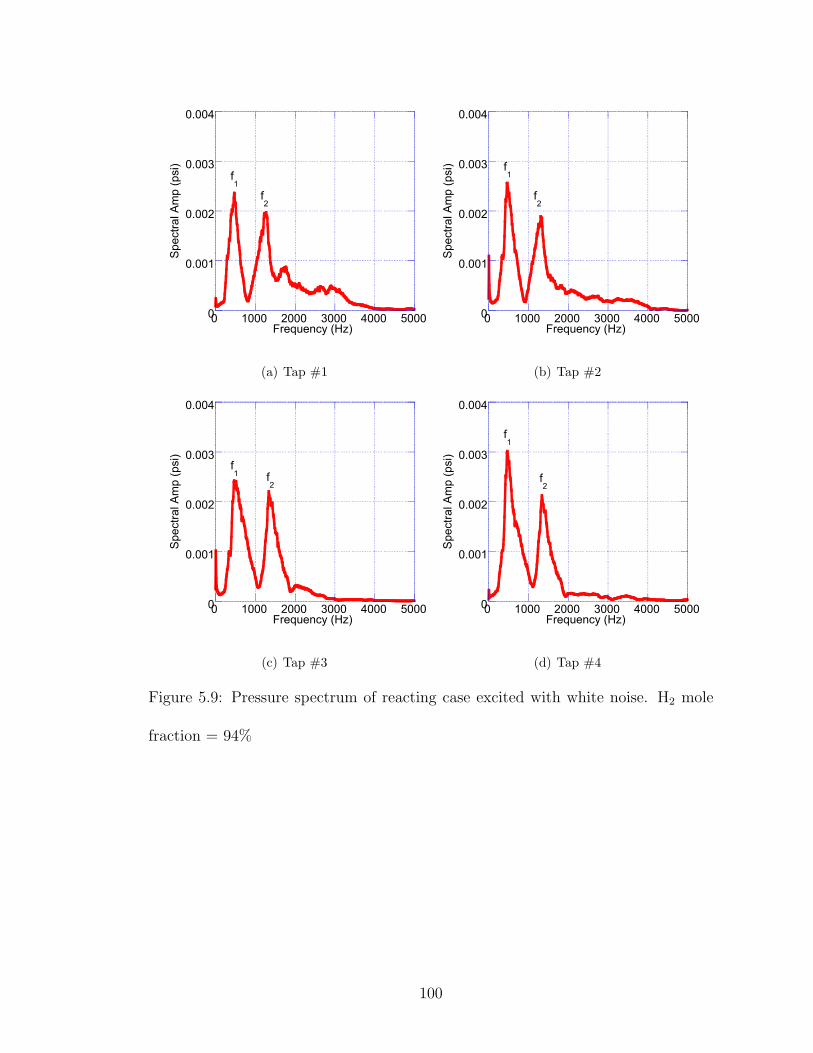
0
0.001
0.002
0.003
0.004
0 1000 2000 3000 4000 5000
Spe
ctra
l Am
p (p
si)
Frequency (Hz)
f1
f2
(a) Tap #1
0
0.001
0.002
0.003
0.004
0 1000 2000 3000 4000 5000
Spe
ctra
l Am
p (p
si)
Frequency (Hz)
f1
f2
(b) Tap #2
0
0.001
0.002
0.003
0.004
0 1000 2000 3000 4000 5000
Spe
ctra
l Am
p (p
si)
Frequency (Hz)
f1 f
2
(c) Tap #3
0
0.001
0.002
0.003
0.004
0 1000 2000 3000 4000 5000
Spe
ctra
l Am
p (p
si)
Frequency (Hz)
f1
f2
(d) Tap #4
Figure 5.9: Pressure spectrum of reacting case excited with white noise. H2 mole
fraction = 94%
100

0
0.001
0.002
0.003
0.004
0 1000 2000 3000 4000 5000
Spe
ctra
l Am
p (p
si)
Frequency (Hz)
f1 f
2
(a) Tap #1
0
0.001
0.002
0.003
0.004
0 1000 2000 3000 4000 5000
Spe
ctra
l Am
p (p
si)
Frequency (Hz)
f1
f2
(b) Tap #2
0
0.001
0.002
0.003
0.004
0 1000 2000 3000 4000 5000
Spe
ctra
l Am
p (p
si)
Frequency (Hz)
f1
f2
(c) Tap #3
0
0.001
0.002
0.003
0.004
0 1000 2000 3000 4000 5000
Spe
ctra
l Am
p (p
si)
Frequency (Hz)
f1
f2
(d) Tap #4
Figure 5.10: Pressure spectrum of reacting case excited with white noise. H2 mole
fraction = 82%
101

0
0.001
0.002
0.003
0.004
0 1000 2000 3000 4000 5000
Spe
ctra
l Am
p (p
si)
Frequency (Hz)
(a) Tap #1
0
0.001
0.002
0.003
0.004
0 1000 2000 3000 4000 5000
Spe
ctra
l Am
p (p
si)
Frequency (Hz)
(b) Tap #2
0
0.001
0.002
0.003
0.004
0 1000 2000 3000 4000 5000
Spe
ctra
l Am
p (p
si)
Frequency (Hz)
(c) Tap #3
0
0.001
0.002
0.003
0.004
0 1000 2000 3000 4000 5000
Spe
ctra
l Am
p (p
si)
Frequency (Hz)
(d) Tap #4
Figure 5.11: Pressure spectrum of reacting case excited with white noise. H2 mole
fraction = 37%
102

0
400
800
1200
1600
6 8 10 12 14 16
Tap #1 Tap #4
Peak
Fre
quen
cy (H
z)
Density Ratio
f1
f2
Figure 5.12: The effect of fuel mixture composition on the frequency shift in the
reacting case.
103
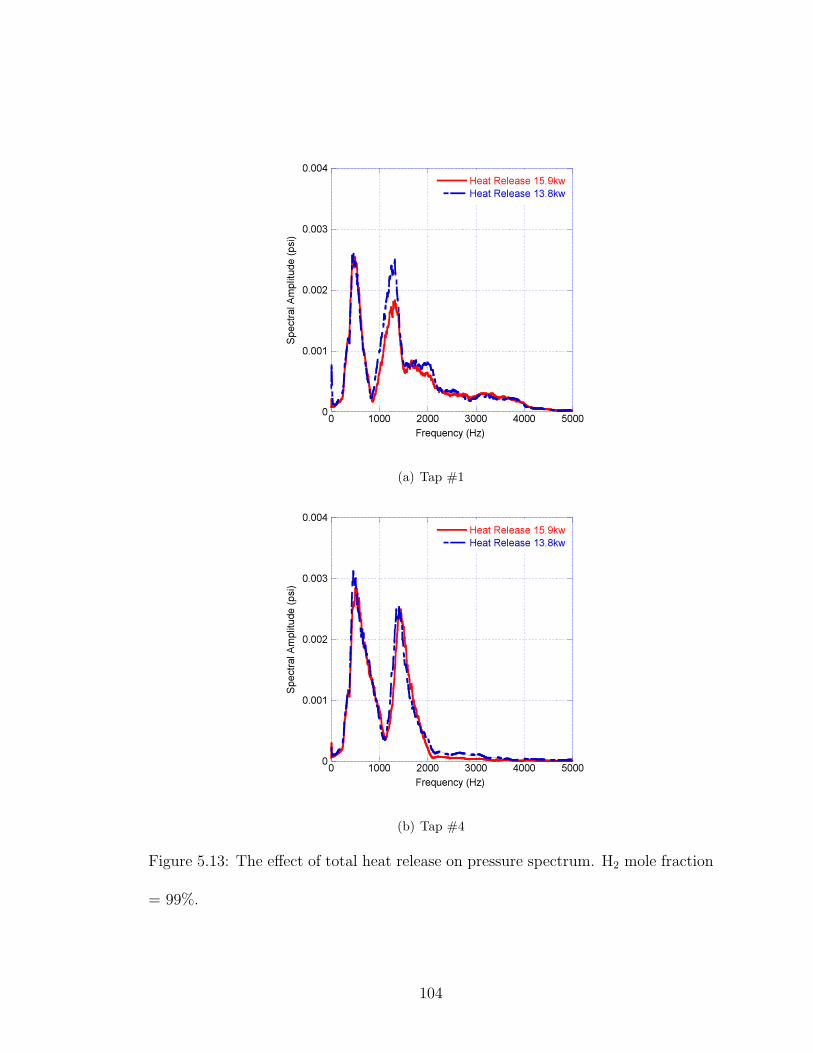
(a) Tap #1
(b) Tap #4
Figure 5.13: The effect of total heat release on pressure spectrum. H2 mole fraction
= 99%.
104

(a) OH* time-averaged (b) CH* time-averaged
(c) OH* instantaneous (d) CH* instantaneous
Figure 5.14: Chemiluminescence images of lifted flames using only CH4 as fuel
without acoustic excitation.
105

0 1000 2000 3000 4000 50000
5
10
15
20
25
Frequency (Hz)
f1
f2
Spec
tral A
mp
(Pa)
ff
Figure 5.15: Choice of single forcing frequency from pressure spectrum.
106
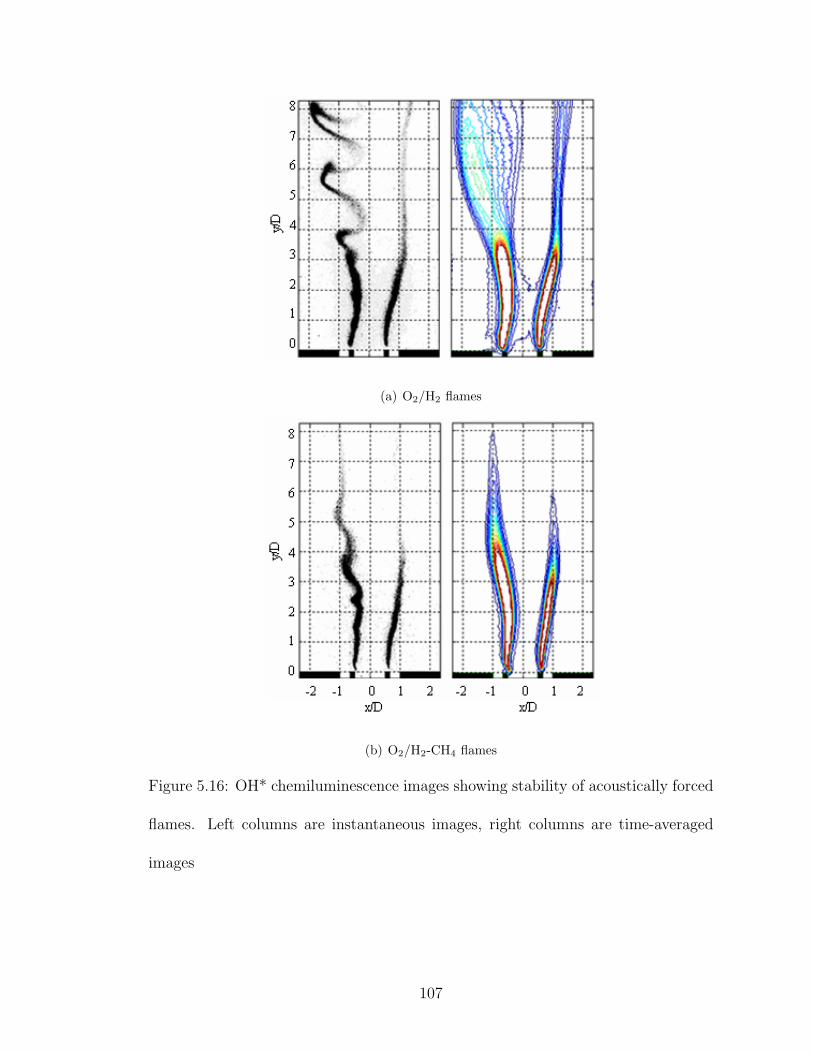
(a) O2/H2 flames
(b) O2/H2-CH4 flames
Figure 5.16: OH* chemiluminescence images showing stability of acoustically forced
flames. Left columns are instantaneous images, right columns are time-averaged
images
107

Figure 5.17: Comparison of behavior between forced at 1150 Hz and natural case
at Tap #9. H2 mole fraction = 99%.
108

Figure 5.18: Comparison of behavior between forced at 1150 Hz and natural case
at Tap #10. H2 mole fraction = 99%.
109

Figure 5.19: Comparison of behavior between forced at 1150 Hz and natural case
at Tap #11. H2 mole fraction = 99%.
110
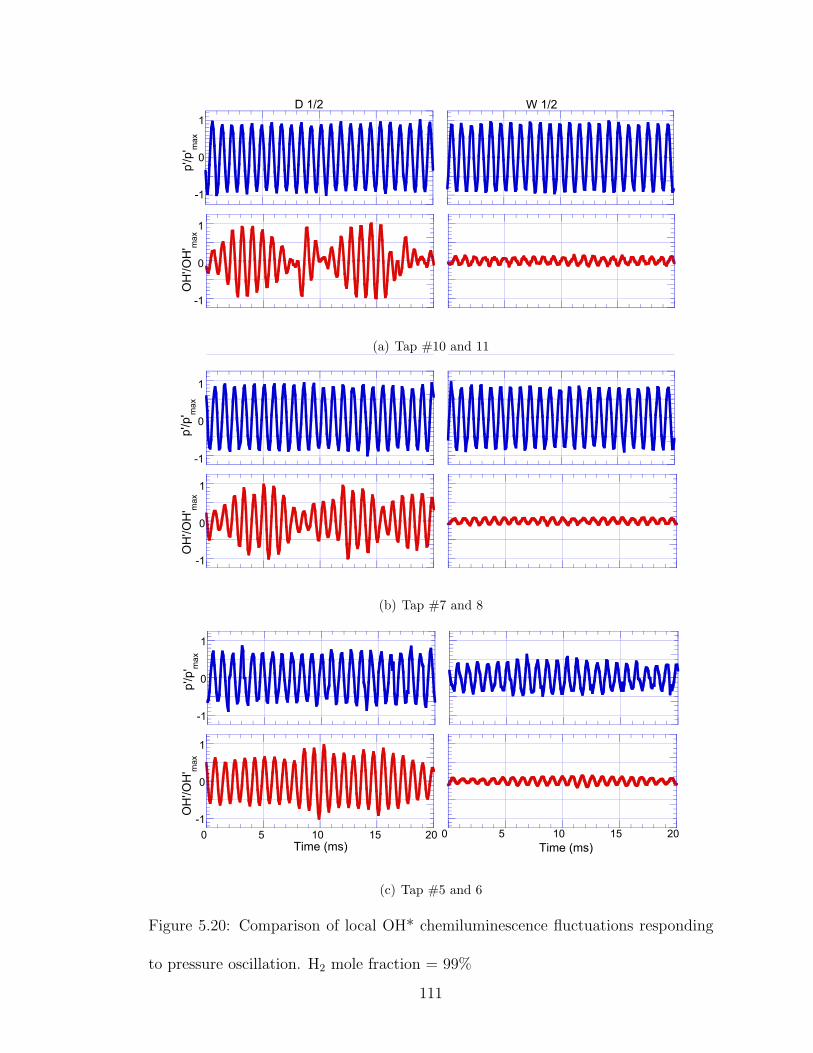
(a)-1
0
1
p'/p
' max
D 1/2
-1
0
1
p' n
orm
aliz
ed (a
rb. u
nit)
W 1/2
-1
0
1
OH'/OH' max
OH
*' no
rmal
ized
(arb
. uni
t)
(b) -1
0
1
p'/p' max
-1
0
1
OH'/OH' max
(c)-1
0
1
p'/p' max
0 5 10 15 20
-1
0
1
OH
'/OH
' max
Time (ms)0 5 10 15 20
Time (ms) Figure9ComparisonoflocalOH*chemiluminescencefluctuationsrespondingtopressure
oscillationatDensityRatio=14.5.(a)Tap#10,#11.(b)Tap#7,#8.(c)Tap#5,#6.
(a) Tap #10 and 11
(a)-1
0
1p'
/p' m
ax
D 1/2
-1
0
1
p' n
orm
aliz
ed (a
rb. u
nit)
W 1/2
-1
0
1
OH'/OH' max
OH
*' no
rmal
ized
(arb
. uni
t)
(b) -1
0
1
p'/p' max
-1
0
1
OH'/OH' max
(c)-1
0
1
p'/p' max
0 5 10 15 20
-1
0
1
OH
'/OH
' max
Time (ms)0 5 10 15 20
Time (ms) Figure9ComparisonoflocalOH*chemiluminescencefluctuationsrespondingtopressure
oscillationatDensityRatio=14.5.(a)Tap#10,#11.(b)Tap#7,#8.(c)Tap#5,#6.
(b) Tap #7 and 8
(a)-1
0
1
p'/p
' max
D 1/2
-1
0
1
p' n
orm
aliz
ed (a
rb. u
nit)
W 1/2
-1
0
1
OH'/OH' max
OH
*' no
rmal
ized
(arb
. uni
t)
(b) -1
0
1
p'/p' max
-1
0
1
OH'/OH' max
(c)-1
0
1
p'/p' max
0 5 10 15 20
-1
0
1
OH
'/OH
' max
Time (ms)0 5 10 15 20
Time (ms) Figure9ComparisonoflocalOH*chemiluminescencefluctuationsrespondingtopressure
oscillationatDensityRatio=14.5.(a)Tap#10,#11.(b)Tap#7,#8.(c)Tap#5,#6. (c) Tap #5 and 6
Figure 5.20: Comparison of local OH* chemiluminescence fluctuations responding
to pressure oscillation. H2 mole fraction = 99%
111
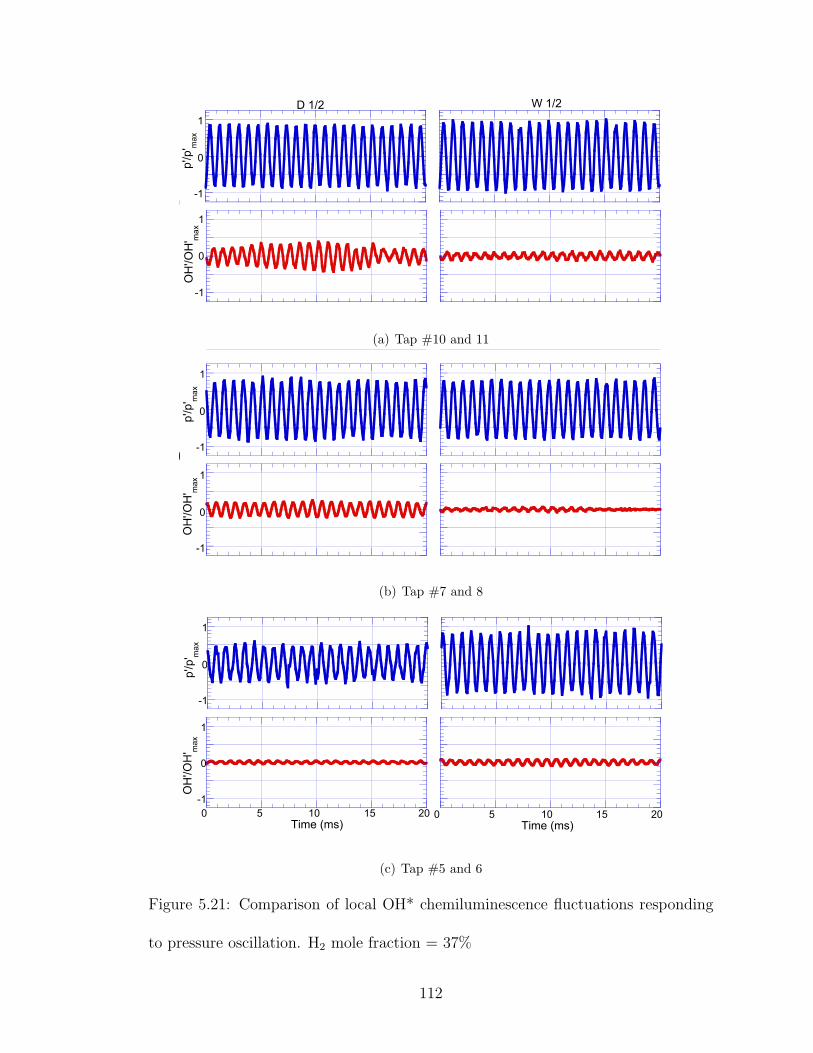
(a)-1
0
1
p'/p
' max
D 1/2 W 1/2
-1
0
1
OH'/OH' max
(b)-1
0
1
p'/p' max
-1
0
1
OH'/OH' max
(c)-1
0
1
p'/p' max
0 5 10 15 20
-1
0
1
Time (ms)
OH
'/OH
' max
0 5 10 15 20Time (ms)
Figure10ComparisonoflocalOH*chemiluminescencefluctuationsrespondingtopressureoscillationatDensityRatio=3.(a)Tap#10,#11.(b)Tap#7,#8.(c)Tap#5,#6.
(a) Tap #10 and 11
(a)-1
0
1p'
/p' m
ax
D 1/2 W 1/2
-1
0
1
OH'/OH' max
(b)-1
0
1
p'/p' max
-1
0
1
OH'/OH' max
(c)-1
0
1
p'/p' max
0 5 10 15 20
-1
0
1
Time (ms)
OH
'/OH
' max
0 5 10 15 20Time (ms)
Figure10ComparisonoflocalOH*chemiluminescencefluctuationsrespondingtopressureoscillationatDensityRatio=3.(a)Tap#10,#11.(b)Tap#7,#8.(c)Tap#5,#6.
(b) Tap #7 and 8
(a)-1
0
1
p'/p
' max
D 1/2 W 1/2
-1
0
1
OH'/OH' max
(b)-1
0
1
p'/p' max
-1
0
1
OH'/OH' max
(c)-1
0
1
p'/p' max
0 5 10 15 20
-1
0
1
Time (ms)
OH
'/OH
' max
0 5 10 15 20Time (ms)
Figure10ComparisonoflocalOH*chemiluminescencefluctuationsrespondingtopressureoscillationatDensityRatio=3.(a)Tap#10,#11.(b)Tap#7,#8.(c)Tap#5,#6.
(c) Tap #5 and 6
Figure 5.21: Comparison of local OH* chemiluminescence fluctuations responding
to pressure oscillation. H2 mole fraction = 37%
112
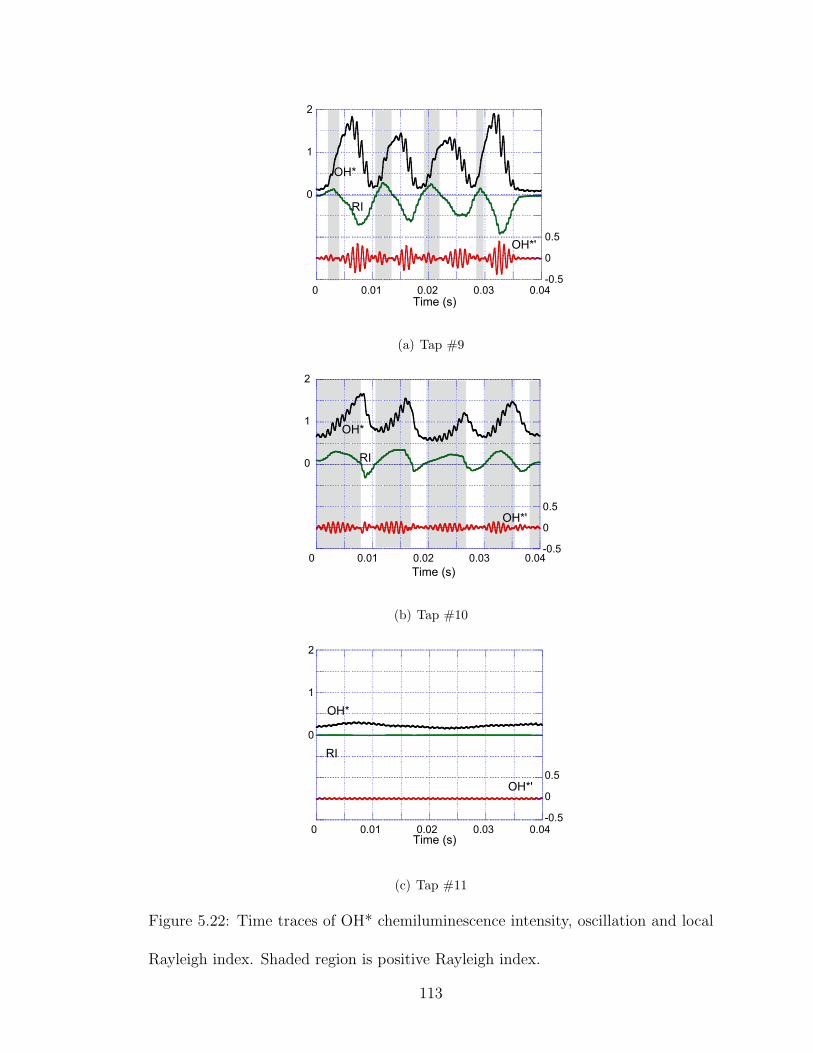
-0.5
0
0.5
0 0.01 0.02 0.03 0.04
0
1
2
B
Time (s)
OH*'
RI
OH*
(a) Tap #9
0
1
2
-0.5
0
0.5
0 0.01 0.02 0.03 0.04Time (s)
OH*
RI
OH*'
(b) Tap #10
0
1
2
-0.5
0
0.5
0 0.01 0.02 0.03 0.04
B
Time (s)
OH*
RI
OH*'
(c) Tap #11
Figure 5.22: Time traces of OH* chemiluminescence intensity, oscillation and local
Rayleigh index. Shaded region is positive Rayleigh index.
113

Figure 5.23: Rayleigh index measurements showing stability of acoustically forced
flames for pure H2 and H2-CH4 blended fuel.
114

Figure 5.24: Transient behavior of flames with H2 mole fraction from 99% to 37%.
115
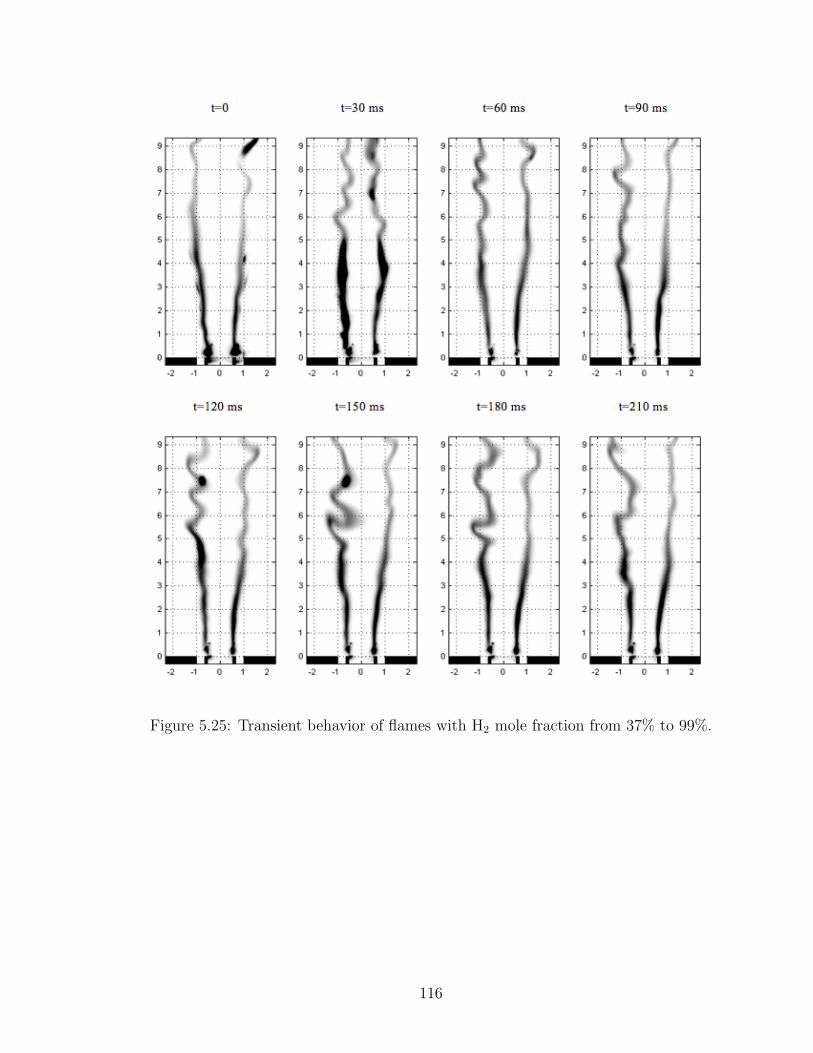
Figure 5.25: Transient behavior of flames with H2 mole fraction from 37% to 99%.
116
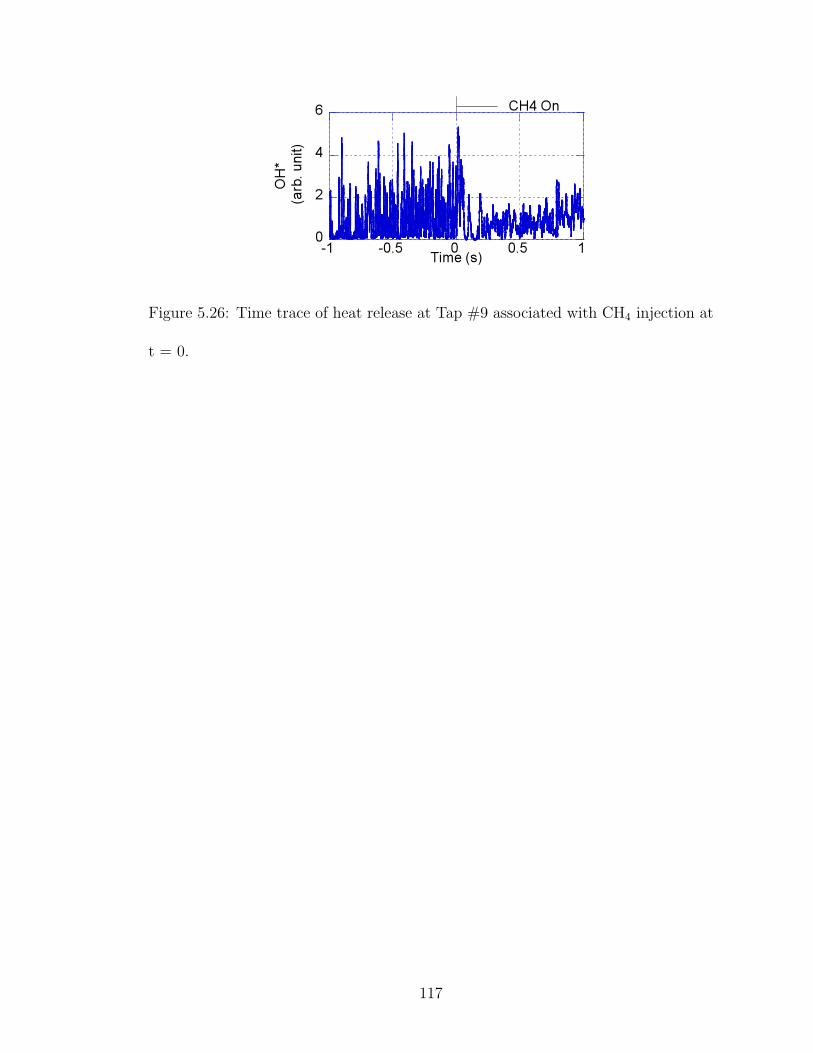
Figure 5.26: Time trace of heat release at Tap #9 associated with CH4 injection at
t = 0.
117
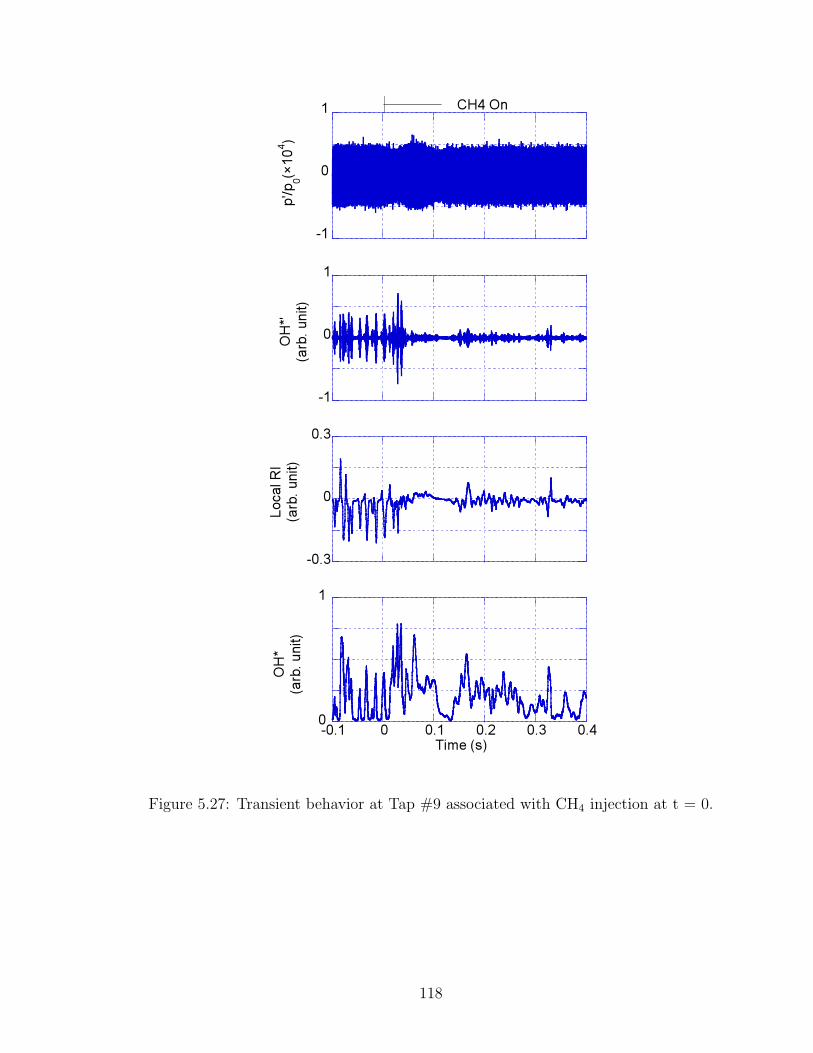
Figure 5.27: Transient behavior at Tap #9 associated with CH4 injection at t = 0.
118
Figure 5.28: Transient behavior at Tap #10 associated with CH4 injection at t = 0.
119

Figure 5.29: Transient behavior at Tap #11 associated with CH4 injection at t = 0.
120
Chapter 6
Control Demonstration in
Double-Injector Combustor
6.1 Introduction
In order to study the effectiveness of different reactant injection configurations
on the acoustic characteristics in the combustion chamber, tests were conducted in
the double-injector model combustor. Similar to the studies in the single-injector
combustor, the chamber was first acoustically characterized as discussed in Section
6.2 with transverse white noise acoustic excitation. Experiments were performed to
examine how changes in flow conditions at individual injectors could affect the over-
all resonance characteristics of the combustor. Two ways of changing the fluid injec-
tion were investigated. In Section 6.3, the effect of CH4-H2 blended fuel is discussed.
In Section 6.4, a potentially more practical method, modifying the equivalence ratio
while retaining the H2 and O2 reactants exclusively, is investigated.
121

6.2 Acoustic Characterization of Chamber
As described previously, band-limited white noise forcing was utilized to obtain
the acoustic response spectrum, from which resonance characteristics are evaluated.
In this test, the acoustic response of diffusion flames formed between a stoichio-
metric H2 and O2 mixture ratio for both injector elements was studied. This is
considered the baseline case. The flow conditions for the baseline case are listed in
Table 6.1. Reacting experiments were conducted in the baseline configuration to
identify various acoustic resonance modes. Dynamic pressure measurements were
taken at the three tap locations #1-3, shown in Figure 4.6, while the combustor was
operating. About 400 spectra were averaged to obtain these results, which show
distinctive spectral peaks corresponding to various acoustic resonance modes. The
results are shown in Figure 6.1. At Tap #1 and 3, there are up to three distinctive
spectral peaks worthy of mention. At Tap #2, only two of them show up as peaks
while the middle one is the spectral minimum.
To estimate acoustic resonance modes, Loci-CHEM, a finite volume flow solver
that uses high-resolution approximate Riemann solvers [95], was used to compute
the speed of sound profile for the reacting flow in the combustor. The resonant
frequencies were then calculated based on the speed of sound results from the sim-
ulation. Table 6.2 lists and compares various spectral peaks obtained from the
experimental data and the numerical model analysis. The comparison of the mea-
sured and calculated resonant frequencies leaves little doubt about the nature of the
dominant resonant modes.
122
Table 6.1: Flow conditions for fuel mixture tests
Oxidizer-fuel Density Ratio 16 (baseline) 11 7 3
O2 flow rate (g/s) 1.13 1.13 1.13 1.13
O2 velocity (m/s) 4.5 4.5 4.5 4.5
H2 flow rate (g/s) 0.142 0.111 0.075 0.019
CH4 flow rate (g/s) 0 0.062 0.134 0.246
H2 mole fraction (%) 100 94 82 37
CH4 mole fraction (%) 0 6 18 63
Fuel velocity (m/s) 13.5 11.3 8.7 4.5
Velocity Ratio 3.0 2.5 1.9 1.0
Rate of Heat Release (kW) 17.1 16.5 15.8 14.8
123

Table 6.2: Comparison of measured spectral peak minimum frequencies and calcu-
lated resonance frequencies
Location Tap #1 Tap #2 Tap #3
Mode L1o T1 L3 L1o L3 L1o T1 L3
Measured (Hz) 580 1440 1950 580 2060 580 1320 1865
Calculated (Hz) 590 1548 1968 590 1968 590 1548 1968
On the basis of the baseline flow investigations, the following findings can be
made:
• The first observed frequency appears to be the quarter-wave mode of the
oxidizer post, denoted as L1o.
• The second observed frequency appears to be the transverse quarter-wave
mode of the combustion chamber at the measured axial location, denoted as
T1.
• The third observed frequency appears to be the longitudinal three-quarter-
wave mode of the combustion chamber, denoted as L3.
6.3 Blended Fuel Effect on Acoustic Characteri-
zation of Chamber
In Chapter 5, it was found that the acoustic resonance characteristics of the
model injector remained qualitatively similar under fuel composition variation in the
124
single-injector configuration, but some of the resonant frequencies shifted to lower
values with increasing CH4 content due to the change of the acoustic impedance.
For these tests, the fuel mixture ratio effect was also examined in the double-injector
model combustor rig to show the effectiveness of the altered reactant injection within
one injector on the acoustic characteristics of the entire combustor. The first tangen-
tial mode in full-scale rocket engines was simulated by the quarter-wave transverse
mode (T1) in the experimental rig. If the frequency of this mode could be substan-
tially shifted with controlled fluid injection, the control method would be considered
effective in changing acoustic resonance characteristics. It is even better if this con-
trol method can affect other modes or change the pressure spectrum over a wide
frequency range.
Four different blended fuel compositions, each corresponding to a stoichiomet-
ric fuel-oxidizer mixture ratio, were tested for their flame stability characteristics
in the controlled injector. The standard injector was still operated at a baseline
flow condition. The reactant compositions and flow conditions are summarized in
Table 6.1. For each flow condition tested, the acoustic excitation was applied from
both the side corresponding to the specially-controlled injector as well as from the
side corresponding to the standard injector. This is illustrated in Figure 6.2.
The blended fuel mixture tests were conducted with acoustic excitation on
each side with reacting flow. From the controlled element side, in Figure 6.3, the
shifting frequencies associated with the three dominant spectral peaks are plotted
as a function of density ratio. Figure 6.4 shows the results with the compression
driver mounted on the standard element side. Both cases have similar tendencies.
125
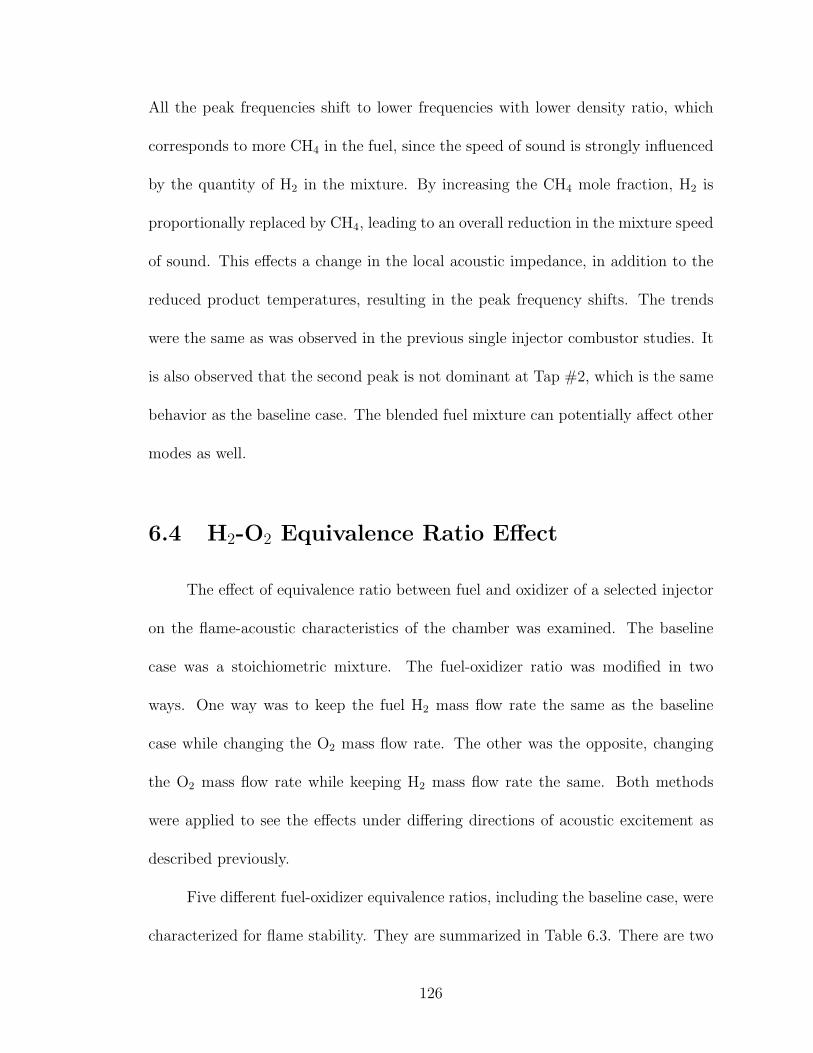
All the peak frequencies shift to lower frequencies with lower density ratio, which
corresponds to more CH4 in the fuel, since the speed of sound is strongly influenced
by the quantity of H2 in the mixture. By increasing the CH4 mole fraction, H2 is
proportionally replaced by CH4, leading to an overall reduction in the mixture speed
of sound. This effects a change in the local acoustic impedance, in addition to the
reduced product temperatures, resulting in the peak frequency shifts. The trends
were the same as was observed in the previous single injector combustor studies. It
is also observed that the second peak is not dominant at Tap #2, which is the same
behavior as the baseline case. The blended fuel mixture can potentially affect other
modes as well.
6.4 H2-O2 Equivalence Ratio Effect
The effect of equivalence ratio between fuel and oxidizer of a selected injector
on the flame-acoustic characteristics of the chamber was examined. The baseline
case was a stoichiometric mixture. The fuel-oxidizer ratio was modified in two
ways. One way was to keep the fuel H2 mass flow rate the same as the baseline
case while changing the O2 mass flow rate. The other was the opposite, changing
the O2 mass flow rate while keeping H2 mass flow rate the same. Both methods
were applied to see the effects under differing directions of acoustic excitement as
described previously.
Five different fuel-oxidizer equivalence ratios, including the baseline case, were
characterized for flame stability. They are summarized in Table 6.3. There are two
126
Table 6.3: Flow conditions for equivalence ratio tests
Case Baseline H2 Modification O2 Modification
Equivalence Ratio 1.0 0 0.5 1.5 0.5 1.5 ∞
O2 flow rate (g/s) 1.13 1.13 1.13 1.13 2.27 0.76 0
O2 velocity (m/s) 4.5 4.5 4.5 4.5 9.0 3.0 0
H2 flow rate (g/s) 0.142 0 0.071 0.212 0.142 0.142 0.142
H2 velocity (m/s) 13.5 0 6.75 20.25 13.5 13.5 13.5
Velocity Ratio 3.0 0 1.5 4.5 1.5 4.5 ∞
Rate of Heat Release (kW) 17.1 0 8.56 20.3 5.60 11.4 0
extreme cases. One extreme is only injecting O2 without any H2, which corresponds
to an equivalence ratio (ER) of zero. In contrast, the other extreme is to shut down
the O2 completely, only injecting H2. This scheme gives an infinite local equivalence
ratio. The injector with these two flow conditions can affect the flame structure as
well.
6.4.1 Effect on Acoustic Characterization of Chamber
H2 Mass Flow Rate Modulation Effect
In this series of tests, the effect of equivalence ratio on the flame-acoustic char-
acteristics was examined by changing the mass flow rate of H2. The first sequence
of tests involved acoustic excitation from the side of the modulated injector. Fig-
ure 6.5 shows the pressure spectra with equivalence ratios from 0.5 to 1.5. The first
127

spectral peak frequency, the quarter-wave mode of the oxygen post, was relatively
unaffected by both measurement (tap) location and fuel-oxidizer ratio. This is to
be expected since the oxygen flow rate was being held constant. Within the range
of equivalence ratios tested, the transverse mode of interest was slightly affected by
the fuel-oxidizer ratio. The frequency of this mode did not shift substantially. Fig-
ure 6.6 shows the comparison between the H2 completely-off case and the baseline
case. When the fuel was off, the mode shape of the pressure spectrum was drasti-
cally changed. The speed of sound in H2 is almost four times that in O2. Thus, the
overall speed of sound in this controlled injector region is decreased due to the lack
of H2 as well as lower temperatures from the lack of flames. The acoustic impedance
near this injector is therefore substantially different from the standard injector. This
suggests that turning off the fuel of the specially-modulated injector is a promising
control method for combustion instability by modifying the acoustic characteristics
near the injector regions.
The same fluid configurations were applied in the second set of tests as well,
but with acoustic excitation provided on the side of the standard injector. The
results are shown in Figure 6.7 and Figure 6.8. It can be seen that similar results
were obtained as with the previous excitation configuration. Turning off the fuel
is still the most effective control method, since it gives the greatest difference in
pressure spectrum as compared with the baseline case. Not only did this shift the
transverse mode by 40%, but it changed the shape of the pressure spectrum over
a wide frequency range as well. Another observation is the other modes are also
affected by the fuel modulation to some extent, which implies the potential for
128

additional instability-suppressing benefits.
O2 Mass Flow Rate Modulation Effect
In a similar manner to the previous set of experiments, reacting flow tests were
performed in which the O2 mass flowrate was modulated, rather than H2. Figures
6.9 and 6.11 show the results of equivalence ratios from 0.5 to 1.5 with acoustic exci-
tation from the controlled injector side and standard injector side, respectively. The
results are qualitatively similar amongst these cases, and do not show appreciable
mode frequency shifts. Even for the case with no O2, shown in Figures 6.10 and
6.12, the spectra were not as drastically changed as in the case with no H2. When
the O2 was off, the speed of sound in the vicinity of the injector was similar to its
value with nonzero O2 mass flow. Despite the reduced temperature from the lack of
flame, the pressure spectrum was not affected to a substantial extent. This implies
the major reason for the change in the acoustic environment is the content of the
flow rather than its temperature.
Figure 6.13 shows the summary of the first-quarter-wave transverse mode fre-
quency shift associated with equivalence ratio at Tap #1 and 3. The pressure
spectrum at Tap #2 does not show this frequency as a dominant peak. It can be
seen that the case without fuel (ER=0) shifts this frequency by 40%. The cases
other than the fuel-off configuration only affect the frequency of this mode slightly,
up to 8% or so. This suggests that completely turning off fuel has the best control
authority when modulating only the original fuel and oxidizer. This control method
appears to be a practical method for application in a full-scale liquid rocket engine.
129
6.4.2 Effect on Flame Structure
The effects of turning off fuel or oxidizer on the flame structure are examined.
For the baseline case, stoichiometric H2-O2 flow injected at both injectors, there are
four flames in the combustor, as shown in Figure 6.14. When the fuel is completely
shut down, which corresponds to ER=0, the number of flames reduces to three.
Figure 6.15 shows the flame structure without H2 in the injector closest to the
acoustic driver. Two of the flames form between the fuel and oxidizer in the standard
injector, while the third one forms between the oxidizer in the specially-controlled
injector and some of H2 from the coflow jet close to the controlled injector. This
is also observed in the case of turning off H2 in the controlled injector which is
farthest away from the acoustic excitation, shown in Figure 6.16. Shutting down
O2 causes two of the flames to vanish compared to the baseline case due to the
lack of oxidizer. These corresponding flame structures are shown in Figure 6.17 and
6.18. It is concluded that turning off fuel or oxidizer can change the flame structure
substantially; however, turning off oxidizer affects the flame structure the most. A
practical issue requiring consideration is that injection with only O2 may corrode
the walls of the combustor.
6.5 Summary and Discussions
The effect of injector flow modification on acoustic resonance characteristics
was examined using a two-dimensional model combustor featuring a pair of shear-
coaxial injector elements. White noise acoustic forcing was utilized to excite a pair
130

of turbulent GO2-GH2 diffusion flames and dynamic pressure measurements were
taken at three locations across the combustor, by which flame acoustic characteristics
were studied. With stoichiometric H2-O2 flames on both injectors, the chamber
was characterized and three dominant acoustic modes were identified: the quarter-
wave mode of the oxidizer post, transverse quarter-wave mode of the combustion
chamber and longitudinal three-quarter-wave mode of the combustion chamber. The
experimental results agree with the computational fluid dynamics (CFD) analytical
results well.
Another set of tests were conducted to quantify the changes in acoustic res-
onance characteristics and to explore the feasibility of replacing hard wall baffles
with a series of controlled injectors. The double elements consist of one controlled
injector placed next to a constant-flow GO2-GH2 injector. Flames from these in-
jectors were subjected to band-limited white noise acoustic forcing from the side of
controlled injector, and again from the side of the standard injector, and the pres-
sure responses was analyzed for a possible shift in acoustic resonance. Two different
approaches for the controlled injector were considered. One approach used a spe-
cialized fuel consisting of a CH4-H2 blend in the controlled injector, while the other
used the same fuel H2 as in the constant-flow injector but had different flow rates.
For the first approach, the CH4 mole fraction in the blended fuel was varied from 0
to 63%, resulting in up to 23% shift in the most-amplified frequencies. However, this
approach may not be practical in a flight-grade rocket due to the requirement for
an additional fuel tank to hold CH4. For the second approach, only the equivalence
ratio was varied at the controlled injector, causing up to 40% shift in the chamber
131
frequency. The results imply that strategically-placed controlled injectors could be
an effective tool to prevent resonant oscillations. The results open up the possibility
of using a small number of controlled injectors to replace baffles in liquid-fueled
rockets.
132

0
0.001
0.002
0.003
0 1000 2000 3000 4000 5000S
pect
ral A
mpl
itude
(psi
)Frequency (Hz)
L1_o=580Hz
T1=1440Hz
L3=1950Hz
(a) Tap #1
0 1000 2000 3000 4000 50000
0.001
0.002
0.003
Frequency (Hz)
L1_o=580Hz
L3=2060HzSpe
ctra
l Am
plitu
de (p
si)
(b) Tap #2
0 1000 2000 3000 4000 50000
0.001
0.002
0.003
Frequency (Hz)
L1_o=580Hz
T1=1320Hz
L3=1865Hz
Spe
ctra
l Am
plitu
de (p
si)
(c) Tap #3
Figure 6.1: Pressure spectrum for baseline case.
133
AcousticDriver
SignalGenerator
Amplifier Tap 1 Tap 2 Tap 3
Standard Injector
Controlled Injector
(a) Acoustic excitation directly against the controlled injec-
tor
AcousticDriver
SignalGenerator
Amplifier Tap 1 Tap 2 Tap 3
Controlled Injector
Standard Injector
(b) Acoustic excitation directly against the standard injec-
tor
Figure 6.2: Direction of acoustic excitation and pressure tap locations.
134

0
0.001
0.002
0.003
0 1000 2000 3000 4000 5000
Spe
ctra
l am
plitu
de (p
si)
Frequency (Hz)
L1_o
T1
L3
(a) Pressure spectrum
0
500
1000
1500
2000
2500
2 4 6 8 10 12 14 16
Tap 1 L1_oTap 1 T1Tap 1 L3Tap 2 L1_o
Tap 2 L3Tap 3 L1_oTap 3 T1Tap 3 L3
Freq
uenc
y (H
z)
Density Ratio
L1_o
T1
L3
(b) Frequency shift associated with density ratio
Figure 6.3: Frequency shift from fuel mixture with acoustic excitation from the
specially-controlled injector side.
135
0
0.001
0.002
0.003
0 1000 2000 3000 4000 5000
Spe
ctra
l am
plitu
de (p
si)
Frequency (Hz)
L1_o
T1L3
(a) Pressure spectrum
0
500
1000
1500
2000
2500
2 4 6 8 10 12 14 16
Tap 1 L1_oTap 1 T1Tap 1 L3Tap 2 L1_o
Tap 2 L3Tap 3 L1_oTap 3 T1Tap 3 L3
Freq
uenc
y (H
z)
Density Ratio
L3
T1
L1_o
(b) Frequency shift associated with density ratio
Figure 6.4: Frequency shift from fuel mixture with acoustic excitation from the
standard injector side.
136

0
0.001
0.002
0.003
0 1000 2000 3000 4000 5000
ER=0.5
ER=1.0
ER=1.5
Spe
ctra
l am
plitu
de (p
si)
Frequency (Hz)
(a) Tap #1
0 1000 2000 3000 4000 50000
0.001
0.002
0.003
Frequency (Hz)
Spe
ctra
l am
plitu
de (p
si)
(b) Tap #2
0 1000 2000 3000 4000 50000
0.001
0.002
0.003
Frequency (Hz)
Spe
ctra
l am
plitu
de (p
si)
(c) Tap #3
Figure 6.5: Effect of equivalence ratio from modifying H2 mass flowrate with acoustic
excitation from the specially-controlled injector side.
137
0
0.002
0.004
0.006
0 1000 2000 3000 4000 5000
ER=0ER=1
Spe
ctra
l am
plitu
de (p
si)
Frequency (Hz)
(a) Tap #1
0 1000 2000 3000 4000 50000
0.002
0.004
0.006
Frequency (Hz)
Spe
ctra
l am
plitu
de (p
si)
(b) Tap #2
0 1000 2000 3000 4000 50000
0.002
0.004
0.006
Frequency (Hz)
Spe
ctra
l am
plitu
de (p
si)
(c) Tap #3
Figure 6.6: Effect of equivalence ratio from shutting down H2 mass flow with acoustic
excitation from the specially-controlled injector side.
138
0
0.001
0.002
0.003
0 1000 2000 3000 4000 5000
ER=0.5
ER=1.0
ER=1.5
Spe
ctra
l am
plitu
de (p
si)
Frequency (Hz)
(a) Tap #1
0 1000 2000 3000 4000 50000
0.001
0.002
0.003
Frequency (Hz)
Spe
ctra
l am
plitu
de (p
si)
(b) Tap #2
0 1000 2000 3000 4000 50000
0.001
0.002
0.003
Frequency (Hz)
Spe
ctra
l am
plitu
de (p
si)
(c) Tap #3
Figure 6.7: Effect of equivalence ratio from modifying H2 mass flowrate with acoustic
excitation from the standard injector side.
139

0
0.002
0.004
0.006
0 1000 2000 3000 4000 5000
ER=0ER=1
Spe
ctra
l am
plitu
de (p
si)
Frequency (Hz)
(a) Tap #1
0 1000 2000 3000 4000 50000
0.002
0.004
0.006
Frequency (Hz)
Spe
ctra
l am
plitu
de (p
si)
(b) Tap #2
0 1000 2000 3000 4000 50000
0.002
0.004
0.006
Frequency (Hz)
Spe
ctra
l am
plitu
de (p
si)
(c) Tap #3
Figure 6.8: Effect of equivalence ratio from shutting down H2 mass flow with acoustic
excitation from the standard injector side.
140

0
0.001
0.002
0.003
0 1000 2000 3000 4000 5000
ER=0.5
ER=1.0
ER=1.5
Spe
ctra
l am
plitu
de (p
si)
Frequency (Hz)
(a) Tap #1
0 1000 2000 3000 4000 50000
0.001
0.002
0.003
Frequency (Hz)
Spe
ctra
l am
plitu
de (p
si)
(b) Tap #2
0 1000 2000 3000 4000 50000
0.001
0.002
0.003
Frequency (Hz)
Spe
ctra
l am
plitu
de (p
si)
(c) Tap #3
Figure 6.9: Effect of equivalence ratio from modifying O2 mass flowrate with acoustic
excitation from the specially-controlled injector side.
141
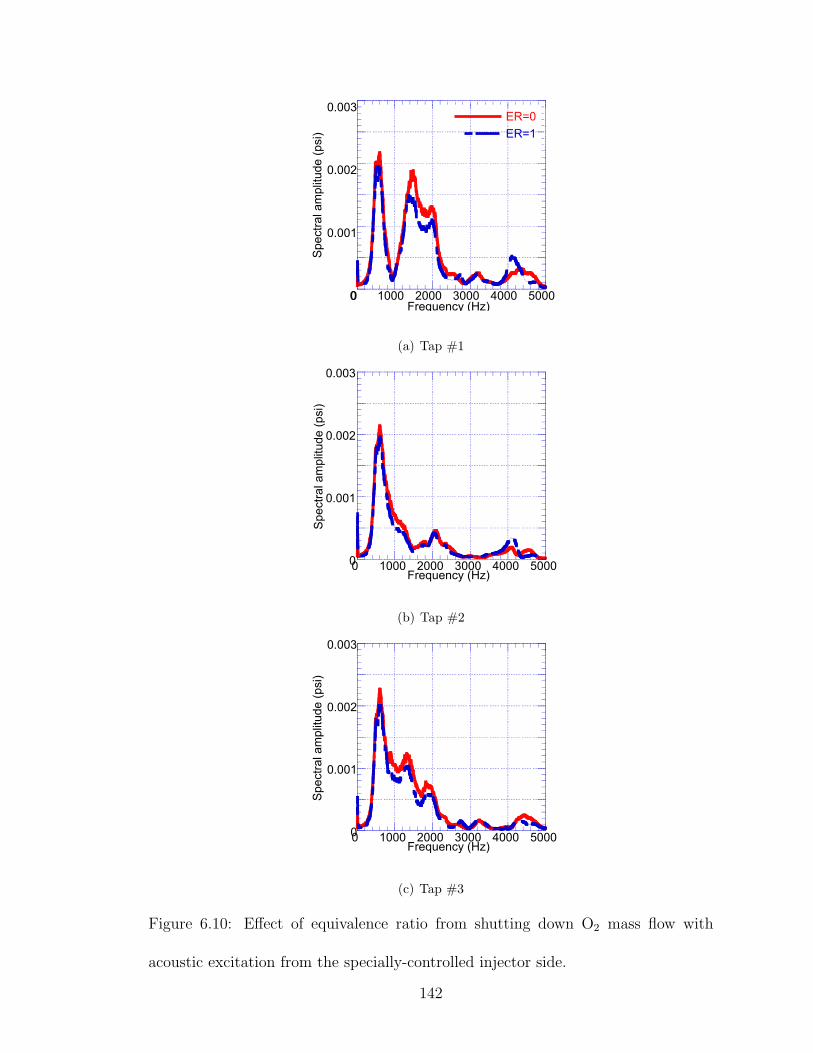
0
0.001
0.002
0.003
0 1000 2000 3000 4000 5000
ER=0ER=1
Spe
ctra
l am
plitu
de (p
si)
Frequency (Hz)
(a) Tap #1
0 1000 2000 3000 4000 50000
0.001
0.002
0.003
Frequency (Hz)
Spe
ctra
l am
plitu
de (p
si)
(b) Tap #2
0 1000 2000 3000 4000 50000
0.001
0.002
0.003
Frequency (Hz)
Spe
ctra
l am
plitu
de (p
si)
(c) Tap #3
Figure 6.10: Effect of equivalence ratio from shutting down O2 mass flow with
acoustic excitation from the specially-controlled injector side.
142

0
0.001
0.002
0.003
0 1000 2000 3000 4000 5000
ER=0.5
ER=1.0
ER=1.5
Spe
ctra
l am
plitu
de (p
si)
Frequency (Hz)
(a) Tap #1
0 1000 2000 3000 4000 50000
0.001
0.002
0.003
Frequency (Hz)
Spe
ctra
l am
plitu
de (p
si)
(b) Tap #2
0 1000 2000 3000 4000 50000
0.001
0.002
0.003
Frequency (Hz)
Spe
ctra
l am
plitu
de (p
si)
(c) Tap #3
Figure 6.11: Effect of equivalence ratio from modifying O2 mass flowrate with acous-
tic excitation from the standard injector side.
143
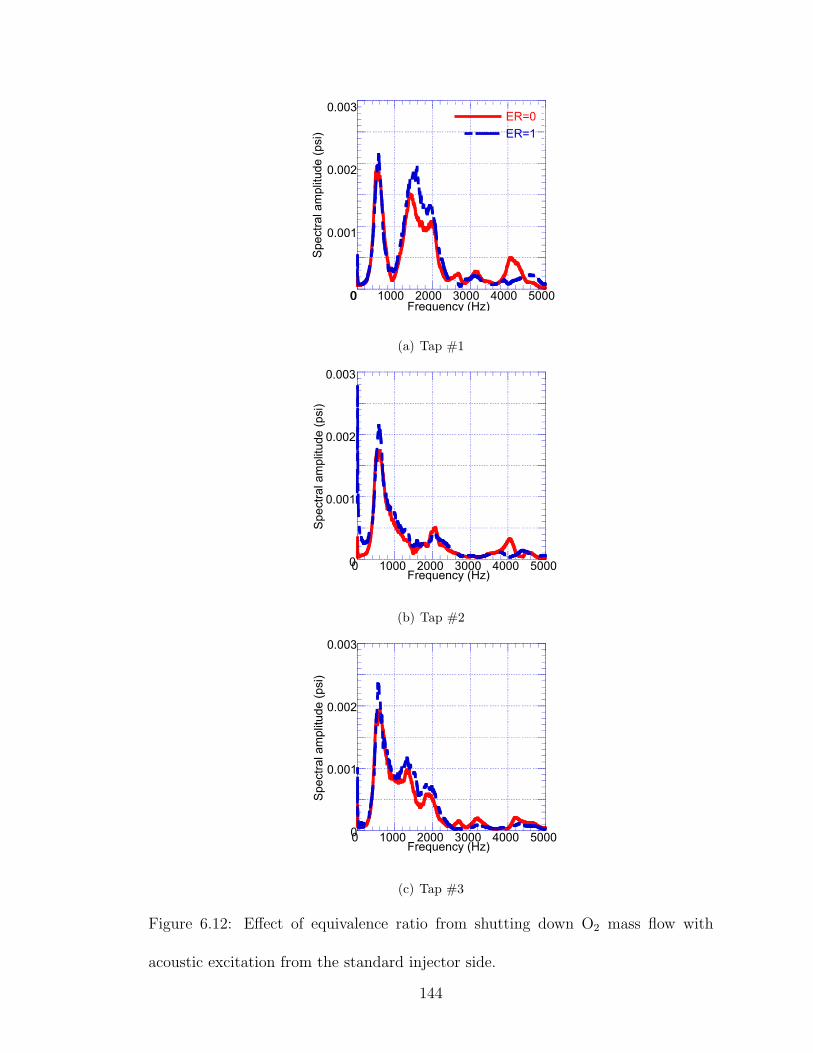
0
0.001
0.002
0.003
0 1000 2000 3000 4000 5000
ER=0ER=1
Spe
ctra
l am
plitu
de (p
si)
Frequency (Hz)
(a) Tap #1
0 1000 2000 3000 4000 50000
0.001
0.002
0.003
Frequency (Hz)
Spe
ctra
l am
plitu
de (p
si)
(b) Tap #2
0 1000 2000 3000 4000 50000
0.001
0.002
0.003
Frequency (Hz)
Spe
ctra
l am
plitu
de (p
si)
(c) Tap #3
Figure 6.12: Effect of equivalence ratio from shutting down O2 mass flow with
acoustic excitation from the standard injector side.
144
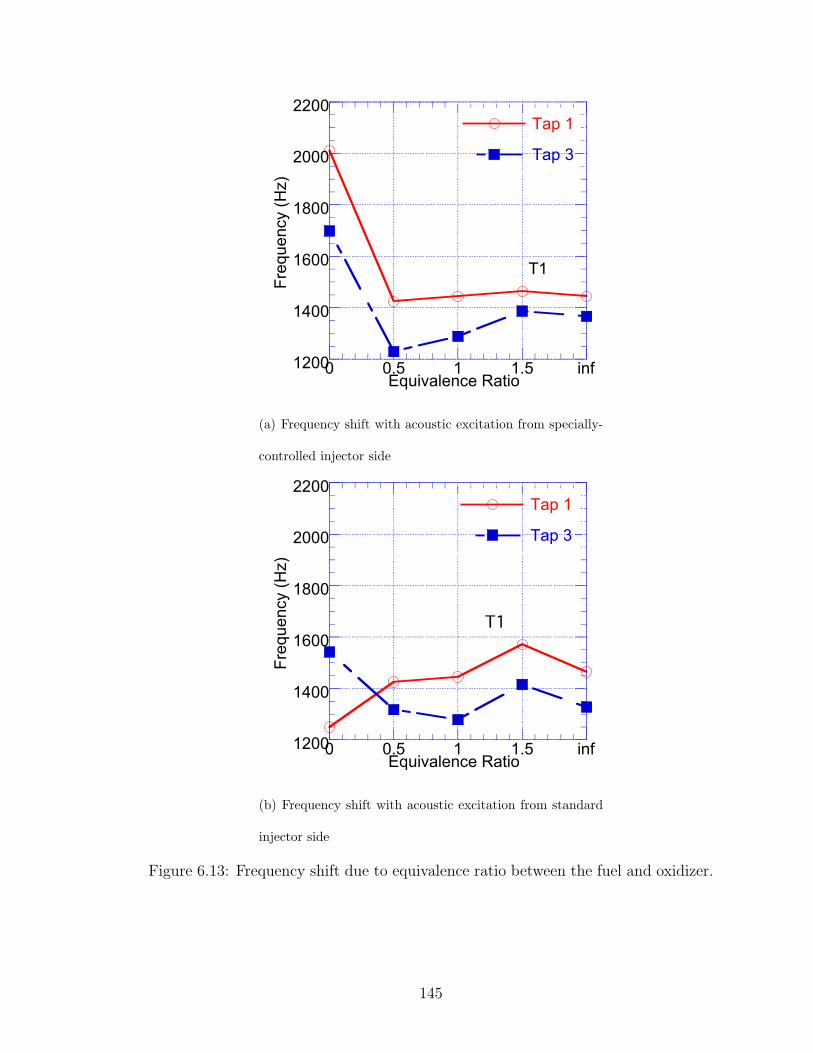
1200
1400
1600
1800
2000
2200
0 0.5 1 1.5
Tap 1
Tap 3
Freq
uenc
y (H
z)
Equivalence Ratioinf
T1
(a) Frequency shift with acoustic excitation from specially-
controlled injector side
1200
1400
1600
1800
2000
2200
0 0.5 1 1.5
Tap 1
Tap 3
Freq
uenc
y (H
z)
Equivalence Ratioinf
T1
(b) Frequency shift with acoustic excitation from standard
injector side
Figure 6.13: Frequency shift due to equivalence ratio between the fuel and oxidizer.
145

(x/D)
(y/D)
−5 −4 −3 −2 −1 0 1 2 3 4 50
2
4
6
8
10
12
14
16
Figure 6.14: Flame structure for the baseline case. Acoustic driver is on the left
side.
146

(x/D)
(y/D)
−5 −4 −3 −2 −1 0 1 2 3 4 50
2
4
6
8
10
12
14
16
Figure 6.15: Flame structure with H2 mass flow shut down and acoustic excitation
from the specially-controlled injector side. Acoustic driver is on the left side.
147
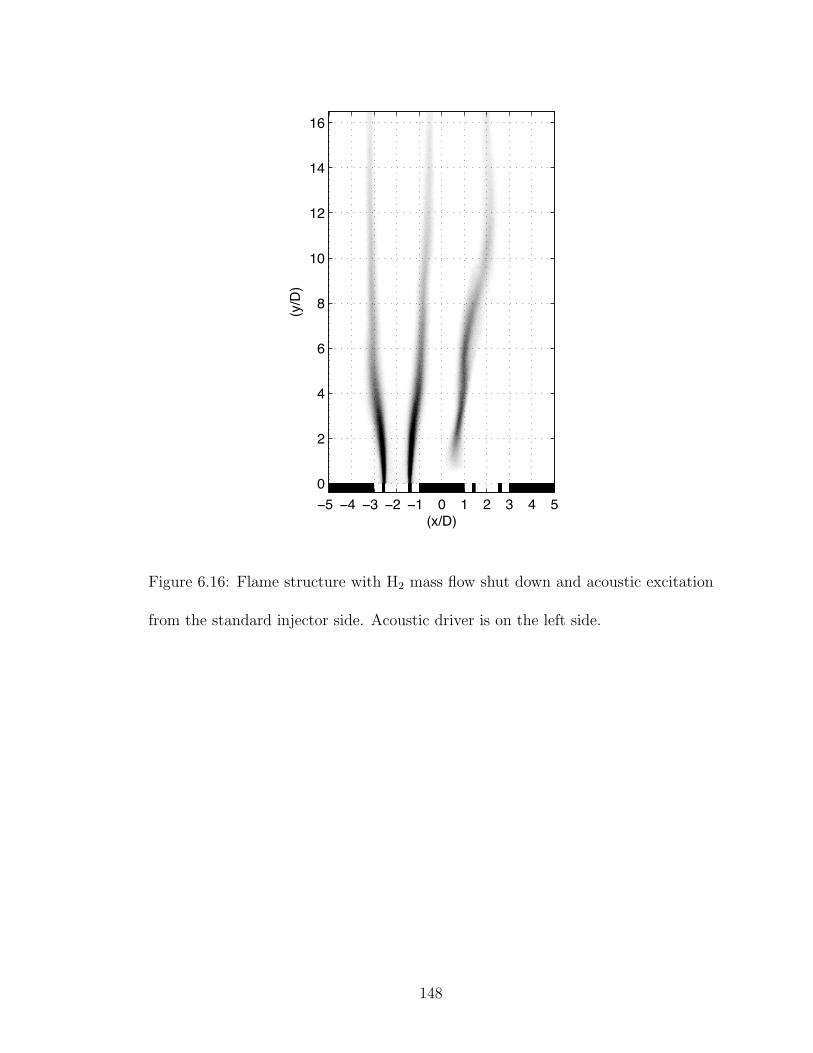
(x/D)
(y/D)
−5 −4 −3 −2 −1 0 1 2 3 4 50
2
4
6
8
10
12
14
16
Figure 6.16: Flame structure with H2 mass flow shut down and acoustic excitation
from the standard injector side. Acoustic driver is on the left side.
148
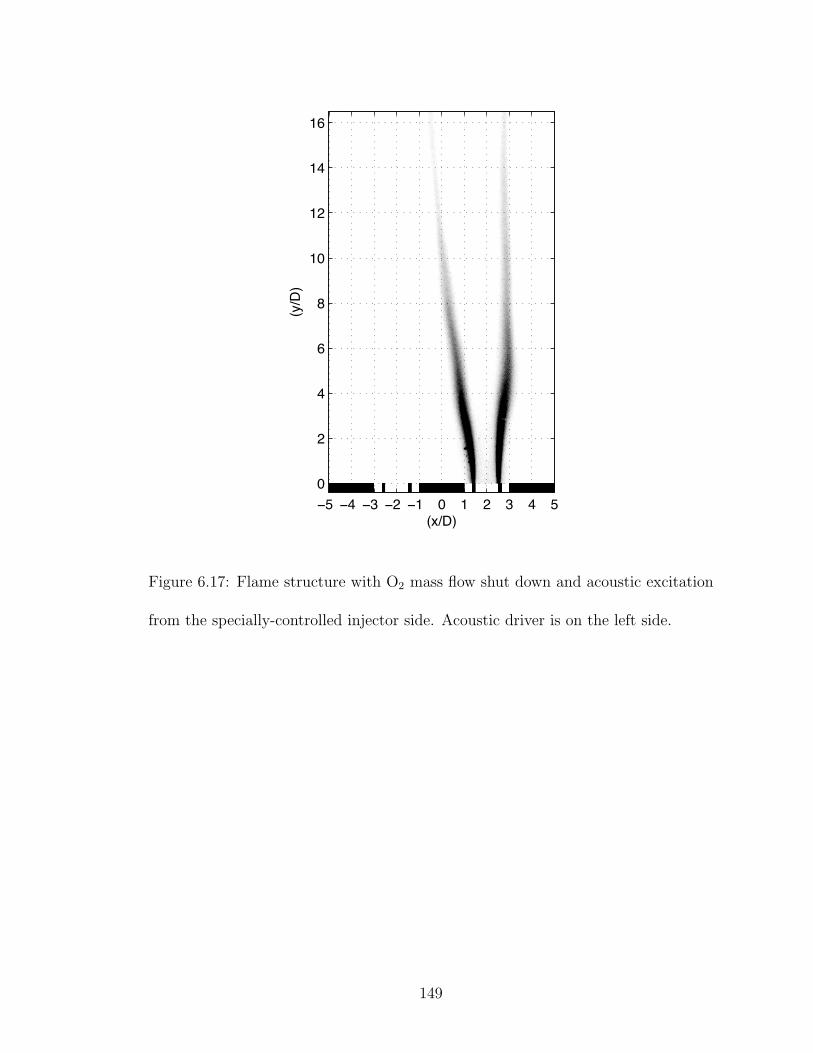
(x/D)
(y/D)
−5 −4 −3 −2 −1 0 1 2 3 4 50
2
4
6
8
10
12
14
16
Figure 6.17: Flame structure with O2 mass flow shut down and acoustic excitation
from the specially-controlled injector side. Acoustic driver is on the left side.
149
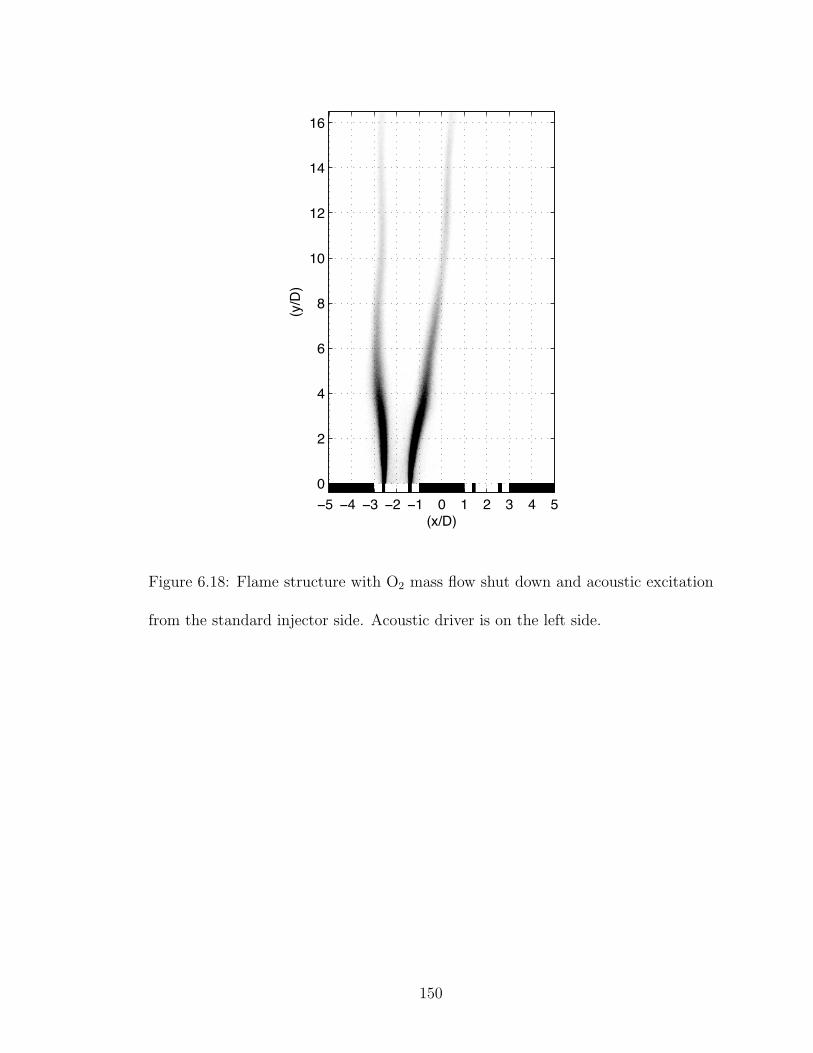
(x/D)
(y/D)
−5 −4 −3 −2 −1 0 1 2 3 4 50
2
4
6
8
10
12
14
16
Figure 6.18: Flame structure with O2 mass flow shut down and acoustic excitation
from the standard injector side. Acoustic driver is on the left side.
150
Chapter 7
Conclusions and Future Work
7.1 Conclusions
In liquid rocket engine thrust chambers, particularly in the vicinity of the in-
jector, flame-acoustic interactions may bring about large-amplitude self-sustaining
combustion oscillations from small acoustic disturbances. Basic physical mecha-
nisms of acoustically-driven combustion instabilities involving shear coaxial injectors
were experimentally studied using gaseous H2-O2 turbulent diffusion flames in two-
dimensional model combustors. Experiments were conducted in two different model
combustors that were designed to capture the unit physics of the flame-acoustic
interaction in a single-element injector configuration as well as in a double-element
injector configuration. Also, the concepts and evidence supporting a novel combus-
tion instability suppression strategy that could be analogous to acoustic baffles used
in thrust chambers were presented.
The white noise excitation approach adopted in the present research proved to
151

be a valuable tool not only for identifying the dominant acoustic modes of the com-
bustors but also for comparing combustion control effectiveness by measuring the
quantitative shift in the local acoustic behavior. Flame-acoustic interaction experi-
ments were conducted by establishing turbulent flames from each model injector and
subjecting them to controlled acoustic excitation waves via the compression driver,
mounted in the transverse direction. Band-limited white noise was utilized as the
forcing input signal to the driver, and the forced combustor response was char-
acterized by measuring the resulting pressure oscillations and the dynamic flame
behavior. By comparing the spectral responses, any changes in acoustic resonance
characteristics could be quantified and used for control performance evaluation as
demonstrated in this thesis work.
A novel idea of mixing heavier CH4 into the H2 fuel to reduce flame-acoustic
interaction was conceived and tested. It was recently noted that the large den-
sity difference between O2 and H2 could amplify the heat release disturbance when
compression waves interacted with the diffusion flames, making the interface more
susceptible to baroclinic torques. In an attempt to minimize this effect, the fuel
was made denser while holding the same equivalence ratio, thus allowing limited
control over the fuel-oxidizer density gradient. The results showed that the gen-
eral characteristics of the unforced flames were unaffected by a moderate amount of
methane addition. However, the effect on combustion oscillations turned out to be
quite significant as the controlled flames became much more resistant to acoustic
disturbances from the compression driver.
The quantitative effect of fuel density on the acoustic characteristics of the
152

chamber was investigated using the mixture of CH4 and H2 in the single-injector
configuration. While the CH4 mole fraction in the fuel was varied between 1% and
63% during the tests, the acoustic resonance characteristics of the model injector
remained qualitatively similar. Some of the resonant frequencies decreased with
increasing CH4 concentration and the peak amplitudes were also affected due to
changes in the local acoustic impedance. In non-reacting tests, the resonance of
the quarter-wave mode associated with the oxidizer post was relatively unaffected,
but the frequency of the three-quarter-wave chamber mode decreased by 15% with
18% CH4 addition. Transverse-mode resonance was also altered significantly due to
the changes in the speed of sound and the local acoustic impedances. In reacting
tests, acoustic modes associated with the oxidizer post changed slightly with the
fuel composition possibly due to the changes in product temperature and the heat
transfer into the inlet. The dominant longitudinal mode of the chamber exhibited
a frequency change of as much as 16% with the CH4 addition.
Interaction between flames and traveling waves was simulated by acoustically
forcing the combustion system at a fixed frequency far removed from any resonance.
The selected frequency of 1150 Hz represented a local spectral minimum. It was
expected that excitation at this frequency would not result in any standing wave
pattern, thus establishing a distinct wave direction from the compression driver.
Severe flame wrinkling was observed on one side of the flames in the H2-O2 case.
Global and local measurements of OH* chemiluminescence indicated periodic heat
release modulation at various frequencies including the forcing frequency. Simulta-
neous measurements of local pressure fluctuations and chemiluminescence showed
153
that acoustic pressure oscillations affected spatial fluctuations in OH* chemilumi-
nescence. The selective presence of high frequency components of heat release riding
on a low frequency component of heat release was observed indicating a possible case
of local Rayleigh-Taylor instability.
Single frequency forcing tests were conducted also with the blended CH4-H2
fuel. Again, the flames from the blended fuel wrinkled much less than the H2 flames
under the same forcing conditions. These results suggested the possibility of using
the blended H2-CH4 fuel to control the fuel-oxidizer density gradient which in turn
affects the susceptibility to flame-acoustic interaction. To further assess the active
control potential of real-time in-situ CH4 addition, both transient and steady state
characteristics of CH4 addition into primary H2 flow were investigated using high
speed imaging and simultaneous dynamic pressure and chemiluminescence measure-
ments. Local Rayleigh indices at selected points on the flame oscillation path before
and after CH4 addition were tracked. It was shown that the transient process typi-
cally took 150 - 180 ms of settling time, which was much longer than the oscillation
period. This implies the fuel blending technique would not be suitable for high-
speed real-time active instability control. Nonetheless it could be used to prevent
instabilities from developing.
A novel strategy of preventing the combustion instabilities in liquid rocket
engine is presented on the basis of the new understanding of the effect of fuel density
on flame-acoustic interactions. Arrays of flow-controlled injectors arranged in a
spatial pattern similar to the layout of baffles could be effective in modifying the local
acoustic impedance as shown in this thesis. Both the fuel composition change and
154

the fuel-oxidizer ratio affected the local acoustic characteristics although by different
amounts. Unlike a typical active control strategy in which high-frequency propellant
modulation would be required, the present strategy relies on a quasi steady-state
tailoring of the local acoustic characteristics similar to the mechanism underlying
baffles. Demonstration experiments were conducted in the double-element injector
configuration to assess the feasibility of the new control strategy. Use of the CH4-
H2 blended fuel resulted in up to 18% modification in the spectral peak frequency.
Another strategy, which involved using only the original H2 and O2 propellants but
altering the equivalence ratio of the special injectors, also resulted in changes to
pressure spectrum shape and amplitude. The current work opens up the possibility
of developing a flexible combustion control methodology.
7.2 Findings and Key Contributions
7.2.1 New Control Strategies for Suppressing Combustion
Instability
Novel flow-based strategies to suppress flame-acoustic instability in liquid
rocket engines were established and demonstrated in the current research. These
new control methodologies offer the potential for more thrust, eliminate the weight
and cooling penalties, and reduce cut-and-try design cycles associated with hard-
ware baffles. They can also mitigate systemic risk due to combustion instability and
potentially extend the overall range of safe operating conditions. This opens up the
155
possibility for improved overall rocket system performance and greater flexibility.
• Specially-controlled reactant injectors are the basis for the methods developed.
These injectors operate with different fluid configurations from the standard
injectors when combustion instability tends to be a problem. The non-uniform
injectant pattern results in a modified acoustic environment within the com-
bustion chamber. The controlled injectors can be returned to flow config-
urations identical to the bulk of the injectors when the engine is no longer
operating at or near critical conditions.
• Two different propellant control strategies were examined: the use of a blended
fuel in specially-modulated injectors by introducing CH4 as a secondary fuel to
H2, and modification of the equivalence ratio at specially-modulated injectors
by altering the mass flowrate of H2 or O2.
7.2.2 Physical Mechanisms of the Strategies
The specially-controlled injectors are configured to perform a role analogous
to hardware baffles by regulating the local acoustic impedance. These injectors
are associated with a local acoustic impedance field that differs substantially from
the injectors that are operating at the standard conditions (typically stoichiomet-
ric). When they were employed experimentally, substantial changes in the acoustic
impedance environment were observed and dominant acoustic modes in the com-
bustion chamber exhibited shifts in their associated frequencies.
• Variation of the speed of sound with local fuel composition, and corresponding
156
variation in acoustic impedances was one of the mechanisms underlying the
effectiveness of the blended fuel approach. Mixing CH4 with H2 modified the
fuel density and changed the speed of sound as well.
• Acoustic energy suppression by discouraging conditions favorable for thermo-
acoustic instability was another physical mechanism when CH4 was used. With
more CH4 in the blended fuel, the flame response to the acoustic traveling wave
was suppressed due to the lessened density gradient between fuel and oxidizer.
• Acoustic speed was tailored through flame structure modification via propel-
lant rate control, without the use of a secondary fuel. Mass flow rate modula-
tion of the original H2 and O2 propellants was effective in this manner.
7.2.3 Effectiveness of the Strategies
The effectiveness of the two control methods was demonstrated in a double
shear-coaxial injector element combustor. One element was specifically-modulated,
while the other was operated using standard parameters. The mechanism focused
on one of the transverse modes of the model combustor, which represented either a
tangential or radial mode in a full-scale liquid rocket engine.
• In the experiments employing H2-CH4 blended fuel in the controlled injector,
all peak frequencies were found to shift to a lower value with increasing CH4
proportion. This was due to the changes in the acoustic impedance associated
with the controlled injector.
157
• For the scheme in which the controlled injector’s equivalence ratio was altered,
the pressure spectrum across the chamber was not affected to a significant
extent until the H2 mass flow was turned off (zero equivalence ratio). Turning
off the oxidizer mass flowrate (∞ equivalence ratio) was not as effective as
turning off the fuel.
• From a practical perspective, turning off the fuel may not be optimal due to
the potentially corrosive effect of oxygen flow in the thrust chamber. Turning
off the oxidizer in certain injectors during operation in regimes of impending
combustion instability may be one way to apply fluidic control to suppress the
flame-acoustic instability.
7.3 Future Work
The current work provided the basic physical and control effectiveness demon-
strations for suppressing flame-acoustic interaction through unit physics experi-
ments. However there are still some issues that need to be addressed in order
to fully understand the physical processes and apply the control methodology to
liquid rocket engines. Firstly, it is important to examine the flame response in a
three-dimensional two-phase flow configuration, as the current experimental setup is
limited to two- dimensional single phase flow. Secondly, in this lab scale combustor
the Reynolds number is scaled down to approximately 5500. More experimental
studies at full-scale Reynolds numbers are required to obtain more insight. Finally,
in flight-grade liquid rockets, both fuel and oxidizer are cryogenic fluids. Therefore
158

the fuel temperature is a key factor in the application of these experimental re-
sults. It is recommended to perform similar tests with cryogenic fuel and oxidizer to
study the instability mechanisms associated with the atomization and vaporization
processes.
The present research and most of the prior work have used single-element and
double-element injectors to examine the flame behavior of propellants in order to
predict the injector performance. However, there are hundreds of injectors element
in actual rocket, as shown in Figure 3.5. It is necessary to extend experimental
investigations to sub-scale combustors with multiple (20-40) injectors to verify the
effectiveness of the strategies presented in this work in more representative configu-
rations. These tests can also be used to determine optimal layouts of the specially-
modulated injectors. The application of these propellant injection control methods
to full-scale development engines is recommended if the sub-scale test results are
promising. The layout pattern and mass flowrates of the specially-controlled injec-
tors can be further tuned, as they would then be in the most realistic operating
environments.
Computational Fluid Dynamics (CFD) tools are widely used to assist in the
design of aerothermodynamic devices such as rocket engines. However, such tools
are presently unable to accurately predict and model combustion instability because
the physical and chemical mechanisms are still not well understood. The current
lab-scale experimental data can provide verification and validation for reacting flow
CFD solvers with respect to flame-acoustic interactions. It will be easier to start
with the simple 2-D model configuration to validate CFD models. CFD codes should
159

be used to predict the reacting flow fields with acoustic excitation for sub-scale and
full-scale tests once they are validated with the experimental data. Use of accurate
CFD simulations can help reduce the need for expensive experiments.
160

Bibliography
[1] Harrje, D. and (eds.), F. R., “Liquid Propellant Rocket Combustion Instabil-
ity,” NASA SP-194 , 1972.
[2] Crocco, L. and Cheng, S. I., Theory of Combustion Instability in Liquid Propel-
lant Rocket Motors , AGARD monograph, Butterworths Scientific Publications,
1956.
[3] Price, E., Combustion Instabilities in Solid Propellant Rocket Motors , Astro-
nautica Acta, 1959.
[4] Zinn, B. and Powell, E., “Nonlinear Combustion Instability in Liquid Propellant
Rocket Engines,” Thirteenth Symposium (International) on Combustion, The
Combustion Institute, 1971, pp. 491–503.
[5] Culick, F. E. C. and Yang, V., “Overview of Combustion Instabilities in
Liquid-Propellant Rocket Engines,” Liquid Rocket Engine Combustion Instabil-
ity, Progress in Astronautics and Aeronautics , Vol. 169, 1995, pp. 3–37, AIAA,
Washintong DC.
161

[6] Hulka, J. and Hutt, J. J., “Instability Phenomena in Liquid Oxygen/Hydrogen
Propellant Rocket Engines,” Liquid Rocket Engine Combustion Instability,
Progress in Astronautics and Aeronautics , Vol. 169, 1995, pp. 39–72, AIAA,
Washintong DC.
[7] Yang, V. and Culick, F., “Analysis of Low Frequency Combustion Instabili-
ties in a Laboratory Ramjet Combustor,” Combustion Science and Technology ,
Vol. 45, 1986, pp. 1–25.
[8] Schadow, K. and Gutmark, E., “Combustion Instability to Vortex Shedding in
Dump Combustors and Their Passive Control,” Progress in Energy Combustion
and Science, Vol. 18, No. 2, 1992, pp. 117–132.
[9] Hedge, U., Reuter, D., Daniel, B., and Zinn, B., “Flame Driving of Longitudi-
nal Instabilities in Dump Type Ramjet Combustors,” Combustion Science and
Technology , Vol. 55, 1987, pp. 125–138.
[10] Yu, K., Lee, S., Trouve, A., Stewart, H., and Daily, J., “Vortex Nozzle Interac-
tions in Ramjet Combustors,” AIAA Paper No. AIAA-87-1871.
[11] Yu, K., Trouve, A., and Daily, J., “Low-Frequency Pressure Oscillation in a
model ramjet combustor,” Journal of Fluid Mechanics , Vol. 232, 1991, pp. 47–
72.
[12] Schadow, K., Wilson, K., and Gutmark, E., “Characterization of Large Scale
Structures in a Forced Ducted Flow with Dump,” AIAA Journal , Vol. 25, No. 9,
1987, pp. 1164–1170.
162

[13] Langhorne, P., “Reheat Buzz: An Acoustically Coupled Combustion Instability.
Part 1. Experiment,” Journal of Fluid Mechanics , Vol. 193, 1988, pp. 417–443.
[14] Bloxsidge, G., Dowling, A., and Langhorne, P., “Reheat Buzz: An Acoustically
Coupled Combustion Instability. Part 2. Theory,” Journal of Fluid Mechanics ,
Vol. 193, 1988, pp. 445–473.
[15] Putnam, A., Combustion-Driven Oscillations in Industry , Elsevier, New York,
1971.
[16] Rayleigh, G., The Theory of Sound , Vol. 2, Dover Publications, 1945.
[17] Putnam, A. and Dennis, W., “A Study of Burner Oscillations of the Organ-Pipe
Type,” Trans. A.S.M.E., Vol. 75, No. 1, 1953, pp. 15–28.
[18] Zinn, B., “Pulse Combustion: Recent Applications and Research Issure,”
Twenty-Fourth Symposium (International) on Combustion, The Combustion
Institute, 1992, pp. 1297–1305.
[19] Culick, F., “Nonlinear Behavior of Acoustic Waves in Combustion Chambers
Parts I and II,” Acta Astronautica, Vol. 3, 1976, pp. 714–757.
[20] Culick, F., “A Note on Rayleigh Criterion,” Combustion Science and Technol-
ogy , Vol. 56, 1987, pp. 159–166.
[21] Sterling, J., Longitudinal Mode Instabilities in Air Breathing Engines , Ph.D.
thesis, California Institute of Technology, 1987.
163

[22] Sterling, J. and Zukoski, E., “Nonlinear Dynamics of Laboratory Combus-
tor Pressure Oscillations,” Combustion Science and Technology , Vol. 77, 1991,
pp. 225–238.
[23] Gaydon, A. and Wolfhard, H., Flames, Their Structure, Radiation and Tem-
perature, Chapman & Hall, 1960, Chap. VII.
[24] Toong, T., Salant, R., Stopford, J., and Anderson, G., “Mechanisms of Combus-
tion Instability,” Tenth Symposium (International) on Combustion, The Com-
bustion Institute, 1965, pp. 1301–1313.
[25] Price, E., “Recent Advances in Solid Propellant Combustion Instability,”
Twelfth Symposium (International) on Combustion, The Combustion Institute,
1969, pp. 101–113.
[26] Marxman, F. and Wooldridge, C., “Finite-Amplitude Axial Instability in Solid-
Rocket Combustion,” Twelfth Symposium (International) on Combustion, The
Combustion Institute, 1969, pp. 115–127.
[27] Sirignano, W., “A Theory of Axial-Mode Shock-Wave Oscillations in a Solid
Rocket Combustor,” Twelfth Symposium (International) on Combustion, The
Combustion Institute, 1969, pp. 129–137.
[28] Thring, M., “Combustion Oscillations in Industrial Combustion Chambers,”
Twelfth Symposium (International) on Combustion, The Combustion Institute,
1969, pp. 163–168.
164
[29] Kydd, P., “Analysis and Experiments on Unsteady Flow in Gas Turbine Main
Combustors,” Twelfth Symposium (International) on Combustion, The Com-
bustion Institute, 1969, pp. 183–192.
[30] Williams, F., Combustion Theory , Benjamin Cummings, Menlo Park, CA,
1984, chapter 9, pp. 294-372.
[31] Laverdant, A., Poinsot, T., and Candel, S., “Mean Temperature Field Effect
on Acoustic Mode Structure in Dump Combustor,” Journal of Propulsion and
Power , Vol. 2, 1986, pp. 311–316.
[32] Candel, S., “Combustion Instabilities Coupled by Pressure Waves and Their
Active Control,” Twenty-Fourth Symposium (International) on Combustion,
The Combustion Institute, 1992, pp. 1277–1296.
[33] Kendrick, D., Zsak, T., and Zukoski, E., “An Experimental and Numerical
Investigation of Premixed Combustion in a Vortex in a Laboratory Dump Co-
mubstor,” Unsteady Combustion, 1996, pp. 33–69, F.Culick et al. (eds.) Kluwer
Academic Publishers.
[34] Sreenivasan, K. and Raghu, S., “The Control of Combustion Instability: A
Perspective,” Current Science, Vol. 79, No. 6, 2000, pp. 867–883.
[35] Chu, B., “On the Energy Transfer to Small Disturbances in Fluid Flow,” Acta
Mechanica, Vol. 1, 1965, pp. 215–234.
165

[36] Crocco, L., Grey, J., and Harrje, D., “Theory of Liquid Propellant Rocket Com-
bustion Instability and its Experimental Verification,” ARS Journal , Vol. 30,
1960, pp. 159–168.
[37] Crocco, L., “Theoretical Studies on Liquid Propellant Rocket Instability,”
Tenth Symposium (International) on Combustion, The Combustion Institute,
1965, pp. 1101–1128.
[38] Crocco, L., “Research on Combustion Instability in Liquid Propellant Rockets,”
Twelfth Symposium (International) on Combustion, The Combustion Institute,
1969, pp. 85–99.
[39] Summerfield, M., “A Theory of Unstable Combustion in Liquid Propellant
Rocket Systems,” ARS Journal , Vol. 21, No. 5, 1951, pp. 108–114.
[40] Gunder, D. and Friant, D., “Stability of Flow in a Rocket Motor,” Journal of
Applied Mechanics , Vol. 17, 1950, pp. 327–333.
[41] Yachter, M., “Discussion of the Paper by Gunder, D.F. and Friant, D.R.”
Journal of Applied Mechanics , Vol. 18, 1951, pp. 114–116.
[42] Crocco, L., “Aspects of Combustion Instability in Liquid Propellant Rockets,”
Journ. Amer. Rocket Soc., Vol. 21, 1951, Part I.
[43] Crocco, L., “Aspects of Combustion Instability in Liquid Propellant Rockets,”
Journ. Amer. Rocket Soc., Vol. 22, 1952, Part II.
166

[44] Berman, K. and Cheney, S., “Combustion Studies in Rockets Motors,” Journ.
Amer. Rocket Soc., Vol. 23, No. 2, 1953.
[45] Ellis, H., Odgers, I., Stosick, A., Van, D., and Wick, R., “Experimental In-
vestigation of Combustion Instability in Rocket Motors,” Fourth Symposium
(International) on Combustion, The Combustion Institute, 1953.
[46] Ellis, H., Liquid Propellant Rocket Combustion Research, Edwin G. Baetger, II
Colloquium, 1960, Princeton University, Feb 9.
[47] Male, T., Kerslake, W., and Tischler, A., “Photographic Study of Rotary
Screaming and Other Oscillations in a Rocket Engine,” 1954, NACA-RM-
E54A29.
[48] Maslen, S. and Moore, F., “On Strong Transverse Waves Without Shocks in a
Circular Cylinder,” Journ. Aero Sci., Vol. 23, No. 6, 1956, pp. 583–593.
[49] Osborn, J. and Bonnell, J., “On the Importance of Combustion of Combustion
Chamber Geometry in High Frequency Oscillations in Rocket Motors,” 1960,
ARS Semi-Annual Meeting, Los Angeles, California.
[50] Pickford, R. and Peoples, R., “The Inherent Stability of the Combustion Pro-
cesses,” 1960, ARS 15th Annual Meeting, Washington, D.C.
[51] Reardon, F., An Investigation of Transverse Mode Combustion Instability in
Liquid Propellant Rocket Motors , Ph.D. thesis, Princeton University, 1961.
167

[52] Barsotti, R., Datsko, S., Louison, R., Kovach, R., Miller, D., and Pulliam, W.,
“Development of Liquid Oxygen/Liquid Hydrogen Thrust Chamber for the M-1
Engine,” 1968, NASA-CR-54813.
[53] Culick, F. E. C., “Combustion Instabilities in Liquid-fueld Propulsion Systems:
an Overview,” AGARD NATO , 1988, Presented at AGARD Conf. Combust.
Instabil. Liquid-Fueled Prop. Syst., Seuille-Sur-Sine.
[54] Mitchell, C., “Analytical Models for Combustion Instability,” Liquid Rocket
Engine Combustion Instability, Progress in Astronautics and Aeronautics ,
Vol. 169, 1995, pp. 403–430, AIAA, Washintong DC.
[55] Barrere, M. and Williams, F., “Combustion Oscillations in Industrial Com-
bustion Chambers,” Twelfth Symposium (International) on Combustion, The
Combustion Institute, 1969, pp. 169–181.
[56] “Liquid Rocket Engine Combustion Stabilization Devices,” NASA SP-8113 ,
1974.
[57] Baer, M. and Mitchell, C., “Theoretical Evaluation of Rigid Baffles in Suppres-
sion of Combustion Instability,” AIAA Journal , Vol. 15, No. 2, 1977, pp. 212–
217.
[58] Mitchell, C., Howell, D., Dodd, F., and Acker, T., “User’s Manual for the Multi-
dimensional Baffle Model Computer Programs,” 1987, Mechanical Engineering
Report.
168

[59] J.M. Wicker, M. Y. and Yang, V., “Linear and Nonlinear Pressure Oscillations
in Baffled Combustion Chambers,” Journal of Sound and Vibration, Vol. 184,
1995, pp. 141–171.
[60] Male, T. and Kerslake, W., “A Method for Prevention of Screaming in Rocket
Engines,” 1954, NACA-RM-E54F28A.
[61] Harrje, D., Stinger, W., and Sirignano, W., “Flow Behavior with Acoustic
Liners,” 1967, ICRPG 4th Combustion Conference, Menlo Park, California.
[62] Laudien, E., Pongratz, R., Pierro, R., and Preclik, D., “Experimental Proce-
dures Aidding the Design of Acoustic Cavities,” Liquid Rocket Engine Com-
bustion Instability, Progress in Astronautics and Aeronautics , Vol. 169, 1995,
pp. 377–399, AIAA, Washintong DC.
[63] Wanhainen, J., Bloomer, H., Vincent, D., and Curley, J., “Experimental Inves-
tigation of Acoustic Liners to Suppress Screech in Hydrogen-Oxygen Rockets,”
1967, NASA-TN-D-3822.
[64] Sirignano, W., Crocco, L., and Harrje, D., “Acoustic Liner Studies,” No. 138,
1967, ICRPG 3rd Combustion Conference, CPIA Publication.
[65] Gysling, D., Copeland, G., McCormick, D., and Proscia, W., “Combustion
System Damping Augmentation with Helmholtz Resonators,” Journ. Eng. Gas
Turbines Power-Trans. ASME , Vol. 122, No. 2, 2000.
169

[66] Bellucci, V., Rohr, P., Paschereit, C., and Magni, F., “On the Use of Helmholtz
Resonators for Damping Acoustic Pulsations in Industrial Gas Turbines.”
Journ. Eng. Gas Turbines Power-Trans. ASME , Vol. 126, No. 2, 2004.
[67] Pandalai, R. and Mongia, H., “Combustion Instability Characteristics of In-
dustrial Engine Dry Low Emission Combustion System,” 1998, AIAA Paper
No. AIAA-1998-3379.
[68] Richards, G., Straub, D., and Robey, E., “Passive Control of Combustion Dy-
namics in Stationary Gas Turbines,” Journal of Propulsion and Power , Vol. 19,
No. 5, 2003, pp. 795–810.
[69] Tsien, H., “Servo-Stabilization of Combustion in Rocket Motors,” ARS Jour-
nal , Vol. 22, 1952, pp. 256–263.
[70] Marble, F. and Cox, D., “Servo-Stabilization of Low-Frequency OScillations in
a Liquid Bipropellant Rocket Motor,” ARS Journal , Vol. 23, 1953, pp. 63–74.
[71] Lee, Y., Gore, M., and Ross, C., “Stability and Control of Liquid Propellant
Rocket Systems,” ARS Journal , Vol. 23, 1953, pp. 75–81.
[72] Ffowcs-Williams, J., “Anti-Sound,” Proceedings of Royal Society of London,
Vol. A395, 1984, pp. 63–88.
[73] Dine, P., Active Control of Flame Noises , Ph.D. thesis, Cambridge University,
1983.
170

[74] Heckl, M., Heat Sources in Acoustic Resonators , Ph.D. thesis, Cambridge Uni-
versity, 1985.
[75] Heckl, M., “Active Control of the Noise form a Rijke Tube,” IUTAM Symposium
on Aero- and Hydro-Acoustics, Lyon 1985, Springer-Verlag , 1986, pp. 211–216.
[76] Bloxsidge, G., Dowling, A., Hooper, N., and Langhorne, P., “Active Control of
Reheat Buzz,” AIAA Paper No. AIAA-87-0433.
[77] Bloxsidge, G., Dowling, A., Hooper, N., and Langhorne, P., “Active Control
of an Acoustically Driven Combustion Instability,” Journal of Theoretical and
Applied Mechanics , Vol. 6, 1987, pp. 161–175.
[78] Lang, W., Poinsot, T., and Candel, S., “Active Control of Combustion Insta-
bility,” Combustion and Flame, Vol. 70, 1987, pp. 281–289.
[79] Poinsot, T., Bourienne, F., Candel, S., Esposito, E., and Lang, W., “Suppres-
sion of Combustion Instabilities by Active Control,” Journal of Propulsion and
Power , Vol. 5, 1987, pp. 14–20.
[80] Poinsot, T., Veynante, D., Bourienne, F., Candel, S., Esposito, E., and Sur-
get, J., “Initiation and Suppression of Combustion Instabilities by Active Con-
trol,” Proceedings of the 22nd Symposium (International) on Combustion, 1988,
pp. 1363–1370.
[81] Langhorne, P., Dowling, A., and Hooper, N., “Practical Active Control System
for Combustion Oscillations,” Journal of Propulsion and Power , Vol. 6, No. 3,
1990, pp. 324–333.
171

[82] Chu, Y., Dowling, A., and Glover, K., “Robust Control of Combustion Oscil-
lations,” Proc. 1998 IEEE, Int. Conf. Control Applications,Trieste, Italy.
[83] Moran, A., Steele, D., and Dowling, A., “Active Control and its Applications,”
2000, Presented at Proc. RTO AVT Symp. Active Control Tech. Enhanced
Performance Operational Capabilities Military Aircraft, Land Vehicles Sea Ve-
hicles, Braunschweig, Germany. Neuilly-Sur-Seine, France:RTO, NATO.
[84] Seume, J., Vortmeyer, N., Krause, W., Hermann, J., Hantschk, C., and Zangl,
P., “Application of Active Combustion Instability Control to a Heavy Duty Gas
Turbine,” J. Eng. Gas Turbines Power , Vol. 120, 1998, pp. 721–726.
[85] Hoffmann, S., Weber, G., Judith, H., Hermann, J., and Orthmann, A., “Appli-
cation of Active Combustion Control to Siemens Heavy Duty Gas Turbines,”
1998, Proc. RTO AVT Symp. Gas Turbine Engine Combust. Emiss. Altern.
Fuels, Lisbon, Portugal. Neuilly-Sur-Seine, France:RTO, NATO.
[86] Cohen, J., Rey, N., Jacobson, C., and Anderson, T., “Active Control of Com-
bustion Instability in a Liquid-Fueled Low-Nox Combustor,” J. Eng. Gas Tur-
bines Power , Vol. 121, 1999, pp. 281–284.
[87] Hibshman, J., Cohen, J., Banaszuk, A., Anderson, T., and Alholm, H., “Active
Control of Combustion Instability in Liquid-Fueled Sector Combustor,” 1999,
Presented at ASME-99-GT-215 Indianapolis. New York: ASME.
[88] Neumeier, Y. and Zinn, B., “Experimental Demonstration of Active Control of
Combustion Instabilities using Real Time Modes Observation and Secondary
172
Fuel Injection,” Twenty-sixth Symposium (International) on Combustion, The
Combustion Institute, 1996.
[89] Johnson, C., Neumeier, Y., Neumaier, M., Zinn, B., Darling, D., and Sattinger,
S., “Demonstration of Active Control of Combustion Instability on a Full-Scale
Gas Turbine Combustor,” 1999, Presented at ASME Turbo. Expo., 2001-GT-
0519 New Orleans, Louisiana. New York: ASME.
[90] Crocco, L., Grey, J., and Harrje, D., “Theory of Liquid Propellant Rocket
Combustion Instability and Its Experimental Investigations,” ARS Journal ,
Vol. 30, 1960, pp. 159–168.
[91] Sutton, G. P. and Biblarz, O., Rocket Propulsion Elements , A Wiley-
Interscience publication, seventh ed., 2000.
[92] Oefelein, J. and Yang, V., “Comprehensive Review of Liquid Propellant Com-
bustion Instabilities in F-1 Engines,” Journal of Propulsion and Power , Vol. 9,
No. 5, 1993, pp. 657–677.
[93] Docquier, N. and Candel, S., “Combustion Control and Sensors: A Review,”
Prog. Energy Combust. Sci., Vol. 28, 2002, pp. 107–150.
[94] Ghosh, A., The Role of Density Gradient in Liquid Rocket Engine Combustion
Instability , Ph.D. thesis, University of Maryland, 2008.
[95] Luke, E., A Rule-Based Specification System for Computational Fluid Dynam-
ics , Ph.D. thesis, Mississippi State University, 1999.
173


