
VPI - ENGR.98.166
Proposal # 98-0447-10
NAG-I-2001
Final Report
Active Control of Inlet Noise on the
JT15D Turbofan Engine
prepared by:
Jerome P. Smith
Florence V. Hutcheson
Ricardo A. Burdisso
Chris R. Fuller
Vibration and Acoustics Laboratories
Department of Mechanical Engineering
Virginia Polytechnic Institute & State University
Blacksburg, VA 24061-0238
for
NASA Langley Research CenterAeroacoustics Branch
Hampton, VA
Department of Mechanical Engineering
Virginia Polytechnic Institute & State University
Blacksburg, VA 24061-0238
January, 1999
https://ntrs.nasa.gov/search.jsp?R=19990111539 2018-05-07T04:50:33+00:00Z
ABSTRACT
This report presentsthe key results obtained by the Vibration and AcousticsLaboratoriesat Virginia Techover the year from November1997to December1998ontheActive NoiseControlof TurbofanEnginesresearchprojectfundedby NASA LangleyResearchCenter. The conceptof implementingactive noise control techniqueswithfuselage-mountederror sensorsis investigatedboth analyticallyandexperimentally.Theanalytical part of the project involves the continued developmentof an advancedmodelingtechniqueto providepredictionanddesignguidelinesfor applicationof activenoise control techniquesto large, realistic high bypassenginesof the type on whichactivecontrol methodsareexpectedto be applied. Resultsfrom the advancedanalyticalmodel are presentedthat show the effectivenessof the control strategies,and theanalytical resultspresentedfor fuselageerror sensorsshow good agreementwith theexperimentally observed results and provide additional insight into the controlphenomena.Additional analyticalresultsarepresentedfor activenoisecontrol usedinconjunctionwith a wavenumbersensingtechnique.Theexperimentalwork is carriedouton a running JT15D turbofanjet enginein a test standat Virginia Tech. The controlstrategyusedin thesetestswas thefeedforwardFiltered-X LMS algorithm. The controlinputs were suppliedby single and multiple circumferentialarraysof acousticsourcesequipped with neodymium iron cobalt magnetsmountedupstreamof the fan. Thereferencesignal was obtainedfrom an inlet mountededdy current probe. The errorsignals were obtained from a number of pressuretransducersflush-mounted in asimulatedfuselagesectionmountedin theenginetestcell. Theactivecontrol methodsareinvestigated when implemented with the control sources embedded within theacousticallyabsorptivematerialonapassively-linedinlet. The experimentalresultsshowthat the combinationof activecontrol techniqueswith fuselage-mountederror sensorsand passivecontrol techniquesis an effective meansof reducing radiatednoise fromturbofanengines.Strategicselectionof the locationof theerror transducersis showntobe effective for reducingthe radiation towardsparticulardirectionsin the farfield. Ananalytical model is usedto predict the behaviorof the control systemand to guide theexperimental design configurations,and the analytical results presentedshow goodagreementwith theexperimentallyobservedresults.
ii
1. INTRODUCTION
This report presentsthe key resultsof the researchperformedby the Virginia TechVibration and AcousticLaboratoriesover the year from November 1997to December1998on the JT15D turbofanengineproject fundedby NASA Langley ResearchCenter.Thepurposeof this researchis to investigatethepotentialof usingactivecontrol methodsin conjunctionwith fuselage-mountederror sensorsfor reducingthe noiseradiatedfrom aturbofanengine. The generalconceptis depictedin Figure 1.1,which showsa Boeing717 airplaneequippedwith active and passivecontrol componentson the inlet of theturbofanengine,andfar-field fuselage-mountederror transducersflush-mountedinto theside of the airplanefuselage. Circumferentialarraysof acousticsources,flush mountedin the inlet wall areusedto inject soundupstreamof the fan and generatethe acousticfield necessaryto cancelthetonenoiseradiatedat thefan bladepassingfrequency(BPF)and the associatedharmonics.Theseactive componentsareembeddedwithin the inletpassive liner material, which achievessome reduction of the broadbandnoise, andreducessome of the tonal noise radiated to the sidelinesof the engine. The errorinformation which guidesthe convergenceof the control systemis obtained from themicrophonesmountedon thefuselage. Virginia Tech has an operating JT15D turbofan
engine in a test cell at the Virginia Tech Airport, as well as the facilities to develop
control system components and analytical models investigating the potential of this
technique. These facilities provide a unique environment for the design and direct
implementation and evaluation of these methods in a very realistic setting. This is an
ongoing research project which has the following overall objectives:
1) To develop advanced modeling techniques for the design and optimization of an
active control system with application to larger high bypass engines. (F. Hutcheson,
R. Burdisso, and C. Fuller)
2) To experimentally demonstrate useful active control of turbofan inlet noise using
realistic sensors and actuators, and passive components on a running JT15D turbofan
engine. (J. Smith and R. Burdisso)
This report is organized with one section devoted to each of the two above aspects.
Section 2 presents the advanced analytical model with results of applying active control
to a larger high-bypass engine, using both fuselage-mounted error sensing techniques and
inlet wavenumber error sensors. Section 3 contains the experimental setup and the results
obtained for applying passive-active control to the JT15D turbofan engine. Section 4
contains a summary of the main conclusions and accomplishments.
2. ADVANCED MODELING OF ACTIVE CONTROL OF FAN NOISE FOR ULTRA
HIGH BYPASS TURBOFAN ENGINES
The models that are currently available to conduct active noise control studies of fan
noise for turbofan engines have some or all of the following limitations: they do not
accountfor the reflection from the duct openingsnor for the presenceof evanescentmodesin the duct; they do not includeradiationfrom the outlet and do not have liningcapabilities.Therefore,the first objectiveof this studywas to developa moreadvancedmodel of activenoisecontrol for turbofanengines,i.e., a model that doesnot havethelimitations mentionedpreviously.The secondobjective of this work was to use thatmodel to investigatethe performanceof activenoisecontrol in reducing fan noise forultra high bypassturbofan engines.Pure active control techniquesas well as hybridcontroltechniqueswerestudied.
2.1 Active noisecontrol model
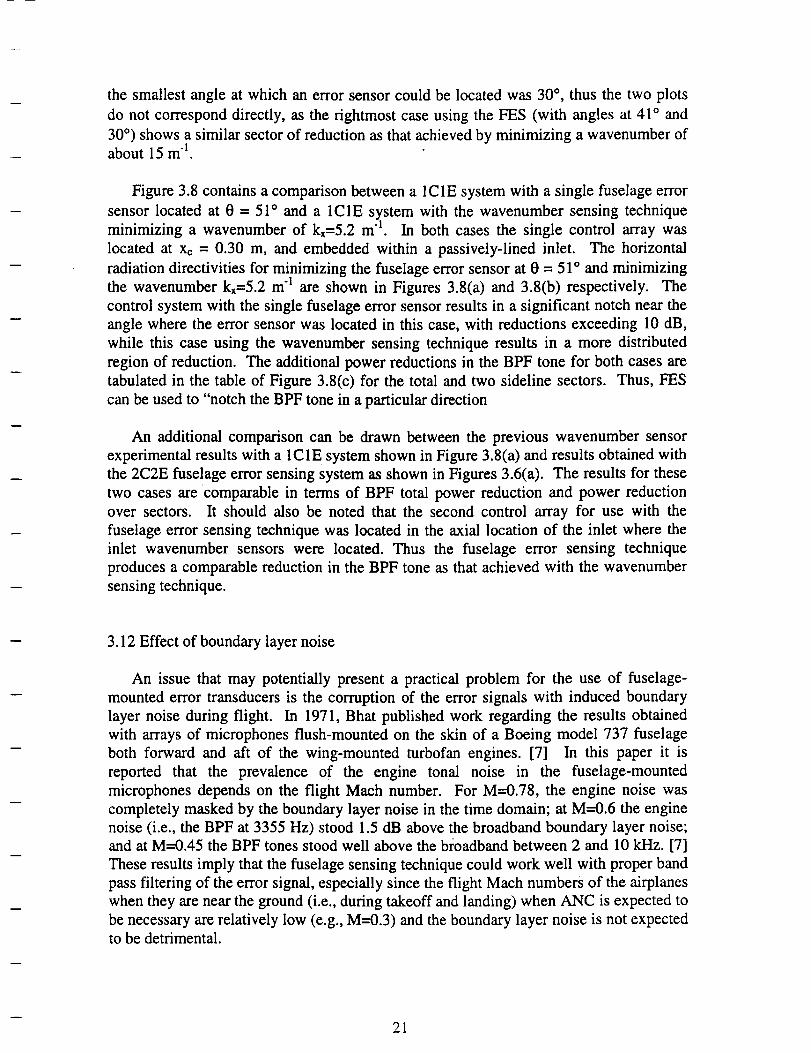
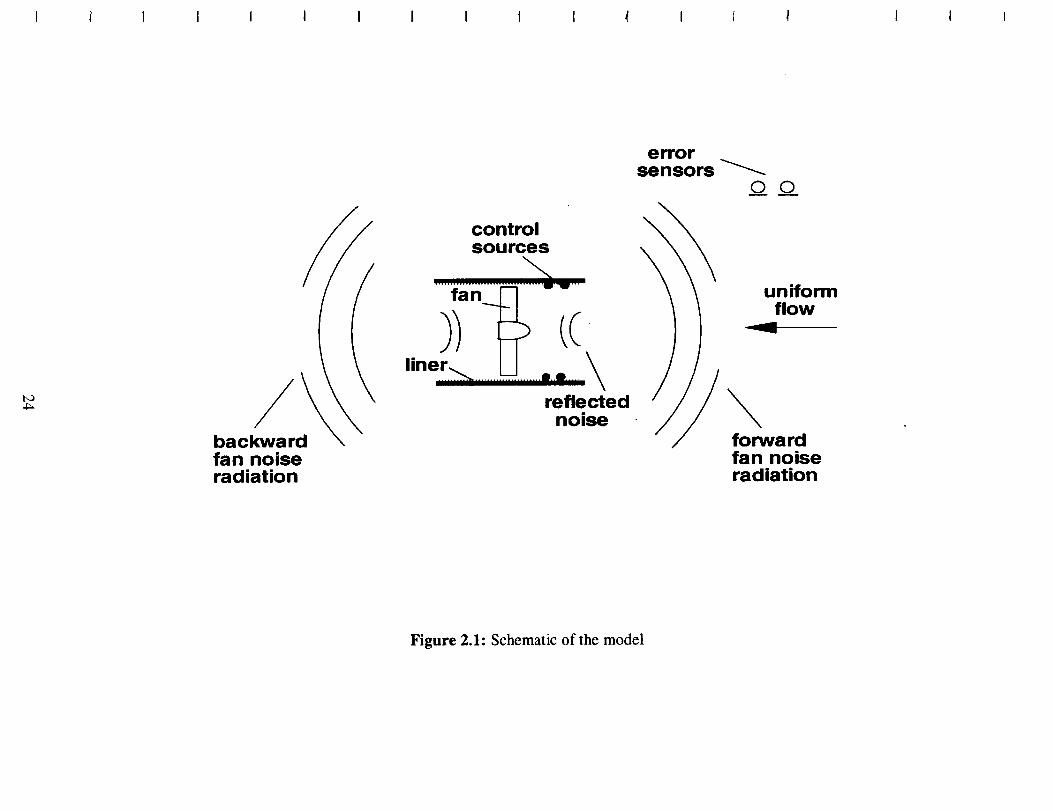
This modelwasdevelopedby implementingactivenoisecontrol to theduct fan noisepredictioncodeTBIEM3D that wasdevelopedby Dr. Dunn,Dr. FarassatandDr. Tweedat NASA LangleyResearchCenter.This model is basedon aboundaryintegral equationmethodandassumesthat all acousticprocessesarelinear, generatespinningmodesandoccur in a uniform flow field. A schematicof the model is shown in Figure 2.1. Weconsidereda ductof cylindrical profile andfinite lengthwith a rigid exterior wall and arigid or lined innerwall. The fan noisethat was initially generatedby a circumferentialarrayof spinningpoint dipolesisnow modeledby a circumferentialarrayof spinninglinesourceswith linearly distributedstrength.This ductedfan wasassumedto beplacedin auniform flow. Reflection from the duct openingswastaken into accountas well as thepresenceof the modesthat arecut off andaredecayingin the duct. Forward,aswell asbackward,externalacousticradiationwerecomputed.The control sourcesthat generatethesecondaryfield weremodeledby point monopolesplacedalongthe duct innerwall.
2.2 Active noisecontrol studyfor aultra highbypassturbofanengine
This modelwasusedto investigatethe potentialthat activenoisecontrol techniqueshavefor reducingfan noiseon alargeturbofanengine.Thus,acasewith a duct of radius1.5m and an inlet andoutlet lengtheachof 1.74m wasstudied.Thesedimensionsarerepresentativeof thoseassociatedwith an ultra high bypassturbofan engineprototypebeing developedby Pratt and Whitney. A BPF of 1000Hz, and a uniform flow Machnumber of 0.25, which is representativeof landing or take off conditions, wereconsidered. Since future engine designs might leave the fourth or fifth ordercircumferentialmodescut on, the generationof the fourth order circumferentialmodeswasalsoconsidered.
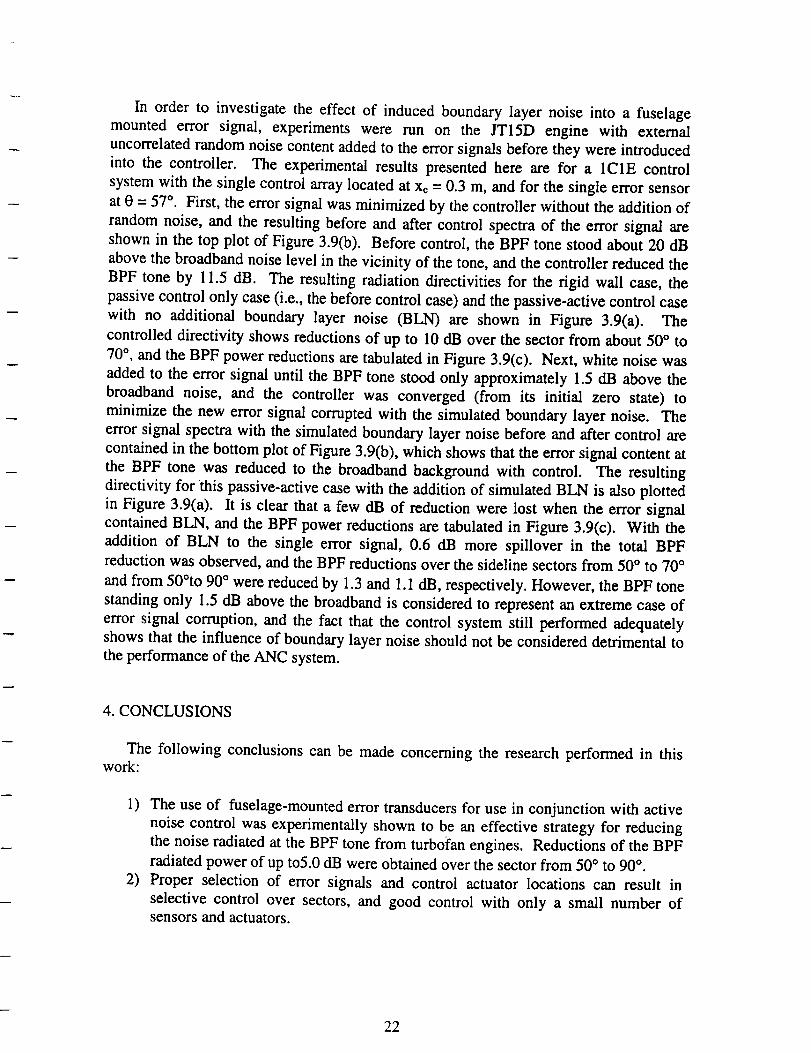
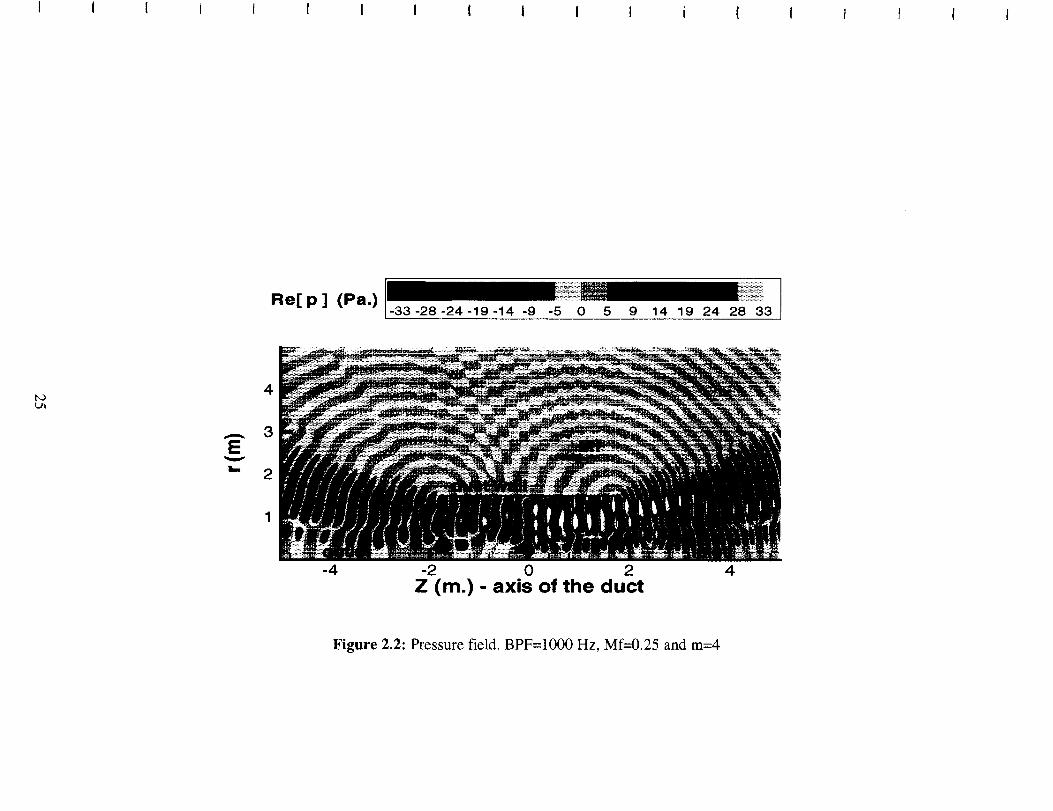
A plot of the resulting pressurefield in a plane containingthe axis of the duct ispresentedin Figure2.2.This plot is composedof 200by 200computationpointsandwascalculatedin approximately10minuteson a PC. Six fourth ordercircumferentialmodeswerecut onandpropagatedthroughthe inlet andoutlet of theduct. The cut-off ratiosofthefirst andlastmodesthatwerecut on (i.e., the(4,0)and(4,5)modes)are5.34and 1.26respectively.The goal wasthen to reducethe noisethat radiateswithin the 40° to 155°
2
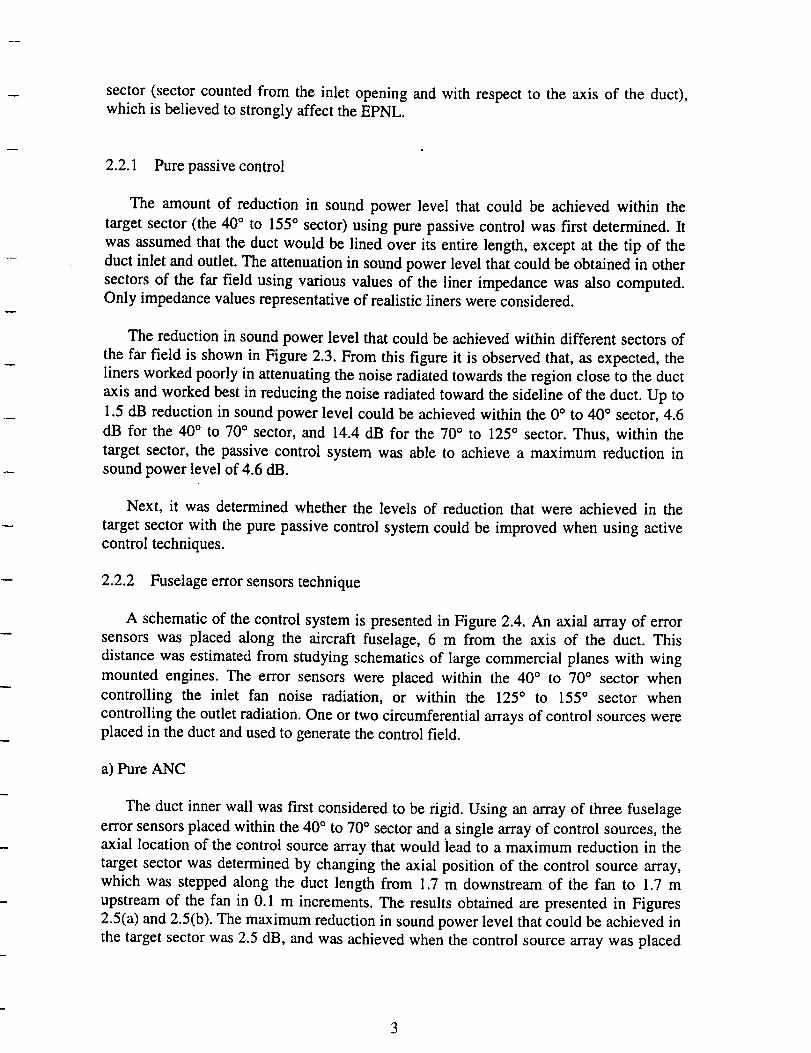
sector(sectorcountedfrom the inlet openingandwith respectto the axis of the duct),which is believedto stronglyaffect theEPNL.
2.2.1 Purepassivecontrol
The amount of reduction in soundpower level that could be achievedwithin thetargetsector(the 40° to 155 ° sector) using pure passive control was first determined. It
was assumed that the duct would be lined over its entire length, except at the tip of the
duct inlet and outlet. The attenuation in sound power level that could be obtained in other
sectors of the far field using various values of the liner impedance was also computed.Only impedance values representative of realistic liners were considered.
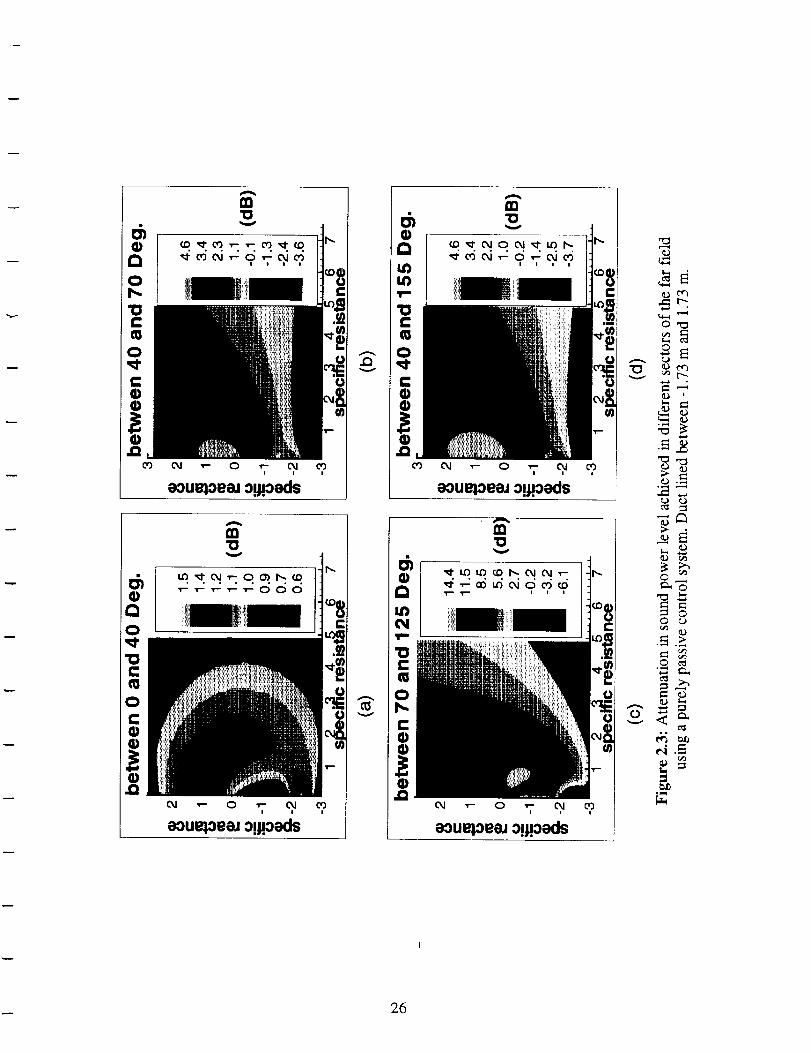
The reduction in sound power level that could be achieved within different sectors of
the far field is shown in Figure 2.3. From this figure it is observed that, as expected, the
liners worked poorly in attenuating the noise radiated towards the region close to the duct
axis and worked best in reducing the noise radiated toward the sideline of the duct. Up to
1.5 dB reduction in sound power level could be achieved within the 0 ° to 40 ° sector, 4.6
dB for the 40 ° to 70 ° sector, and 14.4 dB for the 70 ° to 125 ° sector. Thus, within the
target sector, the passive control system was able to achieve a maximum reduction in
sound power level of 4.6 dB.
Next, it was determined whether the levels of reduction that were achieved in the
target sector with the pure passive control system could be improved when using activecontrol techniques.
2.2.2 Fuselage error sensors technique
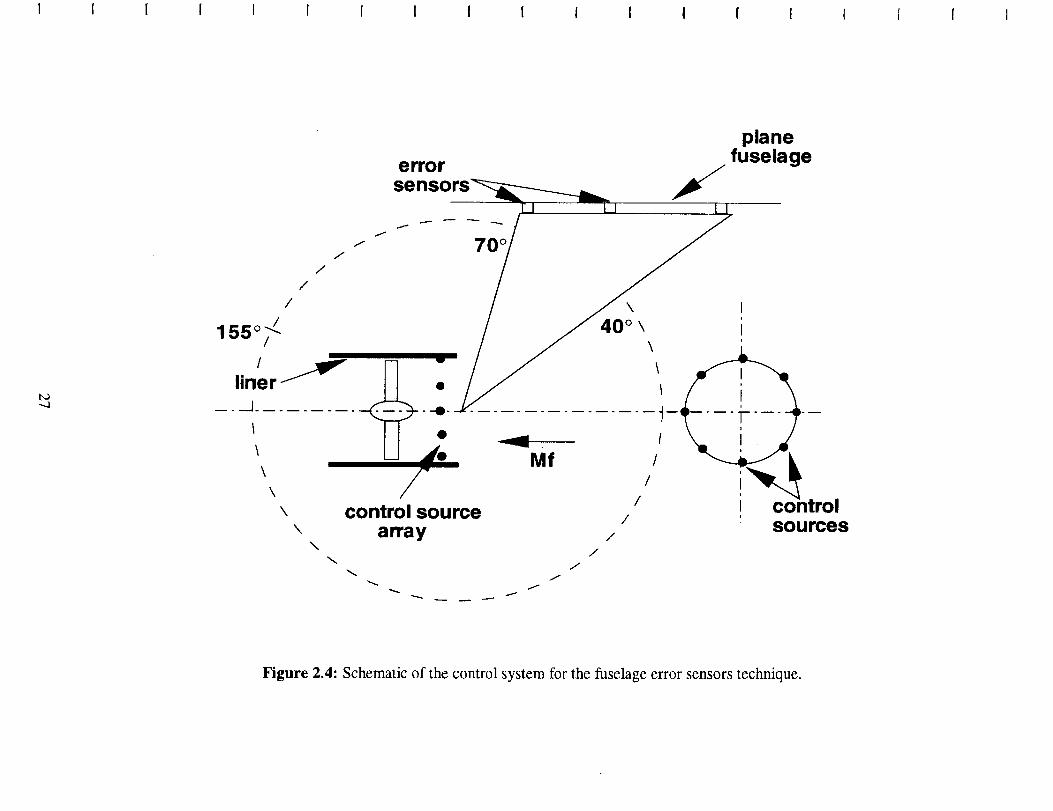
A schematic of the control system is presented in Figure 2.4. An axial array of error
sensors was placed along the aircraft fuselage, 6 m from the axis of the duct. This
distance was estimated from studying schematics of large commercial planes with wing
mounted engines. The error sensors were placed within the 40 ° to 70 ° sector when
controlling the inlet fan noise radiation, or within the 125 ° to 155 ° sector when
controlling the outlet radiation. One or two circumferential arrays of control sources were
placed in the duct and used to generate the control field.
a) Pure ANC
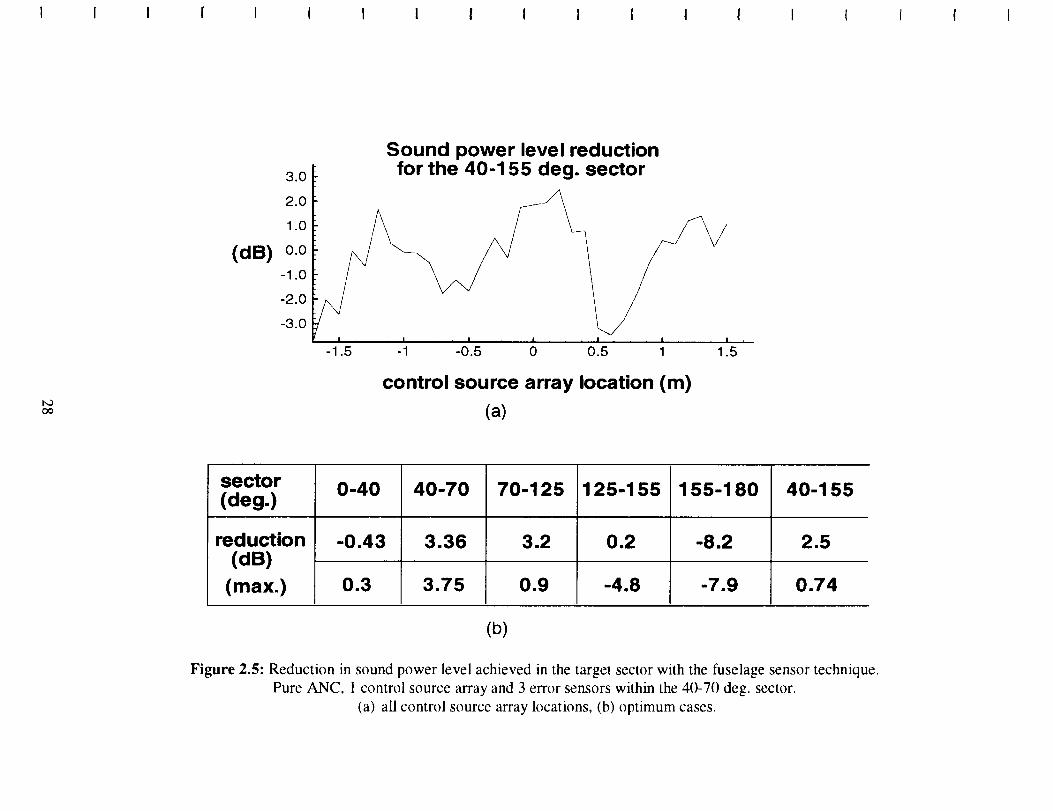
The duct inner wall was first considered to be rigid. Using an array of three fuselage
error sensors placed within the 40 ° to 70 ° sector and a single array of control sources, the
axial location of the control source array that would lead to a maximum reduction in the
target sector was determined by changing the axial position of the control source array,
which was stepped along the duct length from 1.7 m downstream of the fan to 1.7 m
upstream of the fan in 0.1 m increments. The results obtained are presented in Figures
2.5(a) and 2.5(b). The maximum reduction in sound power level that could be achieved in
the target sector was 2.5 dB, and was achieved when the control source array was placed
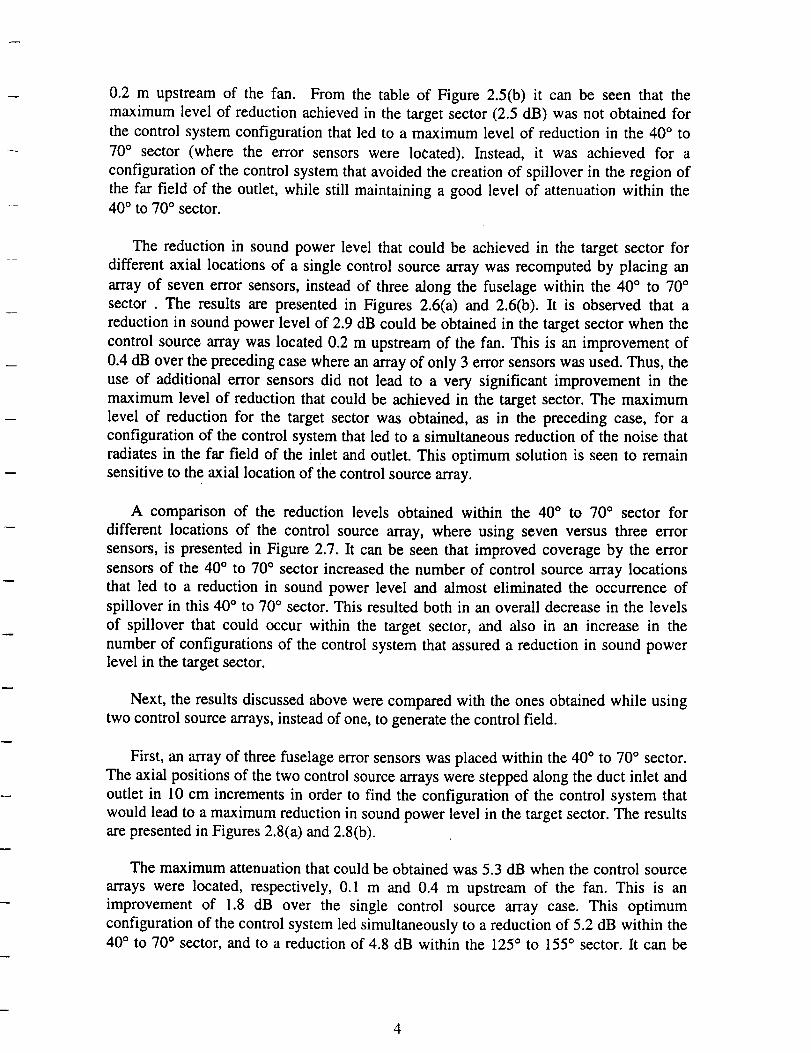
0.2 m upstream of the fan. From the table of Figure 2.5(b) it can be seen that the
maximum level of reduction achieved in the target sector (2.5 dB) was not obtained for
the control system configuration that led to a maximum level of reduction in the 40 ° to
70 ° sector (where the error sensors were located). Instead, it was achieved for a
configuration of the control system that avoided the creation of spillover in the region of
the far field of the outlet, while still maintaining a good level of attenuation within the40 ° to 70 ° sector.
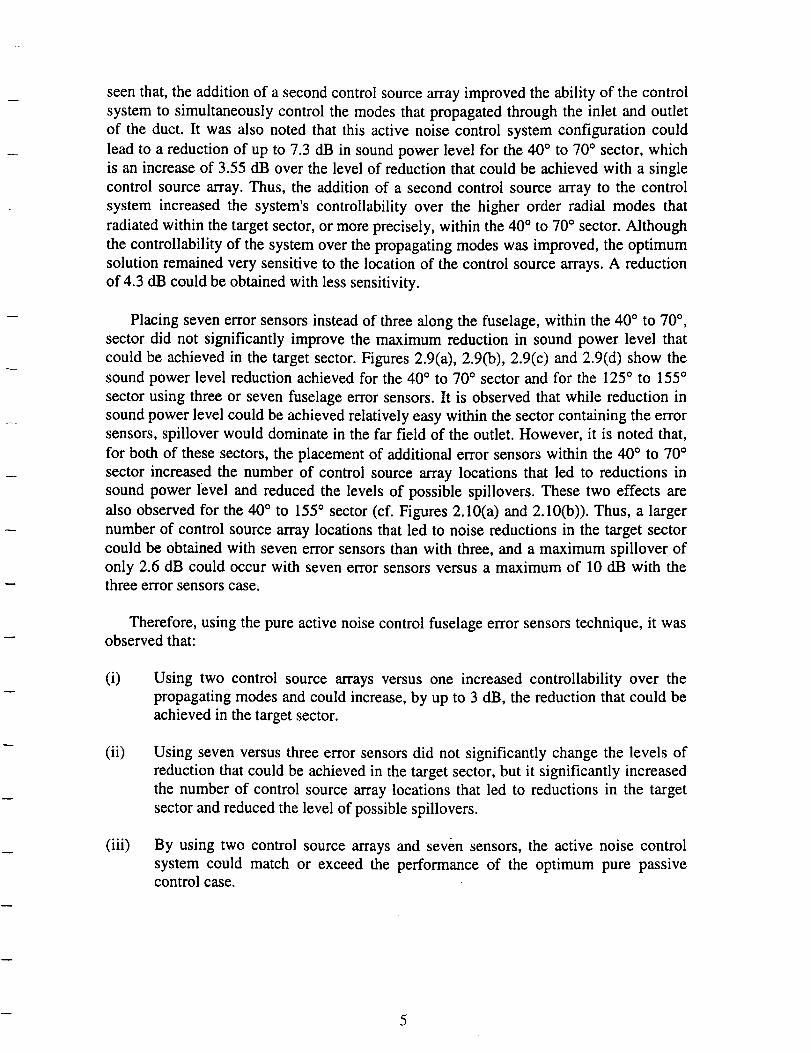
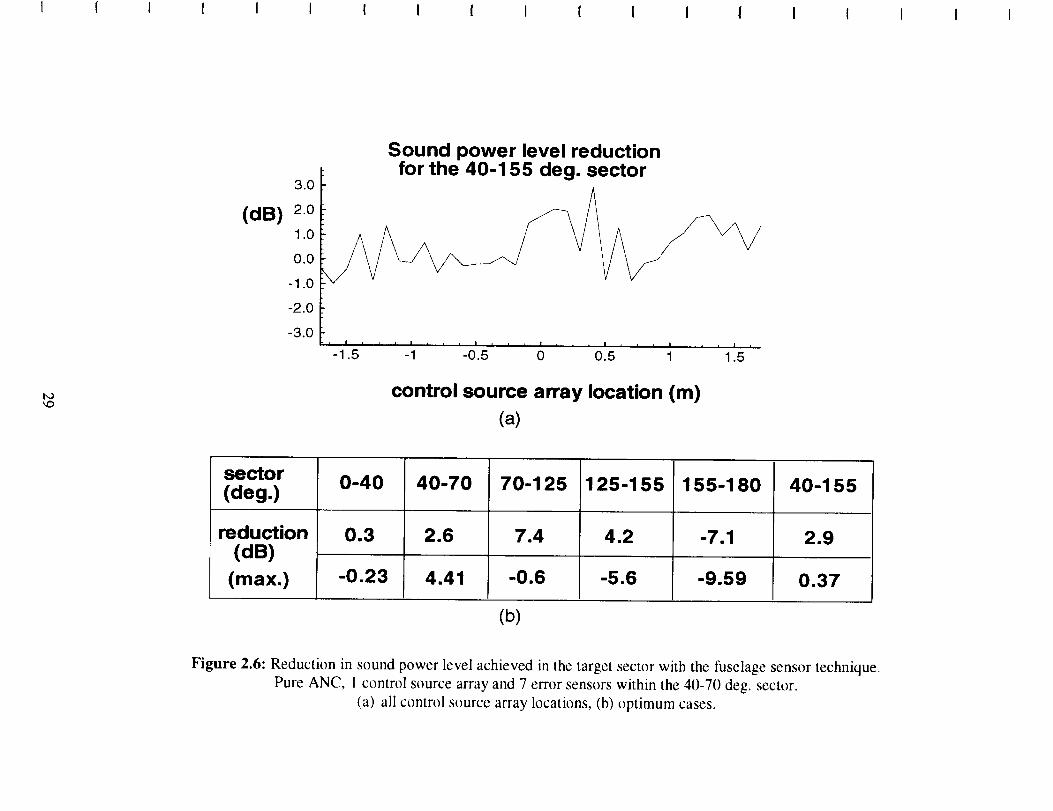
The reduction in sound power level that could be achieved in the target sector for
different axial locations of a single control source array was recomputed by placing an
array of seven error sensors, instead of three along the fuselage within the 40 ° to 70 °
sector . The results are presented in Figures 2.6(a) and 2.6(b). It is observed that a
reduction in sound power level of 2.9 dB could be obtained in the target sector when the
control source array was located 0.2 m upstream of the fan. This is an improvement of
0.4 dB over the preceding case where an array of only 3 error sensors was used. Thus, the
use of additional error sensors did not lead to a very significant improvement in the
maximum level of reduction that could be achieved in the target sector. The maximum
level of reduction for the target sector was obtained, as in the preceding case, for a
configuration of the control system that led to a simultaneous reduction of the noise that
radiates in the far field of the inlet and outlet. This optimum solution is seen to remain
sensitive to the axial location of the control source array.
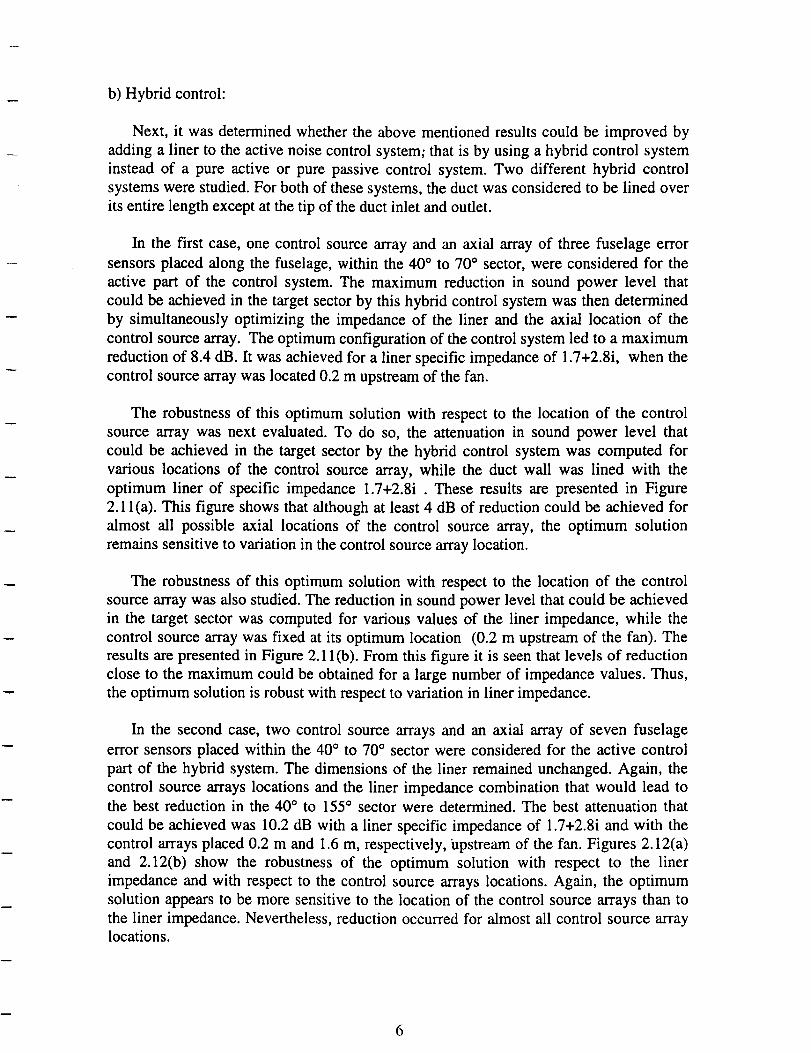
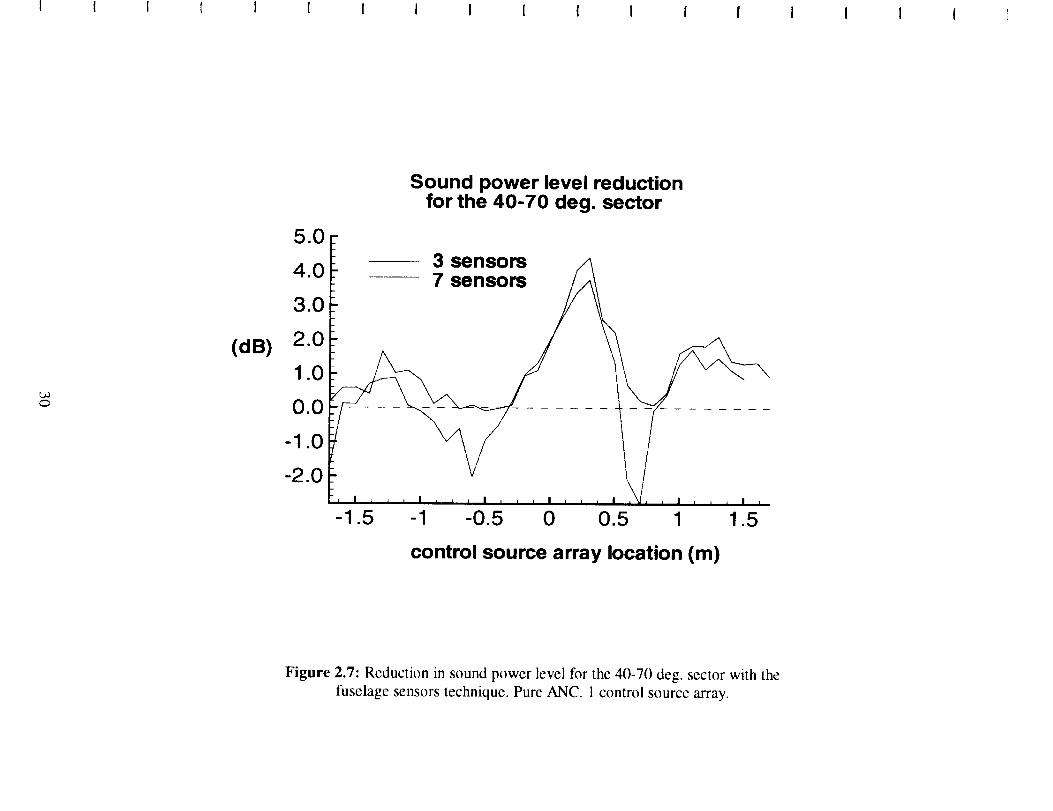
A comparison of the reduction levels obtained within the 40 ° to 70 ° sector for
different locations of the control source array, where using seven versus three error
sensors, is presented in Figure 2.7. It can be seen that improved coverage by the error
sensors of the 40 ° to 70 ° sector increased the number of control source array locations
that led to a reduction in sound power level and almost eliminated the occurrence of
spillover in this 40 ° to 70 ° sector. This resulted both in an overall decrease in the levels
of spillover that could occur within the target sector, and also in an increase in the
number of configurations of the control system that assured a reduction in sound power
level in the target sector.
Next, the results discussed above were compared with the ones obtained while using
two control source arrays, instead of one, to generate the control field.
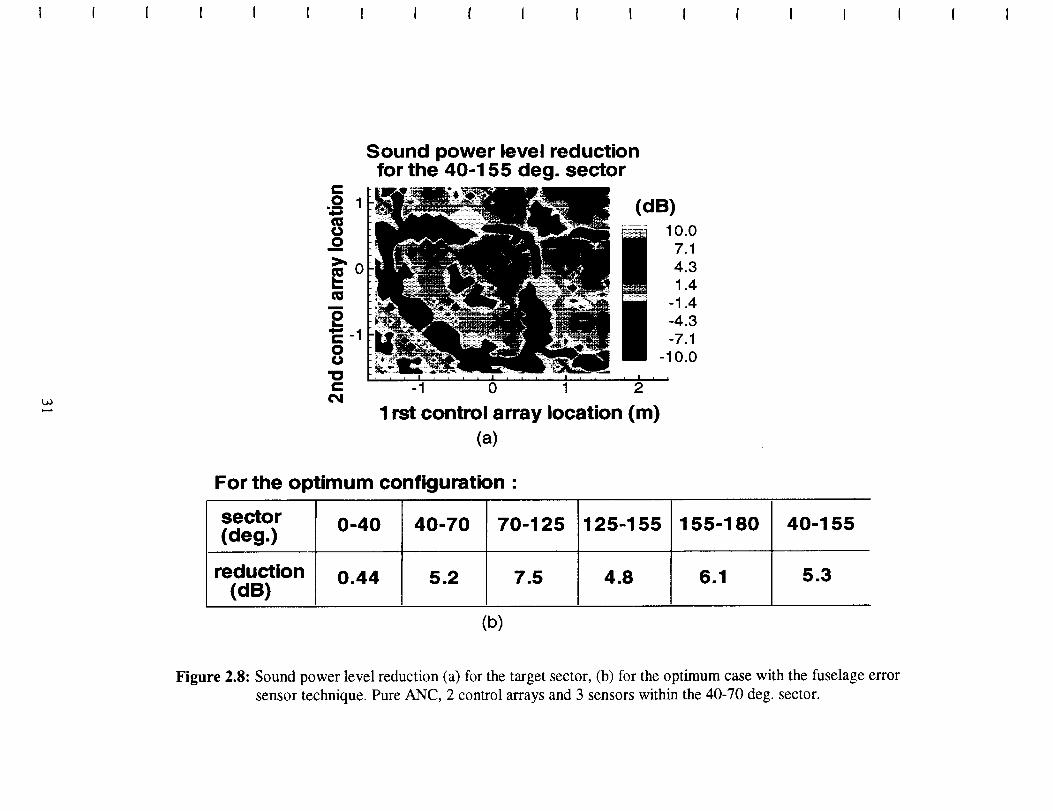
First, an array of three fuselage error sensors was placed within the 40 ° to 70 ° sector.
The axial positions of the two control source arrays were stepped along the duct inlet and
outlet in 10 cm increments in order to find the configuration of the control system that
would lead to a maximum reduction in sound power level in the target sector. The results
are presented in Figures 2.8(a) and 2.8(b).
The maximum attenuation that could be obtained was 5.3 dB when the control source
arrays were located, respectively, 0.1 m and 0.4 m upstream of the fan. This is an
improvement of 1.8 dB over the single control source array case. This optimum
configuration of the control system led simultaneously to a reduction of 5.2 dB within the
40 ° to 70 ° sector, and to a reduction of 4.8 dB within the 125 ° to 155 ° sector. It can be
4
seenthat,theaddition of a secondcontrol sourcearrayimprovedtheability of thecontrolsystemto simultaneouslycontrol themodesthat propagatedthroughthe inlet and outletof the duct. It was also noted that this activenoisecontrol systemconfigurationcouldleadto a reductionof up to 7.3 dB in soundpower level for the 40° to 70° sector,whichis an increaseof 3.55dB over the levelof reductionthat couldbe achievedwith a singlecontrol sourcearray.Thus, the additionof a secondcontrol sourcearray to the controlsystem increasedthe system'scontrollability over the higher order radial modes thatradiatedwithin thetargetsector,or moreprecisely,within the40° to 70° sector.Althoughthecontrollability of thesystemover thepropagatingmodeswasimproved,the optimumsolution remainedvery sensitiveto the locationof thecontrol sourcearrays.A reductionof 4.3dB couldbeobtainedwith lesssensitivity.
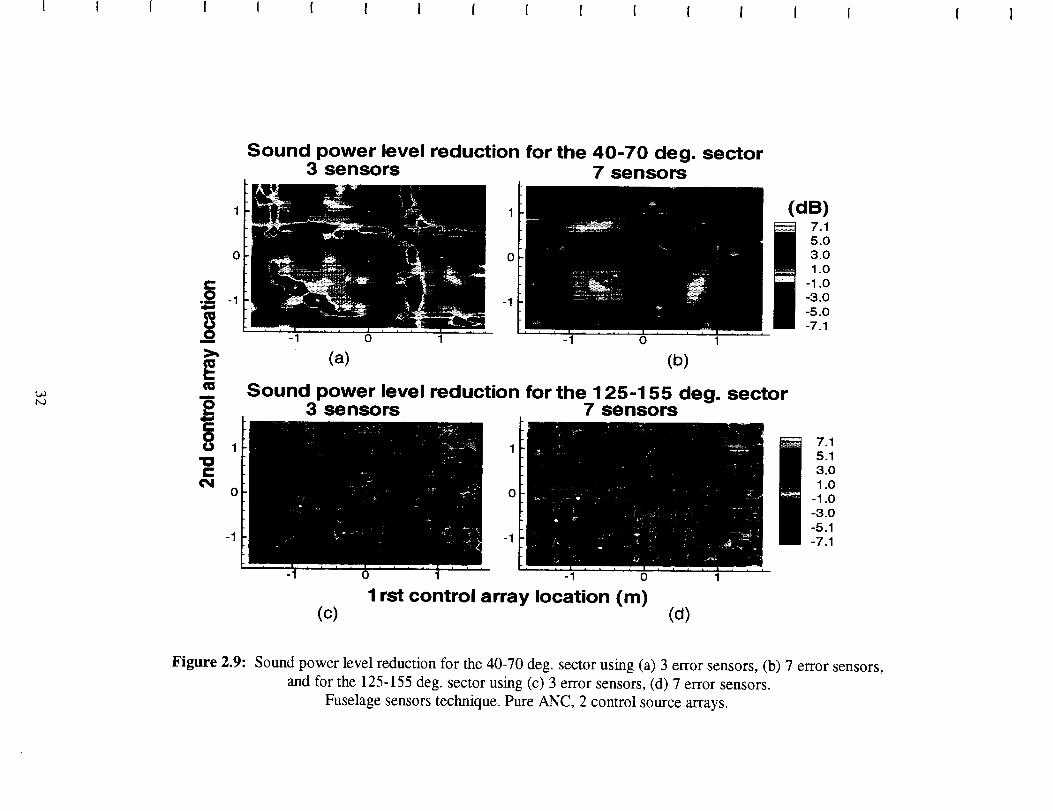
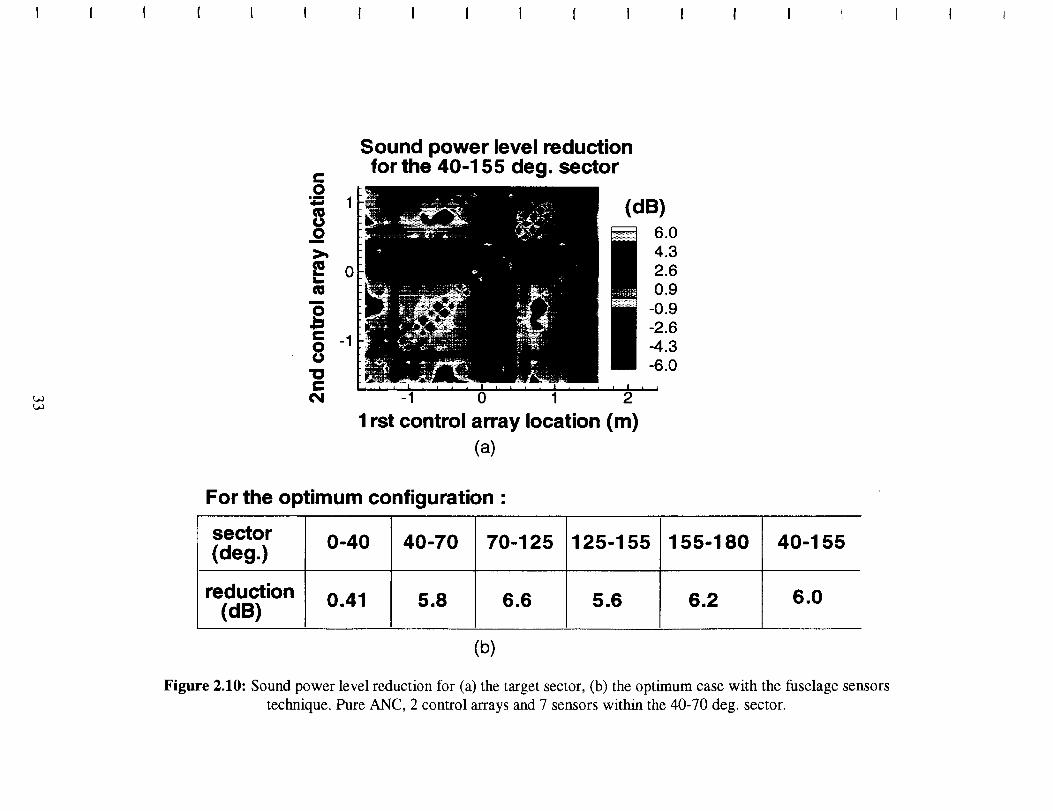
Placingsevenerror sensorsinsteadof threealongthe fuselage,within the40° to 70°,sectordid not significantly improve the maximumreduction in soundpower level thatcould be achievedin the targetsector.Figures2.9(a),2.9(b),2.9(c) and2.9(d) show thesoundpower level reductionachievedfor the40° to 70° sectorandfor the 125° to 155°sectorusing threeor sevenfuselageerror sensors.It is observedthat while reductioninsoundpower levelcould beachievedrelativelyeasywithin thesectorcontainingthe errorsensors,spillover would dominatein thefar field of theoutlet.However, it is notedthat,for both of thesesectors,theplacementof additionalerror sensorswithin the 40° to 70°sector increasedthe numberof control sourcearray locations that led to reductionsinsoundpower level and reducedthe levelsof possiblespillovers.Thesetwo effects arealsoobservedfor the40° to 155 ° sector (cf. Figures 2.10(a) and 2.10(b)). Thus, a larger
number of control source array locations that led to noise reductions in the target sector
could be obtained with seven error sensors than with three, and a maximum spillover of
only 2.6 dB could occur with seven error sensors versus a maximum of 10 dB with thethree error sensors case.
Therefore, using the pure active noise control fuselage error sensors technique, it wasobserved that:
(i) Using two control source arrays versus one increased controllability over the
propagating modes and could increase, by up to 3 dB, the reduction that could be
achieved in the target sector.
(ii) Using seven versus three error sensors did not significantly change the levels of
reduction that could be achieved in the target sector, but it significantly increased
the number of control source array locations that led to reductions in the target
sector and reduced the level of possible spillovers.
(iii) By using two control source arrays and seven sensors, the active noise control
system could match or exceed the performance of the optimum pure passivecontrol case.
5
b) Hybrid control:
Next, it wasdeterminedwhetherthe abovementionedresultscould be improvedbyaddinga liner to theactivenoisecontrol system;that is by usingahybrid control systeminsteadof a pure active or pure passivecontrol system.Two different hybrid controlsystemswerestudied.For bothof thesesystems,theductwasconsideredto be lined overits entire lengthexceptatthetip of theduct inlet andoutlet.
In the first case,one control sourcearray andan axial arrayof threefuselageerrorsensorsplacedalong the fuselage,within the40° to 70° sector,were consideredfor theactive part of the control system.The maximum reduction in soundpower level thatcould beachievedin the targetsectorby this hybrid control systemwasthendeterminedby simultaneouslyoptimizing the impedanceof the liner and the axial location of thecontrol sourcearray. Theoptimumconfigurationof thecontrol systemled to a maximumreductionof 8.4dB. It wasachievedfor a liner specificimpedanceof 1.7+2.8i, whenthecontrol sourcearraywaslocated0.2m upstreamof thefan.
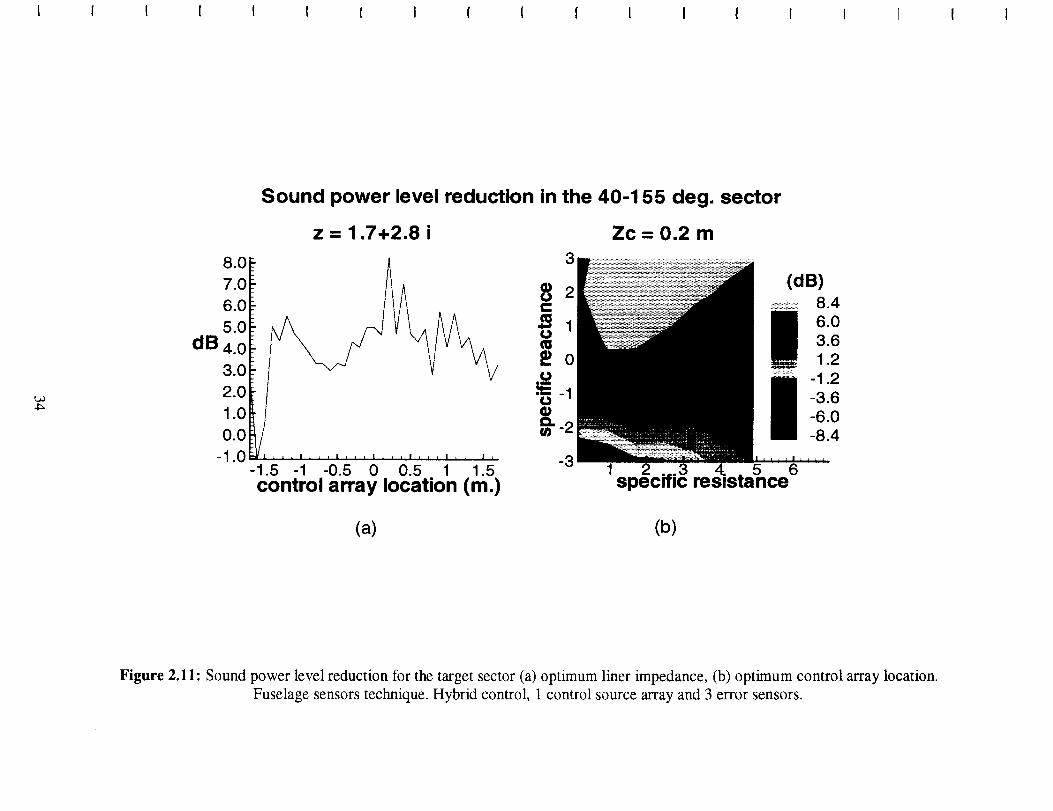
The robustnessof this optimum solutionwith respectto the location of the controlsourcearray wasnext evaluated.To do so, the attenuationin soundpower level thatcould be achievedin the targetsectorby the hybrid control systemwas computedforvarious locationsof the control sourcearray, while the duct wail was lined with theoptimum liner of specific impedance1.7+2.8i . These resultsare presentedin Figure2.11(a). This figure showsthat althoughat least4 dB of reductioncould be achievedforalmost all possible axial locationsof the control source array, the optimum solutionremainssensitiveto variationin thecontrolsourcearraylocation.
The robustnessof this optimum solution with respectto the location of the controlsourcearraywasalsostudied.The reductionin soundpower level that couldbe achievedin the targetsectorwascomputedfor variousvaluesof the liner impedance,while thecontrol sourcearraywasfixed at its optimum location (0.2 m upstreamof the fan). Theresultsarepresentedin Figure2.11(b). From this figure it is seenthat levelsof reductioncloseto the maximumcouldbe obtainedfor a largenumberof impedancevalues.Thus,theoptimum solutionis robustwith respectto variationin liner impedance.
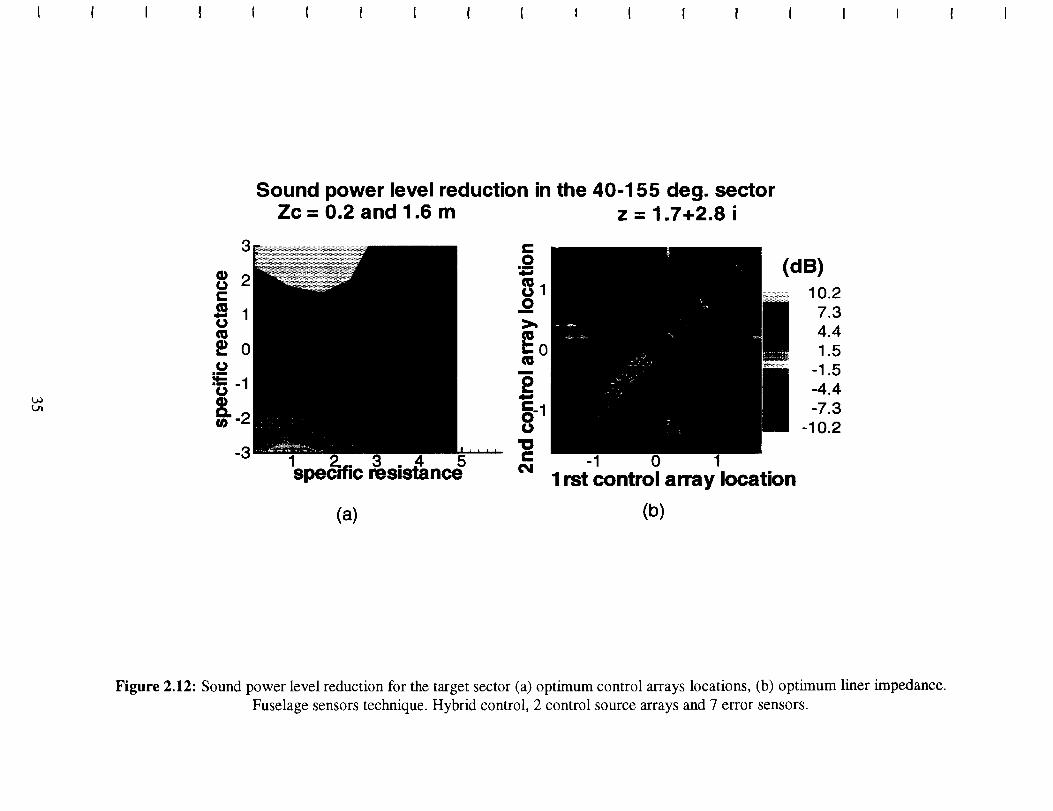
In the secondcase,two control sourcearraysand an axial arrayof sevenfuselageerror sensorsplacedwithin the 40° to 70° sectorwereconsideredfor the activecontrolpart of the hybrid system.The dimensionsof the liner remainedunchanged.Again, thecontrol sourcearrayslocationsandthe liner impedancecombinationthat would lead tothe best reductionin the 40° to 155° sectorweredetermined.The bestattenuationthatcould be achievedwas 10.2dB with a liner specificimpedanceof 1.7+2.8iand with thecontrol arraysplaced0.2 m and 1.6m, respectively,Upstreamof the fan. Figures2.12(a)and 2.12(b) show the robustnessof the optimum solution with respect to the linerimpedanceand with respectto the control sourcearrayslocations.Again, the optimumsolutionappearsto bemoresensitiveto the locationof the control sourcearraysthan tothe liner impedance.Nevertheless,reductionoccurredfor almostall control sourcearraylocations.
Thus,usingthis hybrid controltechnique,it wasobservedthat:
(i) The hybrid systemincreasedthe reductionin soundpower level by 6 dB in thetargetsectoroverthepureactiveor passivenoisecontrol systems.
(ii) The presenceof the liner greatly increasedthe numberof control sourcearraylocationsfor which reductionoccurredin thetargetsector.
(iii) The optimum solution wasvery robustwith respectto the liner impedanceandlesswith respectto thecontrolsourcearraylocation.
c) Controlof inlet andoutletradiation
Placingthe fuselageerror sensorsin thefar field of the inlet insureda goodreductionin that regionof thefar field; however,it alsoled to considerablespillover in the far fieldof the outlet, hinderingthe level of noisereductionand the robustnessof the optimumsolution.
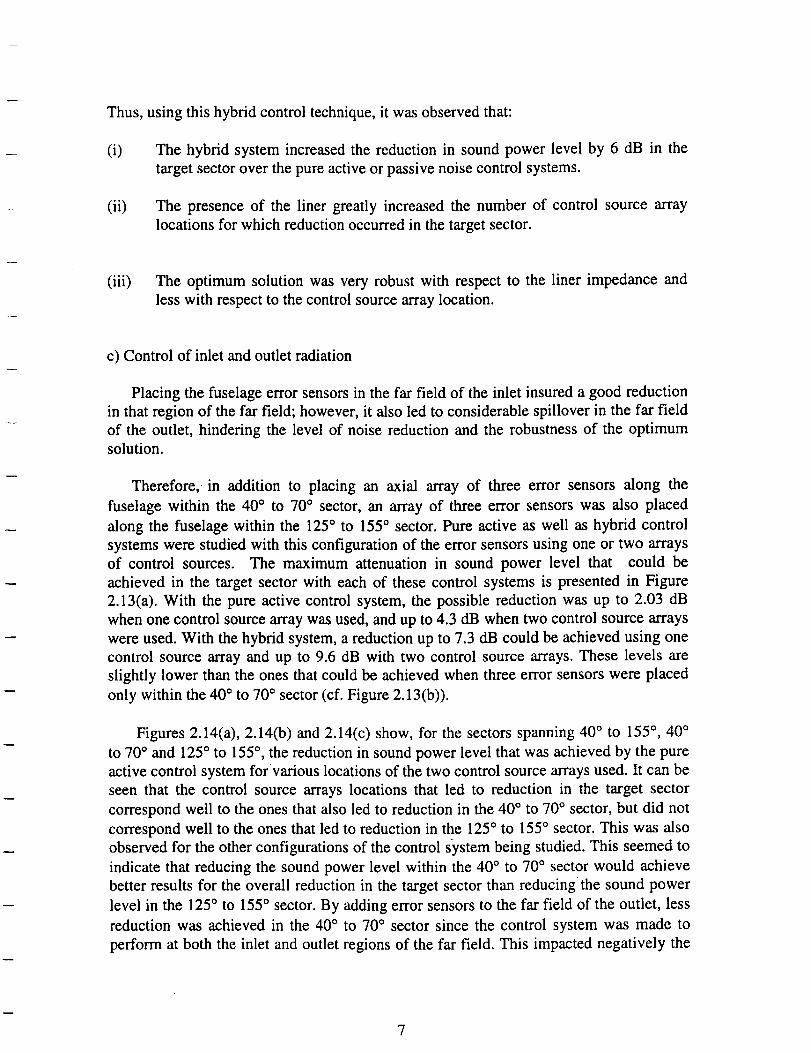
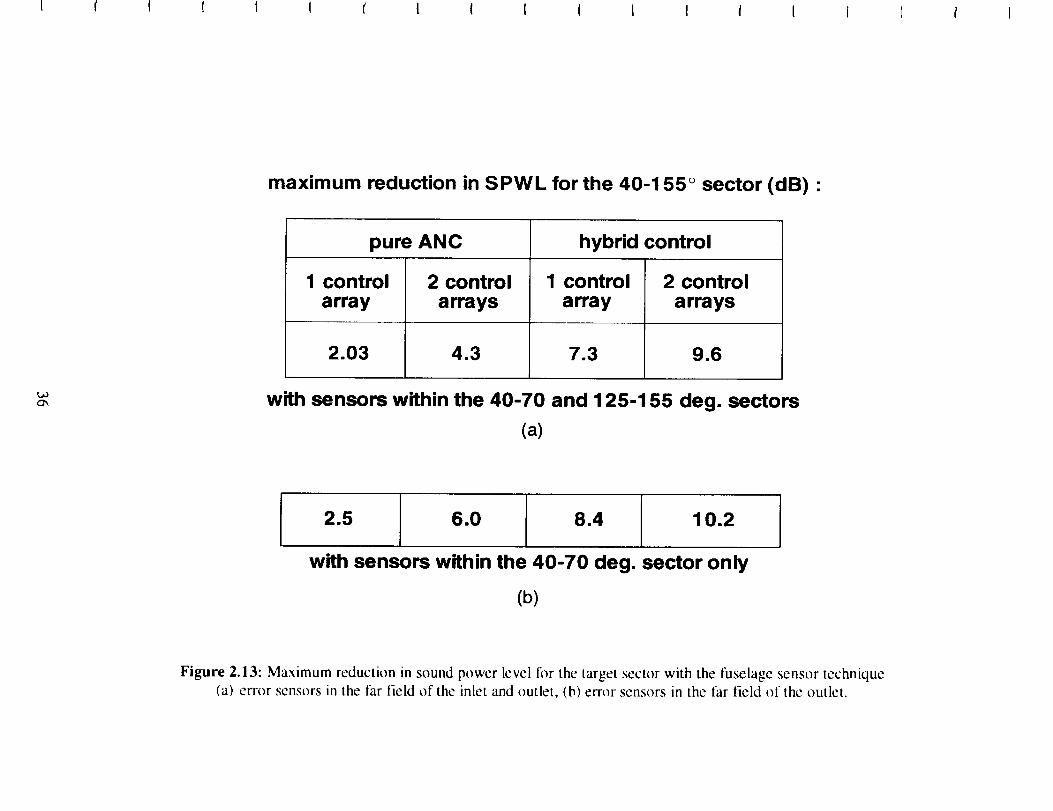
Therefore,. in addition to placing an axial array of three error sensorsalong thefuselagewithin the 40° to 70° sector,an array of threeerror sensorswas also placedalong the fuselagewithin the 125° to 155° sector.Pureactiveaswell ashybrid controlsystemswerestudiedwith this configurationof theerror sensorsusingoneor two arraysof control sources. The maximum attenuationin sound power level that could beachievedin the targetsectorwith eachof thesecontrol systemsis presentedin Figure2.13(a).With the pure activecontrol system,the possiblereductionwasup to 2.03 dBwhenonecontrolsourcearraywasused,andup to 4.3 dB whentwo controlsourcearrayswereused.With thehybrid system,areductionup to 7.3dB couldbeachievedusingonecontrol sourcearrayand up to 9.6 dB with two control sourcearrays.Theselevels areslightly lower thanthe onesthatcouldbeachievedwhenthreeerror sensorswere placedonly within the40° to 70° sector(cf. Figure2.13(b)).
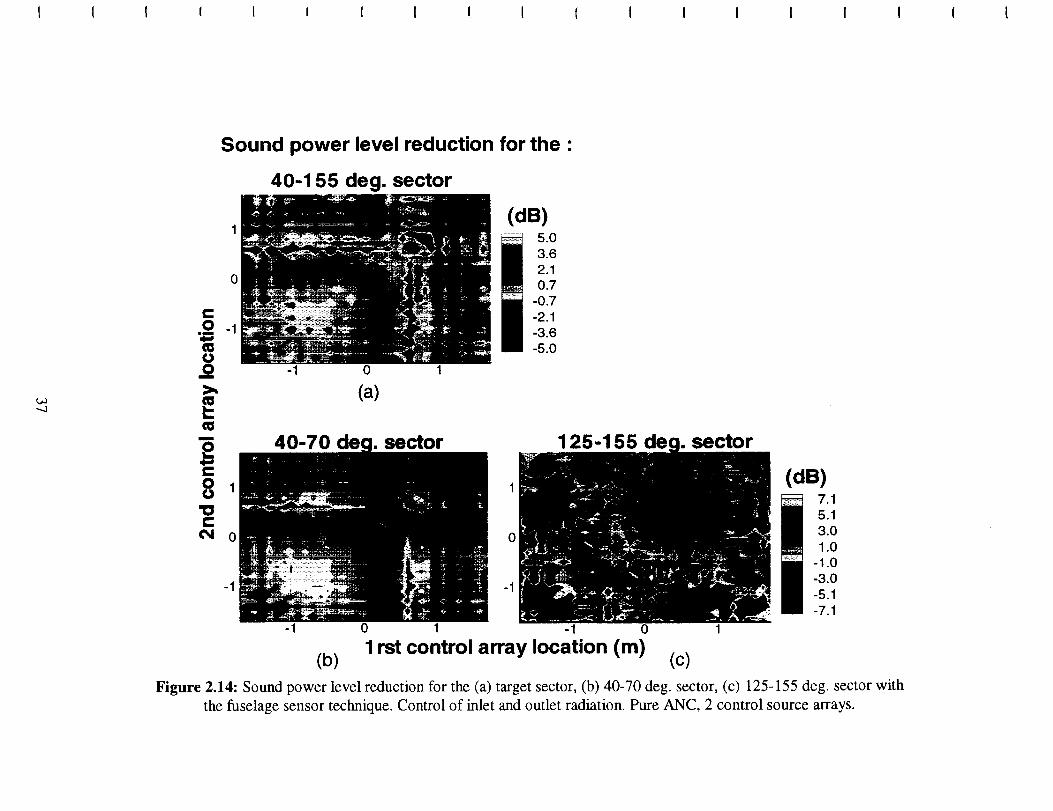
Figures2.14(a),2.14(b)and2.14(c)show, for the sectorsspanning40° to 155 °, 40 °
to 70 ° and 125 ° to 155 °, the reduction in sound power level that was achieved by the pure
active control system for various locations of the two control source arrays used. It can be
seen that the control source arrays locations that led to reduction in the target sector
correspond well to the ones that also led to reduction in the 40 ° to 70 ° sector, but did not
correspond well to the ones that led to reduction in the 125 ° to 155 ° sector. This was also
observed for the other configurations of the control system being studied. This seemed to
indicate that reducing the sound power level within the 40 ° to 70 ° sector would achieve
better results for the overall reduction in the target sector than reducing the sound power
level in the 125 ° to 155 ° sector. By adding error sensors to the far field of the outlet, less
reduction was achieved in the 40 ° to 70 ° sector since the control system was made to
perform at both the inlet and outlet regions of the far field. This impacted negatively the

maximumlevel of overall reductionfor thetargetsector,althoughbetterreduction (or atleastlessspillover) wasobtainedin the 125° to 155° sectorasa result of the outlet farfield error sensors.
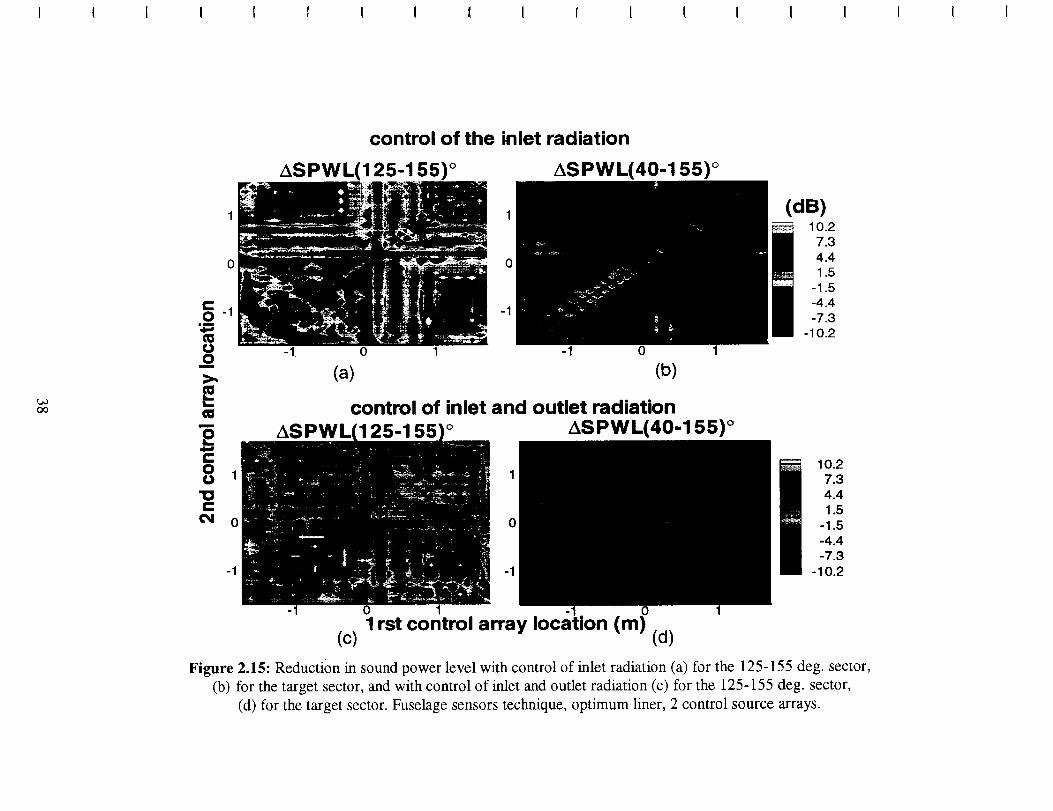
The addition of error sensorsto the far field of the outlet did not increase themaximum levelof reductionfor the targetsector,but it did improvethe robustnessof theoptimum solutionby increasingthe numberof control sourcearraylocationsthat led to areduction in the targetsector.Although this wasverified for eachof the systemsbeingstudied,only one will be discussed.For eachof the two hybrid control systemsunderconsideration,the impedanceof the liner was fixed to its optimum value. That is, thevaluethat led eachof thesesystemsto achievetheir maximumlevel of reductionin thetargetsector.Figures2.15(a)and2.15(b) show the reductionin soundpower level thatcould beachievedin the 125° to 155° and40° to 155° sectorsby usinganhybrid controlsystemwith threeerror sensorsplaced in the far field of the inlet and outlet and twocontrol sourcearrays.Theseresultswere comparedwith the onesthat were achievedbythehybrid controlsystemwhenthreeerror sensorswereplacedin thefar field of the inletonly (cf. Figures2.15(c)and2.15(d)).Thesereductionlevelswerecomputedasfunctionsof the locationof thecontrolsourcearrays.
Therefore,by adding fuselageerror sensorsto the far field of the outlet, it wasobservedthat:
(i) It increasedthe numberof locationsof the control source arrays that led toreductionin soundpowerlevel in thetargetsector.
(ii) It reducedthelevelof possiblespillover.
(iii) It decreasedthepeakvalueof soundpower level reduction( this might not be thecasefor anannularduct).
2.2.3 Wavenumbererror sensorstechnique
With this technique,insteadof minimizing thepressureat error sensorsplaced in thefar field of the duct inlet or outlet,certaincomponentsof thewavenumberspectrumareminimizedin anattemptto reducetheacousticradiationtowardsspecificdirectionsin thefar field. The basicideais that by minimizing a specificwavenumbercomponentof thespectrum,the mode that propagatesin the duct with that specific axial wavenumberwould be indirectly targeted,and thereforenoisereductionwould be achieved in theregionof the far field wherethat modewouldhavebeenradiated.Thus,by targetingthelower wavenumbercomponentsone shouldexpectto attenuatethe radiation toward thesidelineof the duct, while minimizing the higherwavenumbersshould reducethe noiseradiated towardtheductaxis.
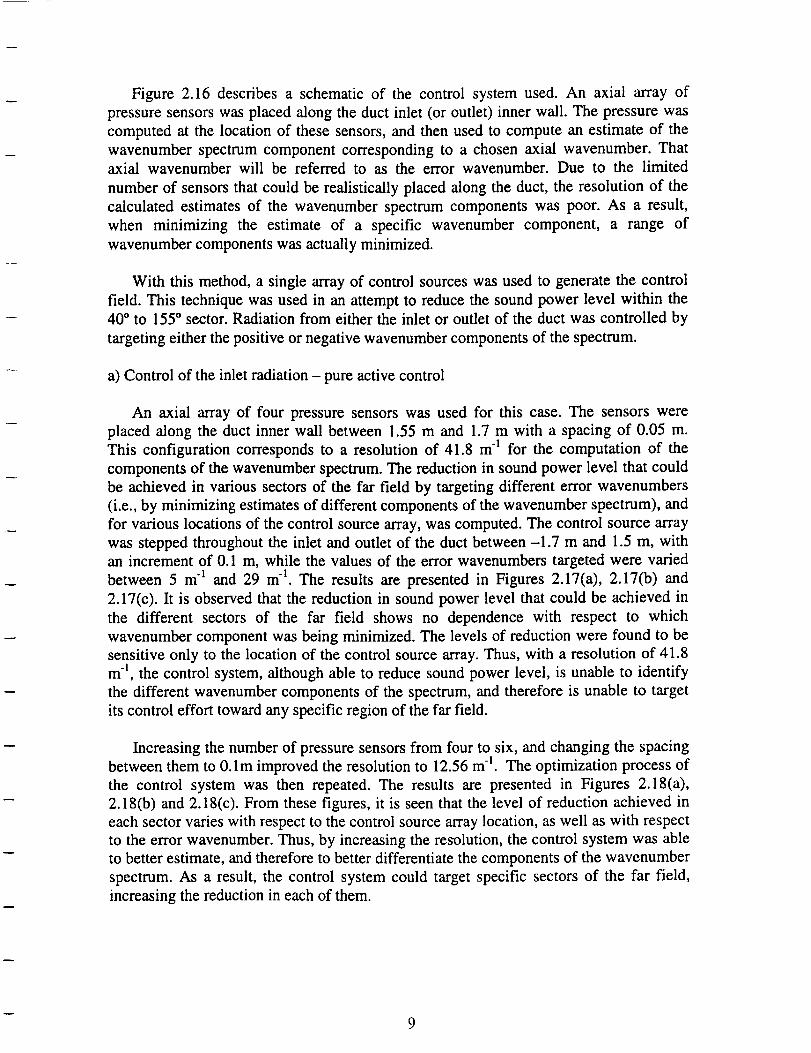
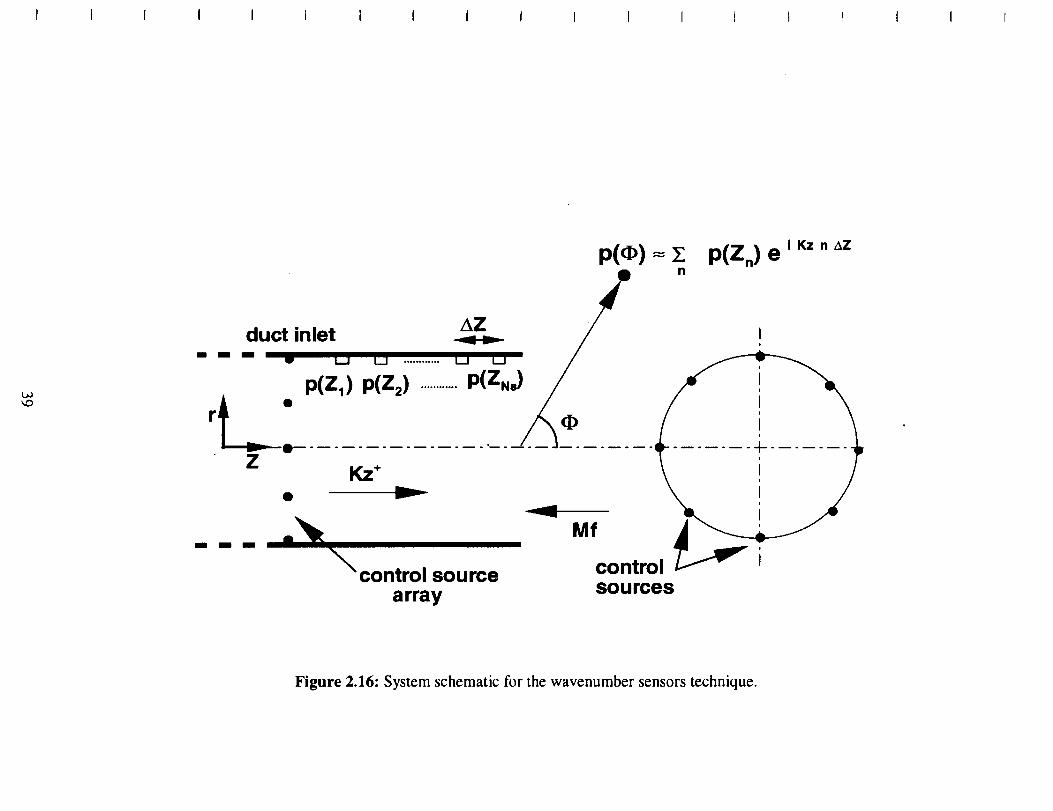
Figure 2.16 describesa schematicof the control systemused.An axial array ofpressuresensorswasplacedalongthe duct inlet (or outlet) inner wall. The pressurewascomputedat the locationof thesesensors,andthenusedto computean estimateof thewavenumberspectrumcomponentcorrespondingto a chosenaxial wavenumber.Thataxial wavenumberwill be referred to as the error wavenumber.Due to the limitednumberof sensorsthat couldbe realisticallyplacedalong theduct, the resolutionof thecalculatedestimatesof the wavenumberspectrumcomponentswas poor. As a result,when minimizing the estimate of a specific wavenumbercomponent, a range ofwavenumbercomponentswasactuallyminimized.
With this method,a singlearrayof control sourceswasusedto generatethe controlfield. This techniquewasusedin anattemptto reducethe soundpower level within the40° to 155 ° sector. Radiation from either the inlet or outlet of the duct was controlled by
targeting either the positive or negative wavenumber components of the spectrum.
a) Control of the inlet radiation - pure active control
An axial array of four pressure sensors was used for this case. The sensors were
placed along the duct inner wall between 1.55 m and 1.7 m with a spacing of 0.05 m.
This configuration corresponds to a resolution of 41.8 m 1 for the computation of the
components of the wavenumber spectrum. The reduction in sound power level that could
be achieved in various sectors of the far field by targeting different error wavenumbers
(i.e., by minimizing estimates of different components of the wavenumber spectrum), and
for various locations of the control source array, was computed. The control source array
was stepped throughout the inlet and outlet of the duct between -1.7 m and 1.5 m, with
an increment of 0.1 m, while the values of the error wavenumbers targeted were varied
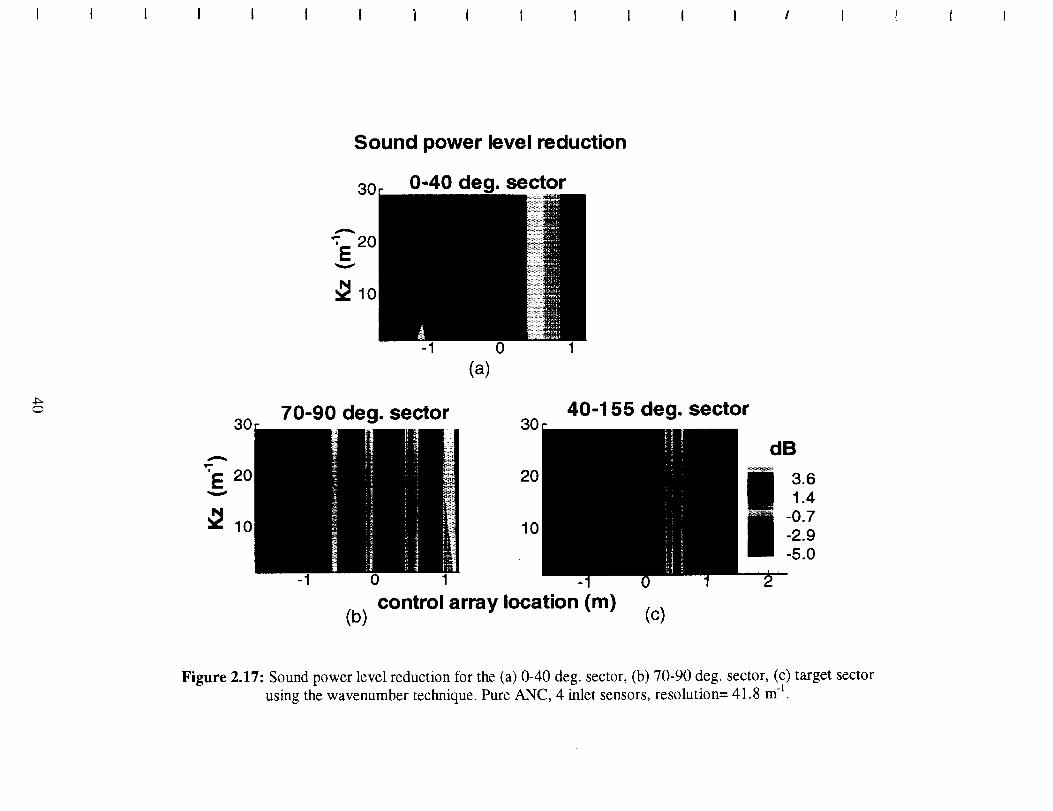
between 5 m "1 and 29 m 1. The results are presented in Figures 2.17(a), 2.17(b) and
2.17(c). It is observed that the reduction in sound power level that could be achieved in
the different sectors of the far field shows no dependence with respect to which
wavenumber component was being minimized. The levels of reduction were found to be
sensitive only to the location of the control source array. Thus, with a resolution of 41.8
m l, the control system, although able to reduce sound power level, is unable to identify
the different wavenumber components of the spectrum, and therefore is unable to target
its control effort toward any specific region of the far field.
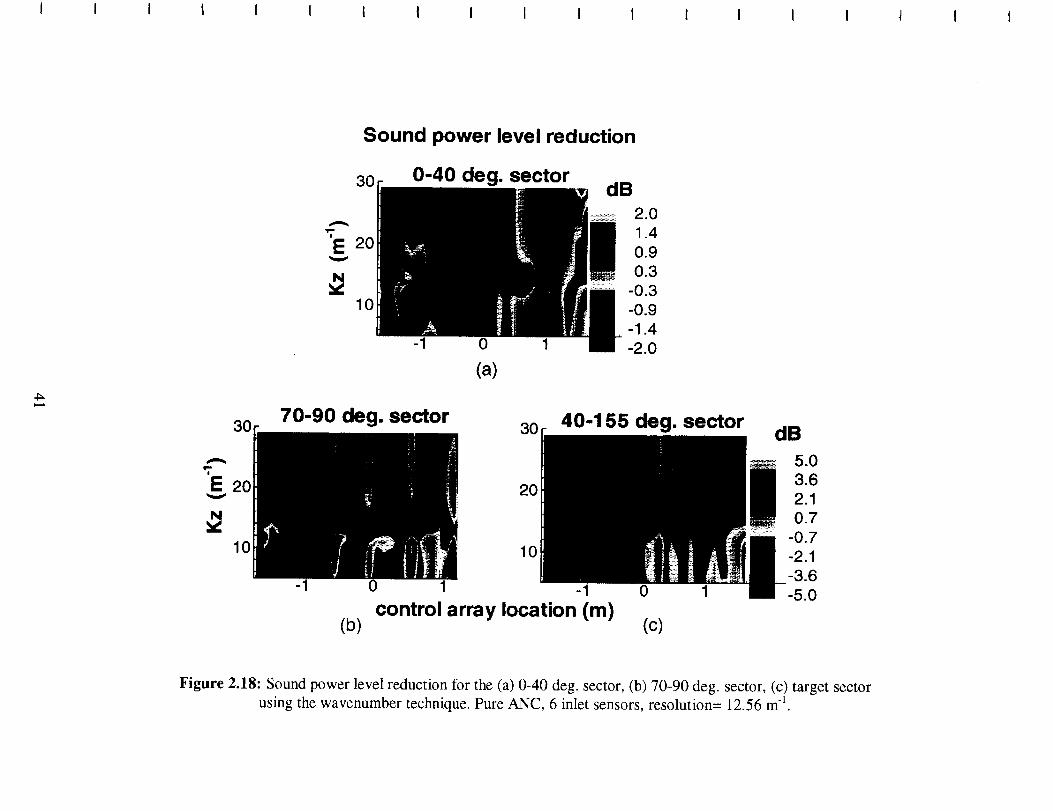
Increasing the number of pressure sensors from four to six, and changing the spacing
between them to 0. lm improved the resolution to 12.56 m -I. The optimization process of
the control system was then repeated. The results are presented in Figures 2.18(a),
2.18(b) and 2.18(c). From these figures, it is seen that the level of reduction achieved in
each sector varies with respect to the control source array location, as well as with respect
to the error wavenumber. Thus, by increasing the resolution, the control system was able
to better estimate, and therefore to better differentiate the components of the wavenumber
spectrum. As a result, the control system could target specific sectors of the far field,
increasing the reduction in each of them.
Thus,with a resolutionof 41.8m1, thecontrolsystemwasableto achieveareductionin soundpower level of up to 1.5dB, 4.4 dB, 4.0 dB and 1.16dB, respectively,for the(0°- 40°), (40°- 70°), (70°- 90°) and(40°- 155°) sectors,ascomparedto 1.8dB, 5.2 dB,4.6 dB and2.3 dB, for the respectivesectors,with aresolutionof 12.5ml. Therefore,byincreasingthe resolution,the ability of the control systemto lock on to the propagatingmodeswasimproved.
Note from figures 2.18(a)and 2.18(b)that the best level of reductionthat could beachievedin the targetsectorwasof 2.3 dB when the control sourcearraywas located0.25mupstreamof thefan, andwhentheerrorwavenumberwascomprisedbetween7 m
and 11m"1. This correspondsto thereductionthatcould beachievedwith the fuselageerror sensortechniqueusingonecontrol sourcearray in the rigid wail case.However, inthefuselagesensorscase,theoptimum solutionwasnot assensitiveto the locationof thecontrol sourcearrayasis in thepresentcase.Thepossiblelevelsof spilloverswerealsomuch lessimportant.Thus, an increasein soundpower level of only up to 4 dB becauseof spillover could occur within our targetsectorusing the fuselagesensortechnique,whereaswith the error wavenumbertechniquespilloversof up to 26 dB could occur.With the fuselageerror sensorstechnique,the modesthat propagatewithin the targetsectorare targeteddirectly. This is not thecasewith thewavenumbertechnique,leavingtherefore more room for errors. This could explain why the wavenumber sensortechniqueled to an optimum solution that wasless robust,and why the control systemwasmoreproneto generatespillover.
Placing the control sourcearray at its optimum location, the attenuationin soundpressurelevel that could be achievedin the far field of the inlet for different errorwavenumberswas thencomputed.Theseresultsarepresentedin Figure 2.19. They donot showa very goodcorrelationbetweentheerrorwavenumberthat wasbeing targetedandthedirectionof thefar field wherereductionwasachieved.
b) Controlof the inlet radiation- hybridcontrol
Next, theeffectsof addingaliner to theactivecontrolsystemwerestudied.The ductwasassumedto belinedover its entirelengthexceptatthetip of the inlet andoutlet.Thishybrid control systemwasoptimizedby looking for the error wavenumber,the controlsourcearraylocation,andthe liner impedancethatwould leadto themaximumreductionin soundpower level within the targetsector.Thesethreeparameterswhereoptimizedsimultaneously.Thevalueof theerrorwavenumberwasvariedbetween5 ml and30 miwith an incrementof 1 m_, while the axial location of the control sourcearray wassteppedalongthe duct lengthfrom 1.65m downstreamof the fan to 1.15m upstreamofthefan in 0.1 m increments.Thespecificresistanceandreactanceof the liner werevariedbetween0.1 and5 for theresistanceandbetween-3 and3 for the reactance,bothwith anincrementof 0.2.
Thebestattenuationthatcouldbeachievedin thetargetsectorwas6.3dB. This is animprovementof 4 dB over the pure activecontrol case.This reductionin soundpower
10
level wasobtainedfor a liner of specificresistance0.1 andspecific reactance0.7, for atargeterrorwavenumberof 7 ml, andfor a locationof thecontrol sourcearrayof 1.55mdownstreamof thefan.
Placing the control sourcearray at its optimum location, the attenuationin soundpressurelevel that could be achievedin the far field of the inlet for different errorwavenumberswasthencomputed.This resultis presentedin Figure2.20,anddoesshowa goodcorrelationbetweentheerror wavenumberthatis being targetedandthedirectionof the far field towardwhich reductionis achieved.Thus,it canbeseenthat asthe errorwavenumberincreases,thezonesof the plot wherereductionis achievedtilt toward theaxis of the duct. In the rigid wall case, the wavenumbersof the modes that arepropagatingtowardthe inlet of the ductwere (in increasingradial orders)24.0m-I, 23.3mt, 22.3 m-1, 21.0 m1, 19.2 m-1 and 16.8 m1, while in this lined wall case, thesewavenumbersare23.7m1, 22.9ml, 21.8ml, 20.4m1 and 18.5m_. It is notedthat thedifferenceZ_zbetweenconsecutivewavenumbersis, in average,larger in the lined wallcasethan in the rigid wall case.In therigid wall case,Akz varied from 0.7 m -I for the first
two modes that were cut on, to 2.4 m _ for the last 2 modes that were cut on, while in the
lined wall case, z_z varies from 0.8 m "_ for the first two modes that are cut on, to 2.7 m _
for the last 2 modes that are cut on. Therefore, the good correlation observed in the
present case between the error wavenumber being minimized and the region of the far
field where noise reduction is achieved could be due to the fact that the presence of the
liner in the duct causes the wavenumber spectrum to "stretch", and thus allowing the
control system to better differentiate between each component of the wavenumber
spectrum.
The robustness of this optimum solution with respect to the error wavenumber and to
the location of the control source array was investigated. While the specific impedance of
the duct inner wall was set to its optimum value of 0.1+0.7i, the attenuation in sound
power level that could be achieved in the target sector for various locations of the control
source array and various error wavenumbers was computed. These results are presented
in Figure 2.21(a). They show that although the optimum solution remained sensitive to
the control source array location, a much larger number of control source array location
that led to reduction in the target sector was obtained, as compared to the rigid wall case.
Thus, the presence of the liner increased the robustness of the control system.
From Figure 2.21(a), it can also be observed that reduction in sound power level was
achieved in the target sector for almost all possible locations of the control source array
when the lower error wavenumbers were targeted. Therefore, the control system
demonstrated the ability to identify the range of error wavenumbers which corresponded
to the modes that radiate within the target sector, since targeting the lower error
wavenumbers corresponds to targeting the higher order radial modes (which are the ones
that radiate within the target sector).
The robustness of the optimum solution with respect to the liner impedance was then
assessed. Fixing the error wavenumber and the axial location of the control source arrayto their optimum values (7 m _ for the error wavenumber and -1.55 m for the axial
11
location of the control sourcearray), the reductionin soundpower level that could beachievedwith this hybrid systemwascomputedfor various valuesof the liner specificimpedance.Theseresultsarepresentedin Figure2.21 (b) and indicatethat the optimumsolutionis not veryrobustwith respectto theliner impedance.
c) Controlof theoutletradiation- hybridcontrol
Next, the levelof reductionthat couldbeachievedin thetargetsectorwhentargetingthe negativewavenumbercomponentsof the spectruminsteadof the positiveones,wasinvestigated.This meansthat themodesthat werepropagatingthroughthe outlet of theduct weretargeted,insteadof the modesthat werepropagatingthroughthe inlet of theduct. An axial arrayof 6 wavenumbersensorswasplacedin theduct outlet.The sensorswereplacedalongtheductinnerwall between-1.7m and-1.2m with aspacingof 0.1m.The duct was considered to be lined (since this technique demonstratedpoorperformanceswith a rigid duct), and this hybrid control system was optimized. Thecombinationof liner impedance,control arraylocation,anderrorwavenumberthatwouldleadto a maximumreductionin thetargetsectorwasdetermined.A maximumreductionof 5.94dB couldbeachievedfor a liner impedanceof 0.8+1.1i, anerrorwavenumberof-3 m_, andalocationof thecontrolsourcearrayof 1.55m upstreamof thefan.
Placing the control sourcearray at its optimum location, the attenuationin soundpressurelevel that could be achievedin the far field of the inlet for different errorwavenumberswas thencomputed.The resultsarepresentedin Figure 2.22.They show,again,a good correlationbetweenthe errorwavenumberthat is being targetedand thedirectionof thefar field wherereductionis achieved.
The level of reductionof 5.94 dB that was achievedwithin the targetsectorwhencontrolling thenegativewavenumbercomponentsis 0.36dB lessthanwhatwasobtainedwhen the inlet wavenumbercomponentswere targeted. This differencein performancebetweenthe two approachesis probablydueto the fact that, as it wasobservedearlier,controlling the modesthat radiatethroughthe inlet of the duct hasmore impacton theoverall reductionachievedwithin the targetsectorthanwhencontrolling themodesthatradiate through the outlet of the duct. However, this difference in performance isrelatively small. This could bedue to the fact that althoughthe wavenumberresolution,which is determinedby the numberof pressuresensorsand the spacingbetweeneachsensor, is the same for the inlet and outlet cases, the estimatesof the negativewavenumbercomponentscanbeexpectedto be betterthan the estimatesof the positiveones,becausethe wavelengthsof the modestravelling towardsthe outlet opening arelongerthantheonescorrespondingto themodestravelling towardsthe inlet opening.Forexample,in the inlet the wavelengthof the first mode beingcut on is 0.26 m, and thewavelengthof the lastmodebeingcut on (i.e., the(4,5)mode)is 0.37m. In theoutlet thewavelengthof the first modebeingcut on is 0.44m andthewavelengthof the lastmodebeing cut on (i.e., the (4,5) mode)is 0.88 m. Therefore,the samplingof the waves oflongerwavelengths(i.e.,of the wavestravellingtowardthe outlet) is morethoroughthanthesamplingof the wavesof shorterwavelengthstravelling toward theinlet. As a result,
12
the wavenumbersensorstechniquecould beexpectedto work betterwhen targetingthenegativewavenumberversusthepositivewavenumbers.
It was also observedthat the value of optimum liner specific impedanceis not thesamefor the caseswherepositiveor negativeerrorwavenumberswere minimized.Thiscould bedueto thefact that, eventhoughthemodesthatradiatethroughtheoutlet of theductdo it soatthe sameanglewith respectto theductaxisasthemodesthat radiatefromthe inlet of the duct,the wavefronts of theoutlet andinlet modesdo not hit the wall (orthe liner) of the duct with the sameangles.This differencein angle is causedby thepresenceof uniform flow: the inlet modespropagatewith asmalleranglewith respecttothe duct axis thantheoutletmodes.Therefore,theoptimumliner valueshouldindeedbeexpectednot to bethesamefor the inlet andoutletcontrolcases.
Regardingthewavenumbersensorstechnique,it wasobserved that:
(i) The presence of the liner improved the correspondence between the error
wavenumber being targeted and the far field region where noise reduction was
achieved. It also increased the number of locations of the control source array that
led to reduction in the target sector.
(ii) The hybrid system improves by 4 dB the reduction that could be achieved in the
target sector compared to the pure active noise control system.
(iii) The optimum solution is sensitive to both the liner impedance and to the control
source array location.
(iv) Similar levels of reduction were achieved when targeting positive or negativeaxial wavenumbers.
2.2.4 Summary:
A table summarizing the optimum levels of reduction that could be achieved for the
target sector using the different control systems that were studied is presented in Figure2.23:
A maximum reduction of 4.5 dB could be achieved by the pure passive control
system. This was an improvement of about 2 dB over what could be achieved by the pure
active control systems when a single array of control sources was used to generate the
control field. However, the performance of the passive control system was matched or
exceeded when two control source arrays were used by the active control systems.
The performances of the hybrid control systems were better by an average of 4 dB
than the ones achieved by the pure active or pure passive control systems. The addition of
a liner to the active control systems also improved the robustness of the optimumsolutions.
13

Finally, the hybrid control systembasedon the fuselageerror sensorstechniqueperformedbetter than the hybrid systemthat was basedon the wavenumbersensorstechnique.Theformer wasalsofoundto haveamore robustoptimum solutionandto beeasierto optimize: with the wavenumbersensorstechniquethreeparametershaveto beoptimized simultaneously(control sourcearray location, error wavenumberand linerimpedance),versustwo parameterswith the fuselageerror sensorstechnique(controlsourcearrayslocationsandliner impedance).
2.3 Main conclusions:
A moreadvancedmodelof activenoisecontrol of fan noisefor turbofanengineshasbeendeveloped.Thismodelwasfoundto be fastandversatile.
It was determinedthat active noise control has the potential to reduce, over arelatively largesector,thefannoiseradiatedby anultrahighbypassturbofanengine.
It wasobservedthat ahybrid control systemcanachievesignificantlybetter levelsofnoisereduction thana pure passiveor pure activecontrol system,andthat its optimumsolution is morerobustthantheoneachievedby apureactivecontrolsystem.
It was found in thecasesherethat in general,activenoisecontrol with the fuselageerror sensorsworksbetterthanusinginlet wavenumbersensors.
3. EXPERIMENTSON THE JT15DTURBOFAN ENGINE
This sectionpresentstheexperimentalresultsfor investigatingtheapplicationof ANCtechniquesfor reducingthe inlet noise radiatedby a JT15D turbofan jet engine withfuselage-mountederror sensorsat Virginia Tech. In order to put the resultsobtainedthisyearinto perspective,a list of previousaccomplishmentsis included. They include:
1)Compact and lightweight rare-earthcompressiondriver control sources weredevelopedandimplemented.
2) Global attenuationwas achievedwith an optimizedconfiguration using a singlecontrol sourcearrayandfarfield sensors.
3) Controlovera desiredsectorwasshownto beachievedwith a properconfigurationof control sourcesandfarfield error sensors.
4)The potential of inlet mountederror transducerswas shownin conjunctionwith amodel referencecontrol approachwhich requirestemporaryuseof farfield errorsensors.
5)Multiple circumferentialcontrol sourcearrayswere shownto improve attenuationandreducesidelinespillovereffects,i.e.,controlhigherorderradialmodes.
6)The combinationof passiveandactivecomponentson a hybrid inlet wasshowntobe an effective strategyfor reducingjet inlet noise using farfield sensors. Theactivecontrolsystemwasnotembeddedin theliner.
7)The potential of an inlet mountederror sensingstrategy using a wavenumbersensingtechniquewas shown to be effective when used in conjunction with a
14
passive liner. Reductionover desiredsectorscan be obtainedby observingandminimizing particularwavenumbers.
Furtherinformationconcerningthepreviousresultscanbe foundin thereferences[1-6].
Theresearchgoalsfor this yearareasfollows:
1)To experimentallydemonstrateactivecontrol with fuselage-mountederror sensorsandcontrol actuatorsmountedona realisticcompactinlet.
2)To combine active and passivecontrol techniquestogether to createa hybridpassive-activecompactinlet.
Themanyaspectsof theseobjectivesinclude:
1)Thedesignof apparatusand proceduresfor the implementationof active noisecontrol methodsonaturbofanengine.
2)The construction of the necessaryapparatus,including control hardware andsoftware,the upkeepof theJT15Dengineandtestcell, and all componentsof thesystem.
3)The implementationof all componentsof the developedsystemto experimentallydemonstrateactivenoisecontrolon therunningturbofanengine.
3.1TheJT15Dengine,testcell, andfuselagesection
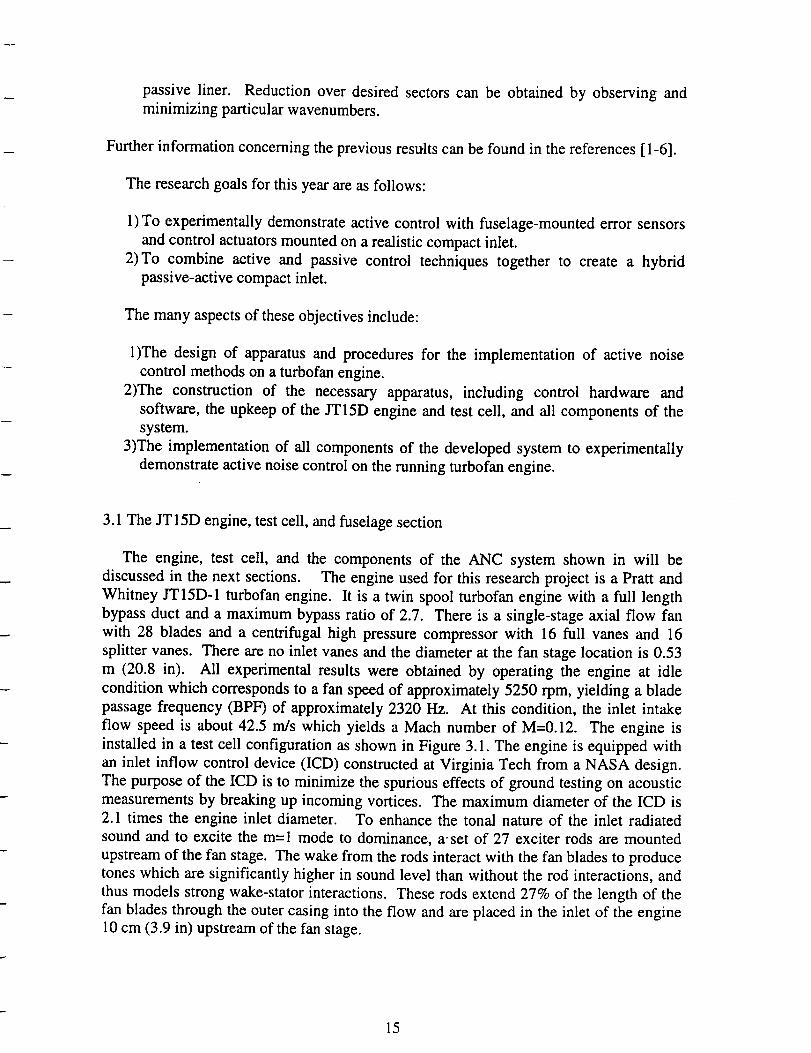
The engine, test cell, and the componentsof the ANC system shown in will bediscussedin the next sections. The engineusedfor this researchprojectis a Pratt andWhitneyJT15D-1turbofanengine. It is a twin spool turbofanenginewith a full lengthbypassduct and a maximumbypassratio of 2.7. Thereis a single-stageaxial flow fanwith 28 bladesand a centrifugalhigh pressurecompressorwith 16 full vanesand 16splitter vanes.Thereareno inlet vanesandthediameterat thefan stagelocation is 0.53m (20.8 in). All experimentalresultswere obtainedby operating the engine at idleconditionwhich correspondsto a fan speedof approximately5250rpm, yielding a bladepassagefrequency(BPF) of approximately2320 Hz. At this condition, the inlet intakeflow speedis about42.5 m/s which yields a Mach numberof M=0.12. The engine isinstalledin a testcell configurationasshownin Figure3.1. The engineis equippedwithan inlet inflow control device(ICD) constructedat Virginia Techfrom a NASA design.Thepurposeof the ICD is to minimize thespuriouseffectsof groundtestingon acousticmeasurementsby breakingup incomingvortices. Themaximum diameterof the ICD is2.1 times the engineinlet diameter. To enhancethe tonal natureof the inlet radiatedsoundand to excite the m=1 modeto dominance,a"set of 27 exciter rodsaremountedupstreamof thefanstage.Thewakefrom therodsinteractwith thefanbladesto producetoneswhich aresignificantly higherin soundlevel thanwithout the rod interactions,andthusmodelsstrongwake-statorinteractions.Theserodsextend27% of the lengthof thefan bladesthroughthe outercasinginto theflow andareplacedin the inlet of the engine10cm (3.9 in) upstreamof thefanstage.
15
Theenginetestcell consistsof two chambers,with theforwardsectionconsistingof asemi-anechoicchamberto simulatefreefield conditions. Onewail of the semi-anechoicchamberis opento the atmospherefor engineintake air. A simulatedfuselagesectionwasconstructedwith a woodframeanda thin aluminumskin andmountednearthe topof thetest cell asshownin Figure3.1. Theeffectiveradiusof thefuselagewas6 ft, withanoverall lengthof 12ft. Thefuselagesectionwascenteredabouttheaxisof theengineand mountedso that its surfacewas56 inchesabovethe top of the engine inlet. Themicrophoneerror sensorsmountedin the fuselagewill beexplainedin detail in section3.6. Figure 3.2 is apicturetakenfrom thefront of thetest cell showingthetest cell, thefuselagesectionandtheICD.
3.2 Thecontrol algorithm
The control strategyis the feedforwardFiltered-X LMS algorithm. In general,thealgorithm generatesthe control input by filtering a referencesignal which is coherentwith the error signal (thesignalto becancelled)throughanadaptivefilter, beforebeinginput to the control actuators.More detailedinformationcanbe found in the references[1-5]. The results in this work were obtained with a multi-channel controller, allowing up
to six inputs and six outputs (6160). The control algorithm was implemented on a
TMS320C30 digital signal processing board hosted in a PC. The sampling frequency
used in all experiments was 10000 Hz.
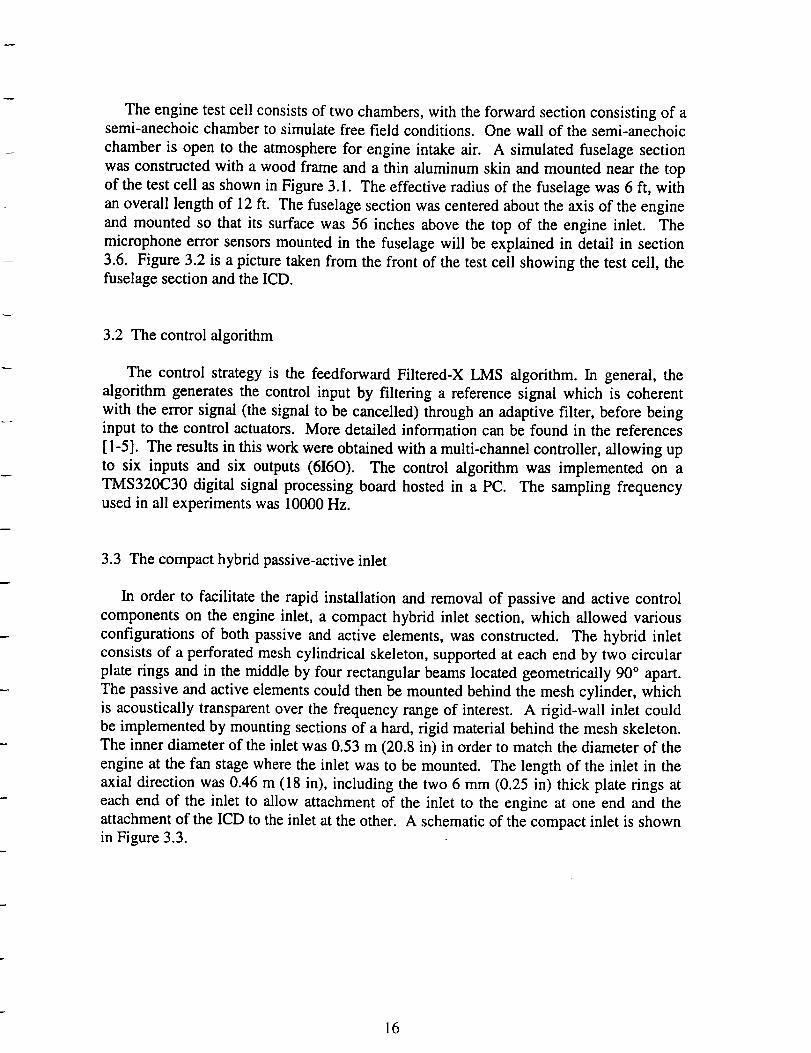
3.3 The compact hybrid passive-active inlet
In order to facilitate the rapid installation and removal of passive and active control
components on the engine inlet, a compact hybrid inlet section, which allowed various
configurations of both passive and active elements, was constructed. The hybrid inlet
consists of a perforated mesh cylindrical skeleton, supported at each end by two circular
plate rings and in the middle by four rectangular beams located geometrically 90" apart.
The passive and active elements could then be mounted behind the mesh cylinder, which
is acoustically transparent over the frequency range of interest. A rigid-wall inlet could
be implemented by mounting sections of a hard, rigid material behind the mesh skeleton.
The inner diameter of the inlet was 0.53 m (20.8 in) in order to match the diameter of the
engine at the fan stage where the inlet was to be mounted. The length of the inlet in the
axial direction was 0.46 m (18 in), including the two 6 mm (0.25 in) thick plate rings at
each end of the inlet to allow attachment of the inlet to the engine at one end and the
attachment of the ICD to the inlet at the other. A schematic of the compact inlet is shownin Figure 3.3.
16
3.4 Thecontrol actuators
The control actuatorsusedin this researchweredevelopedat Virginia Tech for ANCon theJT15Dengine.Thediaphragmsarecommerciallyavailable8ohmelementswith avoice coil diameter of 2.5 cm. In order to make the acoustic source as small andlightweight aspossible,thespeakermagnetelementwasdesignedandconstructedwith aneodymium iron-cobalt (rare-earth) magnet. Becauseof the high magnetic fieldgeneratedby this material (aboutten times of regularmagnets),the sizeof the speakermotor can be significantly reducedwhile maintaining the output levels. The speakerassemblywith the rare-earthmagnetis 4.5 cm in diameterand2.5 cm thick and weighs257 g. This sourcehas a fairly flat frequencyresponsefrom 2 to 4 kHz, and wasdesignedfor cancellationof the BPF toneat 2300Hz. This speakermotor is less thanhalf the size and a third of the weight of the commercially available speakermotordesignedfor usedwith thesamediaphragms.
A secondset of acousticsourcesshownwere alsomadeusingneodymiummagnets,but were designedwith 5.1 cm (2 in) diameter voice coils and thus have a lowerfrequency range. These larger sourceswere designedfor the NASA Lewis 4-footdiameterductedfan with a tone at 1000Hz [5], but generatedenoughsoundlevels at2300Hz sotheycouldalsobeusedon theJT15Dengine.
The control signal(s)suppliedto the groupof driverswerephasedin sucha way astogeneratea spinning modeof circumferentialorder m=l in the duct inlet, i.e., since alltwelve drivers were being driven by one control signal, then the phasedelay betweenadjacent sourcesaround the circumferencewas -30°. The phase delay between thesourcesin thecontrol arraywerefixed with ananalogphase-shiftingcircuit. The sourcemagnitudeand phasecalibration is carried out for each sourceindividually using amicrophonelocatedat 0° just beyondtheICD. Usinga constantreferencevoltagesignal(usuallyof 1.0Volt) the poweramplifier gain of eachof the control drivers is adjustedindividually sothat all control sourcesgeneratethesamelevelat themicrophonelocatedat 0% The phaseresponse(relative to the referencevoltagesignal) is measuredandadjustedfor eachsourceindividually asexplainedaboveto ensurethe generationof them=l spinningmodes.
The control signalswere low passfiltered at 2500 Hz after being output from thecontrollerboardandbeforebeinginput to thephaseshifterandpoweramplifiers.
3.5The referencesensor
The reference signal, required by the feedforward controller, is obtained by aproximity sensormountedflush with the casingat the fan stagelocation. This eddy-currentsensorpicksup thepassageof eachof thefan bladesandgeneratesa sequenceofpulses. By properfiltering, theoutputfrom this sensorprovidesatime historieshighlycorrelatedwith the fan BPFandits harmonics. Thereferencesignal is low-passfilteredat a cut-off frequencyof 2500 Hz with a 48 dB/octavefilter. The key featureof this
17
transduceris that it yields a non-acousticalsignal,andwill thereforenot be affectedbythe action of the control input(s), i.e. no control feedbackeffects. This is a veryimportantcharacteristicfrom thecontrollerrobustnesspoint of view.
3.6Theerror sensorsandsensingstrategies
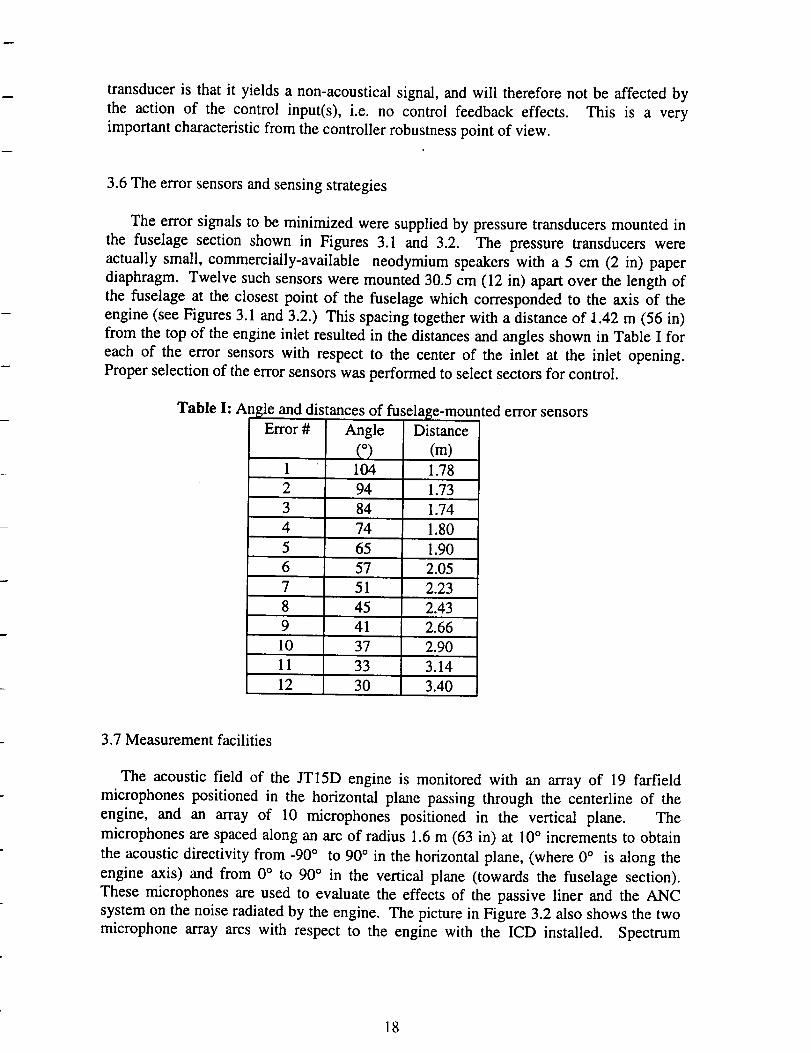
The error signalsto beminimized were suppliedby pressuretransducersmountedinthe fuselagesection shown in Figures 3.1 and 3.2. The pressuretransducerswereactually small, commercially-available neodymiumspeakerswith a 5 cm (2 in) paperdiaphragm. Twelvesuchsensorswere mounted30.5cm (12 in) apartover the lengthofthe fuselageat the closestpoint of the fuselagewhich correspondedto the axis of theengine(seeFigures3.1 and3.2.) This spacingtogetherwith a distanceof 1.42m (56 in)from thetop of theengineinlet resultedin the distancesandanglesshownin TableI foreach of the error sensorswith respectto the centerof the inlet at the inlet opening.Properselectionof theerrorsensorswasperformedto selectsectorsfor control.
Table I: Angle anddistancesof fuselage-mountedError# Angle Distance
(o) (m)1 104 1.782 94 1.733 84 1.744 74 1.805 65 1.9O6 57 2.057 51 2.238 45 2.439 41 2.6610 37 2.9011 33 3.1412 30 3.40
error sensors
3.7Measurementfacilities
The acousticfield of the JT15D engine is monitoredwith an array of 19 farfieldmicrophonespositionedin the horizontal planepassingthrough the centerline of theengine, and an array of 10 microphonespositioned in the vertical plane. Themicrophonesarespacedalonganarcof radius 1.6m (63 in) at 10° incrementsto obtaintheacousticdirectivity from -90° to 90° in thehorizontalplane,(where0° is along theengine axis) and from 0° to 90° in the vertical plane (towards the fuselagesection).Thesemicrophonesareusedto evaluatethe effectsof the passive liner and the ANCsystemon thenoiseradiatedby theengine. Thepicturein Figure3.2 alsoshowsthetwomicrophonearray arcs with respectto the engine with the ICD installed. Spectrum
18
averagingof the microphonedata was performed with a Bruel & Kjaer type 2032spectrumanalyzer.
3.8Controlusinga 1C4Econtrolsystem
The first resultspresentedwill be thoseachievedusingone control array locatedatXcl= 0.3 m (seeFigure3.3for coordinateorigin) andthefour error sensorslocatedat 0 =45°, 0 - 57 °, 0 = 65 °, and 0 = 74 °. The control sources used were the larger ones with a
voice coil diameter of 2 inches. The directivities of the BPF tone at a frequency of 2328
Hz for the inlet configured as a rigid wall, the inlet configured with a passive liner, and
for the inlet with both passive and active noise control are shown in Figures 3.4(a) and
3.4(b) in the horizontal and vertical planes, respectively. It is clear that minimizing the
BPF at angles in the "upward" direction (i.e., toward the fuselage) also results in
reduction at similar angles in the horizontal plane as well. It is extrapolated that the
region of achieved reduction is symmetric about the axis of the engine even thought the
tone is only minimized in one direction. Thus the area of reduction seems to exist as a
sector of rotation about the engine axis as is predicted analytically and expected due to
the symmetric nature of the radiated noise about the azimuth of the engine. In this
experiment, reduction beyond the passive-only case (which in all experiments represents
a "before control" directivity) is evident over the sector from approximately 40 ° to 60 ° in
the farfield. Some spillover is observed mainly toward the engine axis at the angles of
30 ° and 40 °. The additional power reduction of the BPF tone obtained with active
control over the passive only case for the total and two different sectors are tabulated in
Figure 3.4(c). The total power was actually increased after control due to the spillover
toward the front of the engine. The power reduction obtained over the two sideline
sectors shown in the table were less than 2 dB with this configuration.
3.9 Results using a 2C4E control system
The next results are for a configuration using two control arrays, the first array (with
the large sources) was located at xcl = 0.3 m, and the second array (with the small
sources) was located at Xc2 = 0.48 m (again refer to Figure 3.2 for the coordinate origin.)
The four error sensors minimized were located at 0 = 40 °, 0 = 45 °, 0 = 50 °, and 0 = 57 °.
The directivities of the BPF tone at a frequency of 2328 Hz for the inlet configured as a
rigid wall, the inlet configured with a passive liner, and for the inlet with both passive and
active noise control are shown in Figures 3.5(a) and 3.5(b) in the horizontal and vertical
planes, respectively. A significant improvement in the BPF tone reduction is evident
with the addition of a second control array and a slightly different error sensor selection.
Reductions of the BPF tone level approach 10 dB atsome angles with very little control
spillover. The additional power reductions in the BPF tone achieved by the active control
system beyond the passive-only case are shown in the table of Figure 3.5(c). A total
power reduction of 1.8 dB is now evident with reductions over the sideline sectors
exceeding 4 dB.
19
3.10Resultsusinga 2C2Econtrolsystem
The results for the bestcaseof activenoisecontrol with fuselageerror sensorsareshownin Figure 3.6. This experimentuseda2C2Esystemwith xcl = 0.3m, andthexc2=0.48 m (the samecontrol configurationasthe lastexperiment.) Two error sensorswereminimized locatedat 0 = 57° and 0 = 65°. Figures3.6(a)and (b) show the radiationdirectivities in thehorizontalandverticalplanes,respectively.Global controlis obtainedover theentiredirectivity field with respectto thepassive-onlydirectivity. Reductionsofup to 15 dB are obtained in somedirections, with the most significant reductionsoccurring toward the larger angles,i.e., toward the engine sidelines. Again the totalpower reduction in the BPF tone and the powerreductionover the sideline sectorsareshownin thetableof Figure3.6(c)andshowimprovementover the previousexperiment.It is clear from theseexperimentsthat significant reductionscan be achievedwith acontrol systemwith properlyconfiguredsensorsandactuators.
3.11 Comparison of results using fuselage-mountederror sensors to those usingwavenumbersensing
To evaluatethe resultsachievedwith ANC usingfuselage-mountederror sensors,acomparisonto the resultspreviouslyobtainedwith ANC usingthe wavenumbersensingtechnique is in order. The results presentedhere using the wavenumber sensingtechniquewereobtainedduring the researchperformedin 1997,and moredetail canbefound in the reference[6]. The wavenumbererror sensingtechniqueinvolves usingconditionedsignalsfrom anarrayof inlet microphonesto observean axial wavenumbercomponentpropagatingout of the engine inlet. The 1C1E controller is then used tominimize the signal from the wavenumbersensor. Figure 3.7(a) shows the SPLreductions over the horizontal directivity field as a function of the wavenumberminimized that wasachievedwith a single control sourcearray locatedat x¢= 0.30 membeddedwithin a passively-linedinlet. It is clear in this figure that a trend existsbetweenthe sectorover which reduction is achievedand the wavenumberminimized.Controlling lower wavenumberstendsto result in reductiontowardsthe sidelinesectors,andasthewavenumberminimizedincreases,theangleof reductionmovesclosertowardthe engine axis. Thus with the passively-linedduct, it was shown that minimizingdifferentwavenumberscorrespondsto minimizing theradiation towardsdifferent anglesin thefarfield.
A similar plot is containedin Figure 3.7(b) for ANC with fuselage-mountederrorsensors,which showsthe SPL reductionover the horizontal directivity field plottedversustheanglesof thepair of fuselage-mountederror transducersthat were minimized.For the FES experimentalresults shownin Figure 3.7(b), a 1C2E controller wasusedwith thesamelocationof thesinglecontrolarrayaswasusedin thewavenumbersensingcase(xe= 0.30m) on apassively-linedinlet. The resultswith the fuselageerror sensorsshowasimilar andobvioustrendthatthe sectorof reductionoccursin the vicinity of theangleswherethesensorsarelocated.Dueto thedistanceof thefuselagefrom theengine,
2O
the smallestangleat which anerror sensorcould be locatedwas30°, thus the two plotsdo not corresponddirectly, astherightmost caseusingthe FES (with anglesat 41° and30°) showsa similar sectorof reductionasthatachievedby minimizing a wavenumberofabout15 m "l.
Figure 3.8 contains a comparison between a 1C1E system with a single fuselage error
sensor located at 0 = 51 ° and a 1C1E system with the wavenumber sensing technique
minimizing a wavenumber of kx=5.2 m q. In both cases the single control array was
located at xc = 0.30 m, and embedded within a passively-lined inlet. The horizontal
radiation directivities for minimizing the fuselage error sensor at 0 = 51 ° and minimizing
the wavenumber kx=5.2 m q are shown in Figures 3.8(a) and 3.8(b) respectively. The
control system with the single fuselage error sensor results in a significant notch near the
angle where the error sensor was located in this case, with reductions exceeding 10 dB,
while this case using the wavenumber sensing technique results in a more distributed
region of reduction. The additional power reductions in the BPF tone for both cases are
tabulated in the table of Figure 3.8(c) for the total and two sideline sectors. Thus, FES
can be used to "notch the BPF tone in a particular direction
An additional comparison can be drawn between the previous wavenumber sensor
experimental results with a 1C1E system shown in Figure 3.8(a) and results obtained with
the 2C2E fuselage error sensing system as shown in Figures 3.6(a). The results for these
two cases are comparable in terms of BPF total power reduction and power reduction
over sectors. It should also be noted that the second control array for use with the
fuselage error sensing technique was located in the axial location of the inlet where the
inlet wavenumber sensors were located. Thus the fuselage error sensing technique
produces a comparable reduction in the BPF tone as that achieved with the wavenumber
sensing technique.
3.12 Effect of boundary layer noise
An issue that may potentially present a practical problem for the use of fuselage-
mounted error transducers is the corruption of the error signals with induced boundary
layer noise during flight. In 1971, Bhat published work regarding the results obtained
with arrays of microphones flush-mounted on the skin of a Boeing model 737 fuselage
both forward and aft of the wing-mounted turbofan engines. [7] In this paper it is
reported that the prevalence of the engine tonal noise in the fuselage-mounted
microphones depends on the flight Mach number. For M---O.78, the engine noise was
completely masked by the boundary layer noise in the time domain; at M=0.6 the engine
noise (i.e., the BPF at 3355 Hz) stood 1.5 dB above the broadband boundary layer noise;
and at M=0.45 the BPF tones stood well above the bl:oadband between 2 and 10 kHz. [7]
These results imply that the fuselage sensing technique could work well with proper band
pass filtering of the error signal, especially since the flight Mach numbers of the airplanes
when they are near the ground (i.e., during takeoff and landing) when ANC is expected to
be necessary are relatively low (e.g., M--0.3) and the boundary layer noise is not expectedto be detrimental.
21
In order to investigatethe effect of induced boundarylayer noise into a fuselagemounted error signal, experimentswere run on the JT15D engine with externaluncorrelatedrandomnoisecontentaddedto the errorsignalsbeforetheywereintroducedinto the controller. The experimentalresults presentedhere are for a 1C1E controlsystemwith the singlecontrol arraylocatedat x¢= 0.3 m, andfor thesingleerror sensorat 0 = 57°. First, theerror signalwasminimized by thecontrollerwithout theaddition ofrandomnoise, and the resultingbeforeand after control spectraof the error signal areshownin the top plot of Figure3.9(b). Beforecontrol, the BPF tonestoodabout20 dBabovethebroadbandnoiselevel in thevicinity of thetone,andthecontrollerreducedtheBPF toneby 11.5dB. The resultingradiation directivities for the rigid wall case,thepassivecontrol only case(i.e., thebeforecontrol case)andthepassive-activecontrol casewith no additional boundary layer noise (BLN) are shown in Figure 3.9(a). Thecontrolleddirectivity showsreductionsof up to 10dB over the sectorfrom about50° to70°, andthe BPFpowerreductionsaretabulatedin Figure3.9(c). Next, white noisewasaddedto the error signaluntil theBPF tonestoodonly approximately1.5dB abovethebroadbandnoise, and the controller was converged (from its initial zero state) tominimize the new error signal corruptedwith the simulatedboundarylayer noise. Theerror signal spectrawith thesimulatedboundarylayer noisebefore andafter control arecontainedin thebottomplot of Figure3.9(b),whichshowsthattheerror signal contentatthe BPF tone was reducedto the broadbandbackgroundwith control. The resultingdirectivity for this passive-activecasewith the additionof simulatedBLN is alsoplottedin Figure 3.9(a). It is clear that a few dB of reductionwere lost when the error signalcontainedBLN, andtheBPF powerreductionsare tabulatedin Figure 3.9(c). With theaddition of BLN to the single error signal, 0.6 dB more spillover in the total BPFreductionwasobserved,andtheBPFreductionsoverthesidelinesectorsfrom 50° to 70°andfrom 50°to 90° werereducedby 1.3and 1.1dB, respectively.However,theBPF tonestandingonly 1.5dB abovethebroadbandis consideredto representanextremecaseoferror signal corruption,and the fact that the control systemstill performedadequatelyshowsthat the influenceof boundarylayer noiseshouldnot beconsidereddetrimentaltotheperformanceof theANC system.
4. CONCLUSIONS
The following conclusionscanbe madeconcerningthe researchperformedin thiswork:
1) Theuseof fuselage-mountederrortransducersfor usein conjunctionwith activenoisecontrol wasexperimentallyshownto be an effective strategyfor reducingthenoiseradiatedat theBPFtone from turbot'anengines. Reductionsof theBPFradiatedpowerof up to5.0dB wereobtainedoverthesectorfrom 50° to 90°.
2) Proper selectionof error signals and control actuator locations can result inselectivecontrol over sectors,and good control with only a small number ofsensorsandactuators.
22

3) Theresultswith fuselagemountederror sensorsarecomparableto thoseobtainedpreviouslywith thewavenumbersensingtechnique,andthefuselageerror sensorsprovidethe addedadvantageof using lessinlet space.
4) The presenceof boundarylayer noiseon the error signalsis not expectedto bedetrimentalto theperformanceof theANC system.
5. ACKNOWLEDGEMENTS
This work was supportedby the AeroacousticsBranch of the NASA LangleyResearchCenterwhich is gratefullyacknowledged.Thetechnicalmonitorsfor this workareCarlGerholdandJoePosey.
6. REFERENCES:
[1] Thomas,R. H., Burdisso,R. A., Fuller,C. R., andO'Brien,W. F., "Active Control ofFan Noise from a Turbofan Engine," AIAA paper 94-0361,32nd AerospaceScienceMeeting& Exhibit, Reno,Nevada,January11-14,1993.
2. Burdisso,R. A., Thomas,R. H., Fuller, C. R., andO'Brien,W. F., "Active Control ofSpinning Modes from a Turbofan Engine," AIAA Journal,Vol. 32, No. 1, pp.23-30,1994.
3. Burdisso,R.A., Fuller, C.R., Smith, J.P., "Experimentson the Active Control of aTurbofanInlet Noise usingCompact,Lightweight Inlet Control andError Transducers,"CEAS/AIAA-95-028, 1995,pp. 177-185.
4. Smith,J.P.,Burdisso, R.A., andFuller, C.R., Experimentson the Active Control ofInlet NoiseFrom a TurbofanJetEngineUsing Multiple CircumferentialControl Arrays,AIAA 96-1792,1996.
5. Smith,J.P., Burdisso,R.A., "Active Controlof Inlet Noiseat theNASA Lewis Ducted
Fan Facility," Virginia Tech Report VPI - ENGR.97.477, November, 1997.
6. Smith, J.P., Burdisso, R.A., "Active Control of Inlet Noise on the JT15D Turbofan
Engine," Virginia Tech Report VPI - ENGR.97.263, December, 1997.
7. Bhat, W. V., "Flight test measurement of exterior turbulent boundary layer pressure
fluctuations on Boeing model 737 airplane," J.Sound 'Vib. 14 (4), 439-457, 1971.
23
I I I I I I I I I _ I _ I I _ I I J
e rro rsensors
0 0
:Ountr6/s
.....•fa.n_..%...., uflnoifOrm
bac__ar line,!_.._.........._...;no,seed _ard
fan noise fan noiseradiation radiation
Figure 2.1: Schematic of the model
I I I I I I I I i I I
Re[ p ] (Pa.)-33-28-24-19-14 -9 -5 0 5 9 14 19 24 28 33
EIi,
4
3
2
Z2( 0 2 4-4 m.) - axis of the duct
Figure 2.2: Pressure field. BPF=1000 Hz, Mf--0.25 and m=4
26
I I I I I I I I ! I I I I f I I I I I
bO
\\
\
\
\
planefuselage
\
/
control source /array /
J
JJ
I
controlsources
Figure 2.4: Schematic of the control system for the fuselage error sensors technique.
I i I I I I 1 ! ! I I i I I I I I { I
3.0
2.0
1.0
(dB) o.o-1.0
-2.0
-3.0
Sound power level reductionfor the 40-155 deg. sector
I , , I i , , I , , , I , I i i i , b , i I
-1.5 -1 -0.5 0 0.5 1 1.5
control source array location (m)
(a)
sector 0-40 40-70 70-125 125-155 155-180 40-155(deg.)
reduction -0.43 3.36 3.2 0.2 -8.2 2,5(dB)
(max.) 0.3 3.75 0.9 -4.8 -7.9 0.74
(b)
Figure 2.5: Reduction in sound power level achieved in the target sector with the fuselage sensor technique.
Pure ANC, l control source array and 3 error sensors within the 40-70 deg. sector.
(a) all control source array locations, (b) optimum cases.
I I I I I I I I I I I I I I I I I I I
3.0
(dS) 201.0
0.0
-1.0
-2.0
-3.0
Sound power level reductionfor the 40-155 deg. sector
I I I I I I I h I I I I I I i J i I I I I I I J J I
-1.5 -1 -0.5 0 0.5 1 1.5
control source array location (m)
(a)
sector(deg.)
0-40 40-70 70-125 125-155 155-180 40-155
reduction 0.3 2.6 7.4 4.2 -7.1 2.9(dB)
(max.) -0.23 4.41 -0.6 -5.6 -9.59 0.37
(b)
Figure 2.6: Reduction in sound power level achieved in the target sector with the fuselage sensor technique,
Pure ANC, 1 control source array and 7 error sensors within the 40-70 deg. sector.
(a) all control source array locations, (b) optimum cases.
I I I f I f ( I I f f I I | I I I I ',
L_0
Sound power level reductionfor the 40-70 deg. sector
5.0 F__ 3 sensors /_
4.0 7 sensors
3.0
(dB) 2.0
1.0
0.0
-1.0
-2.0
-1.5 -1 -0.5 0 0.5 1 1.5
control source array location (m)
Figure 2.7: Reduction in sound power level for the 40-70 deg. sector with the
fuselage sensors technique. Pure ANC. 1 control source array.
I I I I I ( I I I I I I I I I ( I I I
Sound power level reductionfor the 40-155 deg. sector
._ 1 (dB)10.0
0m
'0
_m2I=-100
"0C
04
7.1
4.3
1.4-1.4
-4.3-7.1
-10.0
-1 0 1 2
I rst control array location (m)
(a)
For the optimum configuration -
sector(deg.)
reduction(dB)
0-40
0.44
40-70
5.2
70-125
7.5
125-155
4.8
155-180
6.1
(b)
40-155
5.3
Figure 2.8: Sound power level reduction (a) for the target sector, (b) for the optimum case with the fuselage error
sensor technique. Pure ANC, 2 control arrays and 3 sensors within the 40-70 deg. sector.
I I I I I ( I I I I ( I I I I I I I I
t'_
0
7.,
"OC
O
-1
Sound power level reduction for the 40-70 deg. sector3 sensors 7 sensors
-1
-1 0 1 -1 0 1
(a) (b)
Sound power level reduction for the 125-155 deg. sector3 sensors 7 sensors
0
-1
0 1 -1 0
I rst control array location (m)(c) (d)
(dB)7.15.03.01.0
-1.0-3.0-5.0-7.1
7.15.13.01.0
-1.0-3.0-5.1-7.1
Figure 2.9: Sound power level reduction for the 40-70 deg. sector using (a) 3 error sensors, (b) 7 error sensors,
and for the 125-155 deg. sector using (c) 3 error sensors, (d) 7 error sensors.
Fuselage sensors technique. Pure ANC, 2 control source arrays.
I f I I I ( I I I [ [ I I I I I I I 1
8 1..go
0
o
c
Sound power level reductionfor the 40-155 deg. sector
(dB)6.0
4.3
2.6
0.9
-0.9
-2.6
-4.3
-6.0
-1 0 1 2
I rst control array location (m)(a)
For the optimum configuration :
sector(deg.)
reduction(dB)
0-40
0.41
40-70
5.8
70-125
6.6
125-1 55
5.6
155-1 80
6.2
40-1 55
6.0
(b)
Figure 2.10: Sound power level reduction for (a) the target sector, (b) the optimum case with the fuselage sensors
technique. Pure ANC, 2 control arrays and 7 sensors within the 40-70 deg. sector.
I I I I I I ( I I I I I I I I I I I I
t.,o4_
8.0
7.0
6.0
5.0
dB 4.0
3.0
2.0
1.o0.0
-1.0
Sound power level reduction in the 40-155 deg. sector
z = 1.7+2.8 i Zc = 0.2 m
3
2
"6 1
I , , , I , , , I , , , I , , , | I I I I = L i I *
-1.5 -1 -0.5 0 0.5 1 1.5control array location (m.)
am
Q.U_-2
-31 2 3 4. .5 6
specific resmtance
(a) (b)
Figure 2.11: Sound power level reduction for the target sector (a) optimum liner impedance, (b) optimum control array location.Fuselage sensors technique. Hybrid control, 1 control source array and 3 error sensors.
l ( I g I I + I I I I l I I I I I I I
Sound power level reduction in the 40-155 deg. sectorZc = 0.2 and 1.6 m z = 1.7+2.8 i
3
2
.m0
0am
810
m
2
_D-3 1 2. 3 . .4 5 ¢
specific mS,sTance
(a)
(dB)
-1 0 1
I rst control array location
(b)
Figure 2.12: Sound power level reduction for the target sector (a) optimum control arrays locations, (b) optimum liner impedance.
Fuselage sensors technique. Hybrid control, 2 control source arrays and 7 error sensors.
q I ( ( I I ( I I I I I I i I I { I I
maximum reduction in SPWL for the 40-155 ° sector (dB) :
pure ANC
1 controlarray
2.03
2 controlarrays
4.3
hybrid control
1 control
array
7.3
2 controlarrays
9.6
O_ with sensors within the 40-70 and 125-155 deg. sectors
(a)
2.5 6.0 8.4 10.2
with sensors within the 40-70 deg. sector only
(b)
Figure 2.13: Maximum reduction in sound power level for the target sector with the fuselage sensor technique
(a) error sensors in the far field of the inlet and outlet, (b) error sensors in the far field of the outlet.
i I I I t I I I ! l ( I I I I I I ( l
Sound power level reduction for the :
40-1 55 deg. sector
0
8o
I¢O 1O
"O
04 0
-1
-1 0 1
(a)
(dB)5.03.62.10.7
-0.7-2.1-3.6-5.0
40-70 I. 1 5-155 deq
0
-1
-1 0 1 -1 0
(b) I rst control array location (m) (c)
sector
(dB)7.15.13.01.0
-1.0-3.0-5.1-7.1
Figure 2.14: Sound power level reduction for the (a) target sector, (b) 40-70 deg. sector, (c) 125-155 deg. sector with
the fuselage sensor technique. Control of inlet and outlet radiation. Pure ANC, 2 control source arrays.
I { I I I I I I I I I I I I I I I I I
control of the inlet radiation
ASPW L(125-155) ° AS PW L(40-155) °
0
O-1
O -1 0 1 -1 0 1l
>, (a) (b)
control of inlet and outlet radiation
125-155 o ASPWL(40-155) °
¢:O
"O
-1
0
-1
(dB)10.2
7.3
4.41.5
-1.5
-4.4-7.3
-10.2
10.2
7.34.4
1.5-1.5
-4.4-7.3
-10.2
-1 0 -" 0
1 rst control array (m)(c) (d)
Figure 2.15: Reduction in sound power level with control of inlet radiation (a) for the 125-155 deg. sector,
(b) for the target sector, and with control of inlet and outlet radiation (c) for the 125-155 deg. sector,
(d) tbr the target sector. Fuselage sensors technique, optimum liner, 2 control source arrays.
I I I I I t i I I I I I I t t I I r
_D
i i
AZduct inlet
lW L-J L.-I ............ L-I L-I
IIZ
P(Z1) P(Z2) ............P(ZN,,)
KZ
• ,....-
I I I
control sourcearray
p((:]:))= Z p(Zn) eiKzn_7.
sources
Figure 2.16: System schematic for the wavenumber sensors technique.
I I I I I I I i I I I I I I 1 I 1 f I
Sound power level reduction
30 0-40 deg. sector
"- 20'Ev
0
3O
-1 0 1
70-90 deg. sector
(a)
3O40-1 55 deg. sector
2O
10
- 0 1 -' 2
control array location (m)(b) (c)
dB
Figure 2.17: Sound power level reduction for the (a) 0-40 deg. sector, (b) 70-90 deg. sector, (c) target sectorusing the wavenumber technique. Pure ANC, 4 inlet sensors, resolution= 41.8 m -I.
I I I I I I I I i I I I I I I I _ I I
30
A
10
Sound power level reduction
3O
A
I:: 20
10
0-40 deg. sector
-1 0 I
(a)
dB
2.0
1.40.9
0.3-0.3-0.9
-1.4-2.0
70-90 deg. sector 30 40-155 deg. sector
20
10
-1 0 1 -1 0
control array location (m)(b) (c)
Figure 2.18: Sound power level reduction for the (a) 0-40 deg. sector, (b) 70-90 deg. sector, (c) target sectorusing the wavenumber technique. Pure ANC, 6 inlet sensors, resolution= 12.56 m -1.
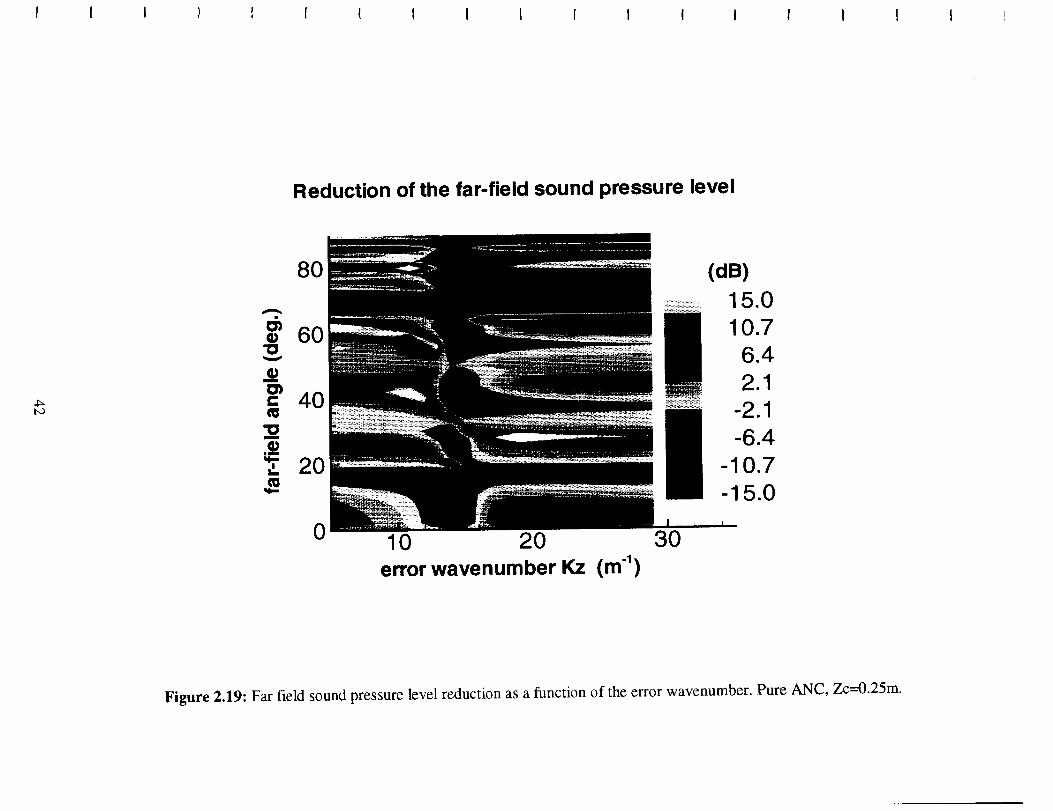
I I I 1 _ I I I I I I I I I I I I I !
Reduction of the far-field sound pressure level
4_to
8O
60"0
m
0'}c 40
"0m
'Z 2O
0 10 20error wavenumber Kz (m -1 )
30
(dB)15.0
10.76.4
2.1-2.1
-6.4
-10.7
-15.0
Figure 2.19: Far field sound pressure level reduction as a function of the error wavenumber. Pure ANC, Zc=0.25m.
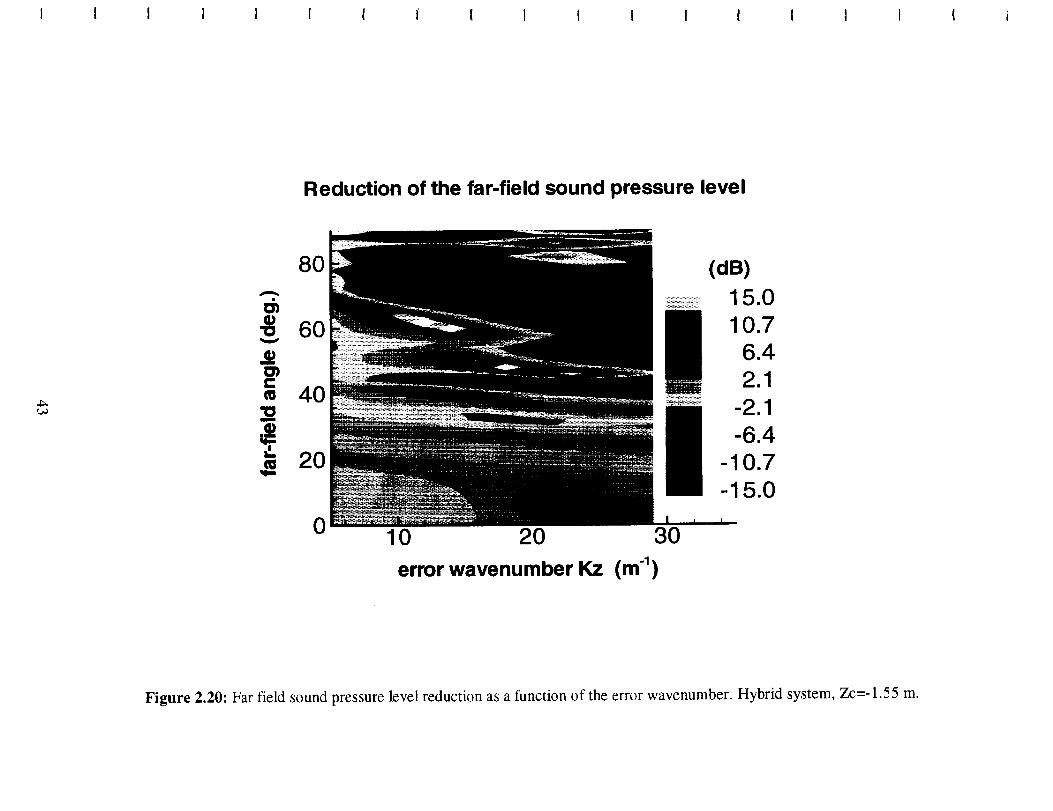
I I I ! 1 I I I' I 1 l I I I I I I ! I
Reduction of the far-field sound pressure level
4_
8O
5_60
0'1
40..aIll
20
0 10 20 30
error wavenumber Kz (m"_)
(dB)15.010.7
6.42.1
-2.1-6.4
-10.7-15.0
Figure 2.20: Far field sound pressure level reduction as a function of the error wavenumber. Hybrid system, Zc=-1.55 m.
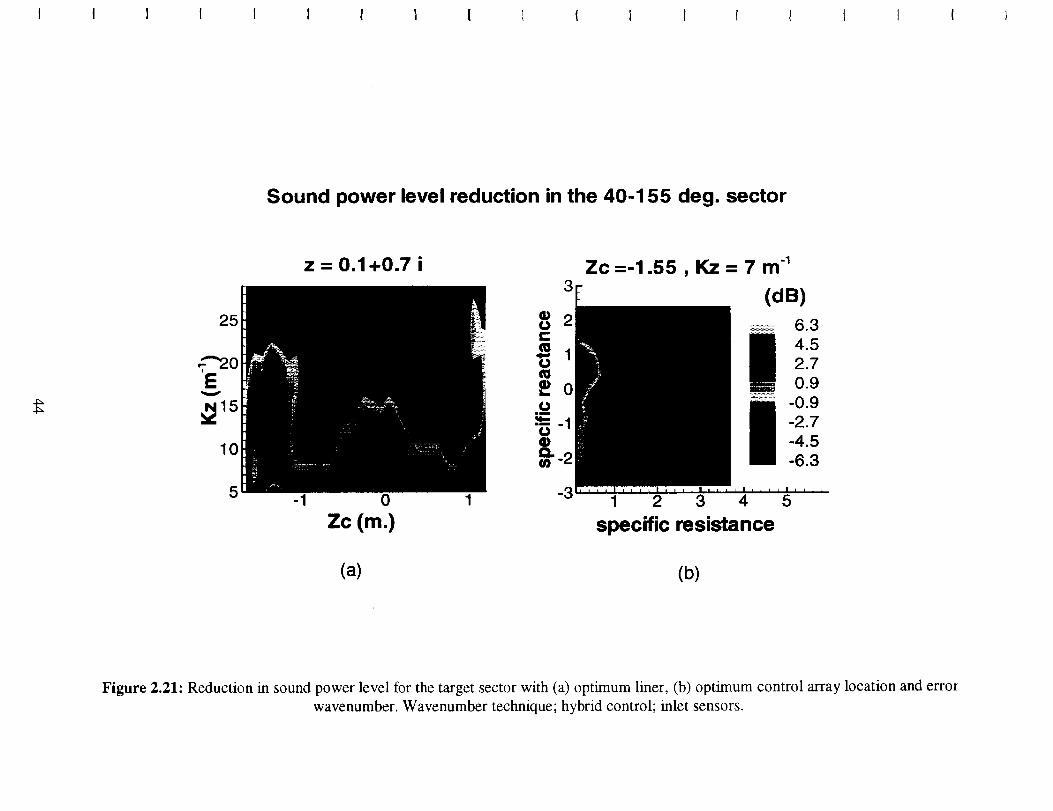
I I I 1 1 I I I I i ( 1 I I l _ I I }
Sound power level reduction in the 40-155 deg. sector
z = 0.1+0.7 i3
Zc =-1.55 , Kz=7m -1
(dB)
................................63
4.5
2.7
0.9
-0.9
-2.7
-4.5
-6.3
5 -1 0 1 -3 1 2 3 4 5
ZC (m.) specific resistance
(a) (b)
Figure 2.21: Reduction in sound power level for the target sector with (a) optimum liner, (b) optimum control array location and error
wavenumber. Wavenumber technique; hybrid control; inlet sensors.
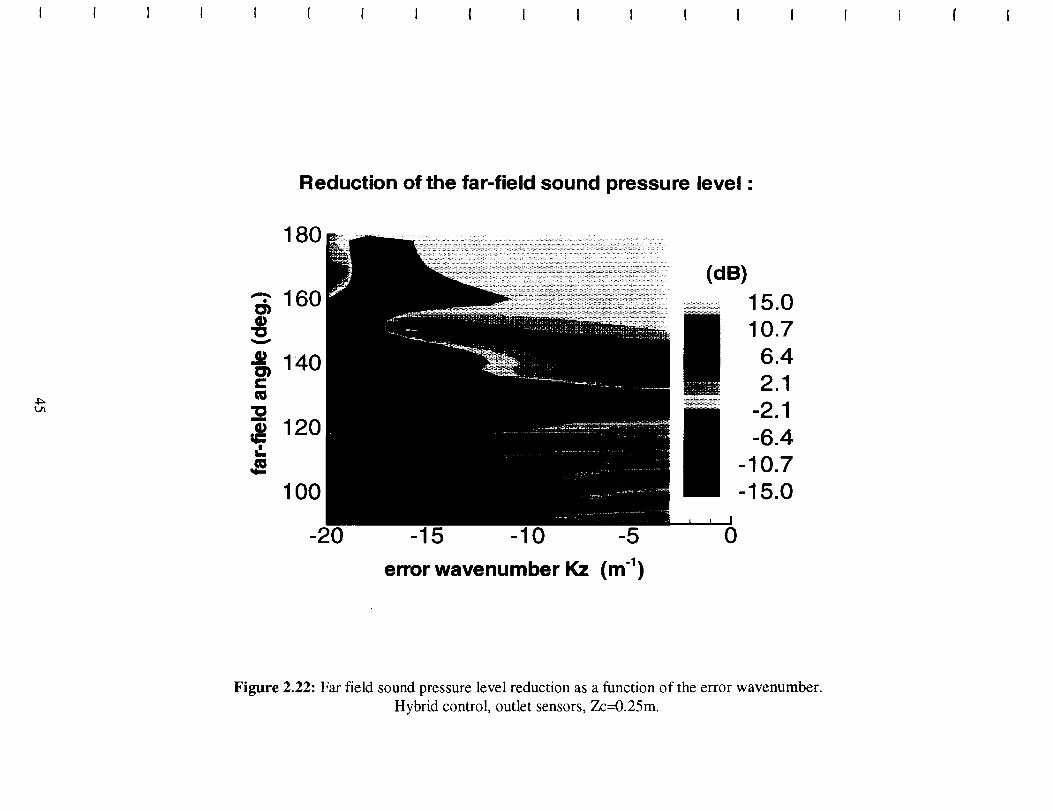
I I I I I I l I l I I I I I I I i ( I
Reduction of the far-field sound pressure level :
4_tj_
180
qD
140¢,,¢g
qD
120=,L
100
-20 -15 -10 -5 0
error wavenumber Kz (m"1)
Figure 2.22: Far field sound pressure level reduction as a function of the error wavenumber.
Hybrid control, outlet sensors, Zc--0.25m.
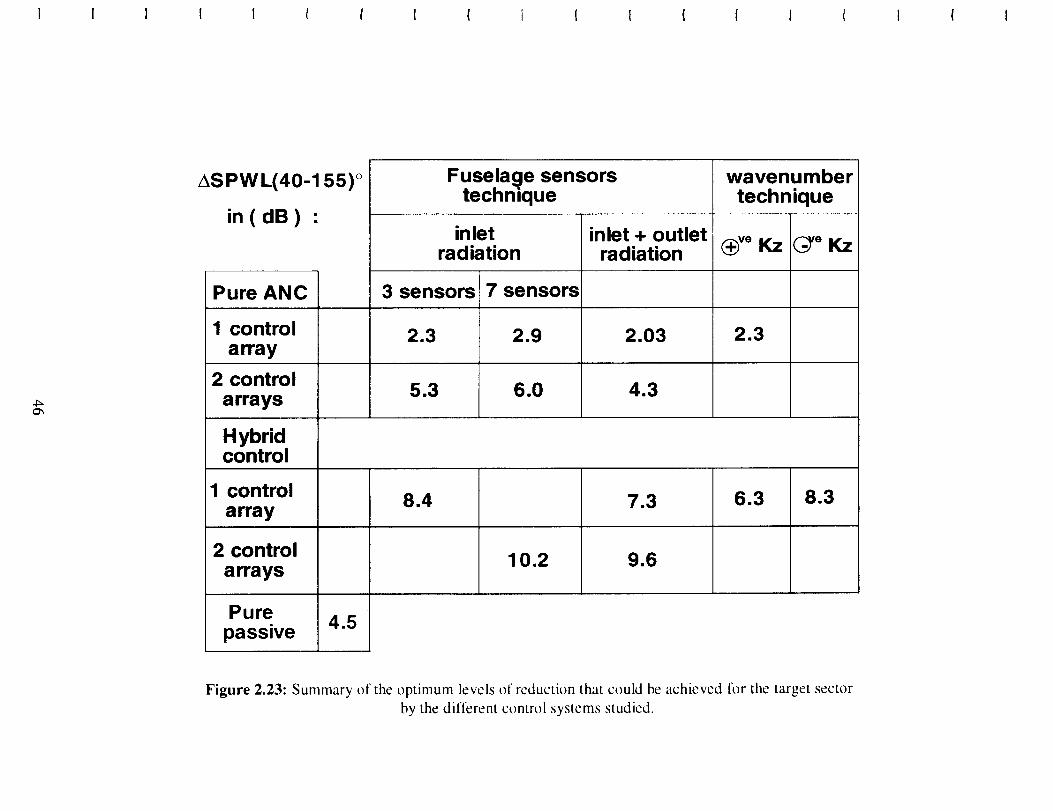
I I I I I { t I l 1 l I l [ + [ I ( I
CPs
XSPWL(40-155) °
in ( dB ) :
Pure ANC
1 control
array
2 control
arrays
Hybridcontrol
1 controlarray
2 control
arrays
Pure
passive4.!
Fuselage sensorstechnique
inletradiation
3 sensors
2.3
5.3
7 sensors
2.9
6.0
inlet + outletradiation
2.03
4.3
wavenumbertechnique
_ve Kz
2.3
_e Kz
8.4
10.2
7.3
9,6
6.3 8.3
Figure 2.23: Summary of the optimum levels of reduction that could be achieved for the target sector
by the different control systems studied.
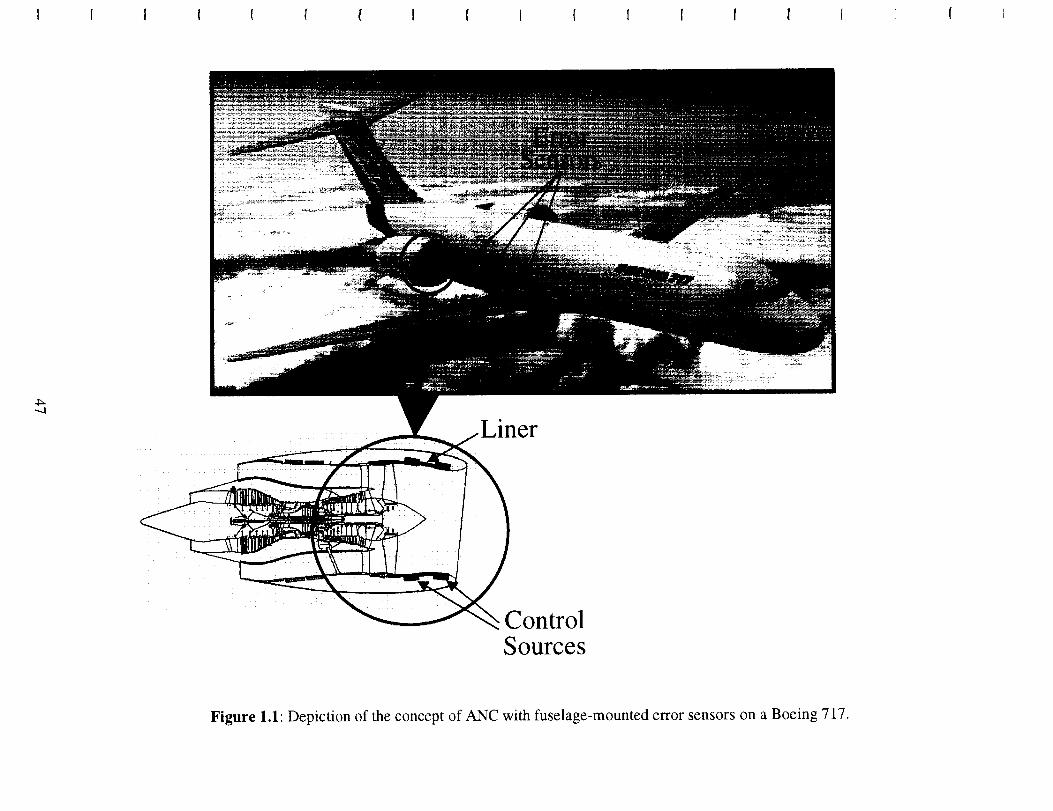
I I I I I t 1 I I I { I [ [ ! I i [ I
......1
Liner
ControlSources
Figure 1.1: Depiction of the concept of ANC with fuselage-mounted error sensors on a Boeing 717.
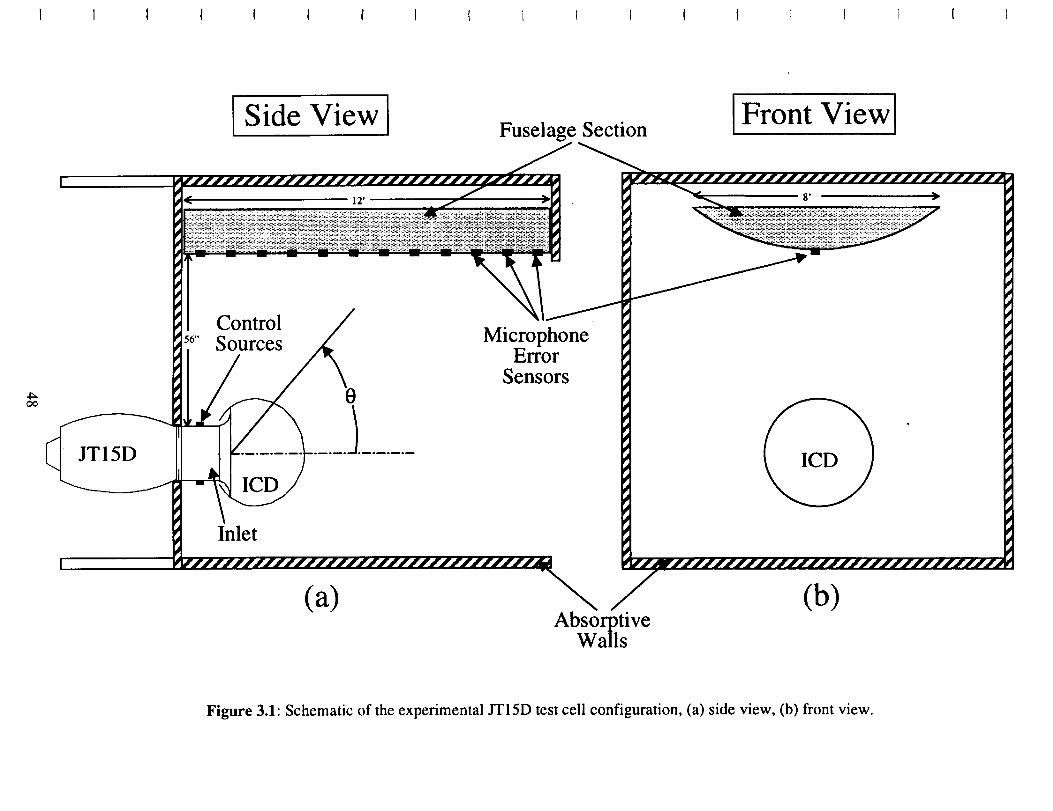
I I ; I ( I I I I i { i ( I
JSide View IFuselage Section
IFront View]
4_Oo
JT15D
ControlSources
ICD
Inlet
(a)
MicrophoneError
Sensors
AbsorptiveWalls
(b)
Figure 3.1" Schematic of the experimental JT15D test cell configuration, (a) side view, (b) front view.
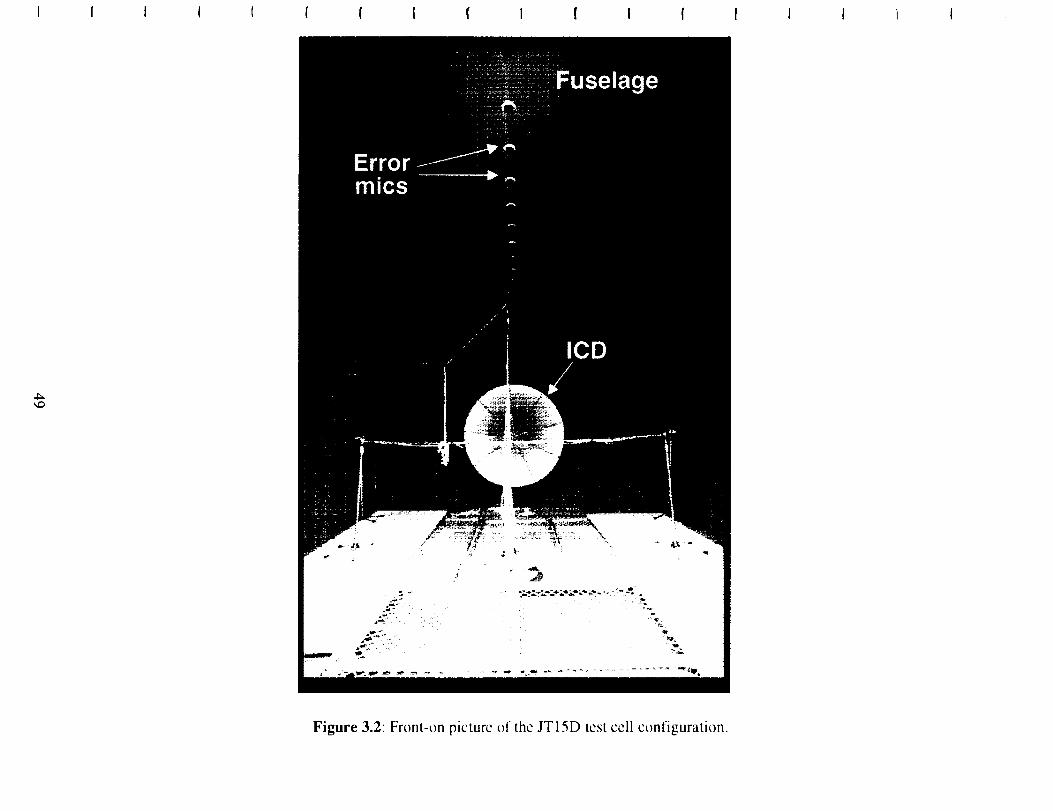
I I i I t I I I _ I I l I I J I i I !
Figure 3.2: Front-on picture of the JT15D test cell configuration.
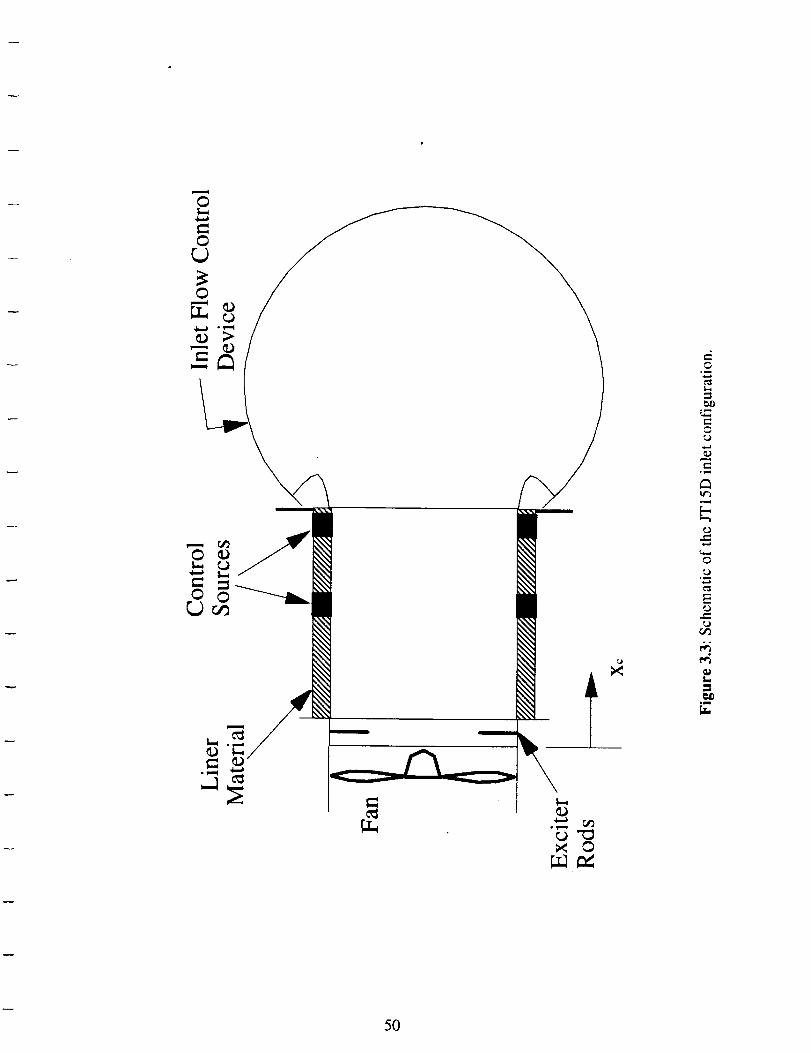
\
°_
tN
m
o_-,i
Lrl
.Bj
0
._
E
I.=_0
Qm
50
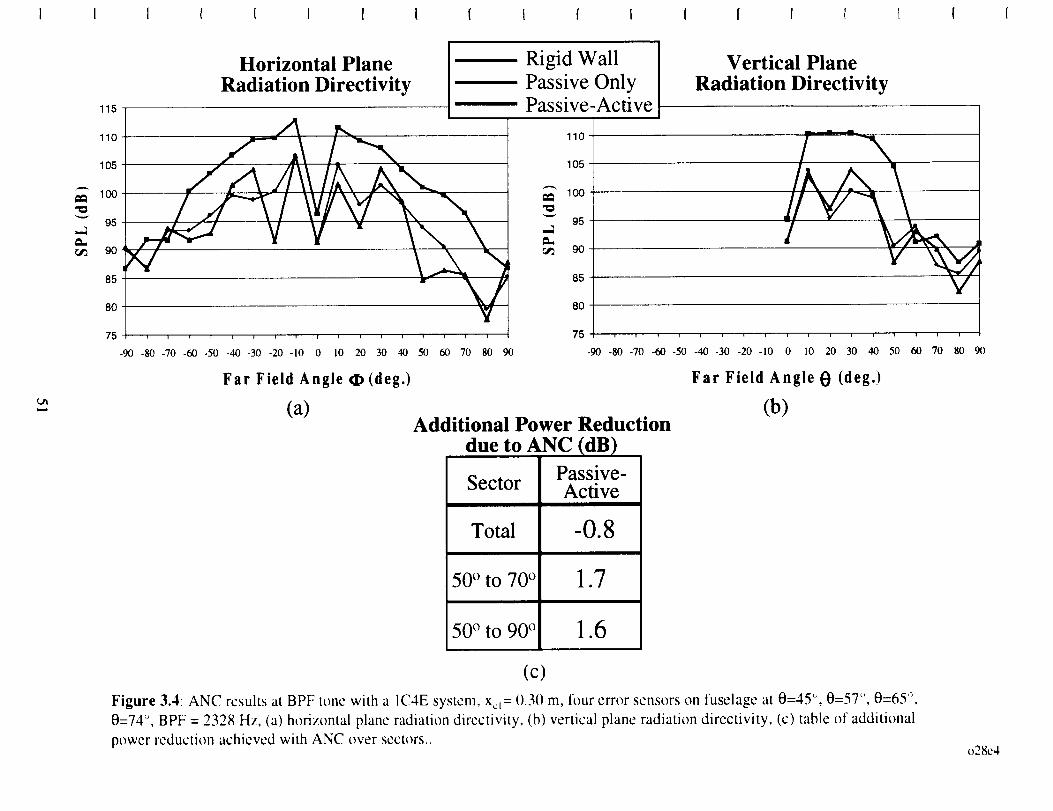
I I I I I Z I I [ I f I I I I I 1 I (
115
110
105
gsra_ 9O
8O
75
Horizontal Plane
Radiation Directivity
V V "
" \!I u I i u i i i i i u i i v i I u
-90 -80 -70 -60 -50 -40 -30 -20 -10 0 10 20 30 40 50 60 70 80 90
Far Field Angle _ (dog.)
Rigid Wall
Passive OnlyPassive-Active
Vertical Plane
Radiation Directivity
110
105
_1 100
95
r,_ 9O
85
8O
75 u i f i i i i i
-90 -80 -70 -60 -50 -40 -30 -20 -10
u i u i i i i i
0 10 20 30 40 50 60 70 80 90
Far Field Angle 0 (dog.)
(a) (b)Additional Power Reduction
due to ANC (dB)
Sector
Total
50 ° to 70 °
50 ° to 90 °
Passive-Active
1.7
1.6
(c)
Figure 3.4: ANC results at BPF tone with a IC4E system, x_= ().3() m, four error sensors on fuselage at 0=45 °, 0=57", 0=65 '_,
0=74 °, BPF = 2328 Hz, (a) horizontal plane radiation dircctivity, (b) vertical plane radiation directivity, (c) table of additional
power reduction achieved with ANC over sectors..o28c4
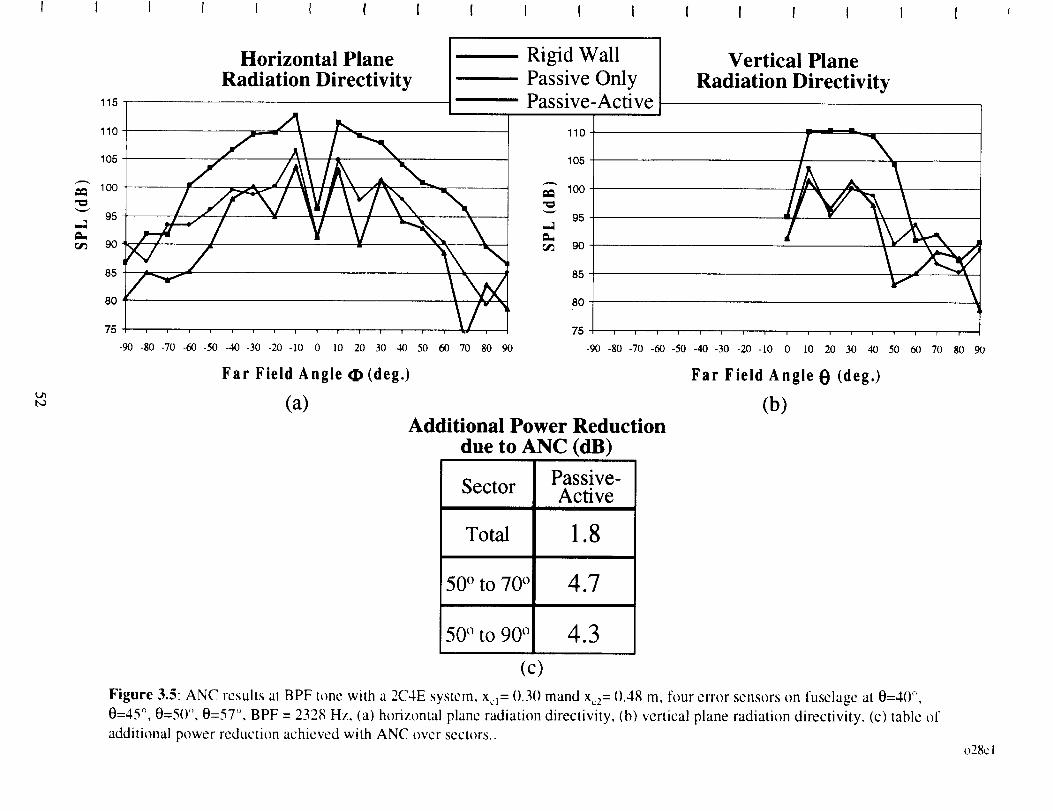
I I I { ( I I I I 1 ! I { I I I I I I
UIt,O
115
110
105
_ 95_ 90
85
80
75
Horizontal Plane
Radiation Directivity
i i i i i i 4- i
-90 -80 -70 -60 -50 -40 -30 -20 -10 0 10 20 30 40 50 60 70 80 90
Rigid WallPassive OnlyPassive-Active
Far Field Angle _ (deg.)
(a)
,d¢1.ra_
Vertical Plane
Radiation Directivity
110
105
100
95
9O
85
8O
75
J/V \
i i i i i i i i i i i I u _ i i i
-90-80-70-60-50-40-30-20-10 0 I0 20 30 40 50 60 70 80 90
Far Field Angle e (deg.)
(b)Additional Power Reduction
due to ANC (dB)
Sector
Total
50 ° to 70 `)
50 ° to 90 °
(C
Passive-Active
1.8
4.7
4.3
Figure 3.5: ANC results at BPF tone with a 2C4E system, x_]= 0.30 mand x_z= 0.48 m, four error sensors on fuselage at 0=4() c',
0=45 °, 0=5() '_, 0=57 '_, BPF = 2328 Hz, (a) horizontal plane radiation directivity, (b) vertical plane radiation directivity, (c) table of
additional power reduction achieved with ANC over sectors..o28cl
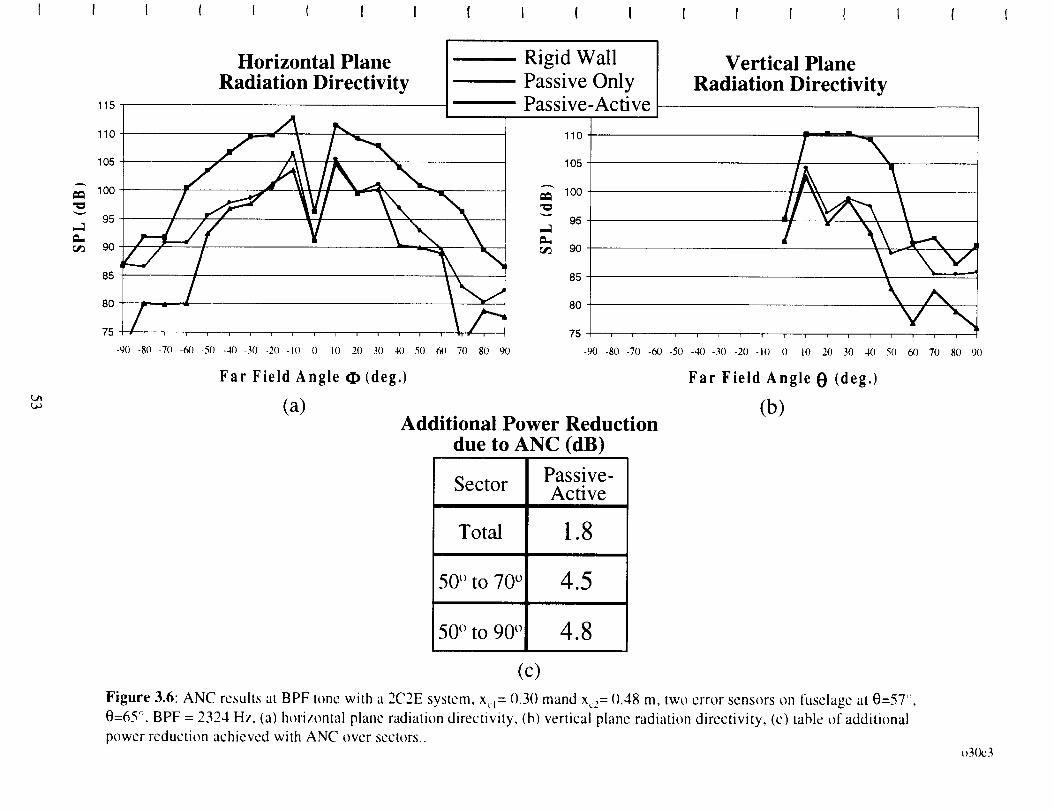
1 I I I ( { ! I [ I ! I I I I I I I I
115
110
105
1O0
95
90
85
80
75
Horizontal PlaneRadiation Directivity
W r\\
ili ............ \,/-,-90 -80 -70 -60 -50 -40 -30 -20 -10 0 lO 20 30 40 50 N) 70 80 90
Rigid WallPassive OnlyPassive-Active
Far Field Angle _ (deg.)
,d
Vertical PlaneRadiation Directivity
110
105
100
95
90
85
80
75 r i 1 i i i i i i i i i i i i i i
-90 -8(I -70 -60 -50 -40 -30 -20 -10 0 10 20 30 4(I 5(I 60 70 80 90
Far Field Angle 0 (deg.)
(a) (b)Additional Power Reduction
due to ANC (dB)
Sector
Total
50 ° to 70 °
50" to 90 °
Passive-Active
1.8
4.5
4.8
(c)Figure 3.6: ANC results at BPF tone with a 2C2E system, x_j= 0.3() mand x,_z= 0.48 m, two error sensors on fuselage at 0=5T _,
0=65_L BPF = 2324 Hz, (a) horizontal plane radiation directivity. (b) vertical plane radiation directivity, (c) table of additional
power reduction achieved with ANC over sectors..o30c3
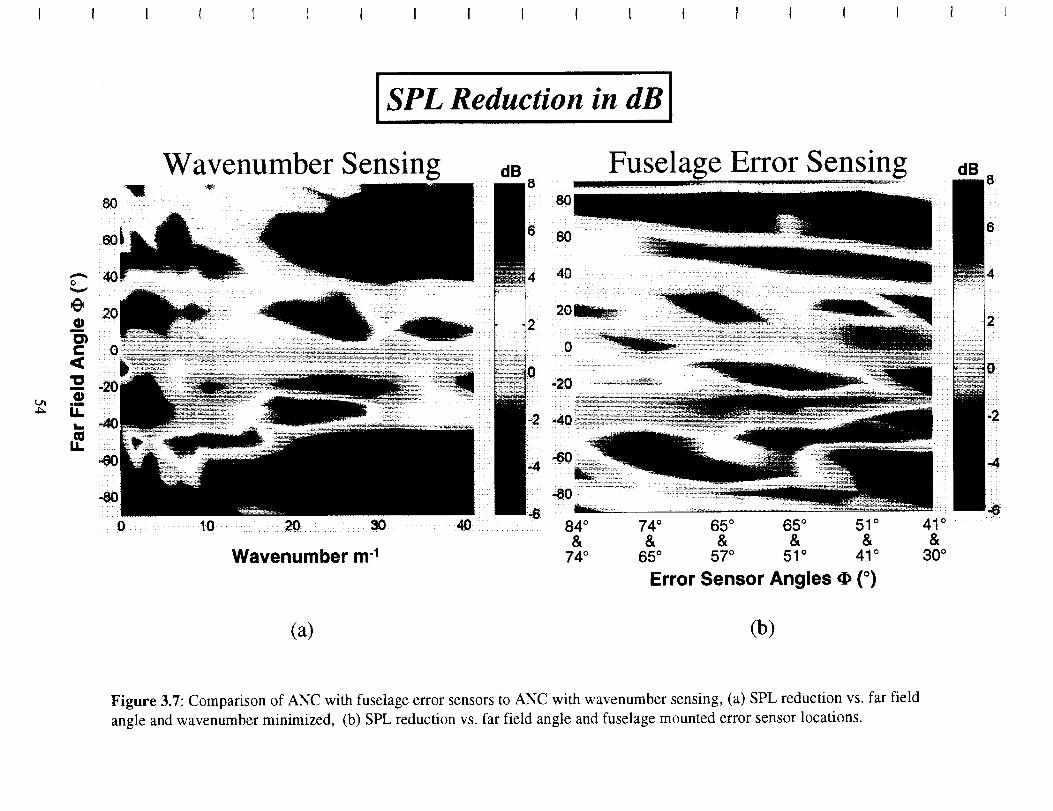
I I I ( I ( t I I I ( I { t I I I _ I
ISPL Reduction in dBI
L_4_
o
om
¢-<
=l
U.
mIJ.
t8O
Wavenumber Sensing dB
40 4
r I
20 .....
_0
,40
6 60
Fuselage Error Sensing
0 1-0 20 30 40 84 ° 74 ° 65 ° 65 ° 51 °& & & & &
Wavenumber m"1 74 ° 65 ° 57 ° 51 ° 41 °
Error Sensor Angles • (o)
41 °&
30 °
dB
(a) (b)
Figure 3.7: Comparison of ANC with fuselage error sensors to ANC with wavenumber sensing, (a) SPL reduction vs. far field
angle and wavenumber minimized, (b) SPL reduction vs. far field angle and fuselage mounted error sensor locations.
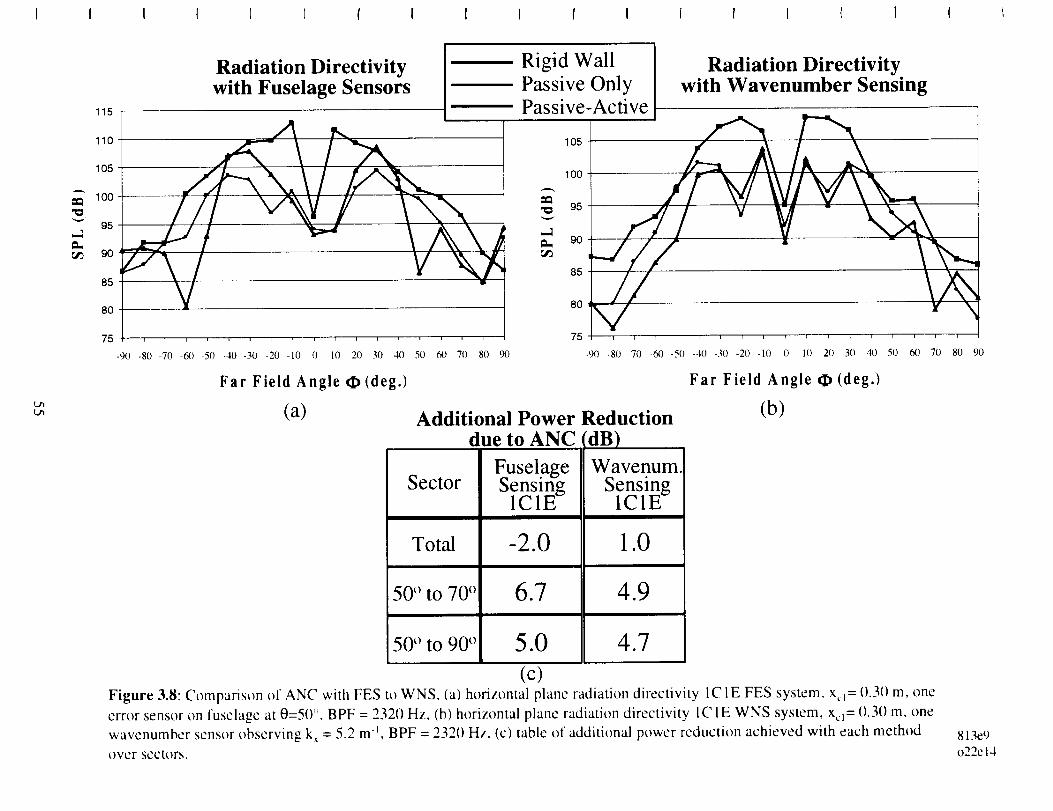
I I I ( { ( ( I I ( I I ( I I I I ( t
L/'ILm
115
110
105
100
_ 9sr_ 90
85
80
75
Radiation Directivitywith Fuselage Sensors
, i i , i , i _ i i i , , _ _ i i
-90 -80 -70 -60 -50 -40 -30 20 -10 0 10 20 30 40 50 60 70 80 90
Rigid Wall Radiation DirectivityPassive Only with Wavenumber SensingPassive-Active
105
loo k
85
80 _/ y \
,%,75 .............
•90 -80 -70 -60 -50 -40 -30 -20 -10 0 10 20 30 40
Far Field Angle _ (deg.)
(a) Additional Power Reduction
Sector
Total
50 ° to 70 °
50 ° to 90 °
due to ANC
FuselageSensing
1CIE
-2.0
6.7
5.0
(c)
riB)
Wavenum.Sensing
IC1E
1.0
4.9
4.7
Far Field Angle _ (deg.)
(b)
Figure 3.8: Comparison of ANC with FES to WNS, (a) horizontal plane radiation directivity ICIE FES system, x._= ().3()ITI, one
error sensor on fuselage at 0=50% BPF = 232() Hz, (b) horizontal plane radiation directivity IC 1E WNS system, x_l= 0.30 m, one
wavenumber sensor observing k, = 5.2 m l, BPF = 2320 Hz, (c) table of additional power reduction achieved with each method
over sectors.
I i i i
50 60 70 80 90
813e9
o22e 14
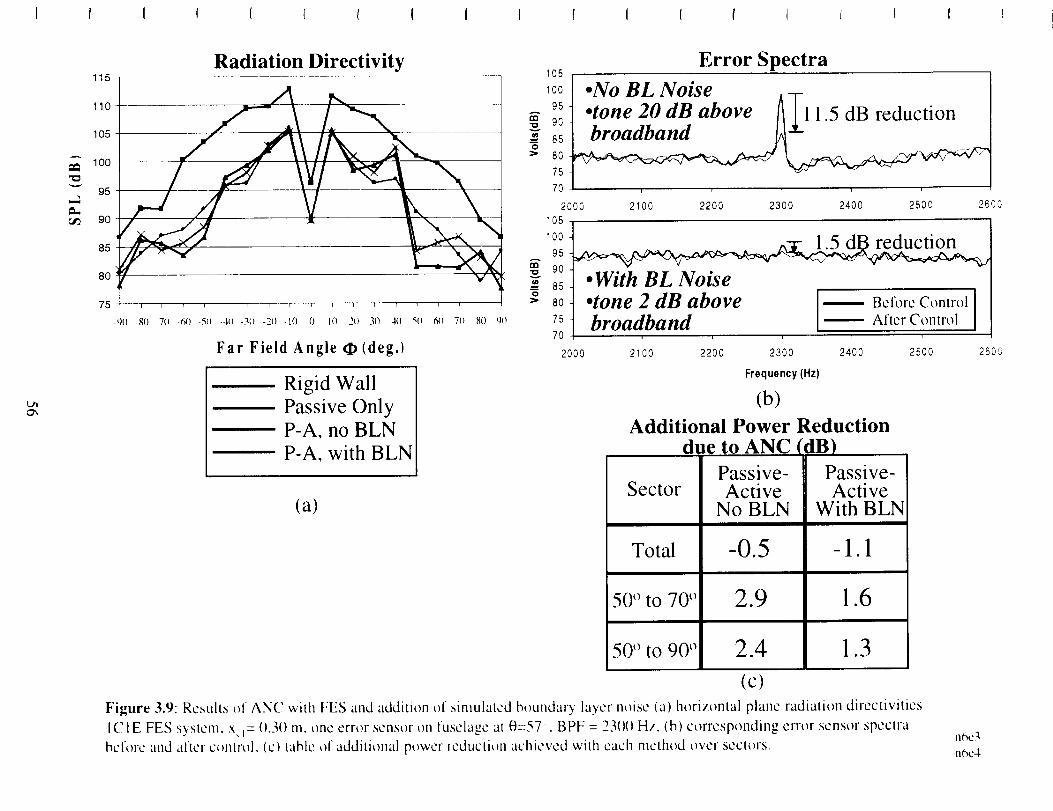
I t I I ( ( l I I I ( I I I I t I ( t
L_
A
115
110
105
100
95
9O
85
8O
75
Radiation Directivity
f v
i i T i i i i i _ i i i _ i i i
-90 -80 7(} -60 -50 -40 -30 -20 -lO 0 10 2O 3(.) 4O 50 60 71)
Far Field Angle O(deg.)
Rigid Wall
Passive Only
P-A, no BLN
P-A, with BLN
i
80 (}()
(a)
105
100
95
9086
O
80
75
70
2000
0
Error Spectra
105
•No BL Noisel T
•tone 20 dB above lll.S dB reduction
broadband __t_ "
i i i i i
2100 2200 2300 2400 2500 26OO
10095t "lv,5 d reduction9O
85
8o _ Before Control
75 _ After Control70
• With BL Noise•tone 2 dB abovebroadband
2000
) i i i i
2100 2200 2300 2400 2500
Frequency (Hz)
(b)
Additional Power Reductiondue to ANC
Sector
Total
50 ° to 70 °
50 ° to 90 °
Passive-Active
No BLN
2.9
2.4
tB)
Passive-Active
With BLN
-1.1
1.6
1.3
12600
(c)Figure 3.9: Results of AN(' with FES and addition of simulated houndal T layer noise (a) horizontal plane radiation directivitics
IC IE FES system, x _= ().3() m, one error sensor on fuselage at (0=57 '. BPF = 23()() H/, (b) corresponding error sensor spectra
before and after control, (c) table of additional power reduction achieved witta each method over sectors.he, c3
n6c4


