

Added Sugar, Subtracted Science How Industry Obscures Science and Undermines
Public Health Policy on Sugar www.ucsusa.org/addedsugar
Appendix C: Lobbying and Political
Contribution Analysis
© June 2014
All rights reserved

UNION OF CONCERNED SCIENTISTS | CENTER FOR SCIENCE AND DEMOCRACY 1
Methodology
Lobbying data was analyzed for the years 2007-2013. Political spending data is available in two-year cycles and
data for the years 2006-2014 was analyzed. During this time period, several food policy discussions around sugar
consumption took place at the national level.
To identify a subset of important actors, companies were examined that had a significant interest in sugar and
lobbied on the Healthy, Hunger Free Kids Act of 2010, a piece of legislation that directly addressed sugar
consumption in schools. Additionally, trade associations heavily engaged in science and policy around sugar were
scrutinized. This information can be found in Table C.1.
Companies and associations analyzed included:
American Beverage Association
Campbell Soup Company
Coca-Cola Company
Corn Refiners Association
Del Monte Corporation
General Mills
Grocery Manufacturers Association
Hershey Company
Kraft Foods
Mars
Mondelēz International
National Confectioners Association
Nestlé
PepsiCo
Snack Food Association.
In 2012, Kraft Foods Group Inc. formed from a demerger with Kraft Foods Inc which was renamed Mondelēz
International. Data in the tables and graphs below labeled “Kraft Foods” contains information from Kraft Foods
Inc. from 2007-2011 and Kraft Foods Group Inc from 2012-2013. Though the Sugar Association was active in
other ways on relevant policy debates during this time, it reported no lobbying between 2007 and 2013.
Data for all political contributions analyzed was obtained from the Center for Responsive Politics (CRP) (CRP
2014). Donations analyzed include those to members of Congress on the 2010 Senate Committee on Agriculture,
Nutrition, and Forestry as well as the House Committee on Education and Labor (the Committee on Education
and the Workforce as of January 2011) from the companies and associations listed above for 2006-2014. These
2 CENTER FOR SCIENCE AND DEMOCRACY | UNION OF CONCERNED SCIENTISTS
two committees were the primary ones responsible for handling the Healthy Hunger Free Kids Act and
companion legislation in 2010. All data is displayed in Table C.2-3 and in Figures C.1-10 below.
Lobbying Data
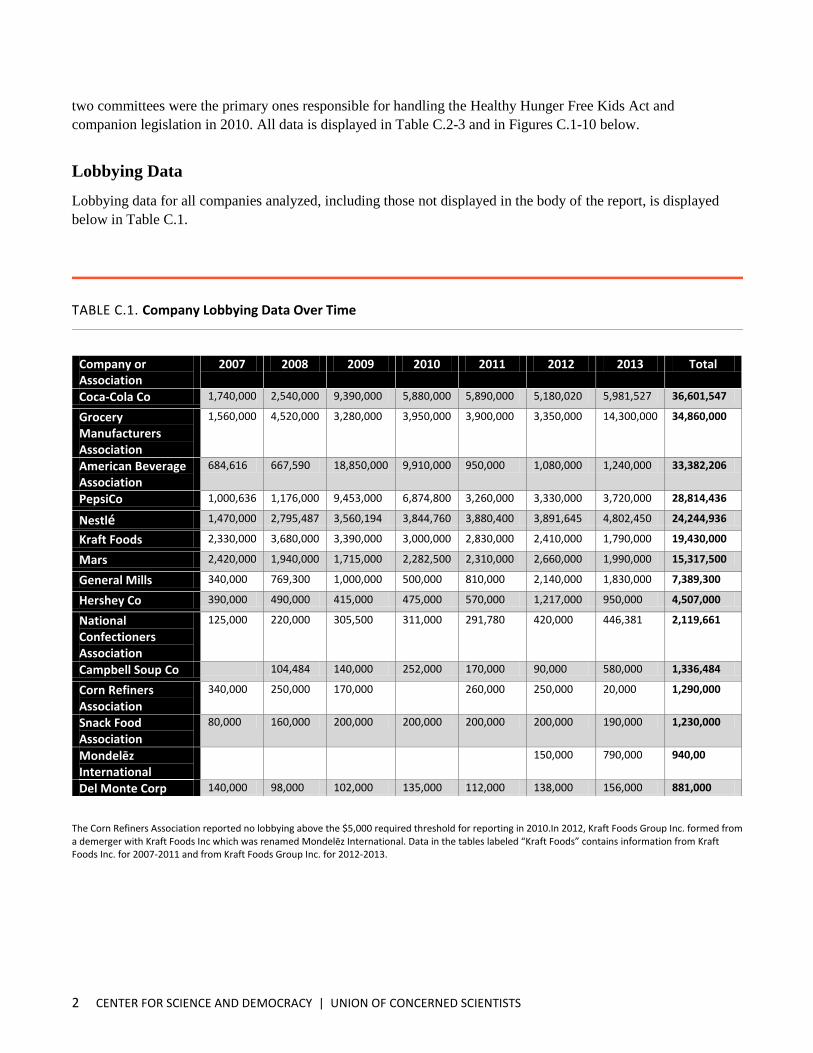
Lobbying data for all companies analyzed, including those not displayed in the body of the report, is displayed
below in Table C.1.
TABLE C.1. Company Lobbying Data Over Time
Company or Association
2007 2008 2009 2010 2011 2012 2013 Total
Coca-Cola Co 1,740,000 2,540,000 9,390,000 5,880,000 5,890,000 5,180,020 5,981,527 36,601,547
Grocery Manufacturers Association
1,560,000 4,520,000 3,280,000 3,950,000 3,900,000 3,350,000 14,300,000 34,860,000
American Beverage Association
684,616 667,590 18,850,000 9,910,000 950,000 1,080,000 1,240,000 33,382,206
PepsiCo 1,000,636 1,176,000 9,453,000 6,874,800 3,260,000 3,330,000 3,720,000 28,814,436
Nestlé 1,470,000 2,795,487 3,560,194 3,844,760 3,880,400 3,891,645 4,802,450 24,244,936
Kraft Foods 2,330,000 3,680,000 3,390,000 3,000,000 2,830,000 2,410,000 1,790,000 19,430,000
Mars 2,420,000 1,940,000 1,715,000 2,282,500 2,310,000 2,660,000 1,990,000 15,317,500
General Mills 340,000 769,300 1,000,000 500,000 810,000 2,140,000 1,830,000 7,389,300
Hershey Co 390,000 490,000 415,000 475,000 570,000 1,217,000 950,000 4,507,000
National Confectioners Association
125,000 220,000 305,500 311,000 291,780 420,000 446,381 2,119,661
Campbell Soup Co 104,484 140,000 252,000 170,000 90,000 580,000 1,336,484
Corn Refiners Association
340,000 250,000 170,000 260,000 250,000 20,000 1,290,000
Snack Food Association
80,000 160,000 200,000 200,000 200,000 200,000 190,000 1,230,000
Mondelēz International
150,000 790,000 940,0 0
Del Monte Corp 140,000 98,000 102,000 135,000 112,000 138,000 156,000 881,000
The Corn Refiners Association reported no lobbying above the $5,000 required threshold for reporting in 2010.In 2012, Kraft Foods Group Inc. formed from a demerger with Kraft Foods Inc which was renamed Mondelēz International. Data in the tables labeled “Kraft Foods” contains information from Kraft Foods Inc. for 2007-2011 and from Kraft Foods Group Inc. for 2012-2013.

UNION OF CONCERNED SCIENTISTS | CENTER FOR SCIENCE AND DEMOCRACY 3
Political Contributions
Political contributions for relevant members of the House and Senate are displayed below in Tables C.2-3 and
Figures C.1-10.
Senate Committee on Agriculture, Nutrition, and Forestry
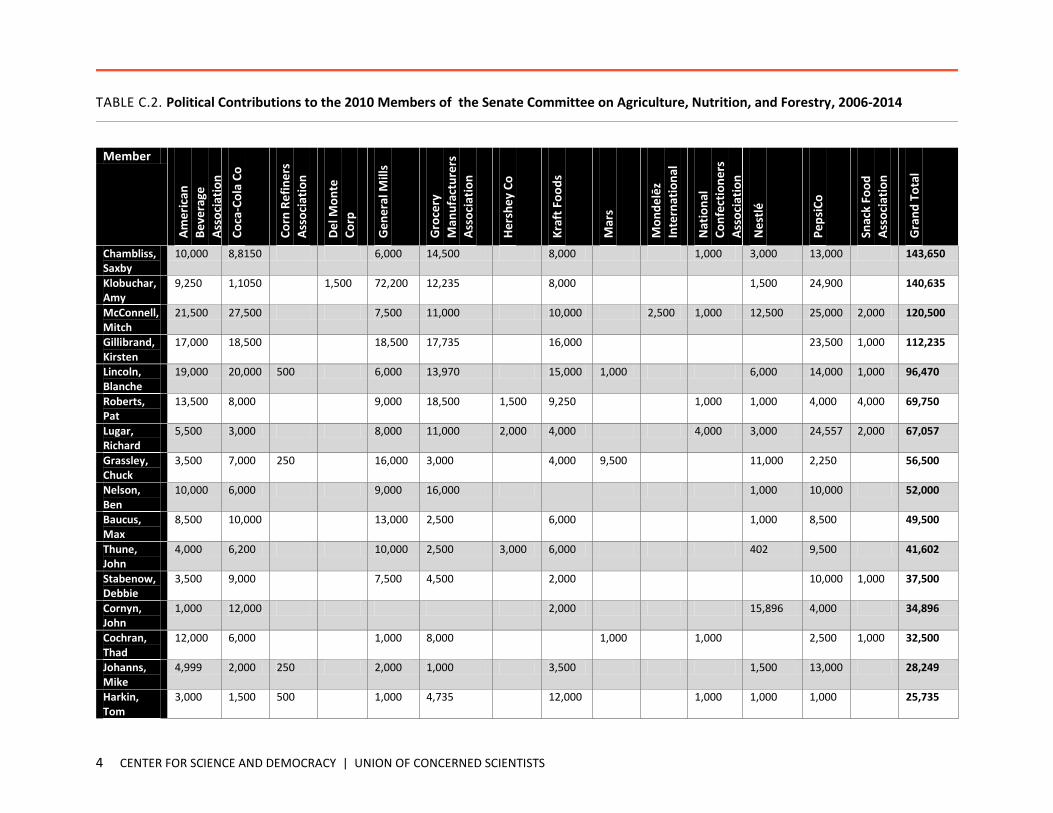
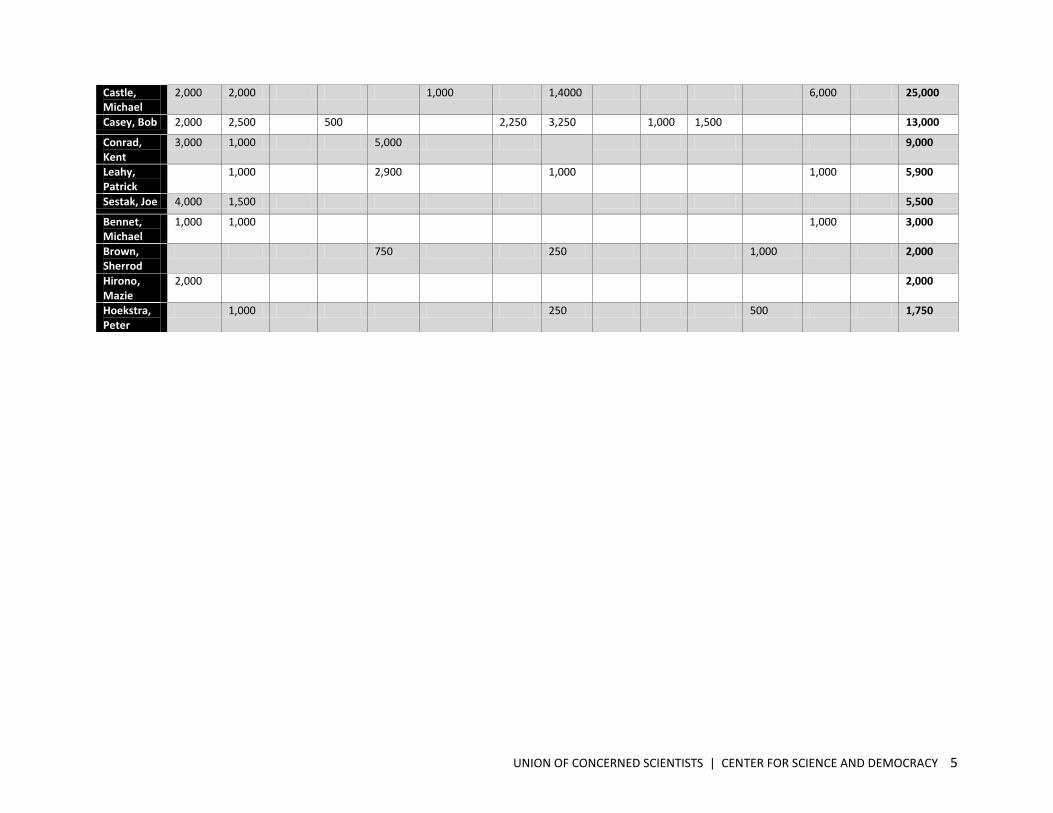
The political contributions to members of the Senate Committee on Agriculture, Nutrition, and Forestry in 2010
by the companies and associations of interest are shown below in Table C.2.
Graphs of political contributions received by individual members are shown in Figures C.1-6 for all members on
the Senate Committee on Agriculture, Nutrition, and Forestry in 2010 who received over 30,000 in one cycle
from the sugar interests identified. These members were Saxby Chambliss, Kristen Gillibrand, Amy Klobuchar,
Blanche Lincoln, Mitch McConnell, Pat Roberts, and Debbie Stabenow. Blanche Lincoln’s political contribution
data is displayed in Figure 3 of the main report.
4 CENTER FOR SCIENCE AND DEMOCRACY | UNION OF CONCERNED SCIENTISTS
TABLE C.2. Political Contributions to the 2010 Members of the Senate Committee on Agriculture, Nutrition, and Forestry, 2006-2014
Member
Am
eri
can
Be
vera
ge
Ass
oci
atio
n
Co
ca-C
ola
Co
Co
rn R
efi
ne
rs
Ass
oci
atio
n
De
l Mo
nte
Co
rp
Ge
ne
ral M
ills
Gro
cery
Man
ufa
ctu
rers
Ass
oci
atio
n
He
rsh
ey
Co
Kra
ft F
oo
ds
Mar
s
Mo
nd
elē
z
Inte
rnat
ion
al
Nat
ion
al
Co
nfe
ctio
ne
rs
Ass
oci
atio
n
Ne
stlé
Pe
psi
Co
Snac
k Fo
od
Ass
oci
atio
n
Gra
nd
To
tal
Chambliss, Saxby
10,000 8,8150 6,000 14,500 8,000 1,000 3,000 13,000 143,650
Klobuchar, Amy
9,250 1,1050 1,500 72,200 12,235 8,000 1,500 24,900 140,635
McConnell, Mitch
21,500 27,500 7,500 11,000 10,000 2,500 1,000 12,500 25,000 2,000 120,500
Gillibrand, Kirsten
17,000 18,500 18,500 17,735 16,000 23,500 1,000 112,235
Lincoln, Blanche
19,000 20,000 500 6,000 13,970 15,000 1,000 6,000 14,000 1,000 96,470
Roberts, Pat
13,500 8,000 9,000 18,500 1,500 9,250 1,000 1,000 4,000 4,000 69,750
Lugar, Richard
5,500 3,000 8,000 11,000 2,000 4,000 4,000 3,000 24,557 2,000 67,057
Grassley, Chuck
3,500 7,000 250 16,000 3,000 4,000 9,500 11,000 2,250 56,500
Nelson, Ben
10,000 6,000 9,000 16,000 1,000 10,000 52,000
Baucus, Max
8,500 10,000 13,000 2,500 6,000 1,000 8,500 49,500
Thune, John
4,000 6,200 10,000 2,500 3,000 6,000 402 9,500 41,602
Stabenow, Debbie
3,500 9,000 7,500 4,500 2,000 10,000 1,000 37,500
Cornyn, John
1,000 12,000 2,000 15,896 4,000 34,896
Cochran, Thad
12,000 6,000 1,000 8,000 1,000 1,000 2,500 1,000 32,500
Johanns, Mike
4,999 2,000 250 2,000 1,000 3,500 1,500 13,000 28,249
Harkin, Tom
3,000 1,500 500 1,000 4,735 12,000 1,000 1,000 1,000 25,735
UNION OF CONCERNED SCIENTISTS | CENTER FOR SCIENCE AND DEMOCRACY 5
Castle, Michael
2,000 2,000 1,000 1,4000 6,000 25,000
Casey, Bob 2,000 2,500 500 2,250 3,250 1,000 1,500 13,000
Conrad, Kent
3,000 1,000 5,000 9,000
Leahy, Patrick
1,000 2,900 1,000 1,000 5,900
Sestak, Joe 4,000 1,500 5,500
Bennet, Michael
1,000 1,000 1,000 3,000
Brown, Sherrod
750 250 1,000 2,000
Hirono, Mazie
2,000 2,000
Hoekstra, Peter
1,000 250 500 1,750

6 CENTER FOR SCIENCE AND DEMOCRACY | UNION OF CONCERNED SCIENTISTS
FIGURE C.1: Political Contributions to Saxby Chambliss (R-GA)
CRP 2014
FIGURE C.2: Political Contributions to Kristen Gillibrand (D-NY)
CRP 2014
$0
$5,000
$10,000
$15,000
$20,000
$25,000
$30,000
2006 2008 2010 2012 2014
U.S
. D
oll
ars
Year
American Beverage Association
Coca-Cola Co
General Mills
Grocery Manufacturers Association
Kraft Foods
National Confectioners Association
Nestlé
PepsiCo
Snack Food Association
$0
$2,000
$4,000
$6,000
$8,000
$10,000
$12,000
$14,000
2006 2008 2010 2012 2014
U.S
. D
oll
ars
Year
American Beverage Association
Coca-Cola Co
General Mills
Grocery Manufacturers Association
Kraft Foods
PepsiCo
Snack Food Association

UNION OF CONCERNED SCIENTISTS | CENTER FOR SCIENCE AND DEMOCRACY 7
FIGURE C.3: Political Contributions to Amy Klobuchar (D-MN)
CRP 2014
FIGURE C.4: Political Contributions to Mitch McConnell (R-KY)
CRP 2014
$0
$5,000
$10,000
$15,000
$20,000
$25,000
$30,000
2006 2008 2010 2012 2014
U.S
. D
oll
ars
Year
American Beverage Association
Coca-Cola Co
Del Monte Corp
General Mills
Grocery Manufacturers Association
Kraft Foods
Nestlé
PepsiCo
$0
$1,000
$2,000
$3,000
$4,000
$5,000
$6,000
$7,000
$8,000
$9,000
$10,000
2004 2006 2008 2010 2012 2014
U.S
. D
oll
ars
Year
American Beverage Association
Coca-Cola Co
General Mills
Grocery Manufacturers Association
Kraft Foods
Mondelēz International
National Confectioners Association
Nestlé
PepsiCo
Snack Food Association

8 CENTER FOR SCIENCE AND DEMOCRACY | UNION OF CONCERNED SCIENTISTS
FIGURE C.5: Political Contributions to Pat Roberts (R-KS)
CRP 2014
FIGURE C.6: Political Contributions to Debbie Stabenow (D-MI)
CRP 2014
$0
$1,000
$2,000
$3,000
$4,000
$5,000
$6,000
$7,000
$8,000
$9,000
2004 2006 2008 2012 2014
U.S
. D
oll
ars
Year
American Beverage Association
Coca-Cola Co
General Mills
Grocery Manufacturers Association
Hershey Co
Kraft Foods
National Confectioners Association
Nestlé
PepsiCo
Snack Food Association
$0
$1,000
$2,000
$3,000
$4,000
$5,000
$6,000
$7,000
$8,000
$9,000
2008 2010 2012 2014
U.S
. D
oll
ars
Year
American Beverage Assn
Coca-Cola Co
General Mills
Grocery Manufacturers Association
Kraft Foods
PepsiCo
Snack Food Association

UNION OF CONCERNED SCIENTISTS | CENTER FOR SCIENCE AND DEMOCRACY 9
House Committee on Education and Labor
Political contributions to members of the House Committee on Education and Labor in 2010 by the companies
and associations of interest are shown in Table C.3.
Graphs of political contributions received by individual candidates are shown in Figures C.7-10 for all members
on the House Committee on Education and Labor in 2010 who received over 10,000 in one cycle from the sugar
interests identified.
These members were Judy Chu, Marcia Fudge, John Kline, and Tom Price.

10 CENTER FOR SCIENCE AND DEMOCRACY | UNION OF CONCERNED SCIENTISTS
TABLE C.3. Political Contributions to the 2010 Members of the House Committee on Education and Labor from 2006-2014
Member
Am
eri
can
B
eve
rage
Ass
oci
atio
n
Co
ca-C
ola
Co
Co
rn R
efi
ne
rs
Ass
oci
atio
n
De
l Mo
nte
Co
rp
Ge
ne
ral M
ills
Gro
cery
Man
ufa
ctu
rers
Ass
oci
atio
n
He
rsh
ey
Co
Kra
ft F
oo
ds
Mar
s
Mo
nd
el ē
z In
tern
atio
nal
Nat
ion
al
Co
nfe
ctio
ne
rs
Ass
oci
atio
n
Ne
stlé
Pe
psi
Co
Snac
k Fo
od
Ass
oci
atio
n
Gra
nd
To
tal
Kline, John 3,500 4,000 58,222 2,000 1,000 5,000 73,722
Fudge, Marcia 8,836 10,500 6,000 8,000 3,500 4,000 1,000 9,750 1,000 52,586
Price, Tom 2,000 32,000 34,000
Payne, Donald 2,000 2,000 7,300 4,000 1,500 4,500 21,300
Chu, Judy 13,400 13,400
Biggert, Judy 4,000 1,000 7,000 12,000
Miller, George 5,999 2,500 1,000 1,500 10,999
Wu, David 500 7,250 7,750
Hinojosa, Ruben 5,500 1,000 6,500
Clarke, Yvette 1,000 1,000 250 4,000 6,250
Loebsack, David 6,000 6,000
Altmire, Jason 2,500 1,000 2,000 5,500
Petri, Tom 2,000 3,500 5,500
Scott, Bobby 1,000 1,000 3,000 5,000
Guthrie, Brett 1,000 1,000 2,000 4,000
Courtney, Joe 1,500 2,000 3,500
Andrews, Robert 500 500 2,000 3,000
Bishop, Timothy 3,000 3,000
Grijalva, Raul 3,000 3,000
McKeon, Buck 1,000 1,000 1,000 3,000
Wilson, Joe 1,500 1,250 2,750
Souder, Mark 2,000 2,000
Thompson, Glenn 2,000 2,000
Titus, Dina 1,000 1,000 2,000

UNION OF CONCERNED SCIENTISTS | CENTER FOR SCIENCE AND DEMOCRACY 11
Platts, Todd 1,250 1,250
McCarthy, Carolyn 1,000 1,000
McMorris Rodgers, Cathy
1,000 1,000
Roe, Phil 1,000 1,000
Tierney, John 1,000 1,000
Tonko, Paul 1,000 1,000
McClintock, Tom 500 500
Kucinich, Dennis 250 250
Kildee, Dale 0

12 CENTER FOR SCIENCE AND DEMOCRACY | UNION OF CONCERNED SCIENTISTS
FIGURE C.7: Political Contributions to Judy Chu (D-CA)
CRP 2014
FIGURE C.8: Political Contributions to Marcia Fudge (D-OH)
CRP 2014
$0
$2,000
$4,000
$6,000
$8,000
$10,000
$12,000
$14,000
2010 2012
U.S
. D
oll
ars
Year
Coca-Cola Co
$0
$1,000
$2,000
$3,000
$4,000
$5,000
$6,000
$7,000
$8,000
2008 2010 2012 2014
U.S
. D
oll
ars
Year
American Beverage Association
Coca-Cola Co
General Mills
Grocery Manufacturers Association
Kraft Foods
National Confectioners Association
Nestlé
PepsiCo
Snack Food Association

UNION OF CONCERNED SCIENTISTS | CENTER FOR SCIENCE AND DEMOCRACY 13
FIGURE C.9: Political Contributions to John Kline (R-MN)
CRP 2014
FIGURE C.10: Political Contributions to Tom Price (R-GA)
CRP 2014
$0
$2,000
$4,000
$6,000
$8,000
$10,000
$12,000
$14,000
$16,000
2004 2006 2008 2010 2012 2014
U.S
. D
oll
ars
Year
American Beverage Association
Coca-Cola Co
General Mills
Grocery Manufacturers Association
Kraft Foods
PepsiCo
$0
$2,000
$4,000
$6,000
$8,000
$10,000
$12,000
2004 2006 2008 2010 2012 2014
U.S
. D
oll
ars
Year
American Beverage Association
Coca-Cola Co

14 CENTER FOR SCIENCE AND DEMOCRACY | UNION OF CONCERNED SCIENTISTS
[REFERENCES]
Center for Responsive Politics (CRP). 2014. Custom data query prepared for the Union of Concerned Scientists. February.
Washington, DC.


