

ADEQUACY OF PAEDIATRIC RENAL TRACT ULTRASOUND
REQUESTS AND REPORTS
Nishentha Govender
A research report submitted to the Faculty of Health Sciences,
University of the Witwatersrand, Johannesburg,
in partial fulfilment of the requirements for the degree of
Master of Medicine in the branch of Radiology
Johannesburg, 2011

ii
DECLARATION
I, Nishentha Govender declare that this thesis is my own work. It is submitted for
the degree of Master of Medicine in the University of the Witwatersrand,
Johannesburg. It has not been submitted before for any degree or examination at
this or any other University
__________________
______________ Day of _____________ 2011

iii
DEDICATION
To my supervisor and teacher, Professor Andronikou, thank you for your charisma,
guidance and wisdom. I am honoured to be your student.
Thank you to my parents, brother and family, for their love and encouragement.
You are the vivid paint on my life`s canvas.
Dr Matthew Goodier thank you for the assistance and support.
Dr Louise Keating, a friend, an angel and master of the tea leaves.
Thank you Samuel for your belief and cheer.
“Live as if you were to die tomorrow. Learn as if you were to live forever.”
Mohandas Gandhi

iv
PUBLICATIONS AND PRESENTATIONS
“Adequacy of paediatric renal ultrasound requests and reports” has been
accepted, as an Oral presentation at the SORSA-RSSA Imaging Congress 2011
Durban, South Africa.

v
ABSTRACT Management guidelines for urinary tract infections (UTI) invariably include renal
ultrasound (RUS). Adequacy of RUS requests and reports is important for clinical
practice.
Aim
To assess the adequacy of paediatric RUS requests and reports, the effects of the
former on the latter, the effect of reporter`s rank, determine the yield and correlate
adequacy with regard to the frequency of pathology.
Materials and Methods
Retrospective review of RUS reports of children was performed. A “Request
Adequacy Score” (total 3) and a “Report Adequacy Score” (total 21) based on the
RSNA reporting template was developed. A UTI subgroup was created.

vi
Results
Mean “Report Adequacy Score” was 6.67. Residents performed better than
consultants. There was no significant factor correlating with report adequacy.
Hydronephrosis was the commonest pathology.
Conclusion
RUS requests and reports are inadequate. To improve reporting a renal ultrasound
reporting template was developed.

vii
ACKNOWLEDGEMENTS
University Witwatersrand’s Radiology Department`s secretary, Tebogo and
librarian, Heather, for their assistance and encouragement.
The Head of the Radiology Department, Prof V. Mngomezulu, for granting funding
and providing research facilities.
The Chief Executive Officer of Charlotte Maxeke Johannesburg Academic
Hospital, and the filing clerks of the paediatric radiology department, for allowing
access to relevant documents.
Mrs. Hendry for her statistical assistance.

viii
TABLE OF CONTENTS
Page
Declaration ii
Dedication iii
Publications and Presentations iv
Abstract v
Acknowledgements vii
Table of contents viii
List of Figures xi
List of Tables xiii
Thesis of Chapters
1. Introductory Chapter
1.1. Introduction 1
1.2. Aims 7
1.3. Objectives 8
2. Central Chapter
2.1. Methodology 9
2.1.1. Inclusion Criteria 10
2.1.2. Exclusion Criteria 11
2.1.3. Data Collection Sheets 12
2.1.4. Management of Missing Data 16
2.2. Data Analysis 17
2.3. Results 18

ix
Page
2.3.1. Analysis of Request 19
2.3.2. Analysis of “Report Adequacy Score” 27
2.3.3. Analysis of Report Subcomponents 31
2.3.4. Analysis of Assessment 45
3. Concluding Chapter
3.1. Discussion 52
3.2. Limitations 61
3.3. Conclusion 62
3.4. Recommendations and areas for further research 64
4. References 65
5. Appendices 69
5.1. RSNA Reporting Template
5.2. Human Research Ethics Clearance Committee Clearance Certificate
5.3. Letter granting permission to conduct research at Charlotte Maxeke
Johannesburg Academic Hospital
5.4. Data Collection Sheets
5.5. Adequacy of Requests Sheet and General Info
5.6. Rank of Reporting Radiologist
5.7. Type of Request & Indication for Renal Ultrasound
5.8. Adequacy of Report Sheet
5.9. Correlate “Report Adequacy” Score and the “Assessment” Section
x
5.10. Abnormal Assessments
5.11. Suggested Reporting Template

xi
LIST OF FIGURES Page
Figure 1: Diagram demonstrating the number of studies performed by
different ranks of doctors. 21
Figure 2: Different indications comprising the total ultrasound requests 25
Figure 3: Diagram representing the different causative agents cultured. 26
Figure 4: Comparison of the “Report Adequacy Scores” of the total
subgroup and the UTI subgroups. 27
Figure 5: Comparison of the average “Report Adequacy Scores” for each
subcomponent, for the UTI and total subgroups. 30
Figure 6: Graph comparing important “Kidney” Comments, for the total
and UTI subgroups. 32
Figure 7: Graph comparing important “Specific Comments”, for the total
and UTI subgroups. 36
Figure 8: Graph comparing important “AP Pelvis”, for the total and UTI
subgroups. 40
xii
Figure 9: Graph comparing important “Bladder”, for the total and UTI
subgroups.
43
Figure 10: Diagram illustrating the assessments for the paediatric renal
ultrasounds for the total group and the UTI subgroups. 46
Figure 11: Different pathologies documented in the assessments, for the
total and UTI subgroups. 48
xiii
LIST OF TABLES
Table 1: Different components of the “Report Adequacy Score”. 14
Table 2: Demonstrates the mean “Request Adequacy Score” achieved for
different “Report Adequacy Scores” in the UTI subgroup.
19
Table 3: The mean “Report Adequacy Score” achieved by different
Ranks of doctors, for the Total and UTI subgroups.
22
Table 4: Compares the different types of clinician requests, with the mean
“Report Adequacy Score” achieved
23
Table 5: Demonstrates the average “Report Adequacy Score”, as a
percentage of the maximum possible score, for each subcomponent of
the “Report Adequacy Score”.
28
xiv
Table 6: Demonstrates the percentage reports achieving different
“Kidney” Comments, for the Total and UTI Subgroups. 34
Table 7: Demonstrates the percentage reports achieving different
“Specific Comments” Adequacy Scores, for the Total and UTI subgroups. 37
Table 8: Demonstrates the percentage reports achieving different
“AP Pelvis” Adequacy Scores, for the Total and UTI subgroups. 41
Table 9: demonstrates the percentage reports achieving different
“Bladder” Adequacy Scores, for the Total and UTI subgroups. 44
Table 10: Demonstrates the various “Bladder Pathologies”, for the Total
and UTI Subgroups. 50

INTRODUCTORY CHAPTER
1.1. INTRODUCTION
The most common bacterial infection in childhood is urinary tract infection
(UTI). 1 Imaging is a valuable investigative tool in the context of UTI for the
detection of abnormalities, such as vesicoureteral reflux (VUR), urolithiasis or
congenital abnormalities, which require specific and appropriate treatment.
Furthermore imaging detects the development of complications. 2
The management of urinary tract infections is contentious and guidelines are
evolving, with renal ultrasound providing the one consistent initial screening
tool. Ultrasound continues to form an essential component of all management
protocols, aimed at decreasing morbidity and mortality.
Current views regarding Urinary Tract Infections:
Multimodality imaging of UTI and VUR is complex and controversial. Evolution
in imaging practice is motivated by the desire to minimize unnecessary
interventions and radiation exposure in children.3 Renal ultrasound (RUS) is
non-invasive, lacks ionising radiation, and is of low cost, which makes it a
favourable choice when imaging UTIs in paediatric patients.
Other modalities for imaging UTI in children include fluoroscopic voiding
cystourethrogram (VCU), nuclear voiding cystourethrogram (direct Mag 3), and

2
nuclear renal scintigraphy (NRS) in the form of DMSA and Mag 3 renogram.
Excretory urography (otherwise known as IVP – intravenous pyelogram) is no
longer recommended in the routine evaluation of childhood UTI except when
information regarding anatomy is needed. Computed tomography is reserved
for investigating renal calculi and renal tumours 4 but magnetic resonance
imaging (MRI) is gaining popularity as a primary tool for imaging the collecting
system and providing information regarding function, as it is non-invasive and
imparts no radiation dose.
Importance of Reporting Guidelines:
The Radiological Society of North America (RSNA) Radiology Reporting
Committee intended to create and distribute a best-practice template for the
documentation of important imaging test results. An XML-based template
format was designed, which could be adopted into radiology reporting
standards and be used for collaborative authoring.5
The RSNA Radiology Reporting Template (published 2009) (see Appendix 5.1)
for imaging the urinary tract in children, emphasises that provision of a history
of UTI and hydronephrosis, as well as documentation whether the study
requested is the first or a repeat RUS, are integral components of the request.6
The RSNA reporting template requires mention of certain key findings, which
include the mean kidney length and a correlation to standard deviations for
age, comment on the presence or absence of hydronephrosis or focal

3
parenchymal thinning, the presence or absence of a renal mass or calculi, a
description of the kidney, the distal ureters and the amount of bladder
distension.6 Measurement of bladder parameters is an important component of
RUS, with smaller bladder volumes, larger residual volumes and bladder wall
thickening common findings in children with UTI. These parameters provide an
objective method of evaluating bladder function, during the acute UTI and post-
treatment follow-up.7
Another important measurement to assess during RUS is the antero-posterior
(AP) renal pelvis diameter, especially when evaluating infants with an antenatal
diagnosis of hydronephrosis. An association between immature function at the
pelviureteric junction and bladder dysfunction has been postulated, due to the
abnormal functional bladder parameters, in infants with antenatally diagnosed
hydronephrosis. 8
Role of Ultrasound in the setting of urogenital abnormalities:
RUS has a useful role in detecting urogenital structural and functional
abnormalities which may predispose to urinary tract infections, including upper
urinary tract obstruction (ureteropelvic junction obstruction), vesicoureteral
reflux, lower urinary tract obstruction (primary megaureter), ureterovesical
junction obstruction, posterior urethral valve, parenchymal scars, neurogenic
problems (dysfunctional voiding), ectopic ureterocele with or without associated
duplex collecting system) and calculi.4 Children represent 2-3% of all patients
4
with urolithiasis. UTI is a major aetiological factor in the setting of urolithiasis,
especially in boys; another contributing factor is a metabolic predisposition to
stone formation. In the developed world, the proportion of infection based
calculi, would be reduced by the early detection of underlying congenital
abnormalities and urinary tract infection. If a predisposition has been identified,
then RUS is a most appropriate screening tool. In the setting of a high index of
clinical suspicion, when RUS has failed to detect urolithiasis, then only is low
dose CT is indicated.9
The development of reporting styles:
“The complex cognitive task of radiology reporting is mostly learned during a
resident’s education and training. Specific didactic instruction, supervised
practice, and the rigorous evaluation of reporting skills are vital components of
any comprehensive program to improve radiology reporting.”10 A 2004 report
of a national survey of accredited radiology residency program directors in the
United States of America showed that “86% of training programs devote 1 hour
or less per year to formal instruction in radiology reporting. Likewise, 82% of
programs evaluate less than 1% of their residents’ clinical reports. There
clearly is room for improvement in education about reporting at both the
residency and postgraduate levels.” 10 There is a shortage of paediatric
radiologists in South Africa, with a lack of subspecialty radiology training
programmes, due to health budget constraints and a health policy which is

5
aimed at a widespread generalist service rather than sub-specialist service.
Registrars in training are therefore often required to practise subspecialist
work, with minimal training or even specialist supervision.
The relationship between the clinicians request and the radiologist`s report:
It is well documented that there is a direct relationship between the exam
request seen by the radiologist and the report seen by the clinician. Dacher JN
et al, reported that requests and reports represent two essential steps of the
consultation process in radiology.11
Stavem et al, described that requests for imaging studies are frequently written
in illegible handwriting and important clinical information might be inaccurate or
incomplete. It was noted that radiologists` reports should be well written and
composed of adequate content, for the report to meet the clinicians’ needs12. A
computerised radiology information system, which allows both the clinicians`
requests and radiologists` reports to be typed and archived, may provide a
solution.12
The majority of radiologists and clinicians, hold the view that the clinical
indication of the request, the date of comparison study, the quality of the scan,
relevant descriptive details, pertinent negative findings and measurements,
should be included in the report. 13 The radiologist’s opinion and
recommendations for further investigations must be concluded in the
assessment. Often dictated prose reports result in important data being

6
omitted. Computer–generated itemized detailed reports with accompanying
images have been suggested to address the referring clinician’s needs.13
Role of reporting tools:
Subspecialty societies are encouraged to consider clinically specific reporting
templates to guide the development of a standardized, open-source
information model for radiology reporting. 5 An integrated information model
will enable subspecialty societies and others to collaborate on the creation of
reporting templates that can be adopted throughout the profession. These
templates will help radiologists to improve their reporting practices and vendors
to incorporate structured information into their products.5
Simple tools, such as tick sheets or standardised methodology, as used by
sonographers, and radiological templates, may ensure more accurate
diagnoses with fewer errors, improved record keeping and more effective
follow-up.
This provides better interdisciplinary communication, allows for valuable
comparable data which can be used for follow-up, patient referral and improves
patient care.

7
1.2. AIMS
This study aims to assess the adequacy of paediatric renal tract ultrasound
requests and reports, the effects of the former on the latter, as well as the
effect of the rank of the radiologist. The study will develop a guideline reporting
template, for use in the local setting.
8
1.3. OBJECTIVES
1.3.1. To assess the adequacy of paediatric renal tract ultrasound reports
against The Radiological Society of North America (RSNA) Radiology
Reporting Committee Paediatric Reporting Guidelines for Renal
ultrasound.
1.3.2. To determine the adequacy of paediatric renal tract ultrasound
request forms, for the indication of UTI, against the RSNA Radiology
Reporting Committee Paediatric Reporting Guidelines for Renal
ultrasound.
1.3.3. To correlate the radiologist experience level, with the adequacy of
reporting for the total and UTI subgroup.
1.3.4. To analyse the subcategory of referrals, relating to urinary tract
infection as a special group.
1.3.5. To correlate the adequacy level of requests for UTI, with the
adequacy level of reports for UTI.
1.3.6. To assess the pathological yield of paediatric renal tract ultrasound
and the spectrum of pathology.
1.3.7. To create a standardised reporting template for paediatric renal
ultrasounds, for the local setting.

9
2. CENTRAL CHAPTER
2.1. METHODOLOGY
A retrospective review of ultrasound requests and reports, of paediatric
patients was conducted at the Charlotte Maxeke Johannesburg Academic
Hospital (CMJAH). Hardcopy paediatric ultrasound reports were accessed from
the record keeping area of the radiology department for 14 months
(commencing 1st June 2009 and ending 31st July 2010). An ethics application
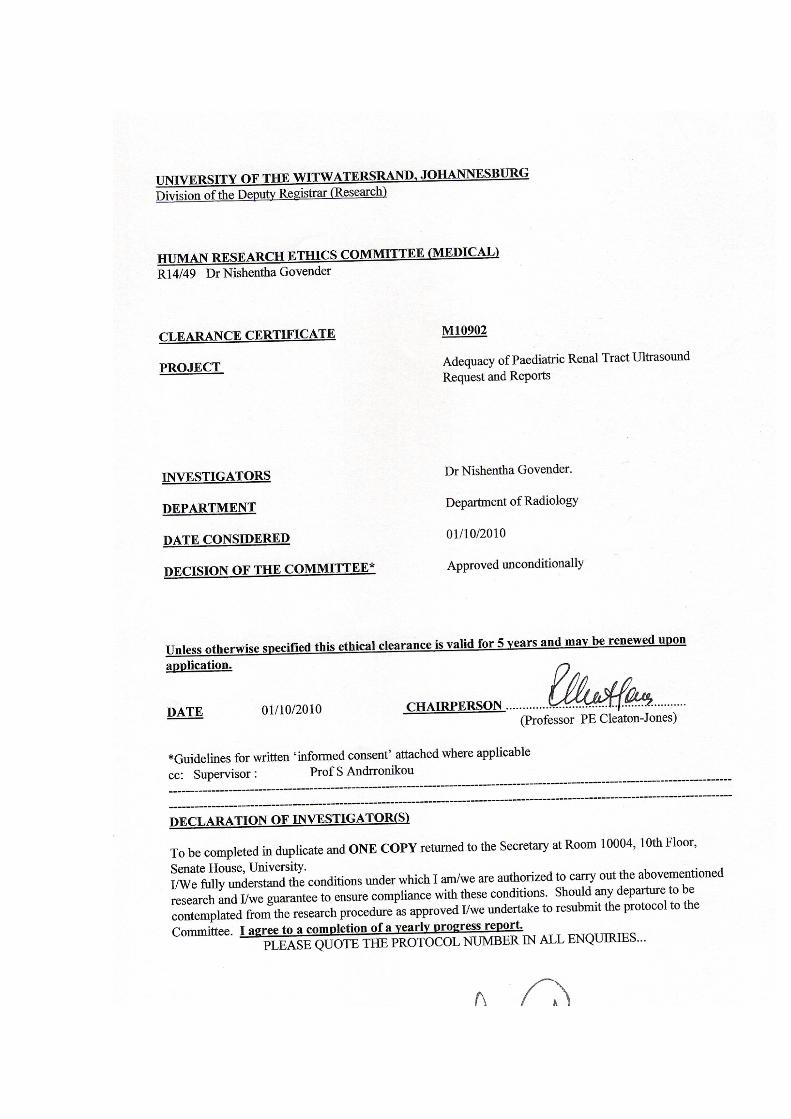
was approved on the 1st October 2010 by the University of Witwatersrand
ethics committee [ see Appendix 5.2:Ethics clearance number M10902], and
the Chief Executive Officer of CMJAH, had approved use of the necessary
hardcopy files from the Department of Radiology [see Appendix 5.3]. Requests
and reports were reviewed as per the inclusion and exclusion criteria. Patient`s
data was anonymised for recording. Data was collected for two groups, namely
the total group and for a subgroup with the indication of UTI. The information
from the forms was recorded onto data collection sheets for the request, report
and assessment components.
10
2.1.1. INCLUSION CRITERIA
a. Only ultrasound reports filed in the radiology department were
included.
b. Any ultrasound request to image
a) One or many parts of the genitourinary tract
b) The abdomen, with either specified kidney size or with
an indication for urogenital pathology
c) The kidneys (renal) or bladder specifically.
c. Any request referring to genitourinary pathology, using the words
UTI, VUR (vesicoureteric reflux), renal mass, hydronephrosis,
hydroureter, VACTERAL, assessment of anomalies, spina bifida,
neurogenic bladder, renal calculi, nephrotic syndrome, nephritic
syndrome and ureterocele.
d. Children 14 years and younger.

11
2.1.2. EXCLUSION CRITERIA
a. Any requests not completed by a clinician.
b. Illegible reports.
c. Replacement requests due to lost forms.
d. Renal or abdominal ultrasound requests with the indication being
trauma, for assessment of haematoma or expanding collections.
e. Renal ultrasound for the assessment of a transplant kidney.
f. Renal Doppler ultrasounds or renal requests for assessment of renal
arteries.

12
2.1.3. DATA COLLECTION
Data was collected using data collection sheets [see Appendix 5.4].
A descriptive statement was scored positive if a comment was made,
irrespective of whether pathology was present or not. Thus importance was
placed as to whether standard descriptions were documented consistently
even when there was no pathology detected. Data was collected as follows.
A) Request Adequacy Score:
A “Request Adequacy Score”, was scored out of a maximum of 3. Points were
awarded for forms wherein the referring clinician indicated “onset of UTI”,
“culture positive” or indicated significant biochemical results. Specific causative
agents were recorded in separate subcategories: “ E.coli”, “Klebsiella” and
“Proteus”. [see attached Appendix 5.4 (a)]
B) Rank:
The level of experience and qualification of the reporter was categorised into
“Registrar”, “Consultant” or “Registrar assisted, by a fellow registrar or
consultant”. [see attached Appendix 5.4 (b)]
13
C) Indication:
The indication for the renal ultrasound, was categorised into: ‘UTI’, ‘Anomalies’,
‘Hydronephrosis’, ‘Hydroureter’, ‘Renal Failure/Renal Dysfunction’, ‘Renal
Mass’, ‘Heamaturia’, ‘Neurogenic Bladder’ and ‘Malnutrition’. [see attached
Appendix 5.4 (c)]
D) Type of request: “Renal specifically” or “Abdominal request”
Clinicians suspecting renal pathology, either requested abdominal ultrasounds
or renal ultrasounds. Abdominal ultrasounds comment on the renal structures
in addition to many other structures, thus these are thought to be more time
consuming and not as focussed as compared with the specific renal
ultrasound. [see attached Appendix 5.4 (c)]
E) Report Adequacy Score:
A “ Report Adequacy Score” based on The Radiological Society of North
America Radiology Reporting Committee Paediatric Reporting Guidelines for
Renal ultrasound [RSNA 2009] was used [see attached Appendix 5.1]. The
“Report Adequacy Score” was a sum of the “Kidney” score, the “Special
Comment” score, the “Distal Ureter” score, the “AP Pelvis” score and the
“Bladder” description score. This is summarised in Table 1. The score ranged
from 0 to 21. The descriptive information from the report was categorised and a

14
score was given for the use of various words and measurements. Examples of
the data collection sheets used are attached in Appendix 5.4 (d) 1 - 4.
Table1: Different components of the “Report Adequacy Score”.
Categories of Adequacy of Reporting Score
Adequacy score for “Kidney”
[see attached Appendix 5.4 (d) 1 ]
8
Adequacy score for “Specific Comments”
(Hydronephrosis, Hydroureter, Calculi, Anomalies and Focal Lesions)
[see attached Appendix 5.4 (d) 2 ]
5
Adequacy score for “Distal Ureter”
[see attached Appendix 5.4 (d) 3]
1
Adequacy score for “AP Pelvis”
[see attached Appendix 5.4 (d) 4]
3
Adequacy score for “Bladder”
[see attached Appendix 5.4 (d) 3]
4
Total Adequacy Score 21

15
F) Data from the assessments or conclusions:
The ultrasound form was analysed as to whether an assessment was made,
and if this assessment was “normal” or “abnormal”. Forms with no comment or
assessment were grouped as a separate category, termed “no comment”. [see
attached Appendix 5.4 (e)]
The report was categorised as “normal” if the assessment stated any one of
the following: “normal”, “no significant pathology”, “normal findings” or “no
abnormalities”. Furthermore information was subcategorised into normal renal
ultrasound and normal abdominal ultrasound.
Those assessments categorised as “abnormal” where examined as to the type
of documented pathology classified into: “hydronephrosis”,” hydroureter”,
“abnormal echogenicity” , “abnormal size”, “anomalies”, “calculi”,
“pyelonephritis” or “glomerulonephritis” and “bladder pathology”. [see attached
Appendix 5.4 (f)1]
The “Bladder Pathology was further categorised into: “uterocele”, “calculi”,
“diverticuli”, “wall thickening”, “trabeculation”, “irregular wall”, “residual volume”,
“bladder outlet obstruction and ‘other’. [see attached Appendix 5.4 (f)2]
The assessments were collected for the total reports received as well as for the
subgroup of UTI.
16
2.1.4. MANAGEMENT OF MISSING DATA
If specific areas of the ultrasound form, such as the “request”, “rank”, “report” or
“assessment”, were illegible or incomplete, then those specific areas were
omitted from the data collection and calculations were performed from a
modified total. All forms with documented signatures, of the reporting doctor,
were correlated with department records to determine rank. If this was
inadequate, then interpretation by the head of department with regard to
determining rank was employed. The “rank” of the reporter documented on the
form, was deemed to be inconclusive if the above methods were unsuccessful.
The data regarding the “rank” of that specific reporter would be excluded.
However data from the “request” and or the “report” were still be used, if those
sections were considered complete and legible.
Missing values were addressed by referring back to the hardcopy patient file.
However if the relevant data was not found then that section of that specific
form was excluded.

17
2.2. DATA ANALYSIS
The “Report Adequacy Score” provided continuous quantitative data for analysis
and ranged from 0 to a maximum of 21. Data was cleaned and assessed for
missing values and extreme values.
Special statistical tests included the following: The Spearman’s correlation
coefficient was used to correlate the “Request Adequacy Score” with the “Report
Adequacy Score”. The Kruskal-Wallis test was used to investigate whether the
“Report Adequacy Score” differed significantly for the different ranks. For the UTI
subgroup the correlations of the “Request Adequacy Score”, “Report Adequacy
Score” and pathological yield were investigated using Spearman’s Correlation
Coefficient. Relationships between the gender of patients and the presence of
pathology as well as the rank of the reporter and the presence of pathology were
examined. The Chi-square test of Independence was used to test for significant
relationships. Where the cell frequencies were too small, Fisher’s Exact test was
used. The level of significance used in all tests was 0.05.
18
2.3. RESULTS
A total of 398 patients met the inclusion criteria. The 32 patients who met the
exclusion criteria were removed leaving a total of 366 renal ultrasound request
forms for evaluation, with 141 of these making up the UTI subgroup.
The total group showed a minimum age of 0 days and a maximum age of 14
years. The mean was 3 years and 8 months. The largest proportion of children
imaged was younger than one year of age. For the UTI subgroup, the minimum
age was 2 days and the maximum was 14 years. The mean age was 2 years and
9 months.
The gender was recorded in 362 patients - of these 229 (63%) were male patients
and 133 female patients (36%). For the UTI subgroup 93 children were male
(66%) and 48 female (34%).

19
2.3.1. ANALYSIS OF REQUEST
A) Request Adequacy Score
Results of the “Request Adequacy Score”, which was exclusively used for the UTI
subgroup, ranged from 0 to 3. “Request Adequacy Scores” were ‘0’ in 92 requests
(65%), ‘1’ in 12 requests (9%), ‘2’ in 35 requests (25%), and the maximum of ‘3’ in
2 requests (1%). These results are summarised in Table2 below.
Table2: Demonstrates the mean “Request Adequacy Score” achieved
for different “Report Adequacy Scores” in the UTI subgroup.
“Request Adequacy Score”
Mean “Report Adequacy Score”
Number of Forms
0 6.85 92 Forms
1 5.92 12 Forms
2 6.66 35 Forms
3 5.50 2 Forms

20
No statistically significant correlation was found between the three variables:
“Request Adequacy Score”, “Report Adequacy Score” or the assessment of the
ultrasound.
B) Rank of doctors performing the ultrasound:
The total of 365 forms had indicated legibly the rank of the doctor performing
the procedure. For the total group, the majority of studies (87%; 314 forms),
were performed by “registrars” and the minority by “consultants” (4%; 13
forms). The “registrars” also performed the majority of UTI subgroup studies
(92%; 130 forms) and the “registrar assisted” by a consultant or fellow registrar
performed the minority of studies (4%; 5 forms), as illustrated in Figure1.

21
Figure 1: Diagram demonstrating the number of studies performed by
different ranks of doctors.
Registrar Registrar Assisted Consultant
Total Group 87% 9% 4%
314 forms 37 forms 13 forms
UTI Subgroup
92% 4% 4%
130 forms 5 forms 6 forms

22
Correlation Tests:
The average report “Report Adequacy Scores” was not found to be statistically
significantly different between the 3 ranks (p= 0,066) using the Kruskal-Wallis
test. The mean “Report Adequacy Score” for the consultants was the lowest for
both the total group and the UTI subgroup, as summarised in Table 3.
Table 3: The mean “Report Adequacy Score” achieved by different Ranks of
doctors, for the Total and UTI subgroups (maximum achievable score 21)
Mean
“Report Adequacy score”
achieved by
“Registrar”
Mean
“Report Adequacy Score”
achieved by
“Consultants”
Mean
“Report Adequacy Score”
achieved by
“Registrar assisted”
“Report Adequacy score”
for Total group
6.76 6.08 6.08
“Report Adequacy score”
for UTI group
6.74 5.50 7.2

23
C) Types of request: “Renal specifically” or “Abdominal request”:
49% (179) of request forms for the total group and 46% (65) for the UTI subgroup
were requested as “abdominal” scans and not “renal” scans. The mean adequacy
score achieved by the total group was 6.83 for “renal” requests, as compared to
6.5 for “abdominal” requests (table 4). This was not a statistically significant
difference.
Table 4: Compares the different types of clinician requests, with the mean
“Report Adequacy Score” achieved.
mean
“Report Adequacy Score”
for Total group
mean
“Report Adequacy Score”
for UTI subgroup
abdominal request
(not renal specifically)
6.5 6.52
renal specifically 6.83 6.82

24
D) Spectrum of Indications for renal ultrasounds:
Paediatric renal ultrasounds were requested for different indications which are
summarised in Figure 2. The most common indication was for the assessment of
“UTI” (141 requests; 39%). The least common indication was for “hydroureter” with
no requests made.

25
Figure 2: Different indications comprising the total ultrasound requests.
Indications
UTI 39% 141 forms
Anomaly 23% 84 forms
Hydronephrosis 10% 37 forms
Hydroureter 0% 0 forms
Renal failure / dysfunction 8% 28 forms
Renal Mass 7% 24 forms
Haematuria 3% 9 forms
Neurogenic Bladder 2% 8 forms
Malnutrition 1% 5 forms

26
E) Analysis of the UTI Subgroup:
The ‘onset of the UTI’, ‘if culture positive’ and the ‘causative agent’ was analysed
for the UTI subgroup only. The ‘onset of the UTI’ was mentioned in 7 forms (5%).
47 forms (33%) documented positive cultures, with 35 forms (25 %) indicating the
causative pathogen. Figure 3 illustrates the percentage incidence of different
culture positive pathogens.
Figure 3: Diagram demonstrating the different causative agents cultured.

27
2.3.2. ANALYSIS OF “REPORT ADEQUACY SCORE”
The “Report Adequacy Score” ranged from 0 to a possible maximum of 21. The
minimum score achieved was 3 and the maximum score achieved was 12. The
commonest score was 6, for both the UTI and total group. The “Report Adequacy
Scores” for the Total and UTI subgroups are summarised in Figure 4.
Figure 4: Comparison of the “Report Adequacy Scores” of the total
subgroup and the UTI subgroups.

28
For both the total and UTI subgroups, the best reported section was the “Kidney”
comment, followed by “Specific comments”, “Bladder”, “Distal ureter” and then the
“AP pelvis. These results are summarised in Table 5.
Table 5: Demonstrates the average “Report Adequacy Score” and as a
percentage of the maximum possible score, for each subcomponent of the
“Report Adequacy Score”.
“Report Adequacy Score”
And maximum possible
score for each section
Average Score
Total group
Average Score
UTI sub-group
“Kidney” Comment
(maximum score:8)
3.27
(41%)
3.22
(40%)
“Specific Comments”
(maximum score:5)
2.0
(40%)
1.95
(39%)
“Distal ureter”
(maximum score:1)
0.1
(10%)
0.14
(14%)
“AP Pelvis”
(maximum score:3)
0.16
(5%)
0.13
(5%)
“Bladder”
(maximum score:4)
1.14
(29%)
1.26
(31%)
Total “Report Adequacy
Score”
(maximum score:21)
6.67
(31.8%)
6.7
(31.9%)

29
The best reported subcomponent was the mean “kidney” score was 41% for the
total group and 40% of the UTI subgroup. The “distal ureters” were on average
reported better in the UTI group as compared to the total group. The “AP Pelvis”
was the worst reported for the total and the UTI subgroups. These results are
summarised in Figure 5.
30
Figure 5: Comparison of the average “Report Adequacy Score” for each subcomponent, for the UTI and Total Group.
Mean
“Kidney”
score
Mean
“Specific
Comments”
Mean
“Distal
Ureter”
score
Mean
“AP
Pelvis”
score
Mean
“Bladder
” score
Total Group 41% 40% 10% 5% 29%
UTI Subgroup 40% 39% 14% 5% 31%

31
2.3.3. ANALYSIS OF REPORT SUBCOMPONENTS
A) Kidney Comments
i) Kidney Descriptions:
The “presence of one or both kidneys” was recorded in 100% of the total
group and UTI subgroup. The “measured size of one or both kidneys” was
documented on 347 (96%) forms and 133 forms (90%), for the total and UTI
subgroups respectively. The worst documented comment for both the total
group and UTI subgroups, was “normal international predicted values for
age provided”, as illustrated in Figure 6.

32
Figure 6: Graph comparing important “Kidney” comments, for the Total and UTI subgroup.
Measured size
Normal international predicted values for age provided
Commented normal and abnormal in size
Echo-genicity
Cortico-medullary differen-tiation
Location
Total Group
96% 1% 28% 64% 16% 12%
347 forms 2 forms 101 forms 234forms 58 forms 43 forms
UTI Subgroup
90% 0% 29% 64% 14% 10%
133 forms 0 forms 41 forms 90 forms 19 forms 14 forms

33
ii) “Kidney” Adequacy Score:
The “kidney” adequacy score, ranged from 0 to 8. The minimum score for
both groups was 1, whilst the maximum score was 5 and 6, for the total and
UTI subgroup respectively. The majority of reports 176 forms (48%) for the
total group and 77 forms (55%) for the UTI subgroup, achieved a score of 3,
which is suboptimal. Table 6 demonstrates the different scores achieved.

34
Table 6: Demonstrates the percentage reports achieving different “Kidney”
Adequacy Scores, for the Total and UTI subgroups.
“Kidney” adequacy Score
[maximum 8]
Percentage of the total group
Percentage of the UTI
subgroup
Score 1 1% (5 Forms)
1% (2 Forms)
Score 2 17% (63 Forms) 15% (21 Forms)
Score 3 48% (176 Forms) 55% (77 Forms)
Score 4 23% (82 Forms) 21% (29 Forms)
Score 5 8% (28 Forms) 6% (9 Forms)
Score 6 3% (10 Forms) 2% (3 Forms)
Score 7 0.3% (1 Form) 0% (0 Forms)
TOTAL NUMBER OF FORMS 365 Forms 141 Forms
35
B) Specific Comments
i) Specific Descriptions:
“Hydronephrosis/ Prominence of the calyceal system” was the best reported
“Specific comment” with 344 forms (94%) and 134 forms (95%) for the total
and UTI subgroups respectively. “Anomalies” was the least reported, with
only 38 forms (10%) and 12 forms (9%) for the total and UTI subgroups, as
illustrated in Figure7.
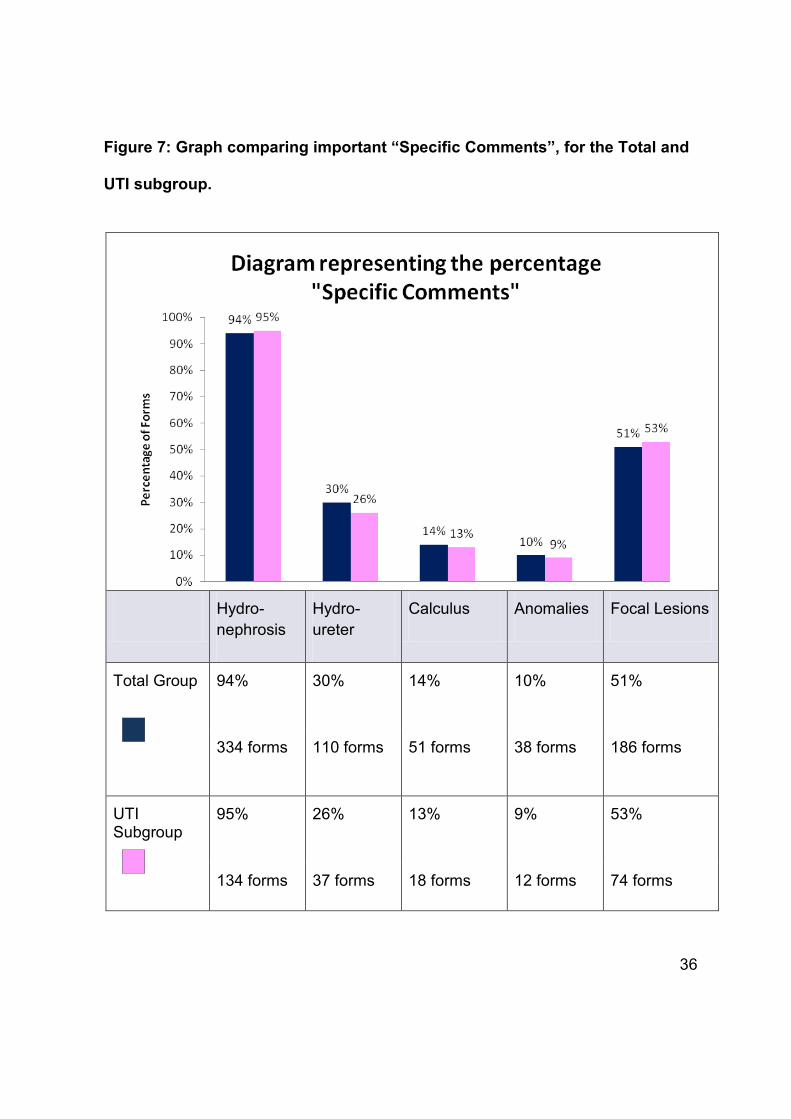
36
Figure 7: Graph comparing important “Specific Comments”, for the Total and
UTI subgroup.
Hydro-nephrosis
Hydro-ureter
Calculus Anomalies Focal Lesions
Total Group 94% 30% 14% 10% 51%
334 forms 110 forms 51 forms 38 forms 186 forms
UTI Subgroup
95% 26% 13% 9% 53%
134 forms 37 forms 18 forms 12 forms 74 forms

37
ii) “Specific Comments” Adequacy Score:
The maximum number of points allocated for “Specific Comments” was 5.
However the most frequent score achieved was 2, for the total and UTI
subgroups, 208 forms (57%) and 85 forms (60%), as demonstrated by
Table 7.
Table 7: Demonstrates the percentage reports achieving different “Specific
Comments” Adequacy Scores, for the Total and UTI subgroups.
“Specific Comments” adequacy Score
[maximum 5]
Percentage of the total group
Percentage of the UTI
subgroup
Score 0 2% (6 Forms)
1% (2 Forms)
Score 1 20% (73 Forms) 21% (29 Forms)
Score 2 57% (208 Forms) 60% (85 Forms)
Score 3 20% (72 Forms) 17% (24 Forms)
Score 4 2% (6 Forms) 1% (1 Form)
TOTAL NUMBER OF FORMS 365 Forms 141 Forms

38
C) Distal Ureters
i) Distal Ureter Description:
Distal ureters were commented on in 36 forms (10%) of the total group
reports and 20 forms (14%) of the UTI subgroup.
ii) “Distal Ureters” Adequacy Score:
For the total group a maximum score of 1 was achieved, for 36 forms (10%)
and the minimum score of 0, in 329 forms (90%). For the UTI subgroup, 20
forms (14%) achieved the maximum score and 121 forms (86%) the
minimum.

39
D) AP Pelvis
i) AP Pelvis Description:
Most frequently there was no comment regarding the “AP Pelvis” 336 forms
(92%) for the total group and 130 forms (92%) for the UTI subgroup.
Comments regarding the AP Pelvis are summarised in Figure 8.

40
Figure 8: Graph comparing important “AP Renal Pelvis” comments,
for the Total and UTI subgroup.
No Comment
Not Visible
Commented if normal or abnormal
Commented visible or measured
Actual value given in SI Unit
Total Group 92% 0% 5% 6% 5%
336 forms 1 form 19 forms 22 forms 19 forms
UTI Subgroup
92% 1% 5% 5% 4%
130 forms 1 form 7 forms 7 forms 4 forms

41
ii) “AP Pelvis” Adequacy Score:
The most common score for both the total and UTI subgroups, was a Score
of 0, which was noted in 338 forms (93%) and (93%) 131 forms
respectively. The maximum possible Score was 5, however, the highest
score achieved was a Score of 3, noted in 9 forms (3%) and 2 forms (1%)
of the total and UTI subgroups. See Table 8 below.
Table 8: demonstrates the percentage reports achieving different “AP
Pelvis” Adequacy Scores, for the Total and UTI subgroups.
“AP Pelvis”
adequacy Score
[maximum 5]
Percentage of
the total group
Percentage of the
UTI subgroup
Score 0 93% (338 Forms)
93% (131 Forms)
Score 1 1% (5 Forms) 2% (3 Forms)
Score 2 4% (13 Forms) 4% (5 Forms)
Score 3 3% (9 Forms) 1% (2 Forms)
TOTAL NUMBER OF FORMS
365 Forms 141 Forms

42
E) Bladder Comments
i) Bladder Description:
The Bladder was “visualised, measured or recorded as empty/collapsed” in
246 forms (67%) of the total group and 111 forms (79%) of the UTI
subgroup. This was the most frequent comment, as summarised in Figure 9
below. The poorest reported comment for the total and UTI subgroup was
the “bladder volume calculation” in 21 Forms (6%) and in 4 forms (3%)
respectively.

43
Figure 9: Graph comparing important “Bladder” comments, for the Total and UTI subgroup.
Bladder visualised or measured or recorded as empty
Bladder wall thickness measured or comment if abnormal/ normal or if empty
Bladder Volume measured
Post micturition bladder volume or comment why not possible
No comment
Total Group 67% 33% 6 % 8% 32%
246 forms 122 forms 21 forms 28 forms 117 forms
UTI Subgroup
79% 35% 3% 9% 21%
111 forms 49 forms 4 forms 13 forms 29 forms
44
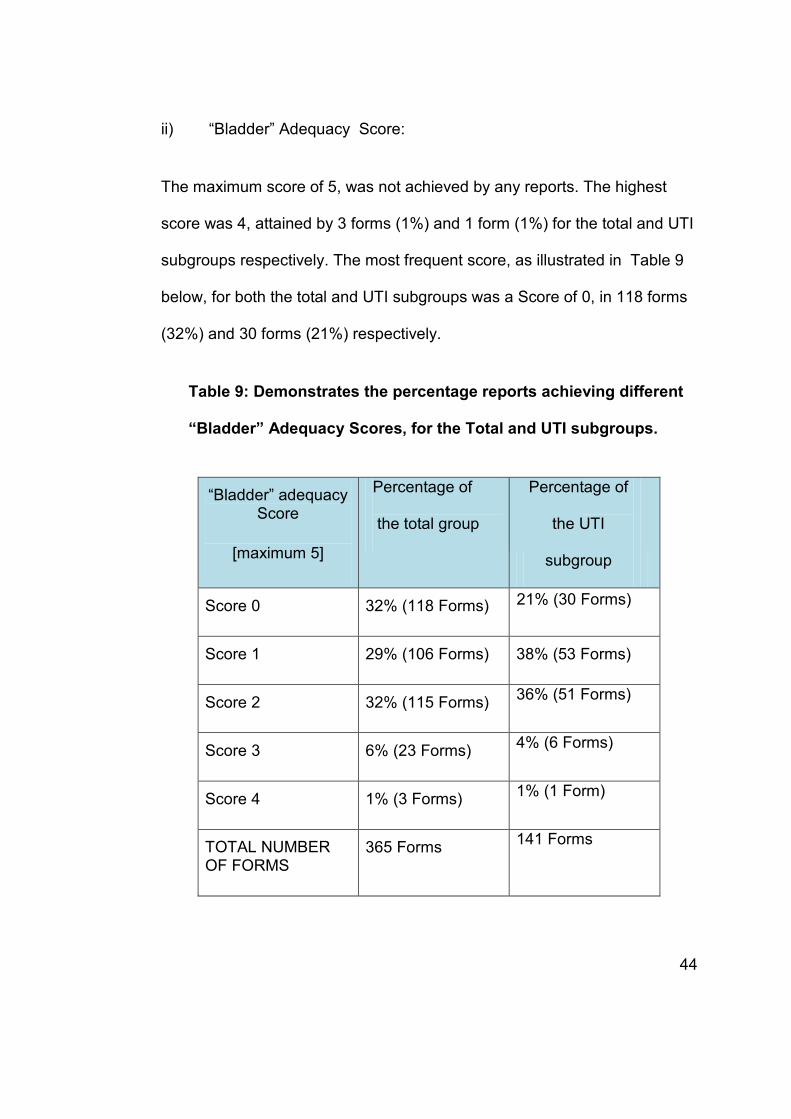
ii) “Bladder” Adequacy Score:
The maximum score of 5, was not achieved by any reports. The highest
score was 4, attained by 3 forms (1%) and 1 form (1%) for the total and UTI
subgroups respectively. The most frequent score, as illustrated in Table 9
below, for both the total and UTI subgroups was a Score of 0, in 118 forms
(32%) and 30 forms (21%) respectively.
Table 9: Demonstrates the percentage reports achieving different
“Bladder” Adequacy Scores, for the Total and UTI subgroups.
“Bladder” adequacy Score
[maximum 5]
Percentage of
the total group
Percentage of
the UTI
subgroup
Score 0 32% (118 Forms)
21% (30 Forms)
Score 1 29% (106 Forms) 38% (53 Forms)
Score 2 32% (115 Forms) 36% (51 Forms)
Score 3 6% (23 Forms) 4% (6 Forms)
Score 4 1% (3 Forms) 1% (1 Form)
TOTAL NUMBER OF FORMS
365 Forms 141 Forms

45
2.3.4. ANALYSIS OF ASSESSMENT
Reviewing the ultrasound assessment section of the total group, showed 211
forms (58%) were assessed as “normal’’, “no significant pathology” or “no
abnormal findings” and only one form was assessed as suboptimal. 35 forms
(10%) documented “no comment or assessment” and 117 forms (32%) had
assessments which were “abnormal”. In the UTI subgroup, 101 forms (72%)
were assessed as” normal”, 12 forms (9%) had “no comment or assessment”
and 28 forms (19%) assessed as “abnormal” studies. These findings are
summarised in Figure 10.
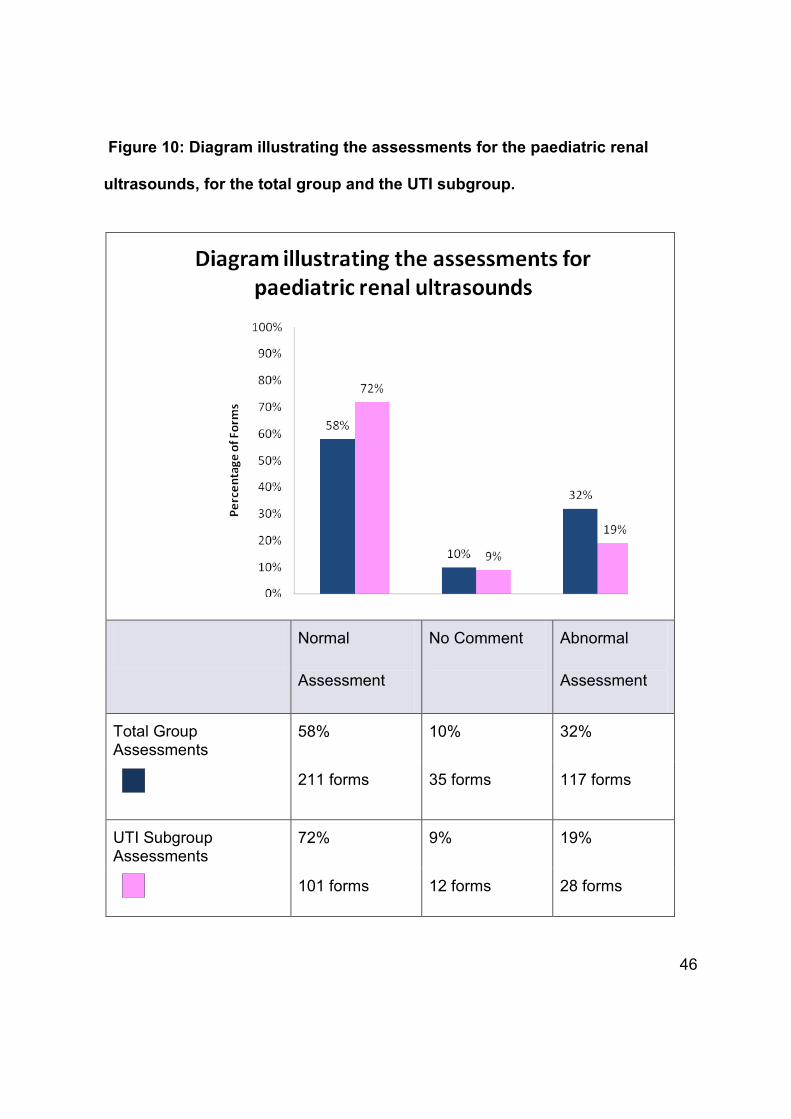
46
Figure 10: Diagram illustrating the assessments for the paediatric renal
ultrasounds, for the total group and the UTI subgroup.
Normal
Assessment
No Comment
Abnormal
Assessment
Total Group Assessments
58% 10% 32%
211 forms 35 forms 117 forms
UTI Subgroup Assessments
72% 9% 19%
101 forms 12 forms 28 forms

47
A) Gender distribution of abnormal assessments
Male patients comprised 78 of the ‘abnormal’ assessments (66%) for the total
group and 21 assessments (75%) of the UTI subgroup. Females were found in
39 abnormal assessments (34%) of the total group and 7 assessments (25%)
of the UTI subgroup.
Correlation Tests:
Chi-square Tests on the cross tabulations between the gender of patients and
the presence of abnormal pathology, showed no significant relationships, for
both the total group (p=0.486) and the UTI subgroup (p=0.259).
B) Specific pathologies yielded in the Assessment section
On analysis of the assessments of the renal ultrasound forms, it was found that
47 forms (13%) documented the presence of “hydronephrosis” and 24 forms
(7%) “hydroureter” in the assessment, which were the most frequent pathology
noted for the total group. Similarly the commonest documented pathologies in
the ‘assessment’ for the UTI subgroup were “hydronephrosis’’ in 15 forms
(11%) and “hydroureter” in 6 forms (4%) . These finding are summarised in
Figure 11.

48
Figure11: Different pathologies documented in the assessment section, for
the total and UTI subgroups.
Hydro-nephrosis
Hydro-ureter
Abnormal echo-genicity
Abnormal Size
Anomaly Calculus Pyelo-nephritis / Glomerulo-nephritis
Total Group 13% 7% 5% 4% 4% 1% 1%
47 forms 24 forms 19 forms 14 forms 13 forms 1 form 5 forms
UTI Subgroup
11% 4% 1% 3% 0% 1% 1%
15 forms 6 forms 1 form 4 forms 0 form 1 form 1 form

49
The commonest types of “Bladder Pathology” were “wall thickening’’,
‘’trabeculations’’ and ‘’irregular wall” for both the UTI and Total Group. The least
common pathology recorded in the assessments was “uteroceles” for the total
group and no studies in the UTI subgroup yielded “uteroceles” or “diverticuli”, as
illustrated in Table 10.

50
Table 10: Demonstrates the various “Bladder Pathologies” for the
Total and UTI Subgroups recorded in the ‘Assessment’.
TOTAL GROUP
UTI GROUP
Uterocele 1 Form 0 Forms
Calculi 2 Forms 1 Form
Diverticuli 2 Forms 0 Forms
Wall thickening,
Trabeculation,
Irregular Wall
8 Forms 3 Forms
Residual Volume 5 Forms 1 Form
Bladder outlet
obstruction and other
2 Forms 2 Forms
TOTAL 20 Forms 7 Forms

51
Correlation Tests:
No significant relationship existed between the “rank” of the doctor and presence
of “abnormal” assessments for the total or the UTI sub-groups, according to Chi-
square and Fisher`s Exact tests.
The “Request Adequacy Score” showed no relationship with the “Report Adequacy
Score (p=0.143) and with the assessment (p=0.892), using Spearmen`s
Correlation. The “Report Adequacy score” showed no significant relationship with
assessment (p=0.964).
52
3. CONCLUDING CHAPTER
3.1. DISCUSSION
Paediatric renal tract pathology is common, both throughout the world and in
South Africa. The management of urinary tract infections (UTI) is contentious and
guidelines are evolving, in particular with regard to the role and type of imaging
performed. Imaging for UTI using renal ultrasound is non-invasive, lacks ionising
radiation, and is of low cost, which makes it a favourable choice in paediatric
patients. Adequate paediatric renal tract ultrasound requests and reports are
therefore paramount for urinary tract management and other renal tract disease in
children.
Our results include a majority of patients under a year of age, which is the age
when renal pathology most often presents. “Age and gender are important factors
influencing prevalence. As males are more likely to be born with structural
abnormalities of the urinary tract, UTI is common in their first six months of life.”14
Male patients were imaged most frequently in our study and the majority of
abnormal studies were also found in male patients for both the total and UTI
subgroups. There was no statistical relationship between gender and the likelihood
of an abnormal “overall assessment” in reports. UTI infections are most commonly
found in female patients 15, due to the shorter urethra, and thus female patients
should represent a larger proportion of patients imaged. It is possible in our setting

53
clinicians are unfamiliar with current referral practises and continue to image only
males with UTI, as was practised.16
This study represents a single institution, which has a heavy reliance on registrars
for performing imaging procedures. The “Rank” of the doctor performing the
ultrasound did not demonstrate a significant statistical relationship with the “Report
Adequacy Score” of the report. However the average “Report Adequacy Score”
achieved by the registrar group was higher than the score achieved by the
consultant. As registrars are in a specialist training programme, they are taught to
report in a proforma manner for most radiology modalities. Thus, they document or
comment on structures, irrespective of whether pathology is present or not.
Sistrom et al, described that improved radiology communication maybe achieved
by employing “innovative software for creating, archiving, transmitting, and
displaying reports’’ as well as “targeted education of radiology trainees and
practitioners and the adoption of widespread standards for radiology report
contents, language, and styles”. 10 They also concluded that “specific didactic
instruction, supervised practice, and the rigorous evaluation of reporting skills are
vital components of any comprehensive program to improve radiology reporting”.10
In our study consultants, who are more experienced, may be reporting in less
detail, because they fail to recognise the importance of comprehensive and
reproducible reporting styles. Structured reporting has shown to have definite
benefits. As described by Langlotz, “they facilitate clear communication, increase
the availability of information resources, and foster clinical imaging research,
thereby improving the practice of radiology.”17 Better patient care, financial

54
benefits and improved service delivery for referring clinicians has been
documented.18
Consultants performed few paediatric ultrasounds and for these irrespective of the
indication, they scored lower average scores as compared to the registrars. This
study cannot determine whether the consultants assess patients less thoroughly or
only document their findings in a less systematic manner. In this study it was
assumed implicit that if pathology was present during the ultrasound, then it would
have been reported for clinical purposes. Furthermore the consultant group was a
much smaller sample group as compared to the registrar group, and therefore
results may represent the reporting styles of a few individuals. The registrars only
had assistance from consultants or peers in 10% of the total number of cases and
4% of the UTI cases. For the UTI subgroup, however, the mean “Report Adequacy
Score” did increase from 6.74 achieved by a registrar alone, to 7.2 when the
registrar was assisted. This suggests that double reading and supervision may act
as a motivator for more comprehensive reporting.
Irrespective of rank, patient age category, type of request or indication, the
average “Report Adequacy Score” for this single institution lacking paediatric
radiology subspecialists was substandard, at 32% of the expected reporting for
renal tract ultrasound in children (6.67 out of a possible 21 points). Paediatric
radiology is a subspecialty, requiring further training and often a dedicated unit
within the radiology department. Jankharia described that “Radiologists who
understand how to adjust protocols, and who can speak the same language as the

55
pediatricians and pediatric surgeons, are sorely required, if we are to be an
integral part of the teams that manage infants and children.”19 Dedicated paediatric
radiology expertise on the ground, not only assures clinical excellence but also
sets a standard for colleagues and acts as a pillar for training registrars.20 The
poor scores achieved by consultants implicates them as responsible for this
pattern of substandard reporting learnt by registrars.
The commonest indication for a renal ultrasound was “UTI”, followed by the search
for renal anomalies and hydronephrosis, with no requests searching for
hydroureter. On analysis of the yield of pathology, however, hydronephrosis was
the commonest finding, followed by hydroureter. In the setting of UTI,
hydronephrosis is the most frequent finding and is probably the most useful
ultrasound finding as it is easily and accurately detected as well as being surgically
correctable.
A score for the adequacy of requests was determined for the UTI subgroup only.
The majority (65%) of clinician`s requests, scored 0 of a possible 3, for adequacy,
with basic information regarding onset, confirmation of UTI on culture and
causative pathogen, not provided in the majority. There was however, no
correlation between the UTI “Request Adequacy Score” and the “Report Adequacy
Score”. This precludes blaming clinician requests for the quality of reports issued
for paediatric ultrasounds, without taking into account accuracy of diagnosis.
Interestingly the highest mean “Report Adequacy Score” was achieved when no

56
history regarding the UTI was provided, and similarly the lowest “Request
Adequacy score” resulted in reports with maximum “Report Adequacy Score”.
The “Report Adequacy Score” designed for use in this study was based on
RSNA guidelines6, with the inclusion of a further 12 points of local relevance
added by a paediatric radiologist, making it more comprehensive than the RSNA
guidelines. The RSNA guidelines describe 9 points of the total 21 points in the
“Report Adequacy Score” of this study. The average “Report Adequacy Score”
was 6.67, which is still inadequate by the RSNA standards. Attempting to correlate
our average score against the RSNA standards maximum score above (9), is
inappropriate, as the additional points in our modified scoring system may be
falsely elevating the overall scores.
The mean “Report Adequacy Score” for the total group was 6.67, which is 32% of
a total possible score of 21. The UTI subgroup achieved a mean “Report
Adequacy Score” of 6.7. For both the total group and the UTI subgroup, only 6%
and 5% of reports respectively achieved more than 50% reporting adequacy. A
detailed discussion for each section of the reporting score system follows below:
KIDNEY
The “Report Adequacy Score” for the “kidney” had the highest average score of all
the sections, but an average well below 50% (40.9% of the total possible points
awarded). No reports achieved the maximum of 8. The most frequent criteria

57
documented were ‘size measurement’, followed by ‘echogenicity’. Precise
standardised techniques are required when measuring the size of the kidney on
ultrasound. Hederstrom and Forsberg, described ultrasound to be a “reliable and
suitable alternative to urography in periodic controls of kidney size and growth in
children’’. 21
Accurate kidney measurement is important for follow-up and should be measured
in a standardized fashion. 22 “Renal disease may augment or decrease organ size
with or without simultaneous alterations in renal architecture.” 22 This is relevant
with regard to the pathological yield, where “abnormal echogenicity” and
“abnormal size” were the third and fourth most common renal pathologies. 99% of
reports failed to state the international normal values, which is important
information for the clinician who may be following up the patient and may not have
access to the same charts for this population. The RSNA guidelines make special
mention of measured size and comparison to normal standard and deviations from
the mean for age.6 Renal size charts for age are widely available and should be
accessible in every ultrasound room. Dinkel et al, described that “growth charts for
kidney length and volume in childhood are constructed and provide the basis for
objective intra- and interindividual determination of renal size.”22

58
SPECIFIC COMMENTS
“Specific comments” referred to comments on hydronephrosis, hydroureter,
calculi, focal lesions and anomalies. Most reports scored 40% “Reporting
Adequacy” for this subcategory. After renal size measurement, the “presence or
absence of hydronephrosis” / “prominence of the calyceal” system was the most
commonly reported finding. The “presence or absence of hydroureter” was
reported more often than “calculi”. “Hydroureter” and “hydronephrosis” were the
commonest pathological findings (7% and 13% of all patients imaged respectively)
in comparison to “calculi” which were the least common pathology (1% of all
patients imaged). Hydronephrosis is an important comment in reports, as it is not
only a common abnormal finding but also a surgically correctable one.
Furthermore, children with hydronephrosis require follow-up for decisions on
further management. This is best performed in a repeatable manner using the AP-
renal pelvis diameter (see below).
“The major aim of the evaluation of children with UTI is to attain prognostic
information related to permanent renal damage (PRD)”.23 Muller et al, investigated
the role of ultrasound in predicting PRD in the setting of paediatric UTIs. It was
described that “vesico-ureteric reflux (reflux), obstruction, and anomalies” may
suggest or reveal children at risk of permanent renal damage. It was concluded
that “dilating reflux and obstruction are strong indicators of PRD”.23 The worst
score for a “specific comment” was for the presence or absence of “anomalies”.
Fewer than 20% of the reports commented on “anomalies. Comments regarding

59
“calculi” were more frequent; however on analysing the abnormal yield, “calculi”
were a less common abnormality, than “anomalies”.
AP PELVIS AND DISTAL URETER
The two descriptions scoring the worst on “Reporting Adequacy” were the “AP
pelvis” followed by the “distal ureter”. The presence or the absence of the distal
ureters was only commented on in 10% of all reports. 93% of the reports did not
make a comment on the AP pelvis or measure it. The AP Pelvis has been the
focus of much research, as it is a reproducible measurement which can be used
for comparison and follow-up of hydronephrosis. Blane et al, suggested a need for
“further evaluation in children with calyceal dilatation and/or dilatation of the
anteroposterior renal pelvis greater than 10mm.”24
BLADDER
The bladder was not recorded as “not visualised”, “measured” or “empty” in a large
proportion of studies (67%), for the total and UTI subgroups. We have also falsely
inflated the score for the bladder wall measurement, by automatically awarding
points when the bladder was empty – because of the inaccuracy of measuring the
wall when the bladder is empty. Thus although bladder thickness was scored as

60
recorded in 33%, this includes the studies that received a point when the bladder
was recorded empty. Post-micturition volume calculations were documented more
frequently than the pre-micturation bladder volume, for the total and UTI
subgroups. “An abnormal post-void residual urine could be defined as post void
residual urine greater than 20ml, rather than as greater than 10% bladder
capacity, on repeat micturitions without bladder over distension”. 25 Only 8% of the
total group, documented a comment regarding the post-micturation bladder
volume, which is inadequate as the presence of abnormal residual volume, was
the second commonest bladder pathology. Numerous factors have been cited to
affect the post void residual volume. An excessively distended bladder, the child`s
age and hydration are thought to affect the post void residual volume. 25 Shaikh et
al, documented a significant relationship between the number of UTIs occurring
after the initial visit and the volume of residual urine.26 Modern paediatric
guidelines advocate that bladder wall thickness and both pre and post micturition
measurements be calculated. “Assessment of post-void residual urine volume is
mandatory in a variety of pediatric patients, such as those with voiding
dysfunction, spinal cord closure abnormalities (myelodysplasia), UTIs,
vesicoureteral reflux, and posterior urethral valves.”27

61
3.2. LIMITATIONS
The results of this retrospective study are specific to the practises at one institution
without a paediatric radiologist subspecialist, and may not represent general
practise. Only the records that were filed at the radiology department were used
and these were often carbon copies of the original report. The quality of these
varied and if the reports were deemed to be illegible, then those reports were
excluded. This may have led to some bias with certain doctors reports being
consistently excluded for poor legibility which may be reflection of shoddy
reporting and ultrasound technique. If sections of the requests were incomplete,
for example age or gender, those specific areas in the data collection were
marked as incomplete, and the other complete areas were recorded, and used for
analysis by performing calculations out of modified totals.
Registrars and consultants involved belong to a larger multi-institutional rotation
program including 4 academic hospitals and some consultants perform sessions at
multiple private practices in Johannesburg. Registrars, who have completed one
year of training, are allocated a specific one month paediatric rotation at CMJAH.
Registrars training in paediatric imaging, work in ultrasound daily for that period.
Data has been collected for 14 months, wherein a minimum of 14 registrars have
completed their paediatric training. This study represents approximately 35
different reporting styles.
62
3.3. CONCLUSION
Renal ultrasounds are frequently requested to evaluate and follow-up children, for
many different conditions but urinary tract infections are the commonest indication
for renal ultrasound in our setting. The referring doctors’ UTI requests were poor,
with essential information not documented in the majority.
Paediatric renal ultrasounds are reported suboptimally, when measured on our
“Report Adequacy Score”. The poor reporting quality was independent of the
clinician’s request quality, rank of reporting doctor, the type of study or the
indication. The mean “Report Adequacy Score” for the total group was 32% of the
total possible score. However, registrars reported significantly better than
consultants suggesting that training doctors follow guidelines and practise
standardised methods.
Most often renal ultrasound examinations were normal. An array of pathology was
noted in the abnormal studies, with hydronephrosis and hydroureter being the
commonest. The presence of pathology showed no relationship to gender. The
follow-up and management of hydronephrosis is reliant on accurate
comprehensive documentation of measurements, such as the AP pelvis which
was the worst performed part of the reports.
Specialised Paediatric radiology units, are recognised to be a vital component of
Radiology Departments, however paediatric subspecialists are scarce. It has also

63
been recognised that there is a fine balance between registrar teaching and
service delivery. Often training and supervision are given less priority in busy
departments. Further training, for all doctors performing paediatric ultrasounds is
needed and a standardised reporting template has been developed to address the
reporting weaknesses, while allowing for individual reporting styles.

64
3.4. RECOMMENDATIONS AND AREAS FOR FURTHER RESEARCH
A recommended reporting guideline, based on our “Reporting Adequacy Score”,
has been produced for use in the local setting. This is reproduced in appendix 5.5.
The guideline template is inspired by the literature and the results of this study.
This is intended to address reporting deficiencies and encourage a standardised
reporting technique. Use of this reporting template ensures documentation of each
important subcomponent of the study, also allowing for a reproducible and
comparable reporting style. There is also provision for further description of
pathology, in the “Additional Findings”. A “follow-up and recommendation” section
is provided, which is important in the management of pathology, such as
hydronephrosis. Figures 1 – 12 are ultrasound equivalent images for the
recommended reporting categories in the guideline. Furthermore, pathological
example US images are provided for comparison and self learning.
We advocate dedicated paediatric radiology units, staffed with paediatric
subspecialists, most especially at training institutions. This will afford training
radiologists better teaching and guidance. A follow-up study will be performed to
assess if the use of a reporting template improves reporting adequacy. Also new
studies assessing reporting skills in other imaging modalities are recommended,
as this will ensure better radiology practise overall and improve patient care.

65
4. REFERENCES
1. Shah G, Upadhyay J. Controversies in the diagnosis and management of
urinary tract infections in children. Paediatr Drugs 2005;7(6):339-46.
2. Biassoni L, Chippington S. Imaging in urinary tract infections: current
strategies and new trends. Semin Nucl Med 2008;38(1):56-66.
3. Lim R. Vesicoureteral reflux and urinary tract infection: evolving practices
and current controversies in pediatric imaging. AJR Am J Roentgenol
2009;192(5):1197-208.
4. Rosenberg HK, Ilaslan H, Finkelstein MS. Work-up of urinary tract infection
in infants and children. Ultrasound Q 2001;17(2):87-102.
5. Kahn CE Jr, Langlotz CP, Burnside ES, Carrino JA, Channin DS, Hovsepian
DM, Rubin DL. Toward best practices in radiology reporting. Radiology
2009;252(3):852-856.
6. RSNA, Paediatric Radiology Templates: US Peds Renal
http://reportingwiki.rsna.org/index.php?title=Pediatric_Radiology (template)
Accessed on 22/12/2010
7. Liu JX, Leung VY, Chu WC, Sreedhar B, Metreweli C, Yeung CK.
Characteristics of the bladder in infants with urinary tract infections: an
ultrasound study. Pediatr Radiol 2008;38(10):1084-8.

66
8. Leung VY, Rasalkar DD, Liu JX, Sreedhar B, Yeung CK, Chu WC. Dynamic
ultrasound study on urinary bladder in infants with antenatally detected fetal
hydronephrosis. Pediatr Res 2010;67(4):440-3.
9. Hiorns MP. Imaging of urinary tract lithiasis: who, when and how? Pediatr
Radiol 2008;38 Suppl 3:S497-500.
10. Sistrom CL, Langlotz CP. A Framework for Improving Radiology Reporting.
J Am Coll Radiol 2005;2(2):159-167.
11. Dacher JN, Lechevallier J. The exam request seen by the radiologist, the
report seen by the clinician. J Radiol 1999;80(8):855-8.
12. Stavem K, Foss T, Botnmark O, Andersen OK, Erikssen J.
Inter-observer agreement in audit of quality of radiology requests and reports,
Clinical Radiology 2004;59(11):1018-1024.
13. Naik SS, Hanbidge A, Wilson SR. Radiology Reports: examining radiologist
and clinician preferences regarding style and content. AJR Am J
Roentgenol 2001;176(3):591–598.
14. Nadi HM, Shalan YAF, Al-Qatan HY, Alotaibi S. Urinary Tract Infection in
Boys Less Than Five Years of Age: A General Pediatric Perspective.
Kuwait Med J 2006; 38(3): 220–225.
15. Bouskraoui M, Ait Sab I, Draiss G, Bourrouss M, Sbihi M. Epidemiology of
urinary tract infection in children in Marrakech. Arch Pediatr 2010;17 Suppl
4:S177-8.

67
16. Goldman M, Lahat E, Strauss S, Reisler G, Livne A, Gordin L, Aladjem M.
Pediatrics. Imaging after urinary tract infection in male neonates.
2000;105(6):1232-5.
17. Langlotz CP. Automatic Structuring of Radiology Reports: Harbinger of a
Second Information Revolution in Radiology. Radiology 2002;224(1):5-7.
18. Noumeir R. Benefits of the DICOM Structured Report. Journal of Digit
Imaging 2006;19(4):295-306.
19. Jankharia B. The subspecialization conundrum, Indian J Radiol Imaging
2010;20(1):1.
20. Strife JL, Ball WS Jr. Research in pediatric radiology: preparing for our
future. Pediatr Radiol. 1998; 28(8):563-8.
21. Hederstrom E, Forsberg L. Kidney size in children assessed by
ultrasonography and urography. Acta Radiol Diagn (Stockh) 1985;26(1):85-
91.
22. Dinkel E, Ertel M, Dittrich M, Peters H, Berres M, Schulte- Wissermann H.
Kidney size in childhood: Sonographical growth charts for kidney length
and volume. Pediatr Radiol 1985; 15(1):38-43.
23. Muller L, Preda I, Jacobsson B, Sixt R, Jodal U, Hansson S, Hellstrom M.
Ultrasonography as predictor of permanent renal damage in infants with
urinary tract infection. Acta Paediatrica 2009;98(7):1156-1161.
24. Blane CE, DiPietro MA, Strouse PJ, Koo HP, Bloom DA. Pediatric Renal
Pelvic Fullness: An Ultrasonographic Dilemma. J Urol 2003; 170(1):201-
203.

68
25. Chang S, Yang SS. Variability, Related Factors and Normal reference
Value of Post-Void Residual Urine in Healthy Kindergarteners. J Urol
2009;182(4):1933-8.
26. Shaikh N, Abedin S, Docimo SG. Can ultrasonography or uroflowmetry
predict which children with voiding dysfunction will have recurrent urinary
tract infections? J Urol 2005;174(4):1620-1622.
27. Kelly CE. Evaluation of voiding dysfunction and measurement of bladder
volume. Rev Urol 2004;6 Suppl 1:32-7.
69
5. APPENDICES
5.1) RSNA Radiology Template
5.2) Human Research Ethics Clearance Committee(Medical)
Clearance Certificate
5.3) Letter granting permission to conduct research at Charlotte Maxeke
Johannesburg Academic Hospital
5.4) Data Collection Sheets
a) Adequacy of Requests Sheet and General Info
b) Rank of Reporting Radiologist
c) Type of Request & Indication for Renal Ultrasound
d) Adequacy of Report Sheet
(1) Kidney Comments
(2) Specific Comments
(3) Distal Ureter and Bladder
(4) AP Renal Pelvis
e) Correlate “Report Adequacy” Score and the “Assessment”
Section
f) Abnormal Assessments
(1) Yield of Renal Pathology
(2) Yield of Bladder Pathology
5.5) Suggested Reporting Template

APPENDIX 5.1
RSNA Radiology Reporting Template

RSNA Radiology Reporting Template
Copyright (c) 2009, Radiological Society of North America, Inc. (RSNA) ALL RIGHTS RESERVED. This file is part of the "RSNA Radiology Reporting Templates." The "RSNA Radiology Reporting Templates" are licensed without charge under the RSNA's license agreement (the "License"); you may not use this file except in compliance with the License. You may obtain a copy of the License at: http://reportingwiki.rsna.org/index.php?title=File:License.doc Unless required by applicable law or agreed to in writing, software distributed under the License is distributed on an "AS IS" BASIS, WITHOUT WARRANTIES OR CONDITIONS OF ANY KIND, either express or implied. See the License for the specific language governing permissions and limitations under the License. ______________________________________________________________________
The renal ultrasound reporting template, publication or knowledgebase listed below is based on the RSNA Radiology Reporting Templates developed at the Radiological Society of North America, Inc. (RSNA) by the RSNA Radiology Reporting Committee and its subspecialty subcommittees and is provided under license from RSNA.
History: [Urinary tract infection | Hydronephrosis]. Comparison: [<date> | None*].
Technique: The kidneys and bladder were evaluated at real-time sonographically with static gray scale images obtained for image documentation.
Findings: Mean renal length for age is [#] +/- [#] cm for two standard deviations.
The right kidney is [normal in location, contour and length*], measuring [#] cm. [There is no stone or renal mass*.] [There is no focal parenchymal thinning or hydronephrosis.*] The left kidney is [normal in location, contour and length*], measuring [#] cm. [There is no stone or renal mass*.] [There is no focal parenchymal thinning or hydronephrosis.*] There is [no | mild | moderate | severe ] [right | left | bilateral ] distal ureteral dilatation at the level of the [minimally | mildly | moderately | hugely] distended urinary bladder. Images of the IVC and abdominal aorta are [normal*].
Impression: [Normal renal ultrasound with appropriate renal growth|
Normal renal ultrasound with appropriate renal growth and resolution of prior collecting system dilatation].
APPENDIX 5.2
Human Research Ethics Clearance Committee(Medical) Clearance Certificate
APPENDIX 5.3
Letter granting permission to conduct research at
Charlotte Maxeke Johannesburg Academic Hopsital


APPENDIX 5.4
Data Collection Sheets
a. Adequacy of Requests Sheet and General Info
b. Rank of Reporting Radiologist
c. Type of Request & Indication for Renal Ultrasound
d. Adequacy of Report Sheet
1. Kidney Comments
2. Specific Comments
3. Distal Ureter and Bladder
4. AP Renal Pelvis
e. Correlate “Report Adequacy” Score and the “Assessment” Section
f. Abnormal Assessments
1. Yield of Renal Pathology
2. Yield of Bladder Pathology

Appendix 5.4 Data Collection Sheets
a. Adequacy of Request Sheet
Adequacy of Requests and General Info.
General Information “Request Adequacy” Score
Number Gender
Age
Onset of
Urinary Tract
Infection
Culture
positive or
significant
biochemical
results
Name of
causative
pathogen
(Ecoli,Klebs,
Proteus,other)
Score
[Score1] [Score1] [Score1] [ / 3]
001
002
003
004

Appendix 5.4 Data Collection Sheets
b. Rank of Reporting Radiologist
Rank of Reporting Radiologist
Number Registrar
Consultant
Registrar assisted by Consultant
or fellow registrar
001
002
003
004
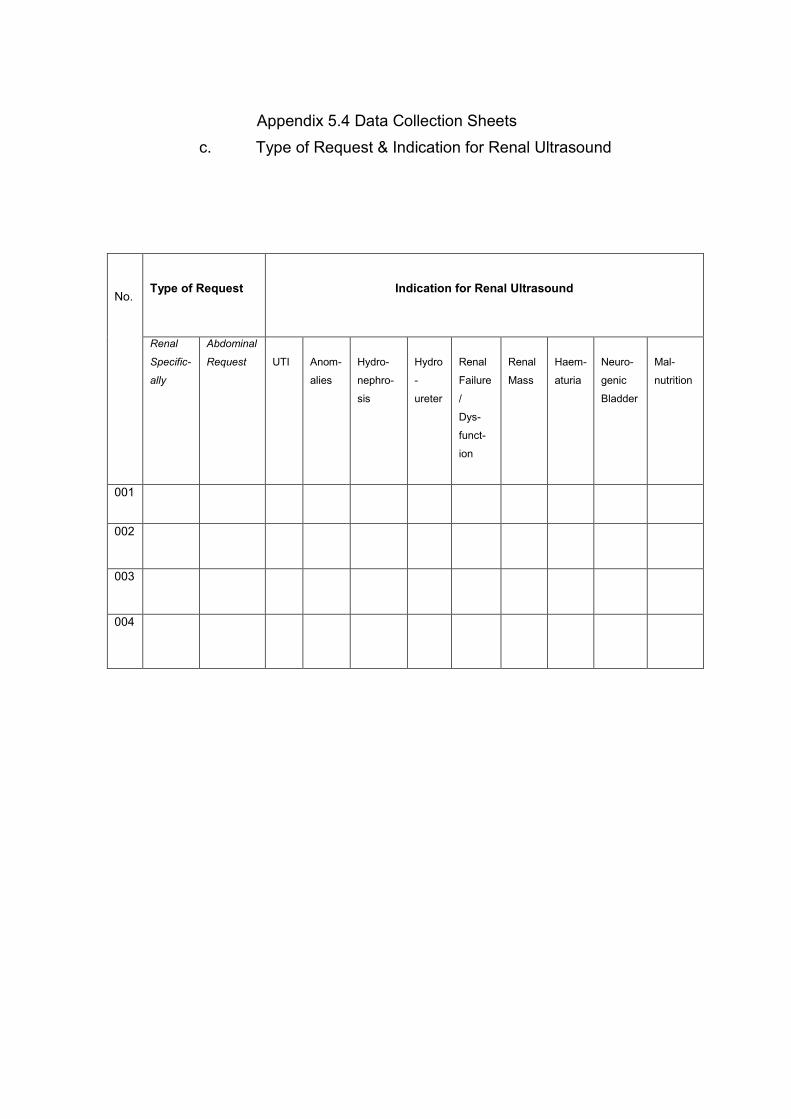
Appendix 5.4 Data Collection Sheets c. Type of Request & Indication for Renal Ultrasound
No.
Type of Request
Indication for Renal Ultrasound
Renal
Specific-
ally
Abdominal
Request
UTI
Anom-
alies
Hydro-
nephro-
sis
Hydro
-
ureter
Renal
Failure
/
Dys-
funct-
ion
Renal
Mass
Haem-
aturia
Neuro-
genic
Bladder
Mal-
nutrition
001
002
003
004

Appendix 5.4 Data Collection Sheets d. Adequacy of Report Sheet
1) Kidney Comments
Adequacy of report
Kidney Comments
No. No comment or measure-ment of kidneys
Comment on any of:
• Presence
• normality
• size of one / both kidneys
Value of size in SI units
Normal international predicted values for age provided
Comment normal for age
Location
Contour
Comment on cortico-medullary differentiation
Comment on echogenicity:
• Normal
• Hypoechoic
• Hyperechoic
Score
[Score 0 overall]
[Score 1] [Score 1] [Score 1] [Score 1] [Score 1] [Score 1] [Score 1] [Score 1] [ /8]
001
002
003
004

Appendix 5.4 Data Collection Sheets
d. Adequacy of Report Sheet
2) Specific Comments
Adequacy of report
Specific comments
No. • Hydronephrosis
• pelvis or
pelvicalyceal
prominence
• description of
uppertracts
Hydroureter
Renal calculi
Or
nephrocalcinosis
Anomaly
Focal
lesions
Score
[Score 1] [Score 1] [Score 1]
[Score 1] [Score1] [ /5]
001
002
003
004

Appendix 5.4 Data Collection Sheets
d. Adequacy of Report Sheet
3) Bladder and Distal Ureter Comments
Adequacy of report:
Bladder and Distal ureter Comments
No Bladder comment Score
[ / 4]
Distal ureters Score
[ /1]
Bladder visualised or measured or recorded empty/collapsed
Bladder wall thickness measured or comment if abnormal / normal
or
If empty/ collapsed
Baldder volume measured
Post micturition bladder volume
or comment why not possible
No Comment
No comment on ureter
Comment visible or non-visible
[Score 1]
[Score 1] [Score 1]
[Score 1]
[Score 0] [ / 4] [Score 0]
[Score 1]
[ /1]
001
002
003
004
Appendix 5.4 Data Collection Sheets
d. Adequacy of Report Sheet
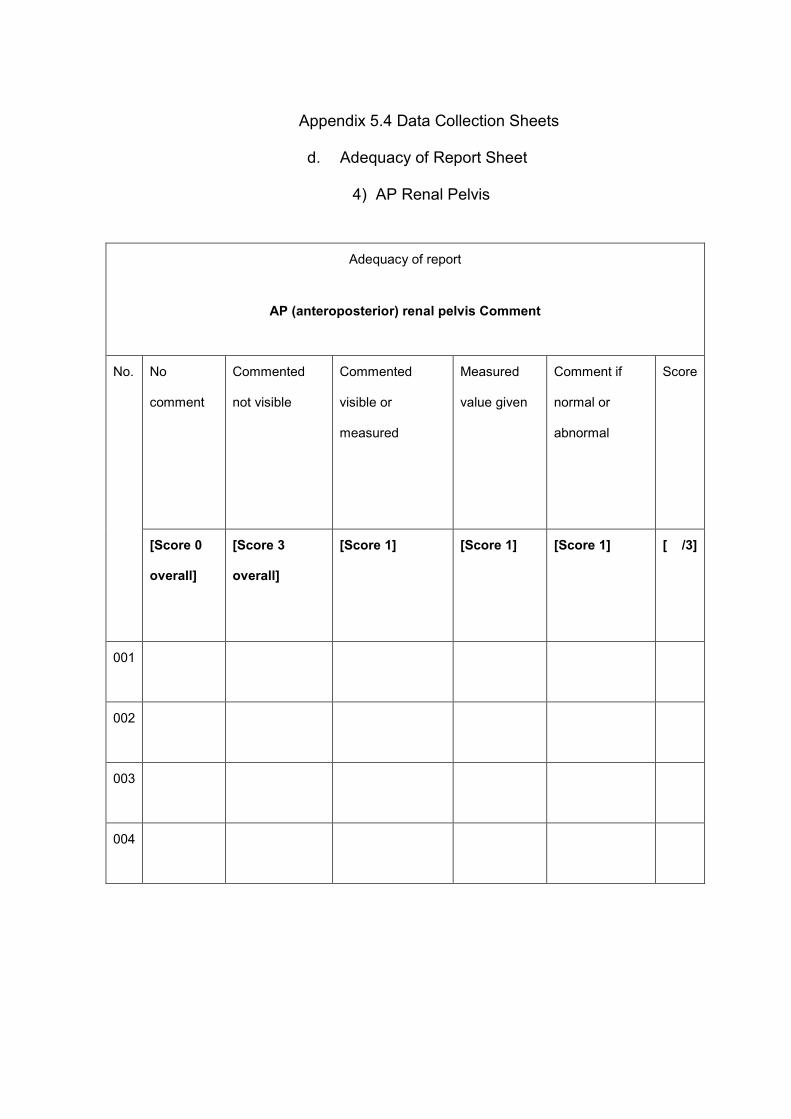
4) AP Renal Pelvis
Adequacy of report
AP (anteroposterior) renal pelvis Comment
No. No
comment
Commented
not visible
Commented
visible or
measured
Measured
value given
Comment if
normal or
abnormal
Score
[Score 0
overall]
[Score 3
overall]
[Score 1] [Score 1]
[Score 1] [ /3]
001
002
003
004

Appendix 5.4 Data Collection Sheets
e. Correlate “Report Adequacy” Score and the “Assessment” Section
Correlate “Report Adequacy” Score and the “Assessment” Section
No. Total “Report
Adequacy”
Score
Assessment Section
Normal U/S
Abnormal U/S
No Comment
[Maximum 21] [Score 1]
[Score1] [Score 0]
001
002
003
004

Appendix 5.4 Data Collection Sheets
f. Abnormal Assessments
1) Yield of Renal pathology
Abnormal Assessments
Yield of Renal Pathology
No. Hydronephrosis Hydroureter Abnormal
Echogenicity
Abnormal
Size
Calculus Pyelonephritis or
glomerulonephritis
Bladder
Pathology
Refer to
next table
001
002
003
004

Appendix 5.4 Data Collection Sheets
f. Abnormal Assessments
2) Yield of Bladder pathology
Abnormal Assessments
Yield of Bladder Pathology
No. Uterocele Calculi Diverticuli Wall
Thickening,
Trabeculation,
Irregular Wall
Residual
Volume
Bladder
outlet
obstruction
and other
001
002
003
004

APPENDIX 5.5
Suggested Reporting Template


