
• Corresponding author: Alok Kumar,E-mail address: [email protected]: http://dx.doi.org/10.11127/ijammc2017.04.07Copyright@GRIET Publications. All rights reserved.
Advanced Materials Manufacturing & Characterization Vol. 7 Issue 1 (2017)
Advanced Materials Manufacturing & Characterization
journal home page: www.ijammc-griet.com
Fatigue analysis of welded joints
Alok Kumara* V.Suresh Babub
a,bMechanical Engineering Department, NIT Warangal, Warangal
A B S T R A C T
Welded joint is commonly used joint for industrial application and its failure
under fluctuating load (fatigue) has been the concern in recent past. Fatigue
analysis of the welded joints requires a precise knowledge of the stress
distribution in the critical regions of the weld. There are various approaches
presented by IIW to determine the stress distribution in weld region. In
present work the nonlinear peak stress which is developed at the weld
region is linearized to get actual linearized stress distribution in the weld
region. The proposed method enables us to determine linearized peak stress
at the weld toe using shell modeling. A methodology is developed to
estimate Crack initiation life of welded joints. Neuber’s rule is used to
calculate the local stress and local strain by using elastic stresses obtained
from FEA. Strain life equation is used to estimate the crack initiation life
using the local stress and strains. Keywords: Fatigue stress distribution,Weldedv joints,Life estimation,Finite element Analsis
1.Introduction
Fatigue in materials is a very complex process, as there are
many factors which effect the fatigue and these factors varies
from material to material so still the investigation is under
process to perceive the impact of the influential factors. Fatigue
in welds is even more complex as the microstructure of the
parent metal changes (HAZ) due to subsequent heating and
cooling during welding process. Moreover welds consists defects
like blow holes, slag inclusion undercuts etc. which leads to
unpredictable failure and in fact the shape of the weld and non-
welded weld gaps creates stress concentration which vary with
geometrical parameters of the weld. Residual stresses, which are
developed in the welded joints during welding due to uneven
cooling also effects the fatigue life of the weld. Due to this fatigue
analysis of the welded structures are of high practical interest
for e.g. Bridges, gas turbines, cranes etc. Various types of welded
joints are used for practical applications, among them fillet weld
is one of the commonly used welded joint so the same is used for
analysis. Fatigue cracks usually initiates at root and toe of the
weld. Mostly welds fail at toe because of high stress
concentration developed due notches and irregular weld
geometry at toe region and also due to tensile residual stresses
developed at toe region of the weld.
1.1 Fatigue analysis approaches
There are various approaches provided by IIW (International
Institute of Welding). [1]
• Nominal Stress Approach- The nominal stress approach
[1] is the simplest and the most common applied
method for estimating the fatigue life of steel
structures. This method is based on the average stress
along critical cross sections by considering overall
linear elastic beam behavior. The local stress
concentration effects of the welds and the attached
plates are neglected in stress calculations. This
approach assumes uniform stress distribution along
the throat of the weld.
• Structural hot-spot stress approach [2] - Structural
stress constitutes all notch effects of the main component but not
the notch effect caused by the weld profile itself, i.e. membrane
stress plus the linear shell bending stress, but not the non-linear
stress peak.It may be measured by strain gauges when the
assessment is based on the strains and calculated by
engineeringformulas or finite element analysis when stresses
are used as basis to do the evaluation. The structural hot-spot
stress assumes the weld is free of defects and failure (crack
initiation) will take place at toe. The structural stress is also
known as geometric stress and it considers linearized stress
without considering non-linear peak stress locally. The
33
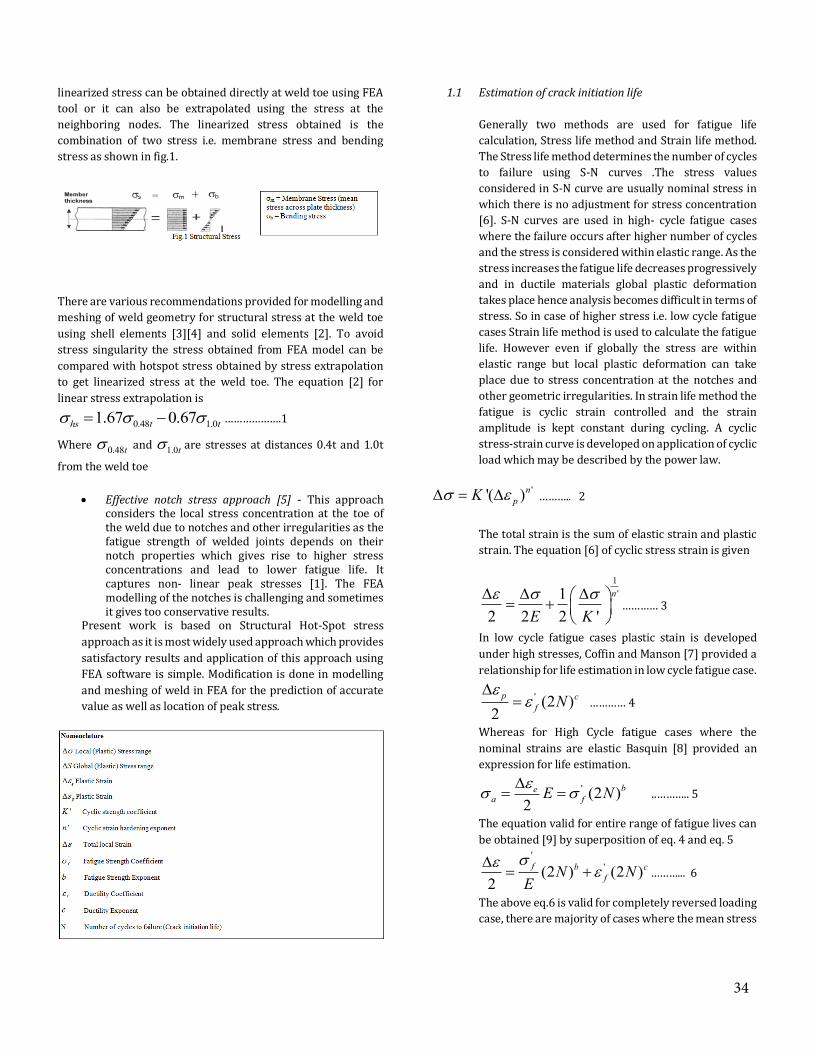
linearized stress can be obtained directly at weld toe using FEA
tool or it can also be extrapolated using the stress at the
neighboring nodes. The linearized stress obtained is the
combination of two stress i.e. membrane stress and bending
stress as shown in fig.1.
There are various recommendations provided for modelling and
meshing of weld geometry for structural stress at the weld toe
using shell elements [3][4] and solid elements [2]. To avoid
stress singularity the stress obtained from FEA model can be
compared with hotspot stress obtained by stress extrapolation
to get linearized stress at the weld toe. The equation [2] for
linear stress extrapolation is
0.48 1.01.67 0.67hs t t ……………….1
Where 0.48t and
1.0t are stresses at distances 0.4t and 1.0t
from the weld toe
• Effective notch stress approach [5] - This approach considers the local stress concentration at the toe of the weld due to notches and other irregularities as the fatigue strength of welded joints depends on their notch properties which gives rise to higher stress concentrations and lead to lower fatigue life. It captures non- linear peak stresses [1]. The FEA modelling of the notches is challenging and sometimes it gives too conservative results.
Present work is based on Structural Hot-Spot stress
approach as it is most widely used approach which provides
satisfactory results and application of this approach using
FEA software is simple. Modification is done in modelling
and meshing of weld in FEA for the prediction of accurate
value as well as location of peak stress.
1.1 Estimation of crack initiation life
Generally two methods are used for fatigue life
calculation, Stress life method and Strain life method.
The Stress life method determines the number of cycles
to failure using S-N curves .The stress values
considered in S-N curve are usually nominal stress in
which there is no adjustment for stress concentration
[6]. S-N curves are used in high- cycle fatigue cases
where the failure occurs after higher number of cycles
and the stress is considered within elastic range. As the
stress increases the fatigue life decreases progressively
and in ductile materials global plastic deformation
takes place hence analysis becomes difficult in terms of
stress. So in case of higher stress i.e. low cycle fatigue
cases Strain life method is used to calculate the fatigue
life. However even if globally the stress are within
elastic range but local plastic deformation can take
place due to stress concentration at the notches and
other geometric irregularities. In strain life method the
fatigue is cyclic strain controlled and the strain
amplitude is kept constant during cycling. A cyclic
stress-strain curve is developed on application of cyclic
load which may be described by the power law.
''( )npK ……….. 2
The total strain is the sum of elastic strain and plastic
strain. The equation [6] of cyclic stress strain is given
1
'1
2 2 2 '
n
E K
………… 3
In low cycle fatigue cases plastic stain is developed
under high stresses, Coffin and Manson [7] provided a
relationship for life estimation in low cycle fatigue case.
' (2 )2
p c
f N
………… 4
Whereas for High Cycle fatigue cases where the
nominal strains are elastic Basquin [8] provided an
expression for life estimation.
' (2 )2
bea fE N
..……….. 5
The equation valid for entire range of fatigue lives can
be obtained [9] by superposition of eq. 4 and eq. 5 '
'(2 ) (2 )2
f b c
fN NE
………... 6
The above eq.6 is valid for completely reversed loading
case, there are majority of cases where the mean stress
34
m is not zero. Morrow [10] provided an expression
considering mean stress. '
'(2 ) (2 )2
f m b c
fN NE
……….. 7
Strain life method predicts the crack initiation life at
notches or other geometrical discontinuities where
nominal stress are elastic but local stresses and strains
are inelastic. During plastic deformation both stress
concentration factor K and strain concentration
factor K needs to be considered which are linked by
Neuber’s rule [11] which states that the theoretical
stress concentration factor tK is equal to the
geometric mean of the stress and strain concentration
factors. The expression given by Neuber’s rule is 2( . )
.fK S
E
………… 8
fK (Fatigue stress concentration factor) tK . In
above eq.8, stress and strain amplitude can also be
used in place of stress and strain range.
1. Methodology and FEA Simulation
The steps followed are summarized as follows-
• Modelling and Meshing of the welded joint is done in FEA software.
• Application of boundary conditions and the load steps for fatigue loading.
• Extraction of peak elastic stresses from FEA software.• Calculation of local stress and strains using Neuber’s
rule. • Crack initiation life estimation using Strain-life
method. For the application of above methodology a fillet welded T joint
is taken for fatigue analysis. Two plates are joined using fillet
weld.
Dimension of plate 1 is 1000 x 500 x 50 and plate 2 is 550 x 500
x 50.The FEA simulation is done in ANSYS 15.0. The material
used is Structural Steel and the properties are taken by default
from ANSYS 15.0 which has referred ASME [12] for properties of
Structural Steel and it is provided as follows.
Properties Value
Yield Strength 250 MPa
Ultimate Tensile Strength 460 MPa
Fatigue Strength Coefficient 920 MPa
Fatigue Strength exponent - 0.106
Ductility Coefficient 0.213
Ductility exponent - 0.47
Cyclic Strength coefficient 1000 MPa
Cyclic strain hardening exponent 0.2
Young’s Modulus 200 GPa
Table 1. Properties of Structural Steel
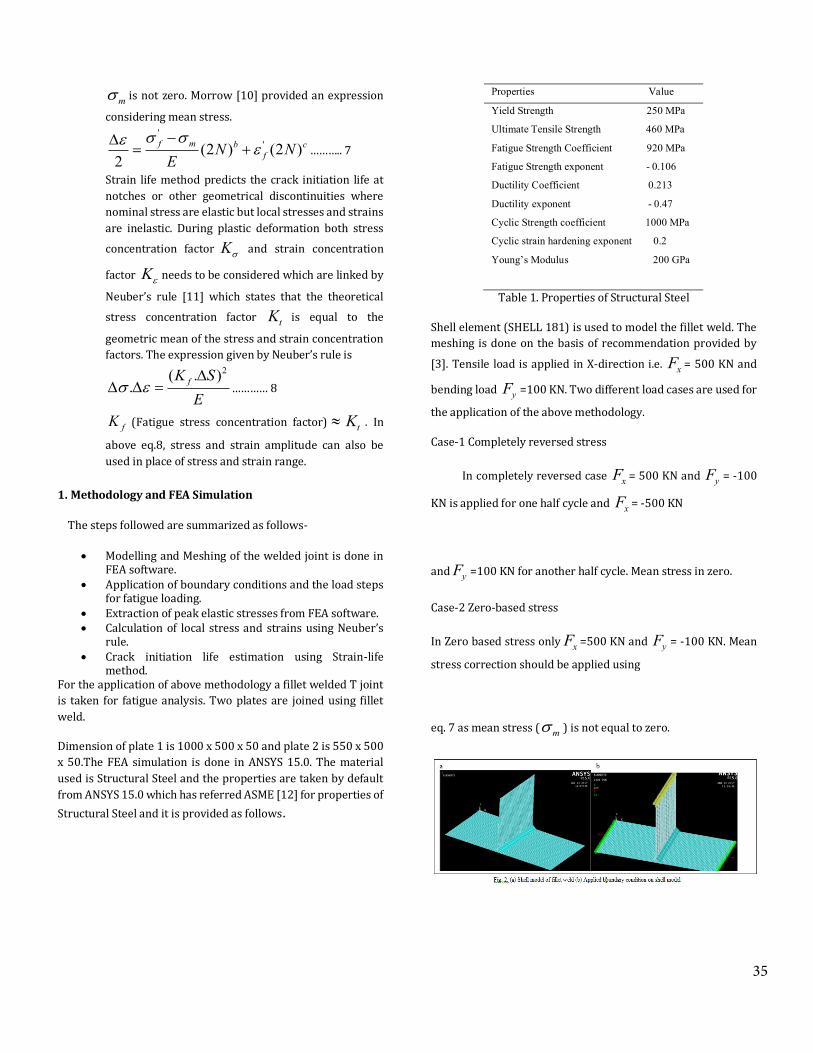
Shell element (SHELL 181) is used to model the fillet weld. The
meshing is done on the basis of recommendation provided by
[3]. Tensile load is applied in X-direction i.e. xF = 500 KN and
bending load yF =100 KN. Two different load cases are used for
the application of the above methodology.
Case-1 Completely reversed stress
In completely reversed case xF = 500 KN and
yF = -100
KN is applied for one half cycle and xF = -500 KN
and yF =100 KN for another half cycle. Mean stress in zero.
Case-2 Zero-based stress
In Zero based stress onlyxF =500 KN and yF = -100 KN. Mean
stress correction should be applied using
eq. 7 as mean stress (m ) is not equal to zero.
35
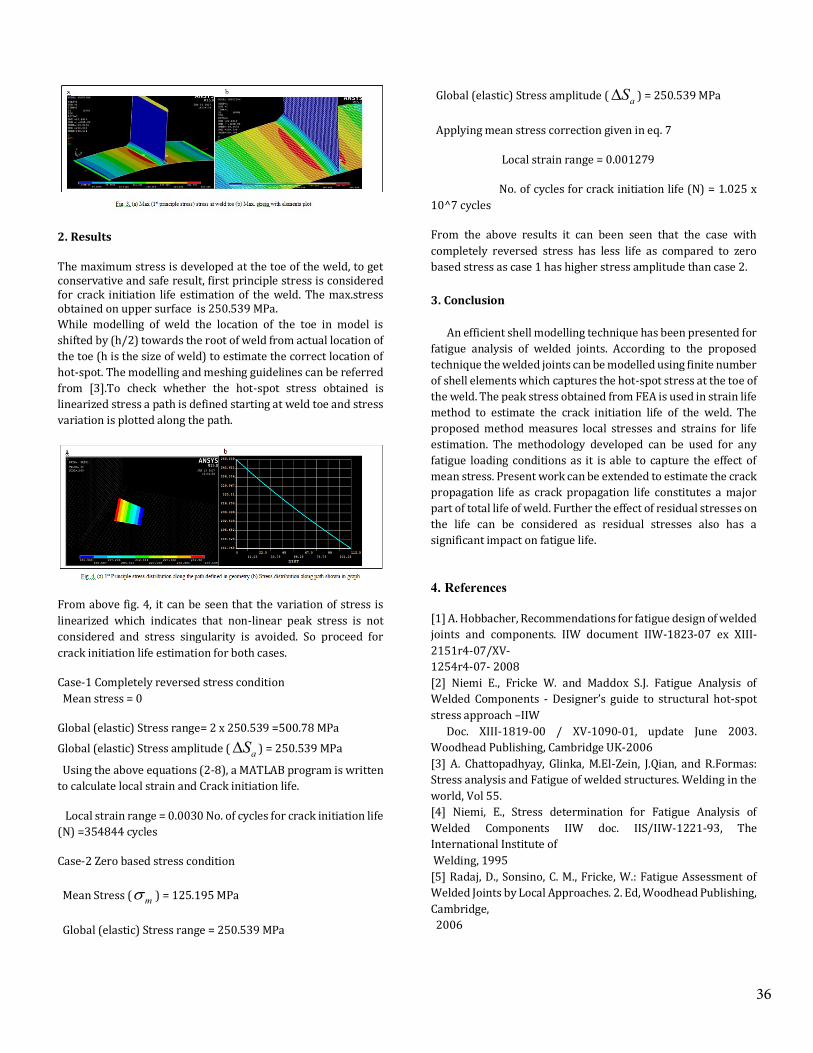
2. Results
The maximum stress is developed at the toe of the weld, to get conservative and safe result, first principle stress is considered for crack initiation life estimation of the weld. The max.stress obtained on upper surface is 250.539 MPa.
While modelling of weld the location of the toe in model is
shifted by (h/2) towards the root of weld from actual location of
the toe (h is the size of weld) to estimate the correct location of
hot-spot. The modelling and meshing guidelines can be referred
from [3].To check whether the hot-spot stress obtained is
linearized stress a path is defined starting at weld toe and stress
variation is plotted along the path.
From above fig. 4, it can be seen that the variation of stress is
linearized which indicates that non-linear peak stress is not
considered and stress singularity is avoided. So proceed for
crack initiation life estimation for both cases.
Case-1 Completely reversed stress condition
Mean stress = 0
Global (elastic) Stress range= 2 x 250.539 =500.78 MPa
Global (elastic) Stress amplitude (aS ) = 250.539 MPa
Using the above equations (2-8), a MATLAB program is written
to calculate local strain and Crack initiation life.
Local strain range = 0.0030 No. of cycles for crack initiation life
(N) =354844 cycles
Case-2 Zero based stress condition
Mean Stress (m ) = 125.195 MPa
Global (elastic) Stress range = 250.539 MPa
Global (elastic) Stress amplitude (aS ) = 250.539 MPa
Applying mean stress correction given in eq. 7
Local strain range = 0.001279
No. of cycles for crack initiation life (N) = 1.025 x
10^7 cycles
From the above results it can been seen that the case with
completely reversed stress has less life as compared to zero
based stress as case 1 has higher stress amplitude than case 2.
3. Conclusion
An efficient shell modelling technique has been presented for
fatigue analysis of welded joints. According to the proposed
technique the welded joints can be modelled using finite number
of shell elements which captures the hot-spot stress at the toe of
the weld. The peak stress obtained from FEA is used in strain life
method to estimate the crack initiation life of the weld. The
proposed method measures local stresses and strains for life
estimation. The methodology developed can be used for any
fatigue loading conditions as it is able to capture the effect of
mean stress. Present work can be extended to estimate the crack
propagation life as crack propagation life constitutes a major
part of total life of weld. Further the effect of residual stresses on
the life can be considered as residual stresses also has a
significant impact on fatigue life.
4. References
[1] A. Hobbacher, Recommendations for fatigue design of welded
joints and components. IIW document IIW-1823-07 ex XIII-
2151r4-07/XV-
1254r4-07- 2008
[2] Niemi E., Fricke W. and Maddox S.J. Fatigue Analysis of
Welded Components - Designer’s guide to structural hot-spot
stress approach –IIW
Doc. XIII-1819-00 / XV-1090-01, update June 2003.
Woodhead Publishing, Cambridge UK-2006
[3] A. Chattopadhyay, Glinka, M.El-Zein, J.Qian, and R.Formas:
Stress analysis and Fatigue of welded structures. Welding in the
world, Vol 55.
[4] Niemi, E., Stress determination for Fatigue Analysis of
Welded Components IIW doc. IIS/IIW-1221-93, The
International Institute of
Welding, 1995
[5] Radaj, D., Sonsino, C. M., Fricke, W.: Fatigue Assessment of
Welded Joints by Local Approaches. 2. Ed, Woodhead Publishing,
Cambridge,
2006
36
[6] George E. Dieter, Mechanical Metallurgy, 3rd Edition, Mc Graw
Hill Education-2013.
[7] L.F.Coffin, Jr, Trans. ASME, Vol. 76, pp.931-950, 1954
[8] Basquin, O.H. , The exponential law of endurance tests,
Proceedings of ASTM, Vol. 10(II), pp. 625-630, 1990
[9] S.S. Manson and M.H. Hirschberg, Fatigue : An
Interdisciplinary approach, p. 133, Syracuse University Press,
N.Y. 1964
[10] Socie, D. F. and Morrow, J. D. (1980) Review of
contemporary approaches to fatigue damage analysis. In: Risk
and Failure Analysis for
Improved Performance and Reliability (Edited by J. J. Burke & V.
Weiss), Plenum Publication Corp., New York, NY, pp. 141–194
[11] Neuber H.: Theory of stress concentration for shearstrained
prismatic bodies with arbitrary non-linear stressstrain law,
ASME Journal of
Applied Mechanics, ASME, 1961, vol. 28, pp. 544-551
[12]Fatigue Data at zero mean stress comes from 1998 ASME BPV Code, Section 8, Div 2, Table 5-110.1
37


