

Advanced Study ProgramResearch Review
Tom Hopson
April 6, 2007

Overview:
I. Operational Bangladesh Flood Forecasting1. Background of project2. Precipitation inputs: ECMWF ensemble forecasts and satellite rainfall corrections3. Seasonal Forecasts4. Brahmaputra Pilot programs
II. Verifying the Relationship between Ensemble Forecast Spread and Skill
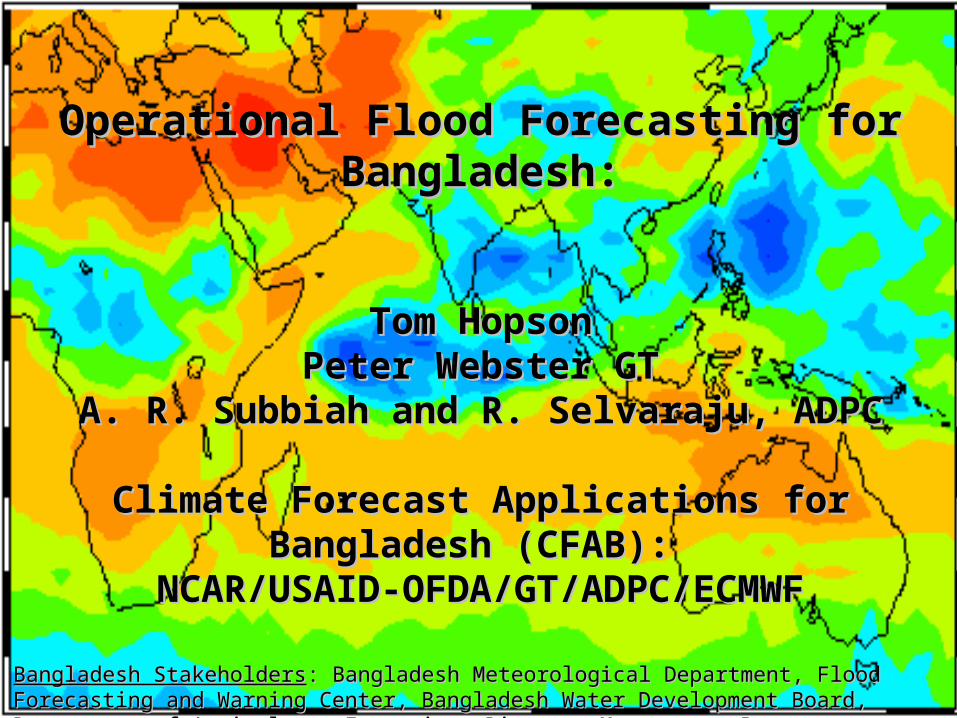
Operational Flood Forecasting for Operational Flood Forecasting for Bangladesh:Bangladesh:
Tom HopsonTom HopsonPeter Webster GTPeter Webster GT
A. R. Subbiah and R. Selvaraju, ADPCA. R. Subbiah and R. Selvaraju, ADPC
Climate Forecast Applications for Climate Forecast Applications for Bangladesh (CFAB): Bangladesh (CFAB):
NCAR/USAID-OFDA/GT/ADPC/ECMWFNCAR/USAID-OFDA/GT/ADPC/ECMWF
Bangladesh StakeholdersBangladesh Stakeholders: Bangladesh Meteorological Department, Flood Forecasting and Warning Center, : Bangladesh Meteorological Department, Flood Forecasting and Warning Center, Bangladesh Water Development Board, Department of Agriculture Extension, Disaster Management Bureau, Bangladesh Water Development Board, Department of Agriculture Extension, Disaster Management Bureau, Institute of Water Modeling, Center for Environmental and Geographic Information Services, CARE-Institute of Water Modeling, Center for Environmental and Geographic Information Services, CARE-BangladeshBangladesh


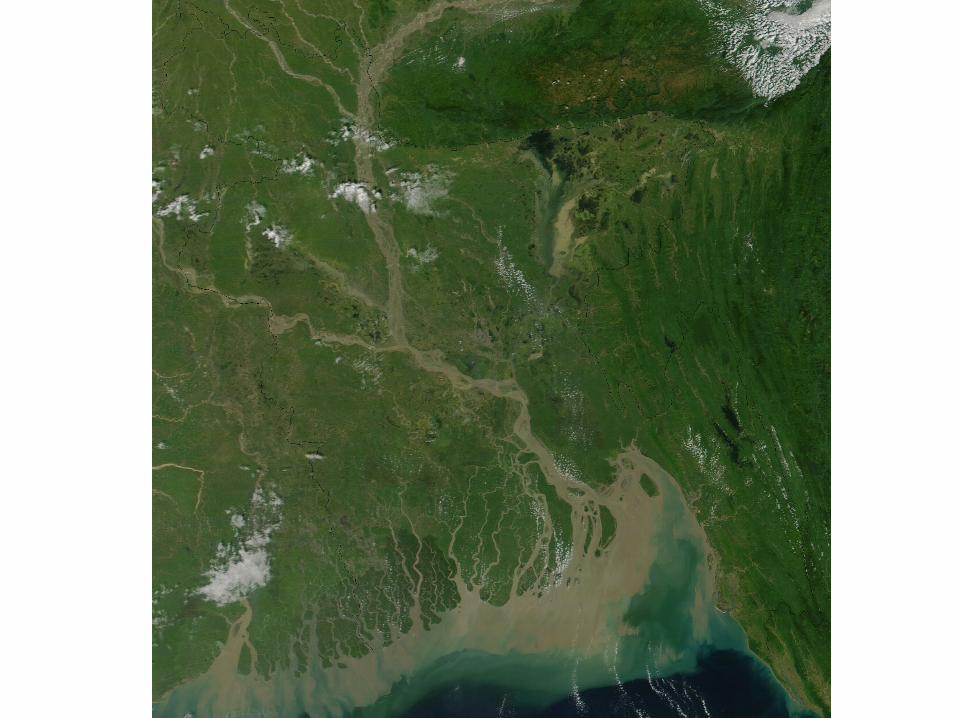
Bangladesh backgroundBangladesh background About 1/3 of land area floods the monsoon rainy season Size: slightly smaller than Iowa Border countries: Burma (193 km), India (4,053 km) Population: 140 million 36% of population below poverty line Within the top 5 of: poorest and most densely populated in the world
Sample of Flood History:
1988: 3/4 of country inundated, 1300 people killed, 30 million homeless, $1 billion in property loss
1998: 60% of country inundated for 3 months, 1000 killed, 40 million homeless
2004: flooding in Brahmaputra basin killed 500 people, displaced 30 million for 3 weeks, 40% of capitol city Dhaka (10 million people) under water
About 1/3 of land area floods the monsoon rainy season Size: slightly smaller than Iowa Border countries: Burma (193 km), India (4,053 km) Population: 140 million 36% of population below poverty line Within the top 5 of: poorest and most densely populated in the world
Sample of Flood History:
1988: 3/4 of country inundated, 1300 people killed, 30 million homeless, $1 billion in property loss
1998: 60% of country inundated for 3 months, 1000 killed, 40 million homeless
2004: flooding in Brahmaputra basin killed 500 people, displaced 30 million for 3 weeks, 40% of capitol city Dhaka (10 million people) under water

(World Food Program)

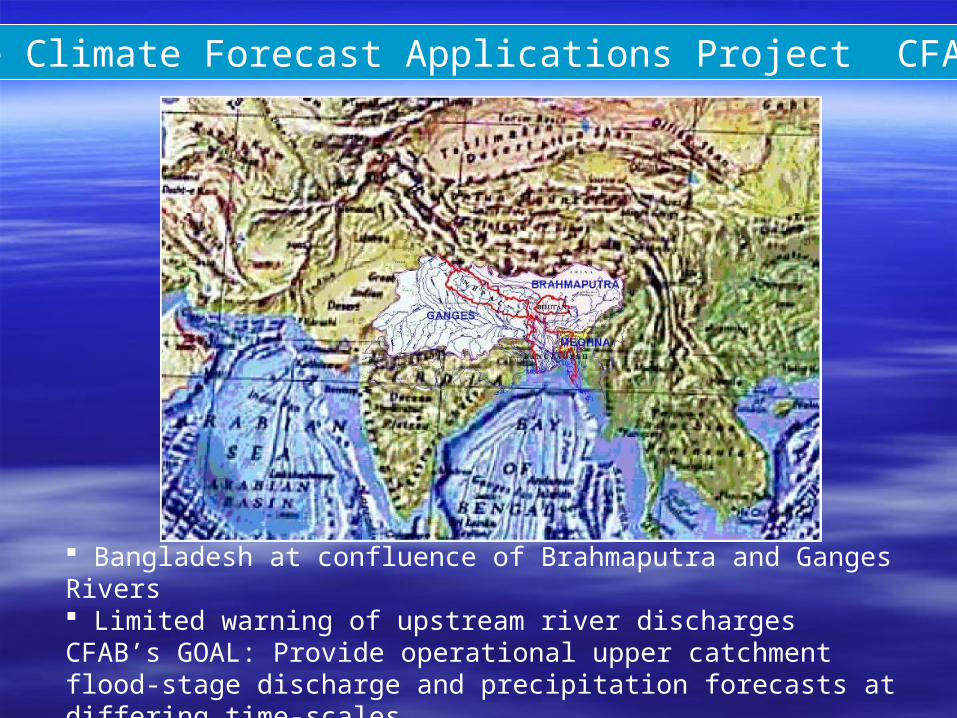
The Climate Forecast Applications Project CFAB
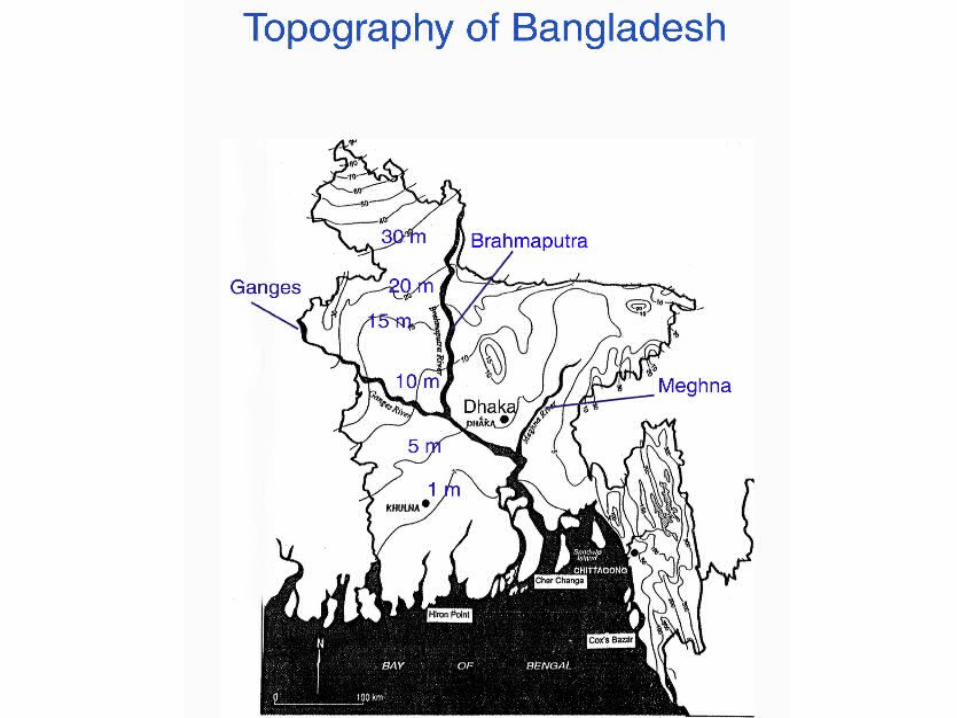
Bangladesh at confluence of Brahmaputra and Ganges Rivers Limited warning of upstream river dischargesCFAB’s GOAL: Provide operational upper catchment flood-stage discharge and precipitation forecasts at differing time-scales=> Utilize good quality daily border discharge measurements

Three-Tier Overlapping Forecast SystemDeveloped for Bangladesh
Three-Tier Overlapping Forecast SystemDeveloped for Bangladesh
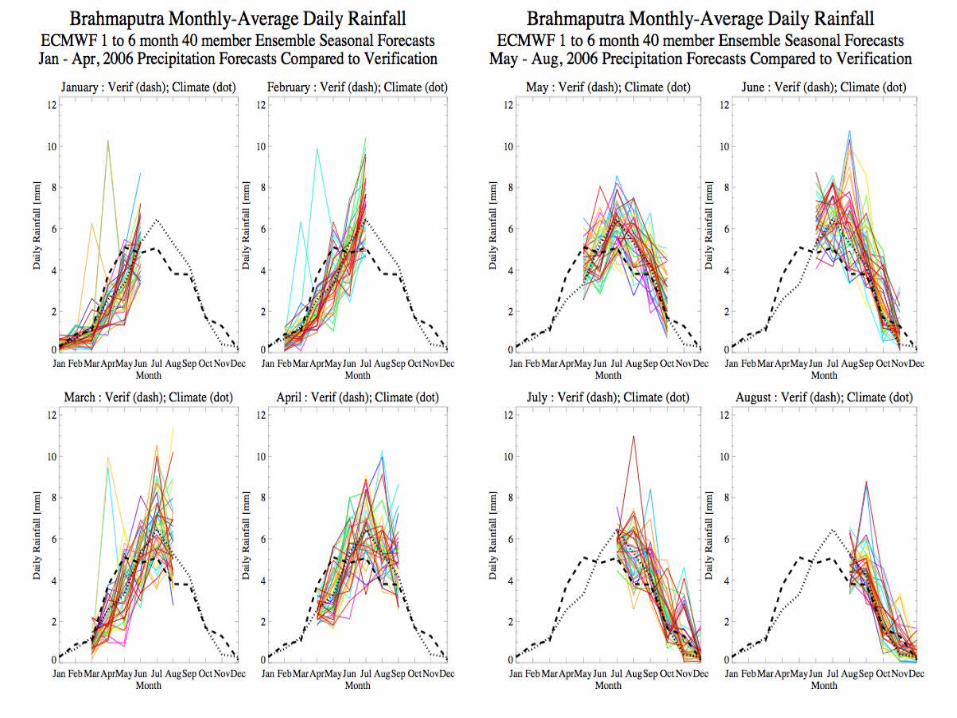
SEASONAL OUTLOOK: “Broad brush” probabilistic forecast of rainfall and river discharge. Updated each month. Produced out to 6 months based on ECMWF’s seasonal 40 member ensemble forecasts. Currently most useful skill out 3 months. Information for strategic planning for agriculture and allied sectors and also for disaster preparedness.
20-25 DAY FORECAST: Forecast of average 5-day rainfall and river discharge 3-4 weeks in advance. Updated every 5 days. Strategic and tactical decisions in the agricultural, water resources and disaster management sectors, particularly for the management of floods and drought.
1-10 DAY FORECAST: Forecast of rainfall and precipitation in probabilistic form updated every day. Based on ECMWF’s 51 member ensemble weather forecasts. Skillful out 7-10 days. Provide probability of flood level exceedance at the entry point of the Ganges & Brahmaputra. Useful for emergency planning, and selective planting or harvesting to reduce potential crop losses
at the beginning or end of the cropping cycle.


Forecast Trigger: ECMWF forecast files
Updated TRMM-CMORPH-CPC precipitation estimates
Updated distributed model parameters
Updated outlet discharge estimates
Above-critical-level forecast probabilities transferred to Bangladesh
Lumped Model Hindcast/Forecast Discharge Generation
Distributed Model Hindcast/Forecast Discharge Generation
Multi-Model Hindcast/Forecast Discharge Generation
Discharge Forecast PDF Generation
Calibrate model
Statistically correct downscaled forecasts
Generate forecasts Generate hindcasts Generate forecasts Generate hindcasts
Update soil moisture states and in-stream flows
Generate hindcasts
Calibrate AR error model
Calibrate multi-model
Generate forecasts Generate hindcasts
Generate model error PDF
Convolute multi-model forecast PDF with model error PDF
E O
F
M
Q P
D
F
C
Generate forecasts
Daily Operational Flood Forecasting Sequence

•Hydrology model initial conditions driven by near-real-time GPCP / CMORPH / Raingage precipitation• Ideally, observations would be statistically “just another ensemble member”•Approach: calculate historical NWP-climatology PDF and observation-climatology PDF for each grid using a “kernel” method•For each forecast ensemble, determine its quantile in model-space and extract equivalent quantile in observation-space
ECMWF Ensemble Precipitation Forecast Adjustments -- mapping forecasts from “model-” to “observational-”spaceBrahmaputra Catchment-avg Forecasts

Pmax
25th 50th 75th 100th
Pfcst
Pre
cipi
tatio
n
Quantile
Pmax
25th 50th 75th 100th
Padj
Quantile
Quantile to Quantile Mapping
Model Climatology “Observed” Climatology

ECMWF Ensemble Precipitation Forecast Adjustments -- mapping forecasts from “model-” to “observational-”space Brahmaputra Adjusted Forecasts •Benefits:
--Gridded “realistic” forecast values--spatial- and temporal covariances preserved
•Drawbacks:--limited sample set for model-space PDF (2 yrs)--rank histograms show “under-variance”
Mean-Square-Error of the Ensemble-Mean shows skill out to 7-8 days
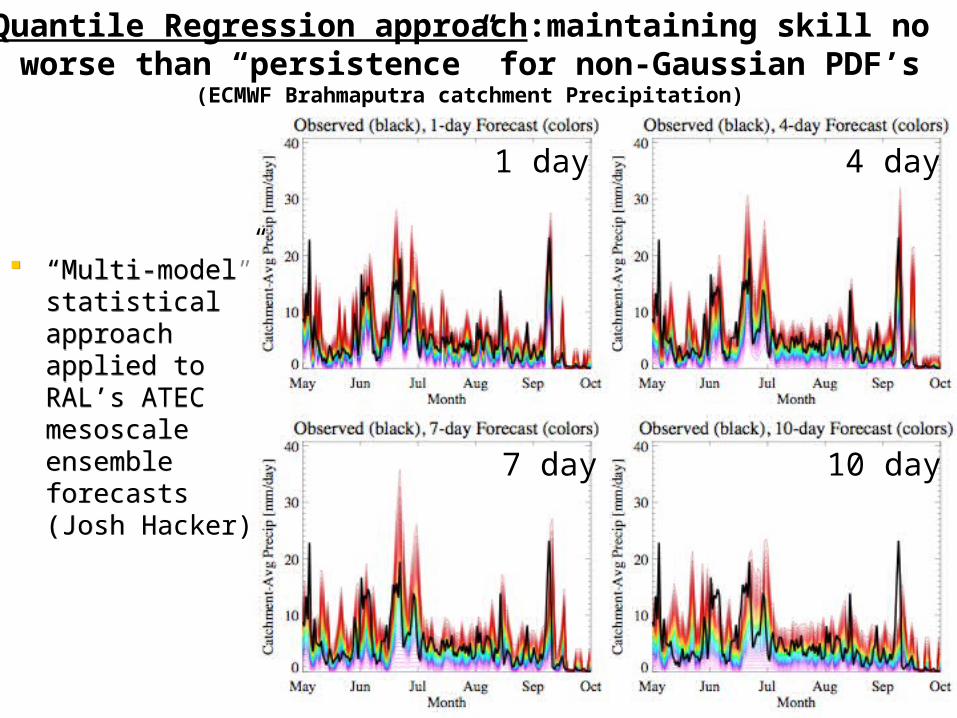
Quantile Regression approach:maintaining skill no worse than “persistence” for non-Gaussian PDF’s
(ECMWF Brahmaputra catchment Precipitation)
1 day 4 day
7 day 10 day
“Multi-model” statistical approach applied to RAL’s ATEC mesoscale ensemble forecasts (Josh Hacker)
“Multi-model” statistical approach applied to RAL’s ATEC mesoscale ensemble forecasts (Josh Hacker)

Precipitation Estimates
1) Rain gauge estimates: NOAA CPC and WMO GTS0.5 X 0.5 spatial resolution; 24h temporal resolutionapproximately 100 gauges reporting over combined catchment24hr reporting delay
2) Satellite-derived estimates: Global Precipitation Climatology Project (GPCP)0.25X0.25 spatial resolution; 3hr temporal resolution6hr reporting delaygeostationary infrared “cold cloud top” estimates calibrated from SSM/I and TMI microwave instruments
3) Satellite-derived estimates: NOAA CPC “CMORPH”0.25X0.25 spatial resolution; 3hr temporal resolution18hr reporting delay precipitation rain rates derived from microwave instruments (SSM/I, TMI, AMSU-B), but “cloud tracking” done using infrared satellites
=> New Project (Dave Gochis, Gyuwon Lee):a) optimally blend products together along with uncertainty estimatesb) Incorporate under a now-casting framework

Brahmaputra Discharge Ensembles
3 day 4 day
5 day
2 day
3 day 4 day
5 day
Confidence Intervals
2004 Discharge Forecast Results
Observed Q black dotEnsemble Members in color
7 day 8 day
9 day 10 day
7 day 8 day
9 day 10 day
50% 95%Critical Q black dash

2004 Danger Level Probabilities
Brahmaputra 7-10 day ForecastsGanges 7-10 day Forecasts
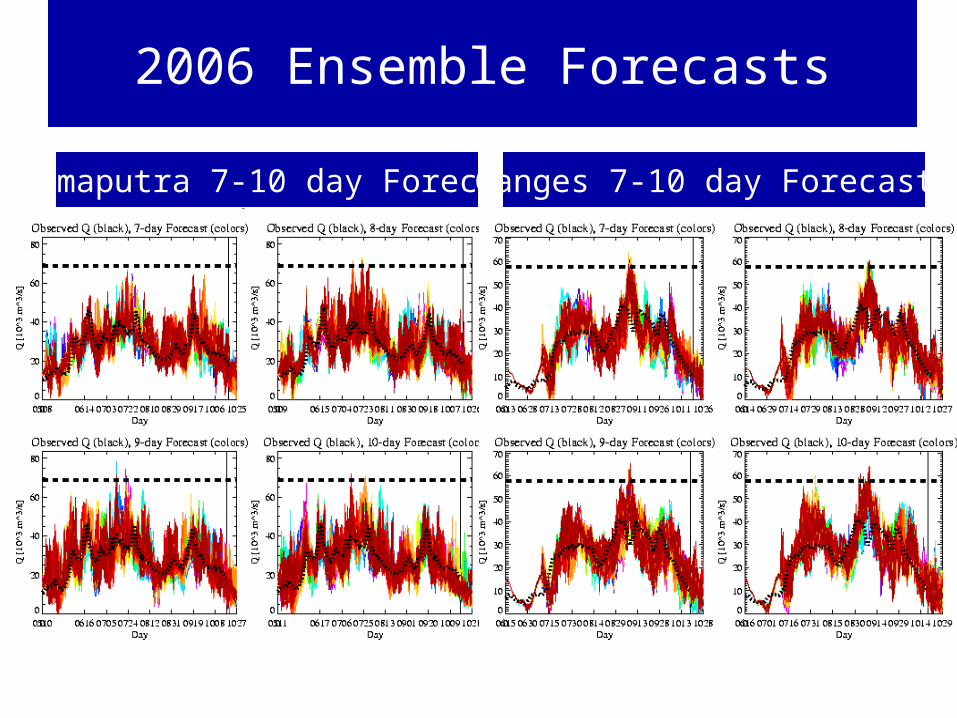
2006 Ensemble Forecasts
Brahmaputra 7-10 day ForecastsGanges 7-10 day Forecasts

2006 Danger Level Probabilities
Brahmaputra 7-10 day ForecastsGanges 7-10 day Forecasts


Forecasts ImprovementsForecasts Improvements
1) Quantile regression approach to improve hydrologic multi-model and final error correction algorithm
2) Automated “seamless” daily to seasonal discharge forecasts merging ECMWF weather and seasonal forecasts, updated daily
1) Quantile regression approach to improve hydrologic multi-model and final error correction algorithm
2) Automated “seamless” daily to seasonal discharge forecasts merging ECMWF weather and seasonal forecasts, updated daily

Five Pilot Sites chosen in 2006 consultation workshops based on biophysical, social criteria:
Rajpur Union -- 16 sq km-- 16,000 pop.
Uria Union-- 23 sq km-- 14,000 pop.
Kaijuri Union-- 45 sq km-- 53,000 pop.
Gazirtek Union-- 32 sq km-- 23,000 pop.
Bhekra Union-- 11 sq km-- 9,000 pop.
A v e r a g e D a m a g e ( T k . ) p e r H o u s e h o l d i n P i l o t U n i o n
7 , 2 5 5
2 8 , 7 4 5
6 0 , 9 9 3
6 4 , 0 0 0
4 0 5 8
0
1 0 , 0 0 0
2 0 , 0 0 0
3 0 , 0 0 0
4 0 , 0 0 0
5 0 , 0 0 0
6 0 , 0 0 0
7 0 , 0 0 0
U r i a G a z i r t e k K a i j u r i R a j p u r B e k r a
U n i o n
Average Damage (Tk) per
Household
(annual income: 30,000 Tk; US$400)
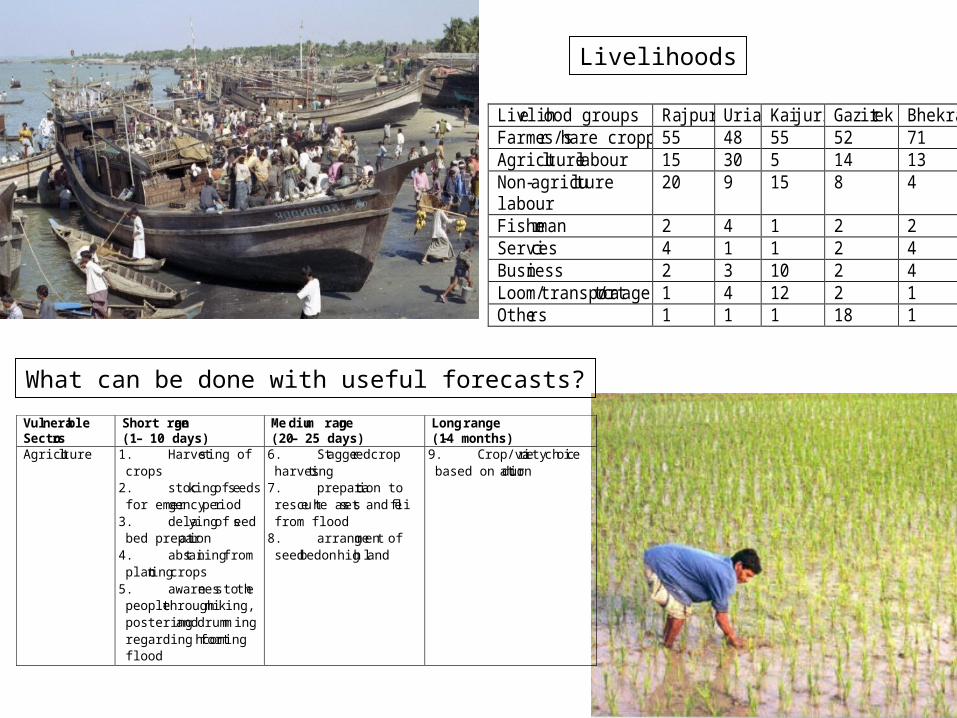
Livelihood groups Rajpur Uria Kaijuri Gazirtek Bhekra Farmers/share cropper 55 48 55 52 71 Agriculture labour 15 30 5 14 13 Non-agriculture labour
20 9 15 8 4
Fisherman 2 4 1 2 2 Services 4 1 1 2 4 Business 2 3 10 2 4 Loom/transport/catage 1 4 12 2 1 Others 1 1 1 18 1
Vulnerable Sectors
Short range (1 – 10 days)
Medium range (20 – 25 days)
Long range (1-4 months)
Agriculture 1. Harvesting of crops
2. stocking of seeds for emergency period
3. delaying of seed bed preparation
4. abstaining from planting crops
5. awareness to the people through miking, postering and drumming regarding forthcoming flood
6. Staggered crop harvesting
7. preparation to rescue the assets and life from flood
8. arrangement of seed bed on high land
9. Crop/variety choice based on duration
Livelihoods
What can be done with useful forecasts?

ConclusionsConclusions
2003: Daily operational probabilistic discharge forecasts “experimentally” disseminated
2004: -- Multi-model approach operational -- Forecasts fully-automated
-- CFAB became an institutionalized entity of the Bangladesh federal government
2006: -- USAID-OFDA/CARE 4-year funding commitment-- Forecasts incorporated into Bangladesh flood warning program
2007: 5 pilot studies implemented for 1-10day forecasts along the Brahmaputra

Overview:
I. Bangladesh Flood Forecasting Project1. Background of project2. Precipitation inputs: ECMWF ensemble forecasts and satellite rainfall corrections3. Seasonal Forecasts4. Brahmaputra Pilot programs
II. Verifying the Relationship between Ensemble Forecast Spread and Skill

1) Greater accuracy of ensemble mean forecast (half the error variance of single forecast)
2) Likelihood of extremes
3) Non-Gaussian forecast PDF’s
1) Greater accuracy of ensemble mean forecast (half the error variance of single forecast)
2) Likelihood of extremes
3) Non-Gaussian forecast PDF’s
Motivation for generating ensemble forecasts:Motivation for generating ensemble forecasts:
4) Ensemble spread as a representation of forecast uncertainty
4) Ensemble spread as a representation of forecast uncertainty
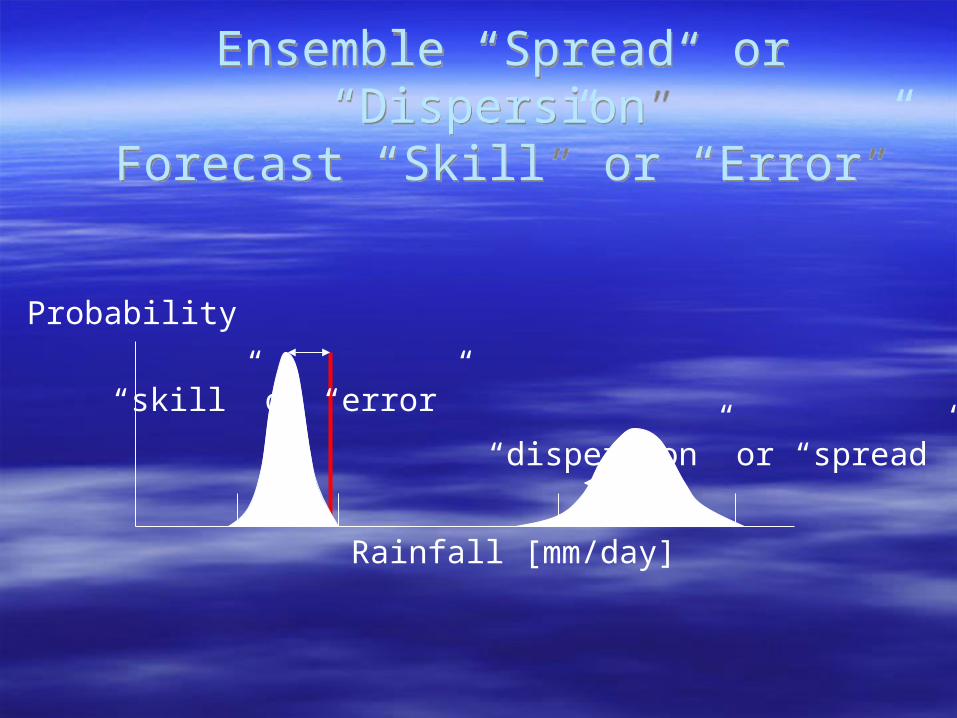
Ensemble “Spread” or “Dispersion”Forecast “Skill” or “Error”
Ensemble “Spread” or “Dispersion”Forecast “Skill” or “Error”
Probability
“dispersion” or “spread”
Rainfall [mm/day]
“skill” or “error”

ECMWF Brahmaputra catchment Precipitation Forecastsvs TRMM/CMORPH/CDC-GTS Rain gauge Estimates
1 day
7 day
4 day
10 day
Points:-- ensemble dispersionincreases with forecastlead-time-- dispersion variabilitywithin each lead-time-- Provide informationabout forecast certainty?
How to Verify?-- rank histogram?No. (Hamill, 2001)
-- ensemble spread-forecast errorcorrelation?

Overview -- Useful Ways to Measure Ensemble Forecast System’s Spread-Skill Relationship:
Overview -- Useful Ways to Measure Ensemble Forecast System’s Spread-Skill Relationship:
Spread-Skill Correlation misleading (Houtekamer, 1993; Whitaker and Loughe, 1998)
Propose 3 alternative scores1) “normalized” spread-skill correlation2) “binned” spread-skill correlation3) “binned” rank histogram
Considerations:-- sufficient variance of the forecast spread? (outperforms ensemble mean forecast dressed with error climatology?)
-- outperform heteroscedastic error model?-- account for observation uncertainty and under-sampling

Naturally Paired Spread-skill measures:Naturally Paired Spread-skill measures:
Set I (L1 measures):– Error measures:
absolute error of the ensemble mean forecast absolute error of a single ensemble member
– Spread measures: ensemble standard deviation mean absolute difference of the ensembles about the ensemble mean
Set II (squared moments; L2 measures):– Error measures:
square error of the ensemble mean forecast square error of a single ensemble member
– Spread measures: ensemble variance

Spread-Skill Correlation …Spread-Skill Correlation …
ECMWF spread-skill (black) correlation << 1
Even “perfect model” (blue) correlation << 1 and varies with forecast lead-time
ECMWF spread-skill (black) correlation << 1
Even “perfect model” (blue) correlation << 1 and varies with forecast lead-time
ECMWFr = 0.33“Perfect”r = 0.68
ECMWFr = 0.41“Perfect”r = 0.56
ECMWFr = 0.39“Perfect”r = 0.53
ECMWFr = 0.36“Perfect”r = 0.49
1 day
7 day
4 day
10 day
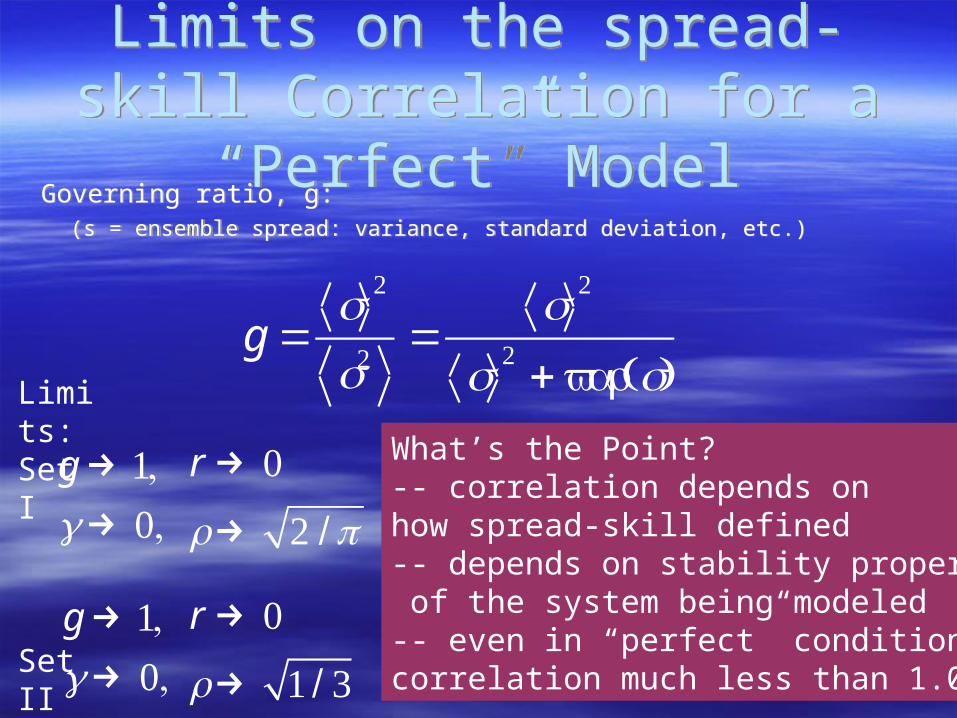
Limits on the spread-skill Correlation for a “Perfect” Model
Limits on the spread-skill Correlation for a “Perfect” Model
Governing ratio, g:(s = ensemble spread: variance, standard deviation, etc.)
Governing ratio, g:(s = ensemble spread: variance, standard deviation, etc.)
g =s 2
s2=
s 2
s 2 + var(s)Limits:Set I
Set IIg→ 1,g→ 0,
What’s the Point?-- correlation depends onhow spread-skill defined-- depends on stability properties of the system being modeled-- even in “perfect” conditions,correlation much less than 1.0
g→ 1,g→ 0,
r→ 0
r→ 2 / π
r→ 0
r→ 1 / 3

One option …One option …
Assign dispersion bins, then:
2) Average the error values in each bin, then correlate
3) Calculate individual rank histograms for each bin, convert to a scalar measure
Assign dispersion bins, then:
2) Average the error values in each bin, then correlate
3) Calculate individual rank histograms for each bin, convert to a scalar measure
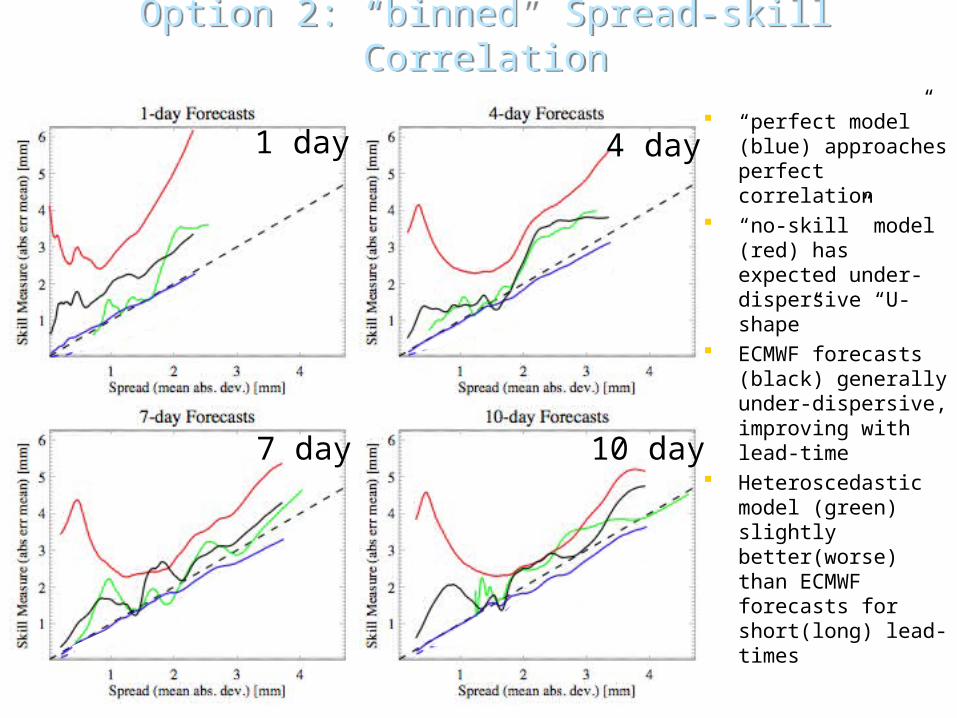
Option 2: “binned” Spread-skill CorrelationOption 2: “binned” Spread-skill Correlation
1 day 4 day
7 day 10 day
“perfect model” (blue) approaches perfect correlation
“no-skill” model (red) has expected under-dispersive “U-shape”
ECMWF forecasts (black) generally under-dispersive, improving with lead-time
Heteroscedastic model (green) slightly better(worse) than ECMWF forecasts for short(long) lead-times
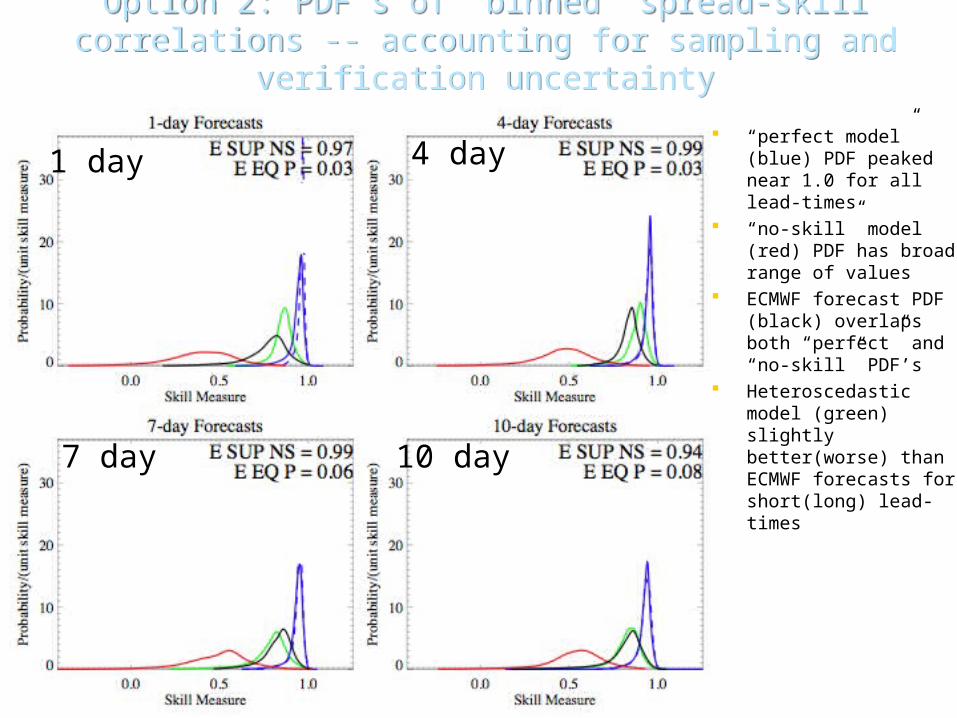
Option 2: PDF’s of “binned” spread-skill correlations -- accounting for sampling and verification uncertainty
Option 2: PDF’s of “binned” spread-skill correlations -- accounting for sampling and verification uncertainty
1 day 4 day
7 day 10 day
“perfect model” (blue) PDF peaked near 1.0 for all lead-times
“no-skill” model (red) PDF has broad range of values
ECMWF forecast PDF (black) overlaps both “perfect” and “no-skill” PDF’s
Heteroscedastic model (green) slightly better(worse) than ECMWF forecasts for short(long) lead-times

ConclusionsConclusions Spread-skill correlation can be misleading measure of utility of ensemble dispersion
– Dependent on “stability” properties of environmental system 3 alternatives:
1) “normalized” (skill-score) spread-skill correlation2) “binned” spread-skill correlation3) “binned” rank histogram
ratio of moments of “spread” distribution also indicates utility-- if ratio --> 1.0, fixed “climatological” error distribution may provide a far cheaper estimate of forecast error
Truer test of utility of forecast dispersion is a comparison with a heteroscedastic error model => a statistical error model may be superior (and cheaper) Important to account for observation and sampling uncertainties when doing a verification
Spread-skill correlation can be misleading measure of utility of ensemble dispersion– Dependent on “stability” properties of environmental system
3 alternatives:1) “normalized” (skill-score) spread-skill correlation2) “binned” spread-skill correlation3) “binned” rank histogram
ratio of moments of “spread” distribution also indicates utility-- if ratio --> 1.0, fixed “climatological” error distribution may provide a far cheaper estimate of forecast error
Truer test of utility of forecast dispersion is a comparison with a heteroscedastic error model => a statistical error model may be superior (and cheaper) Important to account for observation and sampling uncertainties when doing a verification
Thank You!


