
Adventures in Transit PathFinding
Jim LamJian ZhangHoward SlavinSrini SundaramAndres RabinowiczCaliper CorporationGIS in Public Transportation
September, 2011

Motivation
• Achieve Reliable Transit Assignments
• Behavioral Issues Path Choice
• Modeling Issues

Background Work in New York City• Method developed and used
since 1989
• Subjective Calibration
• Computationally intensive (MSA)

Static Methods Still Relevant
• Schedule based assignment not helpful for long range planning
• Computational issues for large scale schedule based simulation
• Static methods must be shown to be reliable and not distort future plans

Congestion in Transit Systems

New NYMTC Model Updates
• Model was very slow• Inadequate equilibration logic• Insufficient calibration,
validation• Frequency based assignment
favors frequent over fast services
• New data sources available
Using AFC Data to Improve Transit Assignments
• Vastly more accurate O-D tables
• Sub-modal and route boarding data for calibration and validation
• Comparison of alternative methods
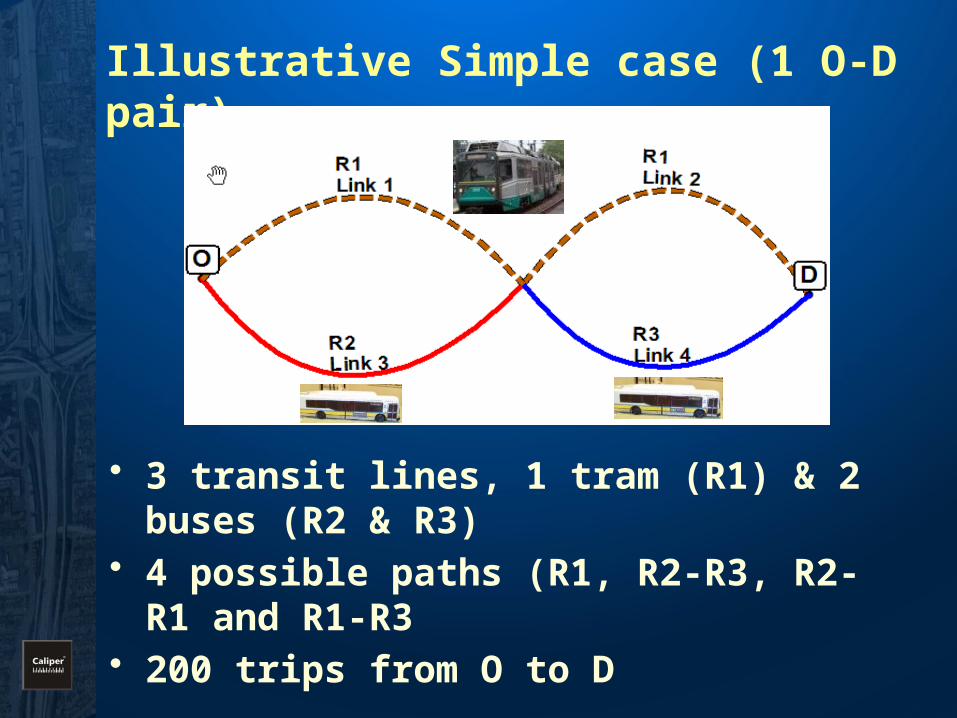
Illustrative Simple case (1 O-D pair)
• 3 transit lines, 1 tram (R1) & 2 buses (R2 & R3)
• 4 possible paths (R1, R2-R3, R2-R1 and R1-R3
• 200 trips from O to D

Case 1: Without Route Congestion Effects
Route Freq Fare Cap
R1 20 $3 120
R2 10 $1 50
R3 10 $1 50
Path SP Tranplan Tpplus OS Pathfinder
R1 200 22 - 66 66
R2, R3 - 90 134 90 134
R2, R1 - 44 - 44 -
R1, R3 - 44 66 - -

Pathfinder Improvements• Use criteria other than
frequency to split flows among hyper-paths – Simple Logit
• Sample Equation: -(0.1 * Transit Time + 0.3*Walk Time + 0.1*Walk Distance + 0.3*Wait Times + 0.1*#Boardings)Path Pathfinder Pathfinder
(with logit)
R1 66
R2, R3
134
R2, R1
-
R1, R3
-
Path Pathfinder Pathfinder (with logit)
R1 66 134
R2, R3
134 66
R2, R1
- -
R1, R3
- -

Case 2: With Route Congestion Effects
Route Freq Fare Cap
R1 20 $3 120
R2 10 $1 50
R3 10 $1 50
Path SUE Pathfinder UE Pathfinder UE with logit
R1 152 142 162
R2, R3 48 43 38
R2, R1 - 16 -
R1, R3 - - -

Transit Assignment Comparison• Transit OD Matrix – Best Estimate
from BPM Model; 2.6 million Transit Trips, 4 hr AM period
• Improved SUE and Enhanced Equilibrium Pathfinder Methods
• Initial Calibration to match overall boardings by region and mode
• Save Assignment Paths for selected OD pairs for each method
• Compare with patterns illustrated by the Farecard AFC Data

Sample OD Pair: Upper East Side to Midtown Manhattan
Feasible Route Alternatives
• Walk and SubwayNYC Bus and NYC Subway
• Multiple NYC Buses
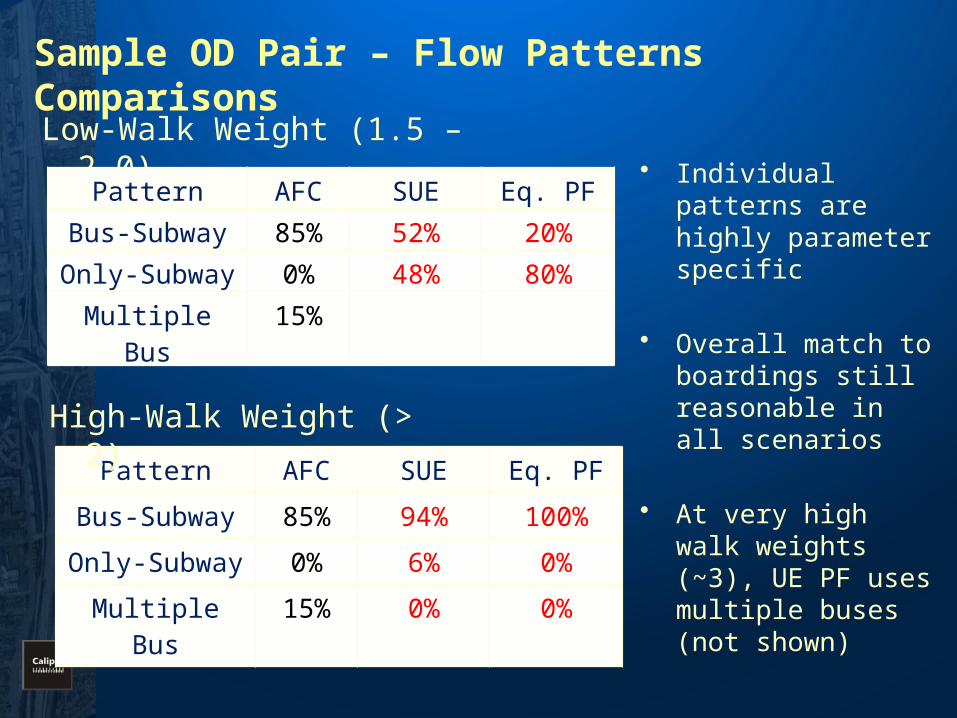
Sample OD Pair – Flow Patterns Comparisons
Pattern AFC SUE Eq. PF
Bus-Subway 85% 94% 100%
Only-Subway 0% 6% 0%
Multiple Bus 15% 0% 0%
Low-Walk Weight (1.5 – 2.0)
High-Walk Weight (> 2)
Pattern AFC SUE Eq. PF
Bus-Subway 85% 52% 20%
Only-Subway 0% 48% 80%
Multiple Bus 15%
• Individual patterns are highly parameter specific
• Overall match to boardings still reasonable in all scenarios
• At very high walk weights (~3), UE PF uses multiple buses (not shown)

Conclusions
• Capacity constrains are essential• Results highly dependent upon
calibration parameters (especially at the route level)
• Both SUE and PF-Equilibrium methods can be calibrated and be used for highly congested and large systems


