

Advertising in Family FirmsIntensity and Performance Influence
Peter KlopStudent Number 311815
Supervisor: J.H. Block
Master Thesis Erasmus University Rotterdam, 2010
Economics and BusinessEntrepreneurship, Strategy and Organisation Economics
Master Thesis - FEM11072-09August 11th 2010
© Peter Klop, 2010
Preface
This master thesis was made to conclude the master study Entrepreneurship, Strategy and
Organisation Economics. Over the past months I have worked with great interest on this thesis
and I would like to thank the people who made this thesis possible. First of all my supervisor dilp.-
kfm J.H. Block. His comments and insights were vital during the process of research and writing. I
also would like to thank my family and girlfriend for their comments, patience and contributions.
The copyrights of this thesis are reserved to the writer. This thesis was made with the greatest
care and before finishing it was read, reviewed and commented by several people. The writer is
responsible for the content of this thesis and any mistake that might have been made.
Peter Klop, August 2010
Copyright © 2010
Abstract
Depending on the used definition well over half of the firms in western economies can be
classified as family firms. Although the role and impact of advertising on (the performance of)
firms is studied intensively little research has been done on advertising in family firms. To extent
literature on the subject this thesis investigates the relationship between advertising and (the
performance of) family firms. Data on the S&P500 was used to research two subjects: first of all
the difference in levels of advertising between family and non-family firms. For a number of
definitions and characteristics of the family firm the advertising intensity is analysed. T-tests show
a significant higher advertising intensity for family firms. Clustered OLS regressions including
variables indicating ownership and managerial characteristics of the family firm show that
businesses owned by lone founders (first generation family firms) and family owned businesses
tend to have higher advertising intensity then other businesses. However only the results on the
lone founders are significant.
Secondly the influence of advertising intensity on the (financial) performance of the family
firms was investigated. In general this research finds that a higher advertising intensity has a
positive influence on the market-to-book ratio of firms. The analysis on the interaction of family
ownership and advertising intensity in relation to the market-to-book ratio gives mixed results.
The data shows that, depending on the percentage of shares owned by the family or lone
founder, advertising intensity influences the market-to ratio negatively. However only a few
interactions were significant in the models.
Copyright © 2010
Executive SummaryThe past two decades the family firm and its characteristics have been a source for academic
research. Depending on the used definition family firms represent up to two-thirds of the firms in
today's economies. In general family firm definitions incorporate the involvement of a family in a
business on a managerial and/or an ownership level. Earlier research has shown that the family
firm behaves and performs differently compared to non-family firms on a variety of subjects.
Academic studies on the subject of advertising are wide ranging and date to the beginning of the
twentieth century. However little research has been done on advertising in family firms. This
thesis aims to extent literature on the subject of advertising in family firms and the effect of
advertising on the performance of the family firm.
The two research questions in this thesis are: (1) “To what degree do family firms have
different levels of advertising spending than non-family firms?” and (2) “Does the effect of
advertising on the firm performance differ between family and non-family firms?” The advertising
intensity is used as a measure for the level of advertising. The hypotheses state that family firms
have different advertising intensities than other firms. Similar hypotheses were formulated for the
individual managerial and ownership characteristics that are incorporated in the family firm
definitions. With respect to the second research question the hypotheses state that the
advertising intensity of family firms has a positive influence on the market-to-book ratio of the
firm.
From the empirical results the t-tests indicate that family firms in both broad as well as narrow
definitions have significantly higher advertising intensities than other firms. The same results were
found on a managerial and ownership level. Interesting finding is that differences in advertising
intensity were found for low and high levels of lone founder ownership (first generations family
firms) and family ownership. Secondly clustered OLS was used to analyse the influence of family
ownership and/or family management on the level of advertising intensity while controlling for
other firm characteristics. A positive influence was found but only lone founder ownership was
repeatedly found significant in the regressions. The regressions researching the effect of
advertising on the firm performance show that advertising intensity negatively influences the
market-to-book ratio of family firms.
To test the robustness of the findings the propensity score of the observations was calculated
on the basis of firm characteristics using lone founder ownership as the treatment. Based on the
calculated propensity scores samples of equal size were extracted from the original dataset.
These samples were used to perform Wilcoxon rank-sum tests and the outcomes were compared
with the earlier results. The findings on lone founder ownership were confirmed by the results of
the robustness tests.
Copyright © 2010

This thesis found that family firms within the S&P500 have a significant higher advertising
intensity then non-family firms. Specially lone founder ownership seems to have positive impact
on advertising intensity. Although these lone founder businesses can be seen as first generation
family firms market entry and the need for brand building could explain the higher levels of
advertising intensity for lone founders. The effect of family firm advertising on the business
performance leaves us mixed results. Initial results suggest that in general advertising intensity
positively influences the market-to-book ratio of firms. However the interaction of family and/or
lone founder ownership with advertising intensity seems to have a negative impact on the market-
to-book ratio.
This thesis provides a starting point on the subject of family firm (performance) and
advertising. Further research is recommended as this thesis just scratched the surface of the
subject. The used dataset presents some limitations to this research as only large multinationals
from the United States were included. The findings of this thesis could be tested on family firms of
different sizes and geographical origins. Secondly the use of advertising intensity as a measure of
advertisement has limitations as it gives little or no answer on the effectiveness of advertising.
The empirical results indicate that family management negatively influences the advertising
intensity. On theoretical grounds this could be explained by family specific motivations and
strategies. However another explanation is the (possible) use of other, less costly, types of
advertising by family managed firms. It is suggested to expend future datasets with information
on the types of advertisement used by the family firms and their competitors.
Copyright © 2010
Content
Abstract
Executive summary
1. Introduction...............................................................................................................8
2. Theoretical Framework.............................................................................................10
2.1 The Family Firm...................................................................................................10
2.1.1 Family and Lone Founder Ownership.......................................................10
2.1.2 Family and Lone Founder Management .................................................11
2.1.3 Definitions of the Family Firm...................................................................12
2.2 Advertising............................................................................................................14
2.2.1. Definitions and Measures of Advertising...................................................14
2.2.2. Advertisement and Business Performance..............................................14
2.3 Family firms and Advertising................................................................................15
3. Data and Methodology..............................................................................................17
3.1 Data and Sample Construction............................................................................17
3.2 Variables ..............................................................................................................17
3.2.1 Dependent Variables.................................................................................17
3.2.2 Independent Variables..............................................................................18
3.3 Methods................................................................................................................21
3.3.1 T-tests and Wilcoxon Rank-sum Test........................................................21
3.3.2 Clustered OLS Regressions......................................................................21
3.3.3 Propensity Score Matching.......................................................................22
4. Empirical results.......................................................................................................23
4.1 T-tests...................................................................................................................23
4.2 Clustered OLS regressions..................................................................................24
4.2.1. Correlations and VIF-values......................................................................24
4.2.2 Advertising Intensity and Family Firms......................................................25
4.2.3 Family advertising and Firm Performance.................................................28
4.3 Robustness...........................................................................................................31
Copyright © 2010
5. Discussion.................................................................................................................33
5.1 Advertising Intensity and Family Firms................................................................33
5.2 Advertising Intensity and Family Firm Performance............................................34
6. Conclusion.................................................................................................................35
6.1 Conclusions..........................................................................................................35
6.2 Limitations and Further Research........................................................................36
References......................................................................................................................37
Appendix.........................................................................................................................39
Copyright © 2010
1. IntroductionThe past two decades increasing academic interest has been going to the family firm and the
role it fulfils in today's economy. Bird et al. (2002) find “that family business research has become
increasingly empirical and more rigorous in recent years”. They detect an increase in the use of
large samples, more (in)dependent variables and multivariate statistical tools in family firm
research. Key point of interest are the characteristics of the family firm and how they influence the
structure and performance of the family firm compared to non-family firms. Examples of
researched aspects are the growth of family firms (Ward, 1997), employment and layoffs in family
firms (Block, 2008), the long-term orientation of family firms (James, 1999) and the impact of
family ownership on firm performance (Anderson and Reeb, 2003). This thesis aims to extent
literature of the family firm and will focus on the relatively unexplored subject of advertisement.
A question that raises when one starts research on the family firm is why one should
investigate the family firm. Zahra et al. (2004) state that family firms are an important source of
economic development and growth. Furthermore Ward & Aronoff (1995) present several
arguments on why the family firm is interesting for academic study: First of all the majority of
independent firms are owned by families. Depending on the used definition family firms make up
two-thirds of all the firms (Kirchhoff & Kirchhoff, 1987). Secondly the prioritizing of objectives by
family business owners is likely to differ from that of the owners of non-family business. Family
firms are also likely to be managed differently from non-family firms. And finally owners of family
businesses are more likely to be concerned with transferring the business to the next generation
of the family. Academic research has shown that firms that are owned and/or managed by a
family tend to differ from non-family firms in structure, performance and strategy. Further research
on the subject will give more insight on the extent of the differences between family and non-
family firms.
In contrast to the family firm the subject of advertising has a long, rich history in academic
research and ranks high on the list of controversial economic topics (Telser, 1968). Both the
functions and effectiveness of advertising has been investigated intensively. Politz (1975) found
two goals of advertisements which he called the 'familiarity principle' and the 'persuasive
principle'. The familiarity principle points to the fact that advertising provides knowledge on
products and/or services to the consumer. The persuasive principle states that advertising tries to
convince the consumer to buy a certain product or service.
From a firms perspective advertising is used to inform people about their products, improve
brand familiarity and stimulate sales. There is however no consensus on the effect of advertising
on the performance of the firm. Academic research has shown that advertising can have a
positive effect on the return of investment (Telser, 1968) and can limit competition by creating
Copyright © 2010 8
entry barriers (Comanor and Wilson, 1979). On the other hand advertising can also stimulate
competition by informing consumers about the various products available which in turn can lead
to increased (price) competition and a hold on the sales growth of a firm (Comanor and Wilson,
1979). These studies show that the effect of advertising on the performance of firms is still an
interesting subject of research.
Academic research has studied the impact of advertising on the financial performance of firms
in general, but little research has been done on the specifics of advertising in family firms. In this
thesis the relationship between advertising and (the performance of) the family firm is
investigated. The first research question investigates whether family firms are different in
spendings on advertising and is formulated as followed: 1. To what degree do family firms have
different levels of advertising spending than non-family firms? The second research question
focuses on the effect of advertising spendings and the possible differences between (non-)family
firms. The question is formulated as followed: 2. Does the effect of advertising on the financial
performance differ between family and non-family firms? By answering these research questions
insight is gained on the differences and commonalities between (non-)family firms on the subject
of advertising.
This thesis is divided into six chapters. In chapter two existing literature on the subjects of the
family firm and advertising are reviewed. Also definitions on both the family firm and advertising
are formulated. Based on the literature hypotheses are constructed which are used to answer the
two research questions of this thesis. Chapter three describes the construction of the sample.
The statistical methods and the (in)dependent variables are also discussed in this chapter. In
chapter four the empirical results from the analysis are presented. Chapter five discusses the
empirical results and links them to the hypotheses. Finally chapter six presents the conclusions of
the thesis. Furthermore the limitations of this research and suggestions for future research are
given.
Copyright © 2010 9
2. Theoretical FrameworkIn this chapter literature and theories on both the family firm and advertising are reviewed.
Paragraph 2.1 focuses on the definition and the characteristics of the family firm. In paragraph
2.2 literature on advertising is reviewed and topics of discussion are definitions of advertising,
measurement of advertising and the impact of advertising on firm performance. Finally the
theoretical interaction between advertising and family firms is discussed in paragraph 2.3.
2.1 The Family Firm From the small supermarket on the corner of the street to large multinationals: the family firm
is present in all shapes and sizes (Pearl and Kristie, 2005). But what characteristic is essential for
a firm to be classified a family firm? Family involvement in a company is possible on many levels:
a family name can be used in the company name, a family can own a certain amount of the
outstanding shares or hold one or more management positions. Literature on the family firm
provides a wide range of definitions in which family involvement is present in certain firm
characteristics. To find a family firm definition for this research two main types of family
involvement are investigated. First the aspects of family ownership are discussed in paragraph
2.1.1. Secondly the role and influence of family management is investigated in paragraph 2.1.2.
Finally in paragraph 2.1.3 these characteristics are combined to construct definitions on the
family firm that will be used in the statistical analyses.
2.1.1 Family and Lone Founder Ownership
Ownership structure varies across businesses as shares can be hold by different parties
(families, financial owners, lone founders, etcetera) in various combinations and numbers of
shares owned. Company ownership gives certain financial rights like rights on generated profits
or dividends and possible managerial rights to the owner(s) in the form of voting stock. The extent
of the managerial rights often depends on the type and percentage of shares owned.
Shareholders with a minimum of 5% of the outstanding shares are called blockholders and have
shown to have an influence on the strategies and performance of a firm (Holderness, 2003;
Edmans, 2009). When talking about family ownership the level of ownership needs to exceed the
blockholder level to be able to influence the business.
Academic research on the family firm has investigated the definition of ownership family. In
many research papers family ownership is considered to be present when “a founding family or
founding individual owns a fraction of the company.” (Miller et al, 2007; Anderson and Reeb,
2003). This definition of family ownership thus incorporates also ownership of lone founders.
Lone founder businesses can be defined as “businesses in which an individual is one of the
company’s founders and is also a manager or a large owner, with no other family members
involved” (Pindado et al, 2008).
Copyright © 2010 10

An argument for the inclusion of lone founder ownership in the family ownership definition is
that lone founder businesses often turn out to be first generation family firms. Many firms are
founded by individuals and as these lone founder firms grow and mature increased family
involvement is seen in a part of the population. However the involvement of a family in early
and/or later stadium of the lone founder firm development is not required and not detected in all
lone founder firms. Literature on the inclusion of lone founder ownership is mixed: Anderson &
Reeb (2003) make no difference between first generation family firms. This in contrast to Miller et
al (2007) which argue that a distinction has to be made between “pure” family ownership and lone
founder ownership.
There are two arguments against the inclusion of lone founder business in the family firm
definition. First of all lone founder firms lack the involvement of family members and therefore it
can be argued that lone founder firms should only be classified as a family business when at
least one family member is working in the firm besides the lone founder(s) as a 'normal'
employee or as member of the company management. The second argument focuses on the
reasoning of the lone founder business being a first generation family firm. A large percentage of
the founded firms are lone founder businesses. As an percentage of these firms will indeed
evolve and grow into family firms a lot of these firms will not. Some lone founder businesses will
stay in the sole possession and control of the founder. In determining a definition of the family
firm one has to account for the role and influence of lone founders.
The effect of family and lone founder ownership on the performance and value of a firm is
studied in several papers. Pindado et al (2008) find that family ownership has a positive impact
on firm value. They point to the long-term horizons and reputation concern of fhe family as
possible explanations. Villalonga & Amit (2006) found that family ownership only creates value
when it is combined with specific forms of family management. And finally Anderson & Reeb
(2003) find robust results disproving the hypothesis that family ownership is inherently less
efficient in U.S. firms.
2.1.2. Family and Lone Founder Management
In the previous paragraph a distinction was made between family ownership and lone founder
ownership on the argument that lone founder businesses are (possible) first generation family
firms. On a management level a similar distinction can be made with family management on the
one hand and lone founder control on the other hand. The distinction between family and lone
founder management has consequences for the formulation of family firm definitions.
Furthermore management strategies and underlying motivations of both types of managers are
likely to be different.
Copyright © 2010 11
Among other things the management of a business is responsible for operational decision
making and the construction of both short term and long strategy. The motivations and required
incentives for people holding management positions in these businesses depend on a wide
variety of factors: education, job requirements and personal preferences are just a few of these
factors. Also principle-agent problems between management and firm owner(s) account for an
important part in this subject (Demsetz, 1983). Academic research has shown that differences in
motivations and required incentives can also be found between lone founder businesses, family
firms and other businesses. Families that are active in a company have motivations to maintain a
long term focus as the firm may end up in the hands of future generations and become an source
of income and security for these generations. (James, 1999). Lone founders frequently have both
sole ownership and control over the firm. As a result some principle-agent problems are tackled
(Demsetz, 1983) but the influence of personal preferences of lone founder is also detected.
When talking about the management of a firm it is essential to incorporate management
positions that have influence on the day-to-day decision making as well as the long term strategy
formulation. A senior assistant manager of a local department store has some, but very limited
influence in the decision making process in the head office. From the management functions the
chief executive officer (CEO) and chairman are considered to be influential on the performance
and strategy of a firm. The tasks and responsibilities of the chairman and the CEO are not
universal determinant and therefore it can be questioned whether there is some overlap or duality
in these two management positions. Findings on the influence of family management on the firm
are mixed. Villalonga & Amit (2006) find that family management adds value to the company
when the founder serves as the CEO or as its chairman with a non-family CEO. However family
management destroys value when descendants of the founder serve as Chairman or CEO.
During recent years the position of the Chief Financial Officer (CFO) has become increasingly
important and as a result more research has been done on the role and influence of the CFO on
the firm performance. Casellia & Di Giulic (2010) investigated the CFO in Italian firms and they
found that family firms with a non-family CFO drive firm performance in a positive direction.
Family firms with a non-family CFO perform better than both family firms with a family CFO and
non-family firms. Although these results are interesting and the CFO may contribute to the
formulation of a familly firm definition little data is available on (the origins of) the CFO. Therefore
the CFO is not specificly included in family management definition of this thesis.
Copyright © 2010 12

2.1.3 Definitions of the Family Firm
In literature many definitions on the family firm can be found and most definitions focus on the
managerial and ownership influence a family can have on a business. A managerial orientated
definition of a family firm is “an organization controlled and usually managed by multiple family
members” (Shanker and Astrachan, 1996; Lansberg, 1999). Julio Pindado et al (2008) state that
family businesses are those that include multiple family members as large shareholders on
management positions. Villalonga and Amit (2006) define a family firm in a broad definition as “a
firm whose founder or a member of the family by either blood or marriage is a director or the
owner of at least 5 % of the firm’s equity, individually or as a group”. Gomez-Mejia et al. (2003)
use a more narrow definition of the family firm in which two conditions are considered to be
essential: two or more directors have a family relationship and family members own at least five
percent of the voting stock”. Finally Miller et al. (2007) define a family firm as a business in which
multiple members of the same family are involved as major owners or managers, either
contemporaneously or over time. This definition allows for variations in ownership levels and
managerial roles fulfilled by family members.
In this thesis multiple definitions of the family firm are investigated as literature on advertising
in family firms is limited and the influence of the used definitions on the outcomes unknown.
Paragraph 3.2.2 discusses and describes the four constructed family firm definitions in detail.
Based on the found literature and theories four elements were selected that are expected to be
essential in this research. Four family firm definitions were constructed from these four elements :
1. The CEO or the chairman is a member of the family;
2. From the outstanding shares five percent or more is family owned;
3. From the outstanding shares five percent or more is owned by a lone founder;
4. Five percent or more of the outstanding shares is owned by either a lone founder or a family.
Copyright © 2010 13

2.2 AdvertisingIn this paragraph literature on advertising is reviewed. Paragraph 2.2.1 starts with definitions
and the measurement of advertising. After this paragraph 2.2.2 discusses the relationship
between advertisement and firm performance.
2.2.1 Definition and Measurement of Advertising
An early definition on advertising was constructed by Daniel Starch (1923): “The simplest
definition of advertising, and one that will probably meet the test of critical examination, is that
advertising is selling in print”. Over the past century ways of communication have evolved and
today advertising on paper is just one in a wide range of options. The introductions and popularity
of the cinema, television, radio and the internet have had a major impact on commercial
advertising and the used definitions. Like the definitions on the family firm there is no universal
definition to describe advertising. Main causes are theoretical disagreement between experts and
the different ways in which advertisement can be used. Richards and Curran (2002) find a wide
variety of definitions in existing literature, but extracted five key elements that are frequently used
in these definitions: (1) Paid, (2) non-personal, (3) identified sponsor, (4) mass media and (5)
persuade or influence. With these elements they captured the essence of most definitions in a
single phrase: “Advertising is a paid non-personal communication from a identified sponsor using
mass media to persuade or influence and audience”. When referring to advertising the definition
of Richard and Curran is used in this thesis.
In empirical research advertising expenditures and the gross rating points (GRP) are the main
used measures of advertising. Gross rating points are a product of the reach of an advertising
medium and the average distribution of exposures it delivers to an audience (Tellis, 1988). Gross
rating points have the advantage of containing a diversity of essential information on advertising,
but a strong disadvantage is the fact that the rating points are hard to determine. Advertising
expenses are a monetary representation of the advertising efforts of a company. In contrast to
gross rating points advertising expenses tell little about the range and effectiveness of the
advertising activities. An advantage of advertising expenses is that information is widely available
as the expenses are reported in the financial reports of companies. Advertising expenses are
mostly translated into a percentage of the sales thereby constructing the variable advertising
intensity.
2.2.2 Advertisement and Business Performance
Lavidge and Steiner (1961) argue that advertising is aimed at creating a situation where an
increase in the level of sales is realized. Chauvin and Hirschey (1993) provide evidence that
advertising has a positive influence on the market value of a firm. Also research has shown that
advertising can have a positive effect on the return of investment (Telser, 1968). There is however
Copyright © 2010 14

no consensus on the influence and long term effect of advertising on the (financial) performance
of businesses. As managers often set the level of advertising to the expected level of sales (Tellis,
1988) a two-way interaction makes analyses on effect of advertising expenses complicated.
Several studies have investigated the effect of advertising on (the performance of) the firm:
Sawyer (1981) finds that the effect of advertising on sales follows a logarithmic curve. The first
advertising dollars have a higher marginal effect on sales than later amounts. Also indications on
an optimal advertising level are found. Advertising can stimulate competition by informing
consumers about the various products available which in turn can lead to increased (price)
competition and can cause a hold on the sales growth of a firm (Comanor and Wilson, 1979). On
the level of competition Gatignon (1984) finds competition to a be a moderator on the effect of
advertising on sales. But on the other hand advertising can limit competition by creating entry
barriers (Comanor and Wilson, 1979). These studies show that further research on the effect of
advertising on the (family) firm performance is necessary.
2.3 Family firms and advertisingIn the two previous paragraphs literature on the family firm and advertising was reviewed. In
this paragraph literature and theories on both subjects are linked and hypotheses are formulated
that will contribute in answering the research questions. Teal, Upton, and Seaman (2003) are one
of the first to investigate the relation between marketing strategies and family firms. In their paper
they tested the hypothesis that there is no difference between family and non-family firms in the
allocation of financial resources for marketing. They found significant differences for mass
advertisement between family and non-family firms. As literature on advertising in family firms is
otherwise limited the hypotheses for this research were constructed to provide answers on some
basic elements. The first hypothesis forms the basis of this thesis and investigates whether or not
family firms have different advertising intensities than other firms. This hypothesis will be tested
for a number of definitions.
Hypothesis 1: Family firms have different advertising intensities than other firms.
Continuing on this path the individual managerial and ownership characteristics of the family
firm are investigated. First in line is family ownership and hypothesis 2 states that family owned
firms will have a higher advertising intensity than other firms. More then in other businesses
family members are often interested in transferring the owned business to the next generation
(Anderson & Reeb, 2003: Miller et al, 2007). As advertising can be considered a long-term
investment in future profits, family firms should invest more in advertising then other firms.
Hypothesis 2: Family owned firms have a higher advertising intensity than other firms.
As discussed in chapter two it is not uncommon to incorporate lone founder ownership into the
family firm definition. In these cases lone founder businesses are seen as first generation family
Copyright © 2010 15

firms. When being a first generation is combined with the need for survival it is expected that lone
founder owners have a higher advertising intensity then other firms. This is translated into
hypothesis 3:
Hypothesis 3: Lone founder owned firms have a higher advertising intensity than other firms.
Besides ownership family management is considered to be influential on the performance of the
firm. Family controlled firms are considered to have more loyal customers, making cost-intensive
advertising unnecessary. Furthermore family firms may rely more on other types of advertisement
which do not directly translate into advertising expenses. An example is word-to-mouth
advertisement. Based on this hypothesis 4a states that family owned firms have a lower
advertising intensity than other firms. On loyalty of customers Shum (2004) finds that advertising
can overcome brand loyalty. Taking this into account one could argue that family firms would have
to spent the same amount on advertising as non-family firms do. This argument leads to
hypothesis 4b.
Hypothesis 4a: Family managed firms have a lower advertising intensity than other firms.
Hypothesis 4b: There is no difference in advertising intensity of family managed firms and other
firms.
Besides the differences in levels of advertising the effect of advertising on the business
performance is also of interest. Miller, Le Breton-Miller, Lester and Cannella (2007) found that
lone founder businesses perform better than other U.S. Public corporations, while family
businesses do not show superior market valuations. Based on this research hypothesis 5 is
constructed which states that advertising by lone founder firms results in a better market
performance compared to other firms.
Hypothesis 5: Advertising results in better market performance for lone founder firms than for
other firms.
Copyright © 2010 16
3. Data and MethodologyThis chapter describes the data, sample construction and methodology used in this research.
Paragraph 3.1 handles the data and the construction of the sample. Paragraph 3.2 describes the
(in)dependent variables of the models. Finally in paragraph 3.3 the statistical methods are
discussed.
3.1 Data and Sample ConstructionThe sample used in this research was created from a dataset made available by the Erasmus
University Rotterdam. The dataset contains Compustat data on the 500 firms from the Standard &
Poor's 500 (S&P 500). The shares of these firms are traded on the NYSE Euronext and the
Nasdaq OMX which are the two largest American stock markets: The firms represents
approximately 70% of the U.S. publicly traded companies. The data was collected over twelve
succeeding years (1992 up to 2003). The firms are sorted by industry by the two-digit codes of
the Standard Industrial Classification (SIC). The sample contains data on 499 firms as the Coca-
Cola company appeared two times in the S&P500 and one of these notations was excluded to
prevent double counting. The combination of the firms and years gives a total of 5,988
observations.
3.2 Variables3.2.1. Dependent variables
To analyze the level of advertising the continues variable advertising intensity is used.
Advertising intensity is calculated by taking the advertising expenses and dividing it by the sales
of the firm. Table I shows that in this dataset the variable has a skewness of 3.458 and a relatively
high kurtosis of 16.886. Further transformation of the variable by taking the natural logarithm
would normalize the distribution, however interpretation of the output is more straightforward
without the transformation. The mean advertising intensity is 0.012 with a standard deviation of
0.029. However the ratio has a large range with a minimum of zero up to a maximum of 0.26. For
data on the advertising intensity in the specific SIC-industries see table E on appendix IV.
For the regressions investigating the relationship between advertising and firm performance
the logarithm of the market-to-book ratio is used as dependent variable. To calculate the market-
to-book ratio the stock's book value is divided by its market value. In this calculation the book
value is based on the company's balance sheet and the market value on the stock price. A ratio
above 1 indicates a possible overvaluation of the stock and a ratio below 1 indicates a possible
undervaluation. After some outliers were removed the kurtosis dropped from 297,41 to 82,58.
Correcting for this high kurtosis the logarithm of the market-to-book ratio was taken. This
transformation makes interpretation of the results somewhat challenging. The mean market-to-
book ratio before logging the variable was 4.105 with a standard deviation of 6.159.
Copyright © 2010 17

3.2.2 Independent variables
As discussed in chapter two a variety of definitions can be found for the family firm. In this
thesis six models are used to analyze the effect of being a family firm on the level of advertising
intensity. In two of these models the individual managerial aspects and ownership levels are
investigated. In the remaining four models narrow and broad definitions of the family firm are
incorporated as binary variables.
In the first regression the definition of the family firm is stripped into three individual variables.
First of all the involvement of a family in the firm management is indicated with the binary variable
“Family Management”. Family Management has a positive value when the CEO and/or the
Chairman of the firm a member of the family is. Table II shows that a family CEO was observed
915 times on a total of 4,387 observations and the presence of a family chairman was found
1,120 times on a total of 4,368 observations. Interesting finding is that Family Management is
found in 1,176 of the total 4,399 observations which indicates a high level of duality when the
functions are held by family members. Based on the overlap and the discussed theory in chapter
two it was decided to use the variable Family Management in the first and sixth model.
Besides the managerial characteristic of the family firm the ownership aspect is incorporated
in the continues variables Family Ownership and Lone Founder Ownership. These variables
show the percentage of shares owned by specific parties. Table I shows that when the
observations with zero's are excluded family ownership is observed 365 times and Lone Founder
Ownership has 397 observations. The mean ownership levels are respectively 30.9% and 15.6%.
The standard deviations are 18.3% for family ownership and 13.1% for Lone Founder Ownership.
Copyright © 2010 18
Min Max N
0.012 0.029 3.458 16.886 0.000 0.260 5723 4.105 6.159 2.842 82.579 -99.231 90.604 50841.138 0.732 0.802 4.646 -1.863 5.442 55260.035 0.115 4.067 21.928 0.000 0.983 32540.309 0.183 1.230 4.781 0.044 0.983 3650.019 0.069 5.679 45.216 0.000 0.837 32540.156 0.131 2.420 9.966 0.050 0.837 3970.054 0.129 3.215 15.112 0.000 0.983 32540.229 0.176 1.543 5.632 0.044 0.983 762
22,288.830 65,648.610 7.547 78.683 0.308 1,097,190.000 52288.617 1.656 -0.103 3.903 -1.178 13.908 52280.259 0.200 2.968 52.653 0.000 4.766 52283.932 0.984 -1.072 3.922 0.000 5.403 5894
Table I – Descriptive Statistics
Variable Mean St. deviation Skewness Kurtosis
Advertising IntensityMarket to Book L
Log Market to BookFamily Ownership L
Family Ownership (excl zero) L
Lone Founder Ownership L
Lone Founder Own. (excl zero) L
Ownership Combined L
Ownership Combined (excl zero) L
Assets L
Log Assets L
Debt / Assets L
Log Firmage1. L = Lagged variab le is used (one year lag)

In models 2, 3, 4 and 5 the four definitions of the family firm are analysed. First of all model 2
analyses a narrow definition of the family firm. To be classified a family firm two conditions have
to be met: First of all the family has to hold a management position as CEO or chairman.
Secondly the family has to own at least 5% of the outstanding shares. The broad family firm
definition in model 4 is less strict and states that not both the managerial and the ownership
conditions have to be met but at least one of them. The narrow and broad definitions of the family
firm in models 3 and 5 have one important difference compared to the previous definitions. These
definitions use the combined ownership level of both families and lone founders to test the
ownership criteria. The criteria is met when a family or a lone founder owns at least 5% of the
outstanding shares.
Copyright © 2010 19
Percentage
A 3,472 79.14 79.10B 915 20.86 100.00A 3,248 74.36 74.36B 1,120 25.64 100.00A 3,223 73.27 73.27B 1,176 26.73 100.00A 3,230 99.26 99.26B 24 0.74 100.00A 3,157 97.02 97.02B 97 2.98 100.00A 3,182 97.79 97.79B 72 2.21 100.00A 3,083 94.74 94.74B 171 5.26 100.00A 3,085 94.81 94.81B 169 5.19 100.00A 3,132 96.25 96.25B 122 3.75 100.00A 3,181 97.76 97.76B 73 2.24 100.00A 3,221 98.99 98.99B 33 1.01 100.00A 3,034 93.61 93.61B 207 6.39 100.00A 2,090 64.49 64.49B 1,151 35.51 100.00A 2,742 84.60 84.60B 499 15.40 100.00A 1,985 61.25 61.25B 1,256 38.75 100.00
Table II – Frequency Table
Variable Frequency Cum. Perc.
CEO Family L
Chairman Family L
Family Managament L
Ownership Family 5-10% L
Ownership Family 10-20% L
Ownership Family 20-30% L
Ownership Family > 30% L
Ownership Lone Owner 5-10% L
Ownership Lone Owner 10-20% L
Ownership Lone Owner 20-30% L
Ownership Lone Owner > 30% L
Family Firm Narrow L
Family Firm Broad L
Family Firm Narrow (Comb. Own.) L
Family Firm Broad (Comb. Own.) L
1. A= All ob servations that do not have the mentioned characteris tic2. B = The ob servations that have the mentioned characteristic3. L = Lagged variab le is used (one year lag)
In model 6 an analyses is made on the effect of different levels of family and lone founder
ownership on the advertising intensity. Besides the managerial variable Family Management eight
variables were included to indicate family and lone founder ownership. For each type of
ownership four binary variables were created indicating the following levels of ownership: 5 to
10% ownership, 10 to 20% ownership, 20-30% and more than 30% ownership. Table II shows
that the counts for Family Ownership 5 to 10% (24) and Lone Ownership >30% (33) are low, but
acceptable, compared the total of more than 3,200 observations.
Besides the managerial, ownership and family firm variables other variables were included in
the six models to control for firm characteristics and performance. First of all the size of the firm
was controlled for by the logarithm of the firm assets. Logarithmic transformation of the variable
was desirable looking at the high kurtosis of 78,68 for the original data. To control for firm and/or
industry dependent financing structures the debt/assets-ratio was included. The variable return on
assets (ROA) is used to control for firm performance.
Another variable needed to be included to control for industry influences. As the advertising
intensity can be industry dependent a variable was constructed in which the median advertising
intensity was calculated for each industry (SIC). By using this variable it was not necessary to
included dummy variables to control for each of the 55 SIC-industries. The logarithm of firm age
was taken to control for the age of the firms. Finally dummy variables were included to control for
years 1992 up to 2003. All variables were lagged by one year with the exception of the age of the
firm and the industry variable.
In models 7 to 10 the effect of advertising on the performance of family firms is researched. In
these models the logarithm of the market-to-book ratio is used as the dependent variable. To
control for industry influences the same technique as on the advertising intensity is used. The
mean market-to-book ratio was calculated for each SIC-industry and incorporated into one
variable. In the models advertising intensity is lagged by one year and included as an
independent variable. In model 7 the continues variables family ownership and lone founder
ownership are included. In model 8 two interaction variables on ownership and advertising
intensity are introduced. For the first variable advertising intensity is multiplied with family
ownership and for the second variable advertising intensity is multiplied with lone founder
ownership. To control for other firm characteristics the same variables as in models 1 to 6 are
used.
In model 9 the eight binary variables on the levels of family and lone founder ownership are
included. In model 10 interaction variables are included in which the advertising intensity is
multiplied with the various ownership levels.
Copyright © 2010 20
3.3 MethodsIn this thesis several statistical techniques are used to analyze and investigate advertising
intensity in both the family firm and other firms. In this paragraph these statistical techniques are
discussed.
3.3.1 T-tests and Wilcoxon Rank-sum Test
First of all t-tests are used to determine weather or not there is a difference in the mean
advertising intensity of family and non-family firms. The t-tests are preformed on the individual
characteristics of the family firm as well as the broad and narrow family firms definitions. The t-
test has the null hypothesis that there is no difference in the means of the test variables. A p-
value smaller than the significant level of 0.05 results in the rejection of the null hypothesis and
different means are assumed. To asses weather a t-test for equal or unequal variance should be
used a Levene's test is performed. This test has the null hypothesis that the variances of the
samples are equal. A p-value below the chosen level of 0.05 will lead to the rejection of the null
hypothesis and unequal variances have to be assumed in the t-tests.
After the construction of the equal sized samples using the propensity score the Wilcoxon
rank-sum test is used to test the robustness of the research findings. The Wilcoxon rank-sum test
(Wilcoxon 1945; Mann and Whitney 1947) is a non-parametric test used to asses whether two
independent equally sized samples of observations have equally large values. The test is based
on the order in which observations from two samples fall. The results of the tests are used to
verify the findings of earlier preformed t-tests.
3.3.2 Clustered OLS Regression
In this thesis clustered OLS regression, which is a variation on the ordinary least squares
(OLS) regression, is used to investigate whether variables have a significant influence on
advertising intensity. One of the assumptions of OLS regression is that the residuals are
independent. Given the fact that the sample contains panel data on 500 firms collected over a
period of twelve years it is possible that scores within the firms are not independent. This in turn
could lead to residuals that are not independent within firms, but are independent between firms.
In this case clustered OLS regression can be used in which the observations are clustered on a
specific characteristic. In this thesis the observations are clustered by firm. When using clustered
OLS regressions the estimate of the coefficients are the same as the OLS estimates, but the
standard errors take into account that the observations within the firms are not independent. This
techniques improves the robustness of the results within the firms.
Copyright © 2010 21
3.3.3 Propensity Score Matching
To test the robustness of the results two equal samples were created using the propensity
score. Rosenbaum and Rubin (1983) proposed propensity score matching as a method to reduce
the bias in the estimation of treatment effects with observational data sets. The propensity score
is defined here as the conditional probability of receiving a treatment given pretreatment
characteristics. In other words the propensity score is the probability of a unit being assigned to a
condition or treatment given a set of known covariates.
Propensity scores are used to reduce selection bias by equating groups based on these
pretreatment characteristics. The propensity score is often used to calculate the Average effect of
Treatment on the Treated (ATT). But in this thesis the calculated propensity score is used to
construct a sample in which treated an untreated observations are equally represented. After this
the sample is analyzed using t-tests and the robustness is tested using Wilcoxon rank-sum tests.
In the statistical program STATA the propensity score is calculated using the following steps.
First of all a logit model is estimated in which the propensity scores are calculated. Next the
sample is split in equally spaced intervals of the propensity score. Within each interval it is tested
that the average propensity score of treated and control variables do not differ. In the event this
tests fails a interval is split in halve and after this the split intervals will be tested again. This
process results in intervals in which the average propensity score of the treated and untreated do
not differ. Next the means from the treated and untreated firms are tested for each (firm)
characteristic and each interval. If one of the means in an interval is different the model is not
rightly balanced and the variables used to calculate the propensity score have to be adjusted.
After these calculations 214 observations of both the treated and the untreated firms were
selected by hand to form a new sample of 428 observations. The treatment or condition in this
case was the binary variable ownership by lone founders. The selection of the observations was
based on the propensity scores in which a firm with lone founder ownership was matched to an
almost identical firm without lone founder ownership.
Copyright © 2010 22
4. Empirical resultsIn this chapter the empirical results of the statistical analysis are presented. In paragraph 4.1
the results on the t-tests are presented. Paragraph 4.2 reports the outcomes on the clustered
regressions and finally paragraph 4.3 reports the results on the robustness tests.
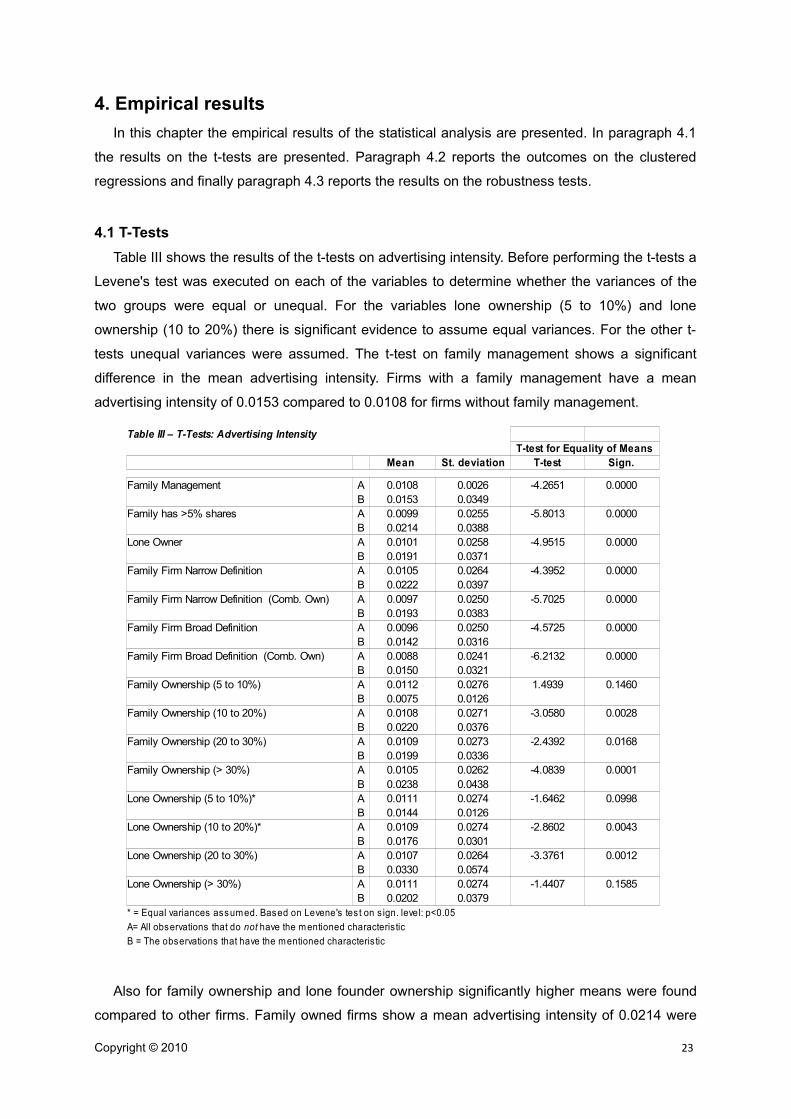
4.1 T-TestsTable III shows the results of the t-tests on advertising intensity. Before performing the t-tests a
Levene's test was executed on each of the variables to determine whether the variances of the
two groups were equal or unequal. For the variables lone ownership (5 to 10%) and lone
ownership (10 to 20%) there is significant evidence to assume equal variances. For the other t-
tests unequal variances were assumed. The t-test on family management shows a significant
difference in the mean advertising intensity. Firms with a family management have a mean
advertising intensity of 0.0153 compared to 0.0108 for firms without family management.
Also for family ownership and lone founder ownership significantly higher means were found
compared to other firms. Family owned firms show a mean advertising intensity of 0.0214 were
Copyright © 2010 23
T-test
A 0.0108 0.0026 -4.2651 0.0000B 0.0153 0.0349A 0.0099 0.0255 -5.8013 0.0000B 0.0214 0.0388A 0.0101 0.0258 -4.9515 0.0000B 0.0191 0.0371A 0.0105 0.0264 -4.3952 0.0000B 0.0222 0.0397A 0.0097 0.0250 -5.7025 0.0000B 0.0193 0.0383A 0.0096 0.0250 -4.5725 0.0000B 0.0142 0.0316A 0.0088 0.0241 -6.2132 0.0000B 0.0150 0.0321A 0.0112 0.0276 1.4939 0.1460B 0.0075 0.0126A 0.0108 0.0271 -3.0580 0.0028B 0.0220 0.0376A 0.0109 0.0273 -2.4392 0.0168B 0.0199 0.0336A 0.0105 0.0262 -4.0839 0.0001B 0.0238 0.0438A 0.0111 0.0274 -1.6462 0.0998B 0.0144 0.0126A 0.0109 0.0274 -2.8602 0.0043B 0.0176 0.0301A 0.0107 0.0264 -3.3761 0.0012B 0.0330 0.0574A 0.0111 0.0274 -1.4407 0.1585B 0.0202 0.0379
Table III – T-Tests: Advertising IntensityT-test for Equality of Means
Mean St. deviation Sign.
Family Management
Family has >5% shares
Lone Owner
Family Firm Narrow Definition
Family Firm Narrow Definition (Comb. Own)
Family Firm Broad Definition
Family Firm Broad Definition (Comb. Own)
Family Ownership (5 to 10%)
Family Ownership (10 to 20%)
Family Ownership (20 to 30%)
Family Ownership (> 30%)
Lone Ownership (5 to 10%)*
Lone Ownership (10 to 20%)*
Lone Ownership (20 to 30%)
Lone Ownership (> 30%)
* = Equal variances assumed. Based on Levene's tes t on s ign. level: p<0.05A= All observations that do not have the m entioned characteris ticB = The observations that have the mentioned characteris tic

as other firms have an intensity of 0.0099. For lone founder ownership these numbers are
respectively 0.0191 and 0.0101.
In the t-tests on the narrow and broad definitions of the family firm the inclusion of combined
ownership made little difference on the outcome of the tests. For all four definitions the t-tests
show that the mean advertising intensity of the family firms is significantly higher than the mean
advertising intensity of non-family firms. For the narrow definition of the family firm the mean is
0.0222 against 0.0105 for other firms. The narrow definition based on both family and lone
founder ownership shows a mean of 0.0193 against a mean of 0.0097 for other firms. Similar
result are found for the broad definition of the family firm. For the broad definition a mean of
0.0142 was found and a mean of 0.0096 for other firms. The broad definition based on both
family and lone founder ownership showed a mean of 0.0150 against a mean of 0.0088 for non-
family firms.
The last eight t-tests investigate the difference in advertising intensity means of the various
ownership levels of family ownership and lone founder ownership. Three of the variables were not
significant on a level of P<0.05. These were family ownership (5 to 10%) with a p-value of 0.1460,
lone ownership (5 to 10%) with a p-value of 0.0998 and finally lone ownership (>30%) with a p-
value of 0.1585. However one can see that these variables do show a higher mean advertising
intensity compared to types and levels of ownership.
4.2 Clustered OLS RegressionThis paragraph describes the statistical results on the clustered OLS regressions. In
paragraph 4.2.1 the correlations and the VIF-values are discussed. Paragraph 4.2.2 handles the
regressions on the level of advertising and paragraph 4.2.3 describes the regressions
investigating the (interaction) effect of advertising intensity and family firms on the firm
performance.
4.2.1 Correlations and VIF-values
The correlation tables are included in appendix II tables B and C. High positive correlations
can be found for the continues variables ownership lone owner (0.315) and family ownership
(0.257) in relation to the variable family management. The variable Sic_Median_Advertising_
intensity is highly correlated with Advertising Intensity. This is not surprising as this variable is
constructed out of the variables SIC and Advertising intensity. The same level of correlation
(0.234) is found on the variable Sic_Median_ Market_to_Book in relation to the logarithm of the
market-to-book ratio. Finally the logarithm of the firm age has a high positive correlation of 0.410
with the logarithm of assets. These higher correlation levels were expected and do not cause
problems in the regression.
Copyright © 2010 24
The Variance Inflation Factor or VIF-values gives an indication on the level of multicollinearity
in an OLS regression. For each OLS regression the individual and mean VIF is calculated and
the results are displayed in appendix III table D. For models 1 to 5 the individual VIF-values range
from 1.03 to 2.46 and the mean VIF of the models fluctuates between 1.74 and 1.81.
Multicollinearity is considered to become a problem when VIF-values become larger then 10.
Thus the VIF-values of these models do not indicate problems with multicollinearity. Models 6 to
10 however have a mean VIF of 10.49 up to 12.47 which indicates high levels of multicollinearity.
Further analyses shows that the year dummies in the regressions have a high VIF of 17.04 up to
29.22. When these dummies are excluded the mean VIF drops below 2 and therefore the higher
VIF-values of the dummy variables are not considered to be a problem.
4.2.2 Advertising Intensity and family firms
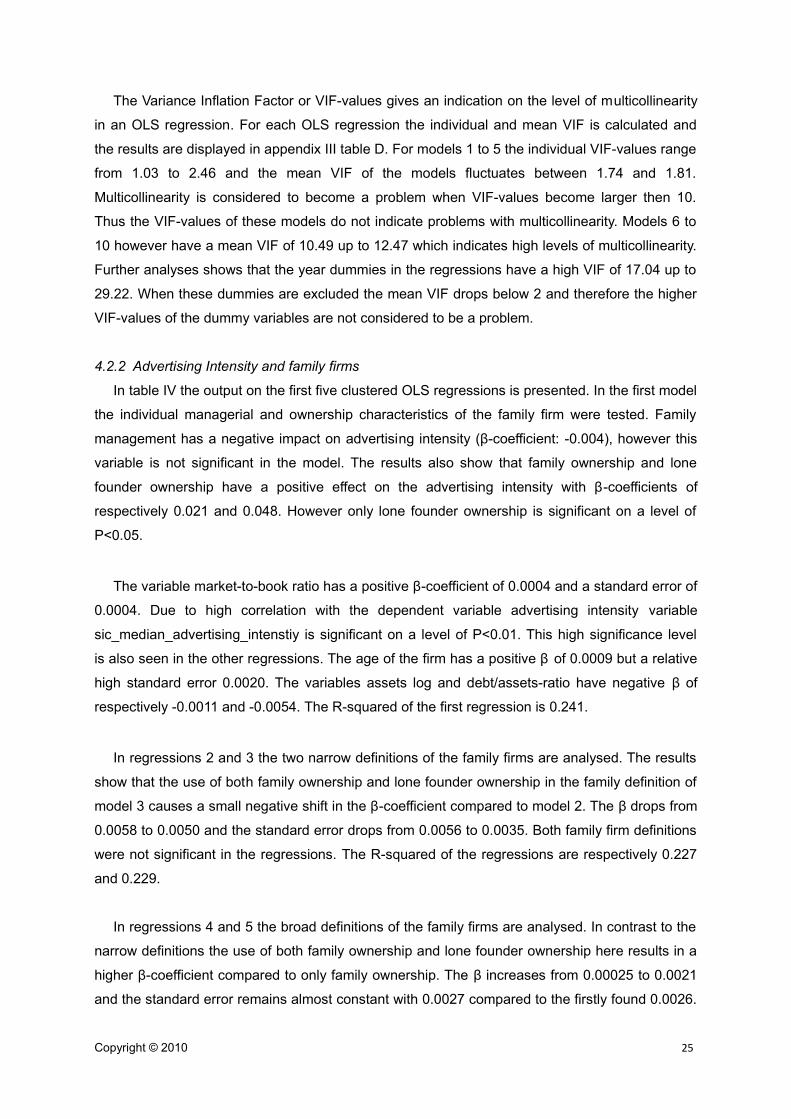
In table IV the output on the first five clustered OLS regressions is presented. In the first model
the individual managerial and ownership characteristics of the family firm were tested. Family
management has a negative impact on advertising intensity (β-coefficient: -0.004), however this
variable is not significant in the model. The results also show that family ownership and lone
founder ownership have a positive effect on the advertising intensity with β-coefficients of
respectively 0.021 and 0.048. However only lone founder ownership is significant on a level of
P<0.05.
The variable market-to-book ratio has a positive β-coefficient of 0.0004 and a standard error of
0.0004. Due to high correlation with the dependent variable advertising intensity variable
sic_median_advertising_intenstiy is significant on a level of P<0.01. This high significance level
is also seen in the other regressions. The age of the firm has a positive β of 0.0009 but a relative
high standard error 0.0020. The variables assets log and debt/assets-ratio have negative β of
respectively -0.0011 and -0.0054. The R-squared of the first regression is 0.241.
In regressions 2 and 3 the two narrow definitions of the family firms are analysed. The results
show that the use of both family ownership and lone founder ownership in the family definition of
model 3 causes a small negative shift in the β-coefficient compared to model 2. The β drops from
0.0058 to 0.0050 and the standard error drops from 0.0056 to 0.0035. Both family firm definitions
were not significant in the regressions. The R-squared of the regressions are respectively 0.227
and 0.229.
In regressions 4 and 5 the broad definitions of the family firms are analysed. In contrast to the
narrow definitions the use of both family ownership and lone founder ownership here results in a
higher β-coefficient compared to only family ownership. The β increases from 0.00025 to 0.0021
and the standard error remains almost constant with 0.0027 compared to the firstly found 0.0026.
Copyright © 2010 25
In line with the narrow family firm definitions the broad definitions are also not significant in the
regression. The market-to-book ratio is significant in both regressions on a P-level of <0.05. The
R-squared of the regressions 4 and 5 are respectively 0.225 and 0.226.
In regression 6 both family and lone founder ownership are divided into four levels of
ownership (Table V). Besides the ownership variables the variable family management was
included. This variable has a negative impact on advertising intensity (β-coefficient: -0.0046) and
Copyright © 2010 26
1 2 3 4 5
-0.0040(0.0026)0.0208(0.0135)0.0483**(0.0194)
0.0058(0.0056)
0.0050(0.0035)
0.00025(0.0026)
0.0021(0.0027)
-0.0054 -0.0070 -0.0061 -0.0073 -0.0072(0.0043) (0.0044) (0.0043) (0.0045) (0.0045)-0.0011 -0.0009 -0.0011 -0.0011 -0.0010(0.0009) (0.0009) (0.0009) (0.0009) (0.0009)0.0004** 0.0004** 0.0004** 0.0004** 0.0005**(0.0002) (0.0001) (0.0002) (0.0002) (0.0002)0.0009 0.0008 0.0013 0.00107 0.0012(0.0020) (0.0019) (0.0020) (0.0020) (0.0021)0.7070*** 0.7100*** 0.7030*** 0.7150*** 0.7080***(0.1651) (0.1652) (0.1649) (0.1686) (0.1679)
Year 1996 -0.0001 -0.0002 -0.0002 -0.0002 -0.0002(0.0011) (0.0011) (0.0011) (0.0011) (0.0011)
Year 1997 0.0001 0.0002 0.00015 0.00025 0.0002(0.0013) (0.0013) (0.0013) (0.0013) (0.0019)
Year 1998 -0.0003 -0.0003 -0.0003 -0.0003 -0.0003(0.0015) (0.0015) (0.0015) (0.0015) (0.0015)
Year 1999 -0.0004 -0.0005 -0.0005 -0.0005 -0.0005(0.0017) (0.0017) (0.0017) (0.0017) (0.0017)
Year 2000 0.0007 0.0007 0.0008 0.0007 0.0007(0.0018) (0.0018) (0.0018) (0.0018) (0.0018)
Year 2001 0.0008 0.0007 0.0007 0.0007 0.0007(0.0019) (0.0019) (0.0019) (0.0019) (0.0019)
Year 2002 0.00109 0.0010 0.0011 0.0011 0.0011(0.0019) (0.0019) (0.0019) (0.0019) (0.0019)
Year 2003 0.0019 0.0019 0.0019 0.0019 0.0019(0.0019) (0.0019) (0.0019) (0.0019) (0.0019)
Constant 0.0120* 0.0114* 0.0103 0.0123* 0.0099(0.0070) (0.0066) (0.0064) (0.0074) (0.0073)
3193 3193 3193 3193 31930.2414 0.2272 0.2286 0.2245 0.2257
Table IV – Clustered OLS Regressions
Variables
Family Management L
Ownership Familyonly L
Ownership Loneowner L
Family Firm Narrow Definition L
Family Firm Narrow Definition (Comb. Own) L
Family Firm Broad Definition L
Family Firm Broad Definition (Comb. Own) L
Debt / Assets L
Assets Log L
Market to Book L
Firmage Log
Sic Median Advertising Intensity
ObservationsR-squared1. Robust standard errors in parentheses, *** p<0.01, ** p<0.05, * p<0.12. Dependent variable: Advertising Intensity3. L = Variable is lagged by one year

is significant on a level of P<0.10. The direction and impact of the variable on the advertising
intensity is in line with the results of the first regression. However in the first regression family
management was not significant.
With the exception of family ownership
(5 to 10%) all ownership levels have
positive β-coefficients. To a certain level
the β-coefficients increase as the level of
ownership increases. Family ownership
starts with a negative β of -0.006 for 5 to
10% ownership. The β then increases
from 0.0078 for 10 to 20% ownership to
0.009 for 20 to 30% ownership. Finally a
family ownership of more than 30% results
in a β of 0.0094. From the four family
ownership variables only the variable 20
to 30% ownership is significant to the
regression and only on a level of P<0.10.
Lone founder ownership starts with a
positive β of 0.0033 for 5 to 10%
ownership. The β increases from 0.0077
for 10 to 20% ownership to 0.0243 for 20
to 30% ownership. Finally lone founder
ownership of more than 30% results in a β
of 0.0172. From the four family ownership
variables both 20 to 30% ownership and
ownership >30% are significant to the
regression a level of P<0.05.
Like in the previous regressions the
variable sic_median_advertising_intensity.
is significant on a p-level of 0.05. Market-
to-book ratio is the only other variable
which is significant on P<0.05. Both
Debt/Assets ratio and Assets Log have a
negative β. The R-squared of the
regression is 0.25.
Copyright © 2010 27
6
-0.0046*(0.0026)-0.0060(0.0041)0.0078(0.0064)0.0090*(0.0049)0.0094(0.0072)0.00328(0.00435)0.00766*(0.00455)0.0243**(0.0110)0.0172**(0.00784)-0.00485(0.00427)-0.00104(0.000893)0.000387**(0.000173)0.000940(0.00195)0.701***0.1646728
Year 1995 0.00321(0.0102)
Year 1996 0.00302(0.0103)
Year 1997 0.00336(0.0105)
Year 1998 0.00278(0.0106)
Year 1999 0.00268(0.0109)
Year 2000 0.00387(0.0109)
Year 2001 0.00388(0.0110)
Year 2002 0.00420(0.0110)
Year 2003 0.00513(0.0109)
Constant 0.00815(0.0146)
31930.2501
Table V – Clustered OLS Regressions
Variables
Family Management L
Family Ownership (5 to 10%) L
Family Ownership (10 to 20%) L
Family Ownership (20 to 30%) L
Family Ownership (> 30%) L
Lone Ownership (5 to 10%) L
Lone Ownership (10 to 20%) L
Lone Ownership (20 to 30%) L
Lone Ownership (> 30%) L
Debt / Assets L
Assets Log L
Market to Book L
Firmage Log
Sic Median Advertising Intensity
ObservationsR-squared1. Robust standard errors in parentheses, *** p<0.01, ** p<0.05, * p<0.12. Dependent variable: Advertising Intensity3. L = Variable is lagged by one year
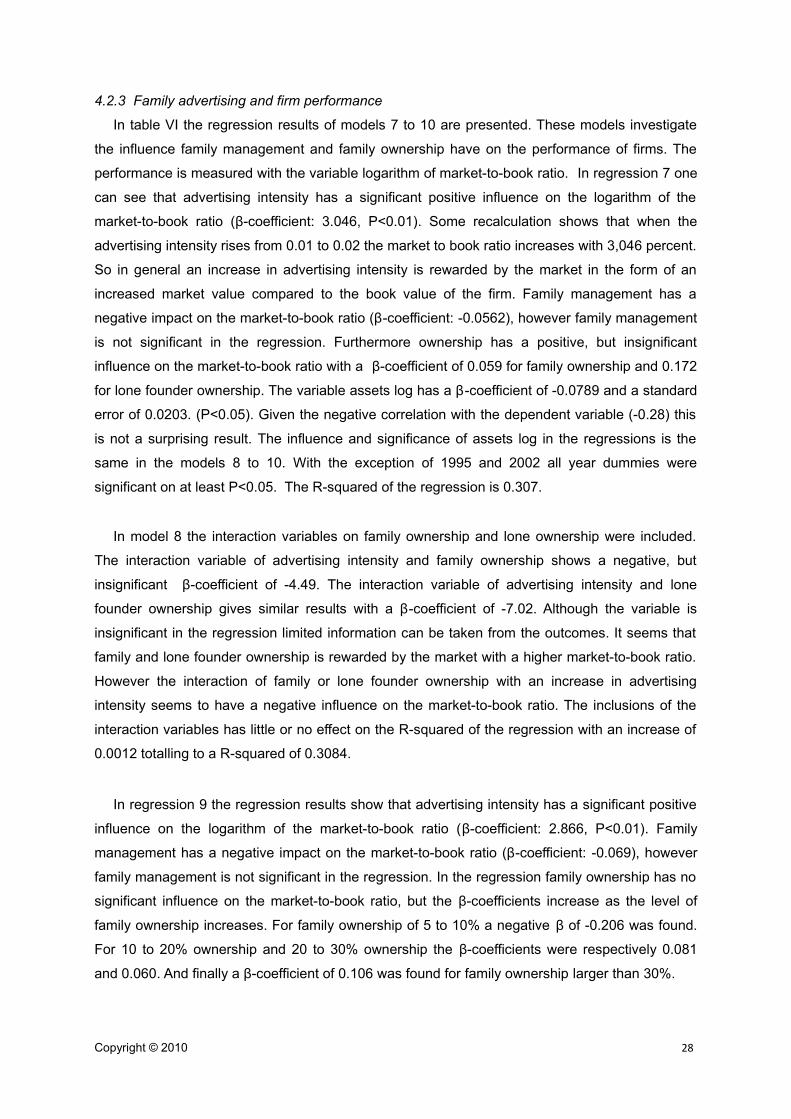
4.2.3 Family advertising and firm performance
In table VI the regression results of models 7 to 10 are presented. These models investigate
the influence family management and family ownership have on the performance of firms. The
performance is measured with the variable logarithm of market-to-book ratio. In regression 7 one
can see that advertising intensity has a significant positive influence on the logarithm of the
market-to-book ratio (β-coefficient: 3.046, P<0.01). Some recalculation shows that when the
advertising intensity rises from 0.01 to 0.02 the market to book ratio increases with 3,046 percent.
So in general an increase in advertising intensity is rewarded by the market in the form of an
increased market value compared to the book value of the firm. Family management has a
negative impact on the market-to-book ratio (β-coefficient: -0.0562), however family management
is not significant in the regression. Furthermore ownership has a positive, but insignificant
influence on the market-to-book ratio with a β-coefficient of 0.059 for family ownership and 0.172
for lone founder ownership. The variable assets log has a β-coefficient of -0.0789 and a standard
error of 0.0203. (P<0.05). Given the negative correlation with the dependent variable (-0.28) this
is not a surprising result. The influence and significance of assets log in the regressions is the
same in the models 8 to 10. With the exception of 1995 and 2002 all year dummies were
significant on at least P<0.05. The R-squared of the regression is 0.307.
In model 8 the interaction variables on family ownership and lone ownership were included.
The interaction variable of advertising intensity and family ownership shows a negative, but
insignificant β-coefficient of -4.49. The interaction variable of advertising intensity and lone
founder ownership gives similar results with a β-coefficient of -7.02. Although the variable is
insignificant in the regression limited information can be taken from the outcomes. It seems that
family and lone founder ownership is rewarded by the market with a higher market-to-book ratio.
However the interaction of family or lone founder ownership with an increase in advertising
intensity seems to have a negative influence on the market-to-book ratio. The inclusions of the
interaction variables has little or no effect on the R-squared of the regression with an increase of
0.0012 totalling to a R-squared of 0.3084.
In regression 9 the regression results show that advertising intensity has a significant positive
influence on the logarithm of the market-to-book ratio (β-coefficient: 2.866, P<0.01). Family
management has a negative impact on the market-to-book ratio (β-coefficient: -0.069), however
family management is not significant in the regression. In the regression family ownership has no
significant influence on the market-to-book ratio, but the β-coefficients increase as the level of
family ownership increases. For family ownership of 5 to 10% a negative β of -0.206 was found.
For 10 to 20% ownership and 20 to 30% ownership the β-coefficients were respectively 0.081
and 0.060. And finally a β-coefficient of 0.106 was found for family ownership larger than 30%.
Copyright © 2010 28

More significant results were found on lone founders ownership. Lone Ownership (5 to 10%)
has a significant, negative influence on the market-to-book ratio (β-coefficient: -0.163 P<0.10).
Lone founder ownership levels from 10 to 20% have a β-coefficient of 0.0167, but are
insignificant in the regression. Lone Ownership (20 to 30%) is significant on a P-level of 0.10 with
a positive β-coefficient of 0.2294. Lone founder ownership larger than 30% breaks the upward
trend with a β-coefficient -0.05 and a significant effect on the logarithm of the market-to-book
ratio.
The variable assets log has a β-coefficient of -0.0768 and a standard error of 0.0202. The
variable is significant on a P-level of 0.01. With the exception of 1995 and 2002 all year dummies
were significant on a significance level of at least P<0.10. The R-squared of the regression is
0.315.
In model 10 the interaction variables on advertising intensity and ownership were included.
The interaction variables all show a negative β-coefficient in the range of -0.21 to -6.76. The
interaction variables on family ownership were all insignificant in the regression. Significant
results were found for three of the four the interaction variables on lone founder ownership. This
indicates that lone founder ownership is 'rewarded' by the market with a significant lower market-
to-book ratio. The interaction variable on 5 to 10% lone ownership has a negative β-coefficient of
-6.759 (P<0.05). The interaction variable on 10 to 20% lone ownership has a negative β-
coefficient of -6.0995 (P<0.1) and finally the interaction variable on lone ownership larger than
30% has a negative β-coefficient of -5.459 (P<0.1). The R-squared of the regression is 0.321 and
almost unchanged in respect to the R-squared of model 9.
Copyright © 2010 29
Copyright © 2010 30
7 8 9 10
3.0456** 3.652** 2.8655** 4.306***(1.2415) (1.5337) (1.2511) (1.6210)-0.0562 -0.0567 -0.2096(0.0578) (0.0581) (9.2917)0.0590 0.1430 -2.0412
(0.2902) (0.3050) (2.8193)0.1717 0.3002 -5.7045
(0.3844) (0.4067) (2.5382)-4.4906 -2.6146(5.6603) (3.0073)-7.0174 -6.7594**(8.1656) (3.1061)
-0.0588 -0.0615 -6.0995*(0.1365) (0.1371) (3.2145)
-0.0789*** -0.0792*** -0.8077(0.0203) (0.0202) (2.4498)-0.0483 -0.0477 -5.4586*(0.0342) (0.0342) (2.8751)0.2138*** 0.2128*** -0.0691 -0.0695(0.0298) (0.0298) (0.0583) (0.0579)
Year 1995 0.0599 0.0644 -0.2063 -0.2010(0.0733) (0.0736) (0.1549) (0.1890)
Year 1996 0.1457** 0.1477** 0.0807 0.1035(0.0741) (0.0741) (0.1038) (0.0987)
Year 1997 0.3431*** 0.3451*** 0.0603 0.1572(0.0731) (0.0731) (0.1151) (0.1142)
Year 1998 0.3640*** 0.3651*** 0.1063 0.1487(0.0774) (0.0773) (0.1444) (0.1558)
Year 1999 0.3460*** 0.3476*** -0.1629* -0.0764(0.0773) (0.0771) (0.0932) (0.0926)
Year 2000 0.3267*** 0.3300*** 0.0167 0.1064(0.0752) (0.0754) (0.1583) (0.1836)
Year 2001 0.1933*** 0.1965*** 0.2994* 0.2920(0.0745) (0.0747) (0.1618) (0.1899)
Year 2002 -0.0519 -0.0492 -0.0528 0.0504(0.0762) (0.0763) (0.1811) (0.1867)
Year 2003 0.1456** 0.1487** -0.0533 -0.0693(0.0737) (0.0738) (0.1351) (0.1361)
Constant 1.154*** 1.1503*** -0.0768*** -0.0763***(0.2447) (0.2449) (0.0202) (0.0203)
-0.0558 -0.0569*3158 3158 (0.0340) (0.0336)
0.3073 0.3084 0.2127*** 0.2110***(0.0290) (0.0297)
Year 1995 0.0457 0.0607(0.0759) (0.0756)
Year 1996 0.1354* 0.1466*(0.0763) (0.0758)
Year 1997 0.3342*** 0.3444***(0.0754) (0.0748)
Year 1998 0.3499*** 0.3597***(0.0796) (0.0792)
Year 1999 0.3319*** 0.3445***(0.0793) (0.0788)
Year 2000 0.3121*** 0.3269***(0.0776) (0.0773)
Year 2001 0.1788** 0.1931**(0.0766) (0.0765)
Year 2002 -0.0662 -0.0547(0.0782) (0.0776)
Year 2003 0.1332* 0.1449*(0.0761) (0.0756)
Constant 1.1850*** 1.1711***(0.2436) (0.2458)
3158 31580.3149 0.3214
Table VI – Clustered OLS Regressions
Variables Variables
Advertising Intensity L Advertising Intensity L
Family Management L Interaction Adv.Int * Fam (5 to 10%)
Ownership Familyonly L Interaction Adv.Int * Fam (10 to 20%)
Ownership Lone Owner L Interaction Adv.Int * Fam (20 to 30%)
Interaction Adv.Int * Fam Own. Interaction Adv.Int * Fam (> 30%)
Interaction Adv.Int * Lone Own. Interaction Adv.Int * LO (5 to 10%)
Debt / Assets L Interaction Adv.Int * LO (10 to 20%)
Assets Log L Interaction Adv.Int * LO (20 to 30%)
Firmage Log Interaction Adv.Int * LO (> 30%)
Sic Median MTB Family Management L
Family Ownership (5 to 10%) L
Family Ownership (10 to 20%) L
Family Ownership (20 to 30%) L
Family Ownership (> 30%) L
Lone Ownership (5 to 10%) L
Lone Ownership (10 to 20%) L
Lone Ownership (20 to 30%) L
Lone Ownership (> 30%) L
Debt / Assets L
Assets Log L
Firmage LogObservationsR-squared Sic Median MTB
1. Rob ust standard errors in parentheses, *** p<0.01, ** p<0.05, * p<0.12. Dependent variab le: Market to Book ratio (log)3. L = Variable is lagged by one year
ObservationsR-squared
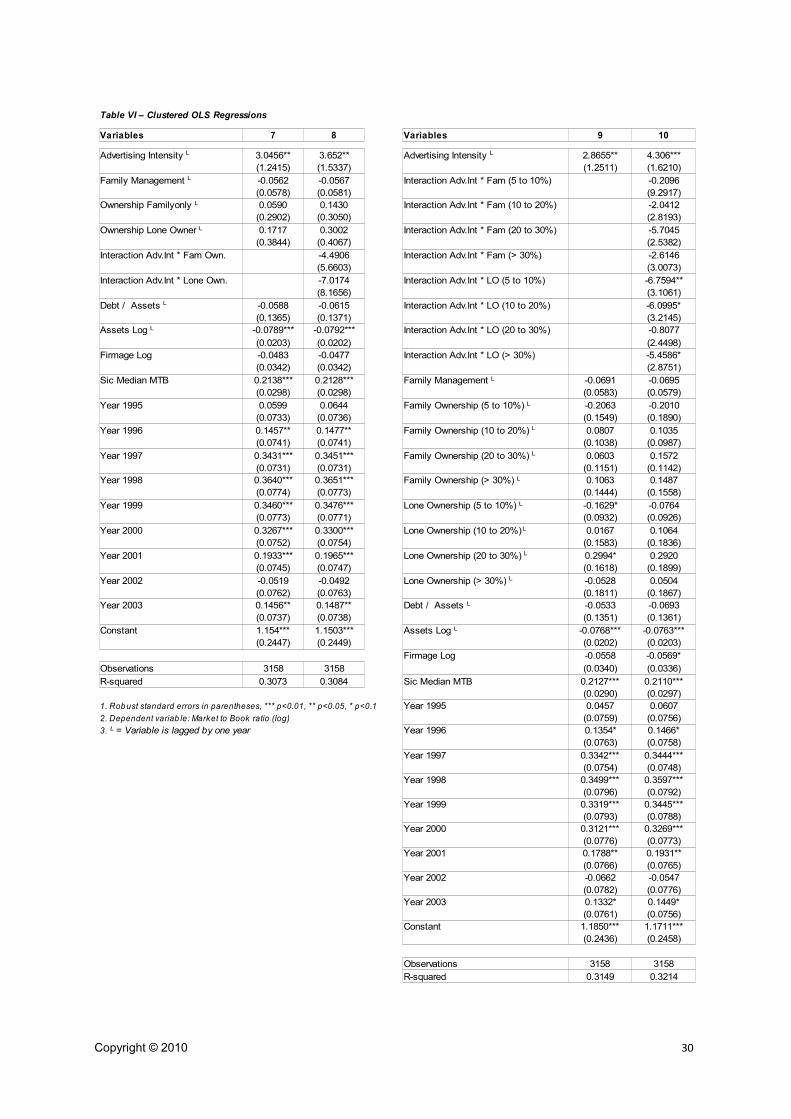
4.3 Robustness In this paragraph the results on the robustness tests are presented. In previous paragraphs t-
tests and regressions have indicated that in the case of lone founder ownership the advertising
intensity is significant higher compared to other firms. To test the robustness of these results a
sample is constructed from the original dataset. First of all the propensity score was calculated for
all observations using the binary variable lone founder ownership as treatment variable. The
pretreatment characteristics that could be included in the logit regression were: the age of the
firm, the debt/assets-ratio, return on assets and the variables on the years 1994 to 2003. It was
not possible to included any industry variable or other variables as the balancing property would
not be satisfied. The final sample contains 428 observations: half of these observations has lone
founder ownership and in the other observations lone founder ownership is absent.
Table VII displays the results of t-tests preformed on the created sample. The t-tests were
executed to determine the equality of the characteristics of the treated and untreated. To asses
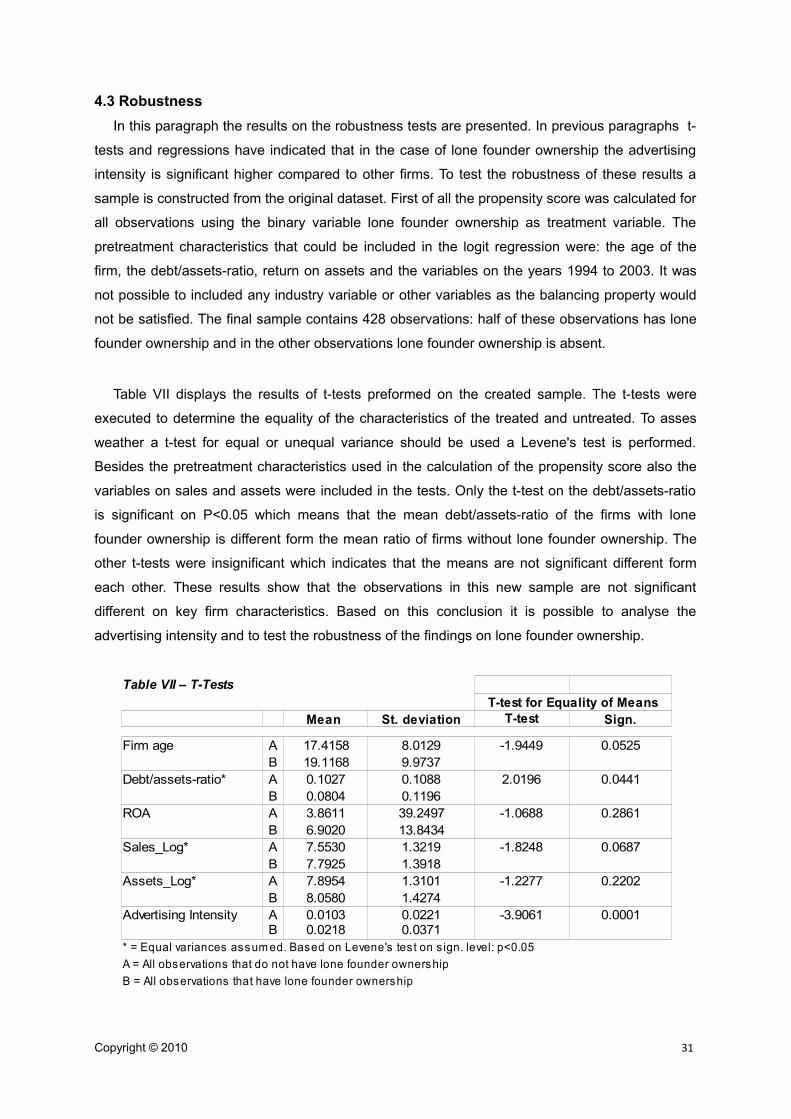
weather a t-test for equal or unequal variance should be used a Levene's test is performed.
Besides the pretreatment characteristics used in the calculation of the propensity score also the
variables on sales and assets were included in the tests. Only the t-test on the debt/assets-ratio
is significant on P<0.05 which means that the mean debt/assets-ratio of the firms with lone
founder ownership is different form the mean ratio of firms without lone founder ownership. The
other t-tests were insignificant which indicates that the means are not significant different form
each other. These results show that the observations in this new sample are not significant
different on key firm characteristics. Based on this conclusion it is possible to analyse the
advertising intensity and to test the robustness of the findings on lone founder ownership.
Copyright © 2010 31
T-test
A 17.4158 8.0129 -1.9449 0.0525B 19.1168 9.9737A 0.1027 0.1088 2.0196 0.0441B 0.0804 0.1196
ROA A 3.8611 39.2497 -1.0688 0.2861B 6.9020 13.8434A 7.5530 1.3219 -1.8248 0.0687B 7.7925 1.3918A 7.8954 1.3101 -1.2277 0.2202B 8.0580 1.4274A 0.0103 0.0221 -3.9061 0.0001B 0.0218 0.0371
Table VII – T-TestsT-test for Equality of Means
Mean St. deviation Sign.
Firm age
Debt/assets-ratio*
Sales_Log*
Assets_Log*
Advertising Intensity
* = Equal variances assum ed. Based on Levene's test on s ign. level: p<0.05A = All observations that do not have lone founder ownershipB = All observations that have lone founder ownership
A normal t-test (table VII) shows that the mean advertising intensity is significant higher in
case of lone founder ownership. These results are confirmed by the Wilcoxon rank-sum test
(Table VIII) in which the null-hypothesis of equal advertising intensities in both groups is rejected.
The advertising intensity is significantly higher in case of lone founder ownership. These results
show that the findings on lone founder ownership are robust.
Copyright © 2010 32
0 214 40948 459031 214 50858 45903
428 91806 91806
1637207.00-314672.221322534.78
z = -4.309
Table VIII – Wilcoxon Rank-Sum Test: Advertising Intensity
Ho: Advertising intensity is equal for Lone Owner = 0 and Lone Owner = 1
Lone Owner Observations Rank Sum Expexted
Unadjusted variance =Adjustment for ties =Adjusted variance =
Prob > |z| = 0.0000
5. DiscussionIn this chapter the findings on the empirical analyses are connected to the hypotheses. In
paragraph 5.1 this is done for the family firm and it influences on the level of advertising intensity.
Paragraph 5.2 discusses the hypotheses on the effect of advertising by family firms on the firm
performance.
5.1 Advertising Intensity and Family FirmsHypothesis 1 stated that family firms woud have different advertising. In t-tests the null-
hypotheses of no difference in the mean advertising intensity were rejected. All four family firm
definitions (both broad as well as narrow definitions) showed significantly higher advertising
intensities compared to other firms. Interesting finding was that the introduction of lone founder
owners into the variable made little difference on mean advertising intensities as well as the
standard deviations. However in the regressions all four family firm definitions had an insignificant
influence on the advertising intensity. This justified the more detailed analyses of the individual
characteristics of the family firm.
Hypothesis 2 stated that family owned firms have a higher advertising intensity than other
firms. This hypothesis was made on the argument that the family firm has an interest in
transferring the firm to next generations. The t-tests showed that advertising intensity in family
owned firms is significantly higher compared other firms. An exception was found in family
ownership on a level of 5-10%. On this level the mean advertising intensity was lower for family
firms compared to other firms and in the regressions this level of ownership had a negative effect
on the advertising intensity. Overall the hypothesis was confirmed by the statistical analyses but
unfortunately the findings were insignificant in the regressions.
Lone founder ownership turned out to play an important role in this thesis. Hypothesis 3 stated
that family owned firms would have a higher advertising intensity than other firms. Being first
generation family firms the lone founders turn out to have a significant positive influence on the
level of advertising. The t-tests preformed on lone founder ownership also showed significant
higher mean advertising intensity compared to other firms. This result was found on both the four
lone ownership levels as well as the overall ownership variable.
Hypothesis 4a stated that family managed firms would have a lower advertising intensity than
other firms. The t-test and regressions indeed showed lower levels of advertising in the case of
family management. Unfortunately the results in the regressions were not significant. The lower
advertising intensity is in line with the theory that family controlled firms have different visions and
strategies on advertising as they may serve more loyal customers. The use of less cost-intensive
advertising and other types of advertisement is also in line with these findings. Hypothesis 4b was
rejected as results like does found by Shum (2004) were not found in this research.
Copyright © 2010 33
5.2 Advertising Intensity and Family Firm PerformanceHypothesis 5 stated that advertising results in better market performance for lone founder
firms compared to other firms. This hypothesis was partly confirmed in this research. It became
clear that lone founder ownership has an positive effect on the market-to-book ratio. However this
positive effect does not originate from the interaction of advertising with lone founder ownership.
In fact this interaction has a significant negative effect on the market-to-book ratio. No direct
explanation could be found for this result, but it seem that the market is negative and/or sceptical
towards lone founded firms with high(er) level of advertising intensity. The findings of Miller, Le
Breton-Miller, Lester and Cannella (2007) that lone founder businesses perform better than other
corporations were not found in this research.
Copyright © 2010 34
6. ConclusionIn paragraph 6.1 the main conclusions of this thesis are presented and the research questions
are answered. Paragraph 6.2 discusses the limitations of this research and provides suggestions
for future research.
6.1 ConclusionsThe first research question investigated the level of advertising in family and non-family firms
and was formulated as: To what degree do family firms have different levels of advertising
spending than non-family firms? This research found significant higher levels of advertising
intensity in family firms based on both broad as well as narrow family firm definitions. However for
all four family firm definitions the family firm influence on the level of advertising turned out to be
insignificant in the regressions. The analyses of the individual family firm characteristics lead to
interesting results in which family management was found to have a negative effect on the
advertising intensity. Theoretical explanations point to the use of other, possibly less costly, types
of advertising by family management. These findings are in contrast with the results on family and
lone founder ownership. Both types of ownership have a positive effect on the level of advertising
and as the level of ownership increases the influence also tends to increase. For family
ownership the positive effect on the advertising intensity can be explained by the long term focus
of families and the desire to transfer the business to future generations. However most results on
family ownership were not significant in the regressions. The need for brand building can explain
the positive significant results for lone founder businesses. In this perspective a higher
advertising intensity is more linked to aspects like market entry and business survival and the link
with being a (first generation) family firm is pushed to the background.
The second research question investigated the effect of advertising and was formulated as
followed: Does the effect of advertising on the financial performance differ between family and
non-family firms? This research found that in general advertising intensity is rewarded by the
(stock) market which results in a higher market-to-book ratio. Theoretical explanation is that more
advertising will secure and/or stimulate sales which in turn translates into (a possibility of) higher
profits. When investigating the influence of the family firm it became clear that especially lone
founder ownership has an positive effect on the market-to-book ratio. However this positive effect
does not originate from the interaction of advertising with lone founder ownership. In fact this
interaction has a significant negative effect on the market-to-book ratio. No direct explanation
could be found for this result, but it seem that the market is negative and/or sceptical towards
lone founded firms with high(er) level of advertising intensity. Further research on this finding is
necessary.
Copyright © 2010 35

6.2 Limitations and further research In this research the used data and definitions lead to several limitations. First of all the size
and geographical dispersion of the investigated firms present limitations on the outcomes as only
large US-firms of the S&P500 have been used for this research. Furthermore the stocks of the
these firms are actively traded and for a large share of the other firms this is not the case. One
could argue therefore that the results only hold for a fairly small proportion of the economy. This
leads to the suggestion that future research could use datasets that are more divers. An example
is the inclusion of smaller firms and/or firms from another continents like Europe or Asia.
Another limitation is the used definition of advertisement. Advertising intensity is a monetary
representation of advertising activities and thereby this research has ignored some important
parts of the subject of advertising. Not all types of advertising are included in advertising
expenses. An good example of advertising without (large) costs is word-to-mouth advertising
which can be very effective. Although its is hard to collect specified data on these types of
advertising the results could be interesting and possibly explain a large portion of the differences
between family and non-family firms.
Copyright © 2010 36

References
Anderson, R. C., Reeb, D.R. (2003): “Founding family ownership and firm performance: evidence from the S&P 500”, Journal of Finance, 58(3): 1301-1328
Becker, S.O. (2002): “Estimation of average treatment effects based on propensity scores”, Stata Journal, 2002, 2(4): 358-377
Bird, B., Welsch, H., Astrachan, J.H., Pistrui, D. (2002): “Family Business Research: The Evolution of an Academic Field”
Block, J.H. (2008): “Family Management, Family Ownership and Downsizing: Evidence from S&P 500 Firms”, SFB 649 Discussion Paper 2008-023
Caselli, S., Di Giuli A., (2010): “Does the CFO matter in family firms? Evidence from Italy” The European Journal of Finance, Volume 16 (5) July 2010, 381 - 411
Chauvin, K.W., Hirschey, M., (1993): “Advertising, R&D expenditures and the Market Value of the Firm”, Financial Management, 1993
Comanor, W.S., T.A. Wilson (1979): “The Effect of Advertising on Competition: A Survey”, Journal of Economic Literature, 17, 453-476
Demsetz, H. (1983): “The structure of ownership and the theory of the firm” Journal of Law and Economics, Vol 26 (2), 375-390
Edmans, A. (2009): “Blockholder Trading, Market Efficiency, and Managerial Myopia “, The Journal of finance (New York), 64, 6, 2481-2513
Holderness, C.G. (2003): “A survey of blockholders and corporate control”, Economic Policy Review - Federal Reserve Bank of New York; Apr 2003; 9, 1: 51
Gatignon, H. (1984): “Competition as a Moderator of the Effect of Advertising on Sales”, Journal of Marketing Research, 21, 387-398
James, H. S. (1999): “Owner as manager, extended horizons and the family firm”, International Journal of the Economics of Business, 6: 41-55.
Mann, H. B., Whitney, D. R. (1947). "On a test of whether one of two random variables is stochastically larger than the other" Annals of Mathematical Statistics 18, 50
Meisel, J.B. (1979): “Demand and Supply Determinants of Advertising Intensities Among Convenience Goods”, Southern Economic Journal, 46(1), 233-244
Miller D., Le Breton-Miller,I., Lester R.H., Cannella Jr. A.A. (2007): “Are family firms really superior performers?”, Journal of Corporate Finance 13, 829–858
Nelson, P. (1974): “Advertising as Information”, Journal of Political Economy, 82, 729-755
Pearl, Jayne, A , Kristie, L. (2005): “The World’s Largest Family Businesses”, Family Business Magazine
Pindado, J., Requejo, I., de la Torre, C. (2004): “Does family ownership impact positively on firm value? Empirical evidence from Western Europe” Documento de Trabajo 02/08
Politz, A. (1975): “The function of advertising and its measurements”, Journal of advertising, 4, 10
Copyright © 2010 37
Richards, J.I., Curran C.M. (2002) ”Oracles on Advertising: Searching for a Definition”, Journal of Advertising; 31(2), 63-77
Shanker, C.M., Astrachan J.H. (1996): “Myths and Realities: Family Businesses' Contribution to the US Economy- A Framework for Assessing Family Business Statistics”, Family Business Review, Vol 9 (2), summer 1996: 107
Shum, M. (2004): “Does Advertising Overcome Brand Loyalty? Evidence from the Breakfast-Cereals Market”, Journal of Economics and Management Strategy, 13(2), 241-272
Starch, D. (1925): “Principles of Advertising”, The Journal of Political Economy, Vol. 33, No. 2 (Apr., 1925), pp. 252-253
Teal, E.J., Upton N., Seaman, S. L., (2003): “A comparative Analysis of Strategic Marketing Practices of High-Growth U.S. Family and Non-Family Firms” . Journal of Developmental Entrepreneurship, Vol. 8, No. 2 (august 2003)
Tellis, G.K. (1988): “Advertising exposure, loyalty, and brand purchase: a two-stage model of choice”, Journal of Marketing Research, 25(2): 134-144
Telser, T.G. (1968): “Some aspects on the economics of advertising”. Journal of Business, 41, 166-173
Villalonga, B., Amit, R. (2006): “How Do Family Ownership, Control, and Management Affect Firm Value?”, Journal of Financial Economics, 2006
Ward, J. L. (1997) “Growing the family business: Special challenges and best practices”, Family Business Review, 10(4), 323–337.
Ward, J. L., Aronoff C.E. (1995), “Family-Owned Businesses: A Thing of the Past or a Model for the Future?”, Family Business Review, Volume 8, Number 2, June 1995, pp. 121-130(10)
Wilcoxon, F. (1945): “Individual comparisons by ranking methods”. Biometrics 1, 80-83
Zahra, S.A., Hayton, J.C., Salvato, C. (2004): “Entrepreneurship in Family vs. Non-Family Firms A Resource-Based Analysis of the Effect of Organizational Culture”
Copyright © 2010 38
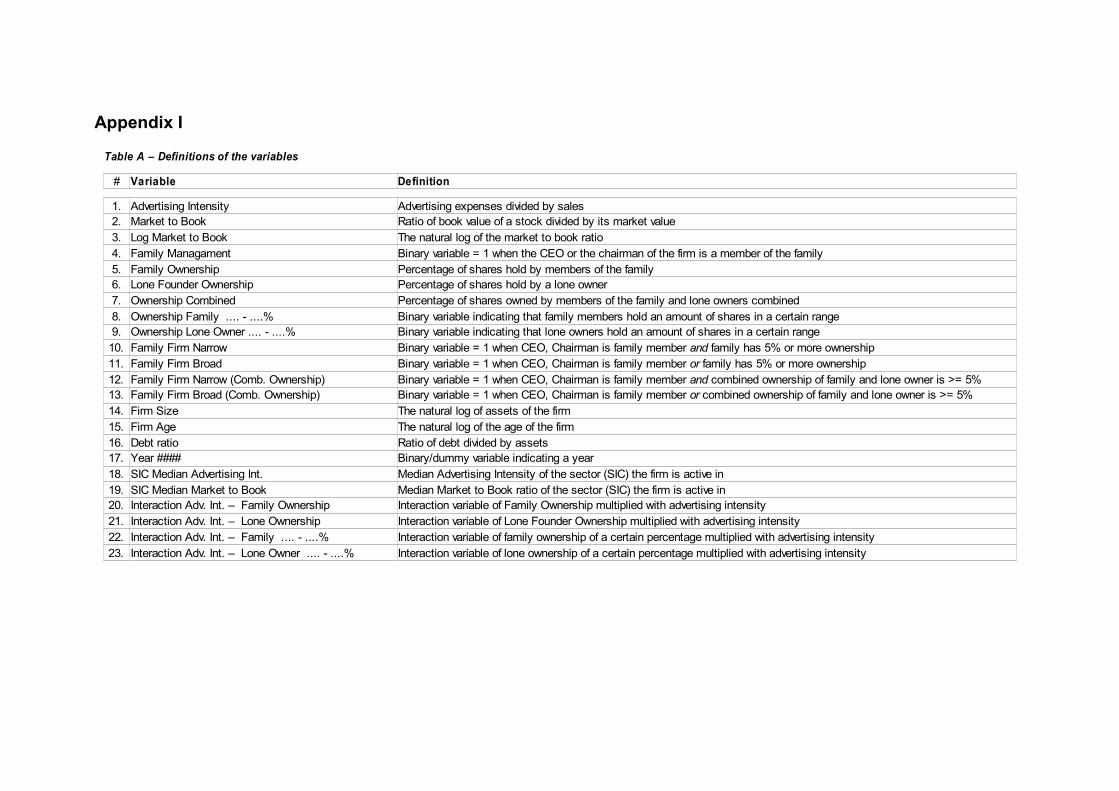
Appendix I
#
1.2.3.4.5.6.7.8.9.
10.11.12.13.14.15.16.17. Year ####18.19.20.21.22.23.
Table A – Definitions of the variables
Variable Definition
Advertising Intensity Advertising expenses divided by salesMarket to Book Ratio of book value of a stock divided by its market valueLog Market to Book The natural log of the market to book ratioFamily Managament Binary variable = 1 when the CEO or the chairman of the firm is a member of the familyFamily Ownership Percentage of shares hold by members of the familyLone Founder Ownership Percentage of shares hold by a lone ownerOwnership Combined Percentage of shares owned by members of the family and lone owners combinedOwnership Family .... - ....% Binary variable indicating that family members hold an amount of shares in a certain rangeOwnership Lone Owner .... - ....% Binary variable indicating that lone owners hold an amount of shares in a certain rangeFamily Firm Narrow Binary variable = 1 when CEO, Chairman is family member and family has 5% or more ownershipFamily Firm Broad Binary variable = 1 when CEO, Chairman is family member or family has 5% or more ownershipFamily Firm Narrow (Comb. Ownership) Binary variable = 1 when CEO, Chairman is family member and combined ownership of family and lone owner is >= 5%Family Firm Broad (Comb. Ownership) Binary variable = 1 when CEO, Chairman is family member or combined ownership of family and lone owner is >= 5%Firm Size The natural log of assets of the firmFirm Age The natural log of the age of the firmDebt ratio Ratio of debt divided by assets
Binary/dummy variable indicating a yearSIC Median Advertising Int. Median Advertising Intensity of the sector (SIC) the firm is active inSIC Median Market to Book Median Market to Book ratio of the sector (SIC) the firm is active inInteraction Adv. Int. – Family Ownership Interaction variable of Family Ownership multiplied with advertising intensityInteraction Adv. Int. – Lone Ownership Interaction variable of Lone Founder Ownership multiplied with advertising intensityInteraction Adv. Int. – Family .... - ....% Interaction variable of family ownership of a certain percentage multiplied with advertising intensityInteraction Adv. Int. – Lone Owner .... - ....% Interaction variable of lone ownership of a certain percentage multiplied with advertising intensity
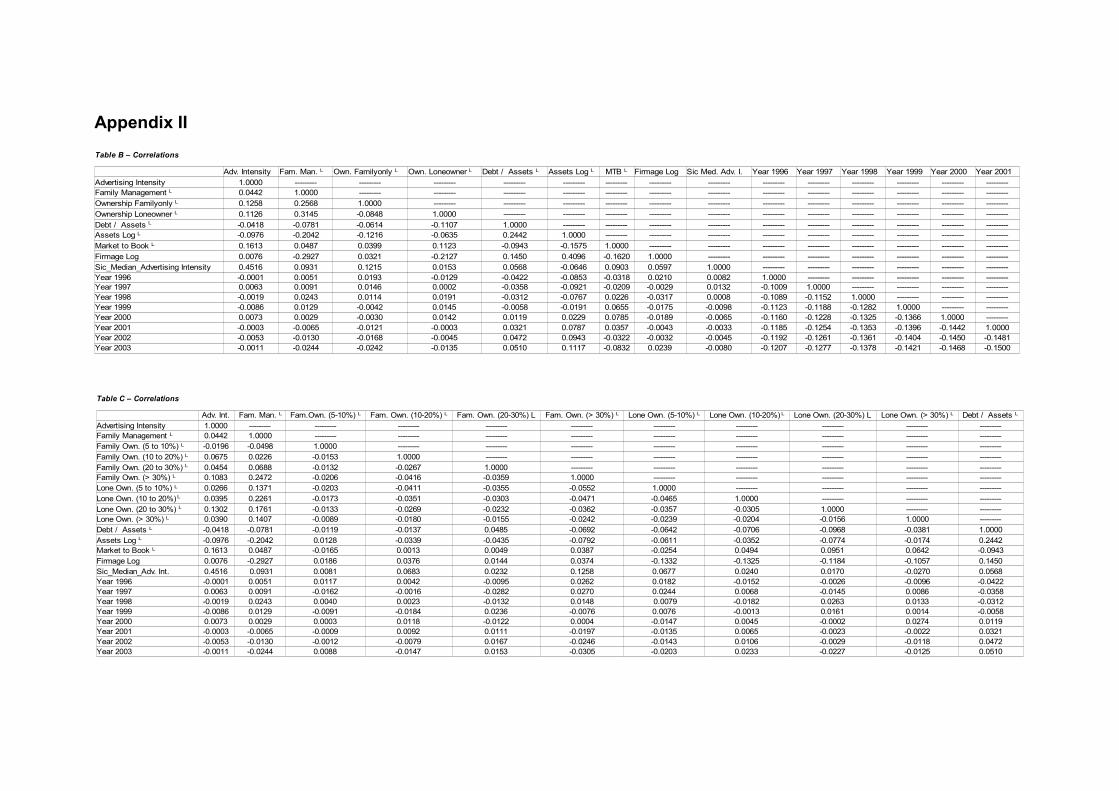
Appendix II
Year 1996 Year 1997 Year 1998 Year 1999 Year 2000 Year 20011.0000 --------- --------- --------- --------- --------- --------- --------- --------- --------- --------- --------- --------- --------- ---------0.0442 1.0000 --------- --------- --------- --------- --------- --------- --------- --------- --------- --------- --------- --------- ---------0.1258 0.2568 1.0000 --------- --------- --------- --------- --------- --------- --------- --------- --------- --------- --------- ---------0.1126 0.3145 -0.0848 1.0000 --------- --------- --------- --------- --------- --------- --------- --------- --------- --------- ----------0.0418 -0.0781 -0.0614 -0.1107 1.0000 --------- --------- --------- --------- --------- --------- --------- --------- --------- ----------0.0976 -0.2042 -0.1216 -0.0635 0.2442 1.0000 --------- --------- --------- --------- --------- --------- --------- --------- ---------0.1613 0.0487 0.0399 0.1123 -0.0943 -0.1575 1.0000 --------- --------- --------- --------- --------- --------- --------- ---------0.0076 -0.2927 0.0321 -0.2127 0.1450 0.4096 -0.1620 1.0000 --------- --------- --------- --------- --------- --------- ---------0.4516 0.0931 0.1215 0.0153 0.0568 -0.0646 0.0903 0.0597 1.0000 --------- --------- --------- --------- --------- ---------
Year 1996 -0.0001 0.0051 0.0193 -0.0129 -0.0422 -0.0853 -0.0318 0.0210 0.0082 1.0000 --------- --------- --------- --------- ---------Year 1997 0.0063 0.0091 0.0146 0.0002 -0.0358 -0.0921 -0.0209 -0.0029 0.0132 -0.1009 1.0000 --------- --------- --------- ---------Year 1998 -0.0019 0.0243 0.0114 0.0191 -0.0312 -0.0767 0.0226 -0.0317 0.0008 -0.1089 -0.1152 1.0000 --------- --------- ---------Year 1999 -0.0086 0.0129 -0.0042 0.0145 -0.0058 -0.0191 0.0655 -0.0175 -0.0098 -0.1123 -0.1188 -0.1282 1.0000 --------- ---------Year 2000 0.0073 0.0029 -0.0030 0.0142 0.0119 0.0229 0.0785 -0.0189 -0.0065 -0.1160 -0.1228 -0.1325 -0.1366 1.0000 ---------Year 2001 -0.0003 -0.0065 -0.0121 -0.0003 0.0321 0.0787 0.0357 -0.0043 -0.0033 -0.1185 -0.1254 -0.1353 -0.1396 -0.1442 1.0000Year 2002 -0.0053 -0.0130 -0.0168 -0.0045 0.0472 0.0943 -0.0322 -0.0032 -0.0045 -0.1192 -0.1261 -0.1361 -0.1404 -0.1450 -0.1481Year 2003 -0.0011 -0.0244 -0.0242 -0.0135 0.0510 0.1117 -0.0832 0.0239 -0.0080 -0.1207 -0.1277 -0.1378 -0.1421 -0.1468 -0.1500
Table B – Correlations
Adv. Intensity Fam. Man. L Own. Familyonly L Own. Loneowner L Debt / Assets L Assets Log L MTB L Firmage Log Sic Med. Adv. I.Advertising IntensityFamily Management L
Ownership Familyonly L
Ownership Loneowner L
Debt / Assets L
Assets Log L
Market to Book L
Firmage LogSic_Median_Advertising Intensity
Adv. Int.1.0000 --------- --------- --------- --------- --------- --------- --------- --------- --------- ---------0.0442 1.0000 --------- --------- --------- --------- --------- --------- --------- --------- ----------0.0196 -0.0498 1.0000 --------- --------- --------- --------- --------- --------- --------- ---------0.0675 0.0226 -0.0153 1.0000 --------- --------- --------- --------- --------- --------- ---------0.0454 0.0688 -0.0132 -0.0267 1.0000 --------- --------- --------- --------- --------- ---------0.1083 0.2472 -0.0206 -0.0416 -0.0359 1.0000 --------- --------- --------- --------- ---------0.0266 0.1371 -0.0203 -0.0411 -0.0355 -0.0552 1.0000 --------- --------- --------- ---------0.0395 0.2261 -0.0173 -0.0351 -0.0303 -0.0471 -0.0465 1.0000 --------- --------- ---------0.1302 0.1761 -0.0133 -0.0269 -0.0232 -0.0362 -0.0357 -0.0305 1.0000 --------- ---------0.0390 0.1407 -0.0089 -0.0180 -0.0155 -0.0242 -0.0239 -0.0204 -0.0156 1.0000 ----------0.0418 -0.0781 -0.0119 -0.0137 0.0485 -0.0692 -0.0642 -0.0706 -0.0968 -0.0381 1.0000-0.0976 -0.2042 0.0128 -0.0339 -0.0435 -0.0792 -0.0611 -0.0352 -0.0774 -0.0174 0.24420.1613 0.0487 -0.0165 0.0013 0.0049 0.0387 -0.0254 0.0494 0.0951 0.0642 -0.09430.0076 -0.2927 0.0186 0.0376 0.0144 0.0374 -0.1332 -0.1325 -0.1184 -0.1057 0.14500.4516 0.0931 0.0081 0.0683 0.0232 0.1258 0.0677 0.0240 0.0170 -0.0270 0.0568
Year 1996 -0.0001 0.0051 0.0117 0.0042 -0.0095 0.0262 0.0182 -0.0152 -0.0026 -0.0096 -0.0422Year 1997 0.0063 0.0091 -0.0162 -0.0016 -0.0282 0.0270 0.0244 0.0068 -0.0145 0.0086 -0.0358Year 1998 -0.0019 0.0243 0.0040 0.0023 -0.0132 0.0148 0.0079 -0.0182 0.0263 0.0133 -0.0312Year 1999 -0.0086 0.0129 -0.0091 -0.0184 0.0236 -0.0076 0.0076 -0.0013 0.0161 0.0014 -0.0058Year 2000 0.0073 0.0029 0.0003 0.0118 -0.0122 0.0004 -0.0147 0.0045 -0.0002 0.0274 0.0119Year 2001 -0.0003 -0.0065 -0.0009 0.0092 0.0111 -0.0197 -0.0135 0.0065 -0.0023 -0.0022 0.0321Year 2002 -0.0053 -0.0130 -0.0012 -0.0079 0.0167 -0.0246 -0.0143 0.0106 -0.0029 -0.0118 0.0472Year 2003 -0.0011 -0.0244 0.0088 -0.0147 0.0153 -0.0305 -0.0203 0.0233 -0.0227 -0.0125 0.0510
Table C – Correlations
Fam. Man. L Fam.Own. (5-10%) L Fam. Own. (10-20%) L Fam. Own. (20-30%) L Fam. Own. (> 30%) L Lone Own. (5-10%) L Lone Own. (10-20%) L Lone Own. (20-30%) L Lone Own. (> 30%) L Debt / Assets L
Advertising IntensityFamily Management L
Family Own. (5 to 10%) L
Family Own. (10 to 20%) L
Family Own. (20 to 30%) L
Family Own. (> 30%) L
Lone Own. (5 to 10%) L
Lone Own. (10 to 20%) L
Lone Own. (20 to 30%) L
Lone Own. (> 30%) L
Debt / Assets L
Assets Log L
Market to Book L
Firmage LogSic_Median_Adv. Int.
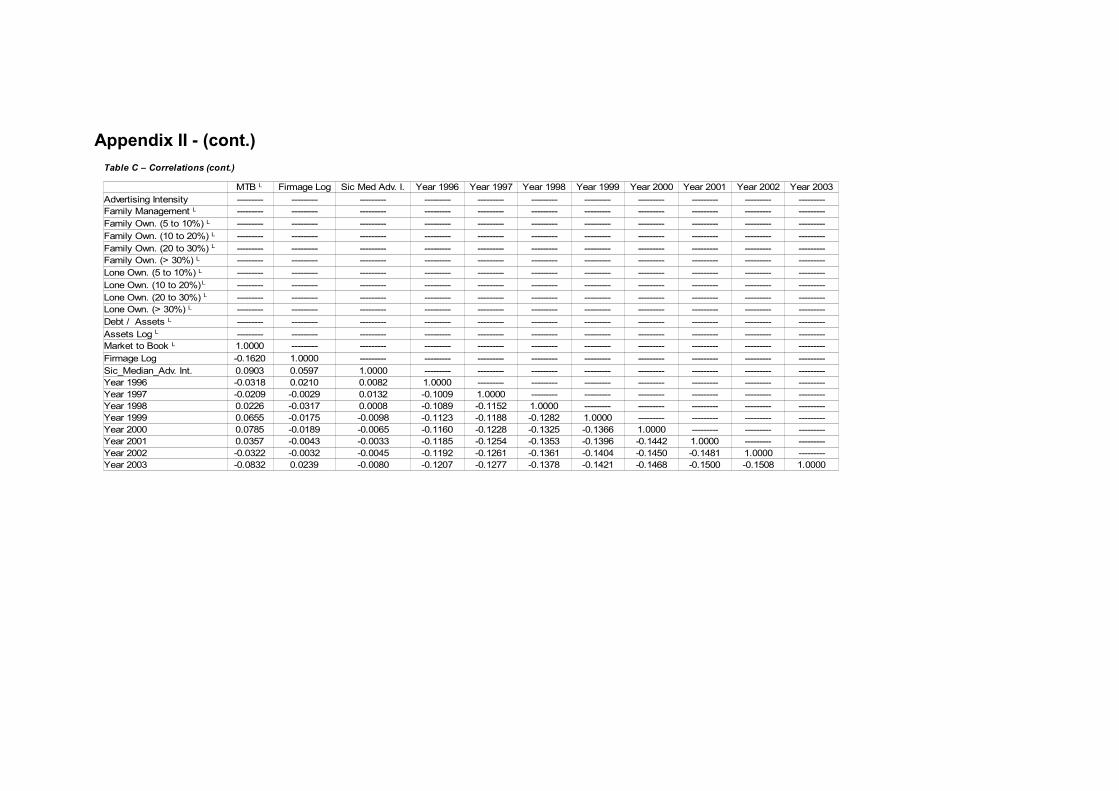
Appendix II - (cont.)
Year 1996 Year 1997 Year 1998 Year 1999 Year 2000 Year 2001 Year 2002 Year 2003--------- --------- --------- --------- --------- --------- --------- --------- --------- --------- ------------------ --------- --------- --------- --------- --------- --------- --------- --------- --------- ------------------ --------- --------- --------- --------- --------- --------- --------- --------- --------- ------------------ --------- --------- --------- --------- --------- --------- --------- --------- --------- ------------------ --------- --------- --------- --------- --------- --------- --------- --------- --------- ------------------ --------- --------- --------- --------- --------- --------- --------- --------- --------- ------------------ --------- --------- --------- --------- --------- --------- --------- --------- --------- ------------------ --------- --------- --------- --------- --------- --------- --------- --------- --------- ------------------ --------- --------- --------- --------- --------- --------- --------- --------- --------- ------------------ --------- --------- --------- --------- --------- --------- --------- --------- --------- ------------------ --------- --------- --------- --------- --------- --------- --------- --------- --------- ------------------ --------- --------- --------- --------- --------- --------- --------- --------- --------- ---------1.0000 --------- --------- --------- --------- --------- --------- --------- --------- --------- ----------0.1620 1.0000 --------- --------- --------- --------- --------- --------- --------- --------- ---------0.0903 0.0597 1.0000 --------- --------- --------- --------- --------- --------- --------- ---------
Year 1996 -0.0318 0.0210 0.0082 1.0000 --------- --------- --------- --------- --------- --------- ---------Year 1997 -0.0209 -0.0029 0.0132 -0.1009 1.0000 --------- --------- --------- --------- --------- ---------Year 1998 0.0226 -0.0317 0.0008 -0.1089 -0.1152 1.0000 --------- --------- --------- --------- ---------Year 1999 0.0655 -0.0175 -0.0098 -0.1123 -0.1188 -0.1282 1.0000 --------- --------- --------- ---------Year 2000 0.0785 -0.0189 -0.0065 -0.1160 -0.1228 -0.1325 -0.1366 1.0000 --------- --------- ---------Year 2001 0.0357 -0.0043 -0.0033 -0.1185 -0.1254 -0.1353 -0.1396 -0.1442 1.0000 --------- ---------Year 2002 -0.0322 -0.0032 -0.0045 -0.1192 -0.1261 -0.1361 -0.1404 -0.1450 -0.1481 1.0000 ---------Year 2003 -0.0832 0.0239 -0.0080 -0.1207 -0.1277 -0.1378 -0.1421 -0.1468 -0.1500 -0.1508 1.0000
Table C – Correlations (cont.)
MTB L Firmage Log Sic Med Adv. I.Advertising IntensityFamily Management L
Family Own. (5 to 10%) L
Family Own. (10 to 20%) L
Family Own. (20 to 30%) L
Family Own. (> 30%) L
Lone Own. (5 to 10%) L
Lone Own. (10 to 20%) L
Lone Own. (20 to 30%) L
Lone Own. (> 30%) L
Debt / Assets L
Assets Log L
Market to Book L
Firmage LogSic_Median_Adv. Int.
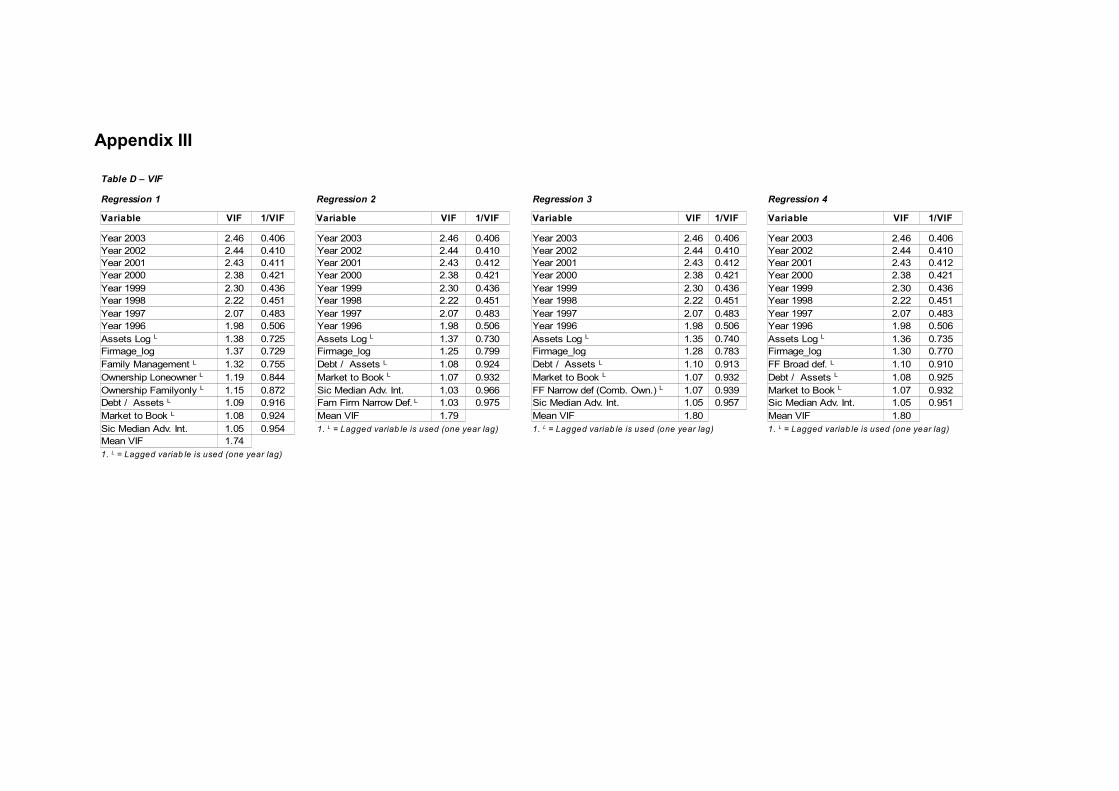
Appendix III
VIF 1/VIF VIF 1/VIF VIF 1/VIF VIF 1/VIF
Year 2003 2.46 0.406 Year 2003 2.46 0.406 Year 2003 2.46 0.406 Year 2003 2.46 0.406Year 2002 2.44 0.410 Year 2002 2.44 0.410 Year 2002 2.44 0.410 Year 2002 2.44 0.410Year 2001 2.43 0.411 Year 2001 2.43 0.412 Year 2001 2.43 0.412 Year 2001 2.43 0.412Year 2000 2.38 0.421 Year 2000 2.38 0.421 Year 2000 2.38 0.421 Year 2000 2.38 0.421Year 1999 2.30 0.436 Year 1999 2.30 0.436 Year 1999 2.30 0.436 Year 1999 2.30 0.436Year 1998 2.22 0.451 Year 1998 2.22 0.451 Year 1998 2.22 0.451 Year 1998 2.22 0.451Year 1997 2.07 0.483 Year 1997 2.07 0.483 Year 1997 2.07 0.483 Year 1997 2.07 0.483Year 1996 1.98 0.506 Year 1996 1.98 0.506 Year 1996 1.98 0.506 Year 1996 1.98 0.506
1.38 0.725 1.37 0.730 1.35 0.740 1.36 0.7351.37 0.729 1.25 0.799 1.28 0.783 1.30 0.7701.32 0.755 1.08 0.924 1.10 0.913 1.10 0.9101.19 0.844 1.07 0.932 1.07 0.932 1.08 0.9251.15 0.872 1.03 0.966 1.07 0.939 1.07 0.9321.09 0.916 1.03 0.975 1.05 0.957 1.05 0.9511.08 0.924 1.79 1.80 1.801.05 0.9541.74
Table D – VIF
Regression 1 Regression 2 Regression 3 Regression 4
Variable Variable Variable Variable
Assets Log L Assets Log L Assets Log L Assets Log L
Firmage_log Firmage_log Firmage_log Firmage_logFamily Management L Debt / Assets L Debt / Assets L FF Broad def. L Ownership Loneowner L Market to Book L Market to Book L Debt / Assets L
Ownership Familyonly L Sic Median Adv. Int. FF Narrow def (Comb. Own.) L Market to Book L
Debt / Assets L Fam Firm Narrow Def. L Sic Median Adv. Int. Sic Median Adv. Int.Market to Book L Mean VIF Mean VIF Mean VIFSic Median Adv. Int. 1. L = Lagged variab le is used (one year lag) 1. L = Lagged variab le is used (one year lag) 1. L = Lagged variab le is used (one year lag)Mean VIF1. L = Lagged variab le is used (one year lag)

Appendix III – (cont.)
VIF 1/VIF VIF 1/VIF VIF 1/VIF VIF 1/VIF
Year 2003 2.46 0.406 Year 2003 29.22 0.034 Year 2003 28.87 0.034636 Year 2003 28.89 0.035Year 2002 2.44 0.410 Year 2002 28.71 0.035 Year 2002 28.30 0.035335 Year 2002 28.32 0.035Year 2001 2.43 0.412 Year 2001 28.48 0.035 Year 2001 28.13 0.035555 Year 2001 28.14 0.036Year 2000 2.38 0.421 Year 2000 27.61 0.036 Year 2000 27.42 0.036468 Year 2000 27.44 0.036Year 1999 2.30 0.436 Year 1999 26.31 0.038 Year 1999 26.07 0.038359 Year 1999 26.08 0.038Year 1998 2.22 0.451 Year 1998 25.11 0.040 Year 1998 24.64 0.040589 Year 1998 24.65 0.041Year 1997 2.07 0.483 Year 1997 22.36 0.045 Year 1997 22.07 0.045306 Year 1997 22.08 0.045Year 1996 1.98 0.506 Year 1996 20.48 0.049 Year 1996 20.32 0.049213 Year 1996 20.33 0.049
1.37 0.730 Year 1995 17.12 0.058 Year 1995 17.03 0.058705 Year 1995 17.04 0.0591.31 0.762 1.39 0.721 1.59 0.628250 1.80 0.5541.13 0.882 1.39 0.722 1.58 0.634686 1.60 0.6261.08 0.925 1.38 0.726 1.56 0.642189 1.56 0.6411.07 0.932 1.16 0.862 1.51 0.663248 1.51 0.6631.05 0.950 1.12 0.895 1.48 0.676122 1.50 0.6681.81 1.11 0.904 1.42 0.706216 1.49 0.671
1.09 0.919 1.37 0.731650 1.49 0.6721.09 0.921 1.32 0.759294 1.45 0.6921.08 0.924 1.24 0.805710 1.44 0.6921.07 0.938 1.10 0.906668 1.41 0.7111.05 0.952 12.47 1.40 0.7151.03 0.972 1.39 0.7171.03 0.976 1.38 0.7231.00 0.995 1.37 0.728
10.49 1.37 0.7301.37 0.7321.36 0.7341.32 0.7571.26 0.7961.26 0.7961.24 0.8031.12 0.89210.49
Table D – VIF (cont.)
Regression 5 Regression 6 Regression 8 Regression 10
Variable Variable Variable Variable
Assets Log L
Firmage_log Firmage_log Interaction Adv.Int * Lone Ownership Advertising Intensity L
FF Broad def. (Comb. Own.) L Family Management L Interaction Adv.Int * Fam. Ownership Interaction Adv.Int * LO (20 to 30%)Debt / Assets L Assets Log L Advertising Intensity L Interaction Adv.Int * Fam (> 30%)Market to Book L Family Ownership (> 30%) L Lone Ownership L Lone Ownership (20 to 30%) L
Sic Median Adv. Int. Lone Ownership (10 to 20%) L Assets Log L Lone Ownership (10 to 20%) L
Mean VIF Debt / Assets L Family Ownership L Assets Log L
1. L = Lagged variab le is used (one year lag) Market to Book L Firmage Log Interaction Adv.Int * Fam (10 to 20%)Lone Ownership (20 to 30%) L Family Management L Family Ownership (> 30%) L
Lone Ownership (5 to 10%) L Sic Median MTB Interaction Adv.Int * LO (10 to 20%)Sic Median Adv. Int. Debt / Assets L Interaction Adv.Int * Fam (20 to 30%)Lone Ownership (> 30%) L Mean VIF Family Management L
Family Ownership (20 to 30%) L 1. L = Lagged variab le is used (one year lag) Family Ownership (10 to 20%) L
Family Ownership (10 to 20%) L Firmage LogFamily Ownership (5 to 10%) L Lone Ownership (> 30%) L
Mean VIF Interaction Adv.Int * LO (5 to 10%)1. L = Lagged variab le is used (one year lag) Interaction Adv.Int * LO (> 30%)
Family Ownership (20 to 30%) L
Lone Ownership (5 to 10%) L
Family Ownership (5 to 10%) L
Interaction Adv.Int * Fam (5 to 10%)Sic Median MTBDebt / Assets L
Mean VIF1. L = Lagged variab le is used (one year lag)
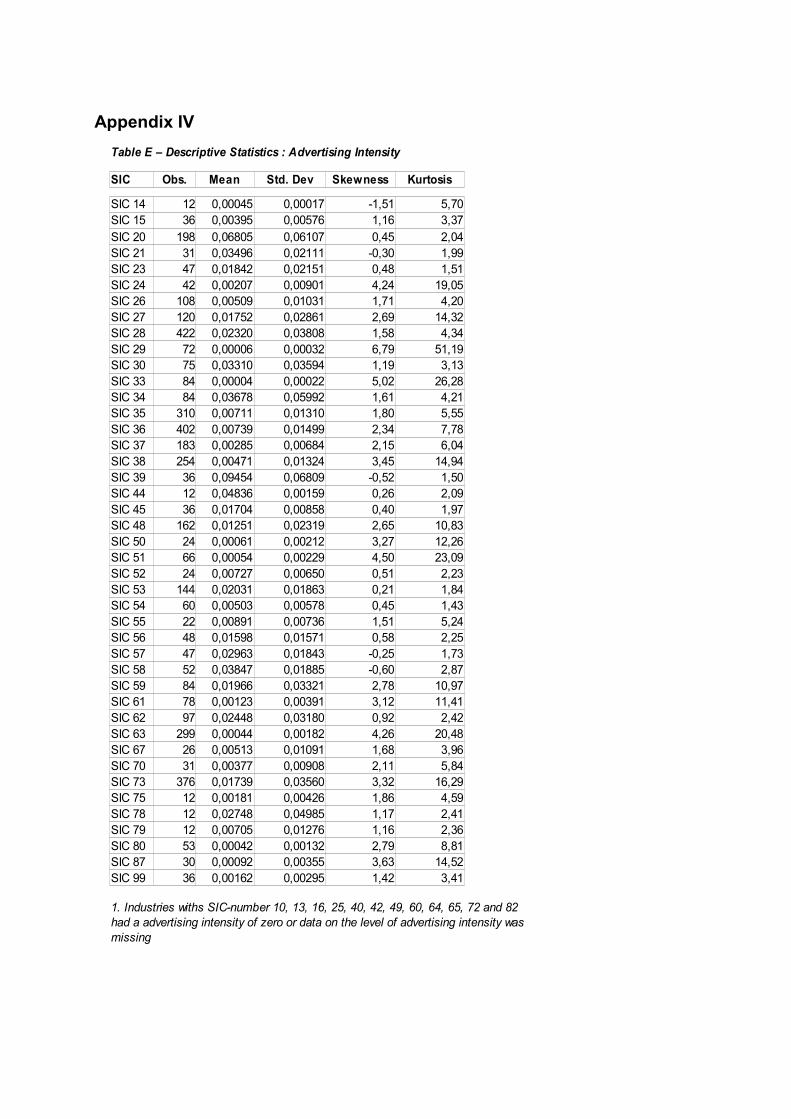
Appendix IV
SIC Obs.
SIC 14 12 0,00045 0,00017 -1,51 5,70SIC 15 36 0,00395 0,00576 1,16 3,37SIC 20 198 0,06805 0,06107 0,45 2,04SIC 21 31 0,03496 0,02111 -0,30 1,99SIC 23 47 0,01842 0,02151 0,48 1,51SIC 24 42 0,00207 0,00901 4,24 19,05SIC 26 108 0,00509 0,01031 1,71 4,20SIC 27 120 0,01752 0,02861 2,69 14,32SIC 28 422 0,02320 0,03808 1,58 4,34SIC 29 72 0,00006 0,00032 6,79 51,19SIC 30 75 0,03310 0,03594 1,19 3,13SIC 33 84 0,00004 0,00022 5,02 26,28SIC 34 84 0,03678 0,05992 1,61 4,21SIC 35 310 0,00711 0,01310 1,80 5,55SIC 36 402 0,00739 0,01499 2,34 7,78SIC 37 183 0,00285 0,00684 2,15 6,04SIC 38 254 0,00471 0,01324 3,45 14,94SIC 39 36 0,09454 0,06809 -0,52 1,50SIC 44 12 0,04836 0,00159 0,26 2,09SIC 45 36 0,01704 0,00858 0,40 1,97SIC 48 162 0,01251 0,02319 2,65 10,83SIC 50 24 0,00061 0,00212 3,27 12,26SIC 51 66 0,00054 0,00229 4,50 23,09SIC 52 24 0,00727 0,00650 0,51 2,23SIC 53 144 0,02031 0,01863 0,21 1,84SIC 54 60 0,00503 0,00578 0,45 1,43SIC 55 22 0,00891 0,00736 1,51 5,24SIC 56 48 0,01598 0,01571 0,58 2,25SIC 57 47 0,02963 0,01843 -0,25 1,73SIC 58 52 0,03847 0,01885 -0,60 2,87SIC 59 84 0,01966 0,03321 2,78 10,97SIC 61 78 0,00123 0,00391 3,12 11,41SIC 62 97 0,02448 0,03180 0,92 2,42SIC 63 299 0,00044 0,00182 4,26 20,48SIC 67 26 0,00513 0,01091 1,68 3,96SIC 70 31 0,00377 0,00908 2,11 5,84SIC 73 376 0,01739 0,03560 3,32 16,29SIC 75 12 0,00181 0,00426 1,86 4,59SIC 78 12 0,02748 0,04985 1,17 2,41SIC 79 12 0,00705 0,01276 1,16 2,36SIC 80 53 0,00042 0,00132 2,79 8,81SIC 87 30 0,00092 0,00355 3,63 14,52SIC 99 36 0,00162 0,00295 1,42 3,41
Table E – Descriptive Statistics : Advertising Intensity
Mean Std. Dev Skewness Kurtosis
1. Industries withs SIC-number 10, 13, 16, 25, 40, 42, 49, 60, 64, 65, 72 and 82 had a advertising intensity of zero or data on the level of advertising intensity was missing


