

1
AFTA and the Asian Crisis: Help or Hindrance to ASEAN
Intra-Regional Trade?
Robert J. R. Elliott** and Kengo Ikemoto*
Keywords: trade, gravity equation, ASEAN
JEL: F1, F14
**Robert J. R. Elliott is a Lecturer in Economics in the School of Economic Studies,
University of Manchester.
*Kengo Ikemoto is a former Research Student in the Institute for Development Policy
and Management, University of Manchester and now works for the Cabinet Office of
the Government of Japan.

2
AFTA and the Asian Crisis: Help or Hindrance to ASEAN
Intra-Regional Trade?
Abstract
Using a modified gravity equation, this paper examines ASEAN intra- and
extra-regional bias in bilateral trade flows and how these relationships have altered
over time. We pay particular attention to the periods before and after the signing of
AFTA as well as the crucial years prior to and following the Asian crisis. Given the
“openness” of ASEAN countries we consider not only intra-ASEAN trade but also the
effect of AFTA on non-members. We find that trade flows were not significantly
affected in the years immediately following the signing of the AFTA agreement and
also that the traditional stance of ASEAN countries to outward oriented economic
activity has not been significantly damaged but rather stimulated by the AFTA
process and/or the Asian economic crisis. We do find however, that that one effect
of the Asian economic crisis was to generate a stronger desire to source imports from
within the region.

3
1 Introduction
The recent proliferation of regional trading blocs is striking with the signing of
numerous new and overhauled preferential trade agreements (PTAs) since 1990.1
There remains however, an ongoing debate between economists and politicians as to
whether regional trade agreements (RTAs) represent “building” or “stumbling” blocks
(Bhagwati 1991). The welcome for the opportunities this new wave of regionalism
is supposed to bring is not therefore, all encompassing with some fearing that regional
economic integration corrupts and undermines progress towards global free trade
expounded by the General Agreement on Tariffs and Trade (GATT) and more recently
the World Trade Organisation (WTO). Others however, are more positive (see e.g.
Summers 1991, Lawrence 1991, Ethier 1998, IDS 1999 and the World Bank 1999)
and see any trade liberalisation as good whatever its source and PTA’s as a second
best means of achieving trade liberalisation when multilateral negotiations stall.2
Closer European integration and a number of regional initiatives from the United
States transformed the global economic climate in the late 1980’s and meant that it
was increasingly important for smaller developing and newly industrialised countries
to generate closer regional economic ties. One of the more influential regional
1 A PTA is an agreement between two countries where the tariff imposed between them is lower than that on goods from countries outside the agreement. PTAs include regional trade agreements between countries within a given geographical area and free trade agreements that have no tariffs between member countries but individual tariff structures with non-members. 2 In addition to existing agreements such as the European Union (EU) and the European Free Trade Association (EFTA) other new or rejuvenated regional trade agreements include the Common Market of the South (MERCOSUR, 1991), the North American Free Trade Association (NAFTA, 1994), the ADEAN Pact (ANDEAN), and the Central American Common Market (CACM) in the Americas. In Africa the 1990’s saw the creation of the Union Duaniere et Economique de l’Afrique Central (UDEAC), the Common Market for Eastern and Southern African States (COMESA) and the Union Economique et Monetaire Quest-Africaine (UEMOA). According to the WTO (2001) all WTO members have taken part in at least one episode of regional integration.
4
developments was in the Southeast Asian region where members of the Association of
Southeast Asian Nations (ASEAN) agreed in 1992 to establish the ASEAN Free Trade
Area (AFTA) that currently has a membership of ten countries and a population of
over 500 million. Moreover, the recent emergence of China as an economic power
in the region following its membership of the WTO has led to a renewed vigour
among ASEAN nations to pursue the goal of regional cooperation.
Broadly speaking, the last thirty years has seen a robust economic performance from
ASEAN countries. One reason for this apparent success was that the engine of
growth was primarily extra-regional rather than intra-regional trade and questions
therefore, the need for a Southeast Asian regional grouping. Krugman (1991)
introduced the notion of a “natural trading block” based on geographical proximity
that could be both efficient and welfare increasing. He also noted however, that an
RTA based on being a member of a political club could induce regional bias to trade
patterns that can be welfare reducing if trade diversion is greater than trade creation.
This raises the question of whether AFTA has any real economic rationality over its
mere political and symbolic meaning.
The primary objective of this paper therefore, is to investigate the effect of AFTA and
the “anticipation” effect of AFTA on intra- and extra-regional trade flows by a
comparison of trade patterns before and after the start of the AFTA process. Given
the “openness” of ASEAN countries it is important to consider not only intra-ASEAN
trade but also the effect of AFTA on non-members trade. By doing so we hope to be
able to reveal whether AFTA; (i) increases trade among members (ii) harms
5
non-member countries and (iii) contributes to or undermines future liberalisation
negotiations.
Any post-1992 AFTA analysis is however, further complicated by the ramifications of
the Asian economic crisis that began with a massive speculative attack on the Thai
baht May 14-15, 1997. The years following the crisis saw ASEAN members suffer
significant structural and financial difficulties (including reduced aggregate growth
and job losses) associated with large currency depreciations and capital outflows.
Relatively few studies examine the period during and after the Asian crisis even
though the affects on the economies of the region were often profound (Clarete et al.
2002 is one exception). For example, according to World Bank data, Indonesia
moved from a GDP growth rate of 4.9% in 1997 and a financial account surplus of
10.8 (US$ billion) in 1996 to a GDP growth rate of -13.7% and a financial account
deficit of –10.3 (US$ billion) in 1998. Likewise, Thailand moved from a positive
growth rate of 5.5% in 1996 to –10.2% in 1998 and a change from a financial account
surplus of 19.5 (US$ billion) in 1996 to deficits of –16.9 and –14.6 (US$ billions) in
1998 and 1999 respectively.
In this paper we are interested in whether ASEAN countries attempted to solve their
problems with the help of newly strengthened intra-ASEAN relations and whether the
result of the crisis was to significantly change the structure of imports and exports and
result in the collapse of long-standing trade relationships. As a consequence, we
address whether the aims of AFTA to increase intra-regional trade and cooperation
were helped or hindered by the Asian crisis.
6
The existing empirical literature suggests two main approaches for measuring the
economic impact of PTAs. Partial or general equilibrium models provide an ex ante
approach that includes computable general equilibrium models to empirically predict
the impact of AFTA on the economy and constituent trade flows (see e.g. Imada et al.
1991, Adams and Park 1995 and DeRosa 1995). The second approach focuses on ex
post investigations of bilateral trade values using the so-called gravity equation.
Simple examples of the application of a gravity type approach to intra-regional trade
bias of selected regional groupings (one being ASEAN) include Hamilton and
Winters (1992), Frankel (1993) and Sharma and Chua (2000) while Elbadawi (1997),
Frankel and Wei (1998), Endoh (1999, 2000) and Soloaga and Winters (2001) present
useful extensions of the basic model.
The core methodology in this paper is based upon Endoh (2000) and Soloaga and
Winters (2001) but the analysis concentrates on ASEAN intra- and extra-regional bias
in bilateral trade flows and how these trade relationships have altered over time
paying particular attention to the periods before and after the signing of AFTA as well
as the crucial years prior to and following the Asian crisis.
The paper is organized as follows. Section 2 provides some historical background to
regional cooperation in the Southeast Asian region. Section 3 describes the
methodology and estimates a modified gravity equation while Section 4 discusses the
results and Section 5 concludes.

7
2. Historical Overview
Attempts at organised regional co-operation between South-East Asian countries dates
back to August 1967 when the ASEAN was established with original members
Indonesia, Malaysia, the Philippines, Singapore and Thailand.3
As ASEAN’s initial concerns were issues of political security it was not until the
1970’s that they tried to promote greater intra-regional trade and co-ordinate
industrialisation policies (based on proposals made by the United Nations sponsored
studies which called for regional import substitution, Park 1999).4 In 1977 a PTA
was established specifically to encourage greater intra-regional trade. The consensus
from existing studies however, suggests that this initiative was disappointing (see e.g.
Ariff 1994 and Garnaut and Drysdale 1994). Tan (1992) attributed this
disappointment to several elements including the limited coverage of the PTA, an
intra-regional trade structure that was competitive rather than complementary, and the
diminishing urgency of pursuing the task because of the continued growth and
development of the region.
What transformed the half-hearted attitude to co-operation were the changes in the
global competitive environment during the late 1980’s and 1990’s. As indicated by 3 Expansions to the membership of ASEAN were Brunei in 1984, Vietnam in 1995, Myanmar and Laos in 1997 and Cambodia in 1999 and were attempts to include the perceived “natural” trading partners of existing members. A number of other regional initiatives involving countries from this part of the world exist including the South Asian Association for Regional Cooperation (SAARC), the SAARC PTA (SAPTA), Austrialia and New Zealand’s Closer Economic Relations Agreement (CER) and the South Pacific Regional Trade and Economic Cooperation Agreement (SPARTECA). See the Asian Development Outlook 2002 for an overview. 4 Within the institutional framework of ASEAN, heads of states meet annually to ensure strong regional communication and cooperation at both the technical and political level. Anwar (1994) and Pomfret (1996) both suggest ASEAN lessened military tension and contributed to political stability in the area.

8
Menon (1996) and others, the formation of NAFTA and the EU raised questions about
the access of ASEAN exports to the markets of North America and Europe.
Furthermore, the competition to attract foreign direct investment (FDI) was
intensifying and in recent years includes the emergence of China as a global economic
power and location for Western FDI.5
In response, the founder ASEAN countries agreed to establish an ASEAN free trade
area by the year 2008. This target has been continuously moved forward and AFTA
was officially established among the original six countries at the beginning of 2002
(ASEAN Secretariat 2002).6 Although AFTA involves several measures to enhance
regional trade such as the elimination of non-tariff barriers, the main mechanism for
achieving AFTA has been the Common Effective Preferential Tariff (CEPT). As
Pangestu et al. (1992) indicate, the approach of the CEPT is essentially reciprocal and
sectoral, which makes it more encompassing and less cumbersome than the
product-by-product approach of PTAs (Athukorala and Menon, 1997). This regime
was applied to all products from ASEAN member countries defined as those that had
at least 40% ASEAN content (ASEAN Secretariat, 1995).7
5 ASEAN secretary general Rodolfo Sererino has recently commented that the Southeast Asian region should “integrate the regional economy to a closer degree to the integration of the Chinese market”. The first round of high-level talks aimed at establishing a FTA between ASEAN and China started in May 2002. When implemented the worlds largest FTA will generate estimated trade worth $1.2 trillion. 6 Under an amended plan in 1995, the reduction of existing tariff rates to 20% was to be effective within a time frame of five to eight years from 1st January 1993 and are to be cut further to 0-5% by 2003. In 1998 the ASEAN governments agreed that the original six countries would aim to reduce tariffs to under 5% by 2002. Around 95% of intra-ASEAN trade tariffs representing 90% of intra-ASEAN trade is now in the 0-5% tariff range with the average tariff now 3.2%. 7 Appendix A provides details and indicates how this schedule is flexibly managed depending on the preferences of different countries over a range of sectors.

9
These characteristics of AFTA and the earlier less effective experience of regional
integration might lead one to question the feasibility of a substantial expansion of
regional trade. It must also be remembered that ASEAN countries have achieved
significant economic growth and development based on independent outward- looking
policies. OECD (1993) argues, therefore, that AFTA might not be a serious regional
economic initiative but at best a hedge against other regional integration initiatives or
a temporary failure of multilateral negotiations under the GATT-WTO regime. It
may be conjectured however, that the shock and upheaval caused by the Asian crisis
provided ASEAN countries with renewed enthusiasm for maintaining and
strengthening regional links and to increase intra-regional trade to counter economic
uncertainty in the region and the rise of regional blocs elsewhere.
3 Methodology: A Modified Gravity Model Approach
The gravity equation has experienced something of a revival in recent years and
provides a natural framework and a useful multivariate approach for assessing the
impact of regional trading blocs on the level and direction of bilateral trade flows. In
addition to its continued success at predicting bilateral trade patterns it has seen
renewed interest from the new economic geography literature as well as increased
confidence in its traditionally weak theoretical foundations arising primarily from the
so-called “new trade” theory. 8 Indeed, Elbadawi (1997) argues that the successful
outcome of the gravity equation may stem from its ability to capture factors that
conventional factor endowment theory cannot easily accommodate such as 8 See Evenett and Keller (2002) for a discussion of theories that explain the gravity equation’s success. The underlying theory can be found in Deardorff (1984) and Helpman and Krugman (1985). See Anderson (1979), Bergstrand (1985) and Sanso et al. (1993) for further discussion.

10
intra- industry trade (by considering, for example, economic size and scale economies)
and the dramatic reallocation of resources following trade liberalisation (by
introducing dummy variables).9
An example of a gravity equation where trade is positively related to two countries
incomes and negatively related to the distance between them (reflected by transport
costs) takes the following form (in natural logarithms);10
ijijjijiij uDNNYYM loglogloglogloglogloglog 543220 ++++++= αααααα
(1)
where Mij is the imports from country i to j, Y is income, N is population, Dij is the
distance between economies i and j and uij is the log normally distributed error term
where E(log uij)=0. Assuming no PTAs, equation (1) explains trade between
countries i and j and behaves as a counterfactual.
In this paper we modify the basic gravity equation where our estimating equation in
natural logs (with expected signs in brackets) is shown in equation (2).11
9 Previous developments included the addition of a population variable to reflect the role of scale economies (e.g. Linnemann 1966), a dummy variable to represent the existence of preferential trade arrangements (e.g. Aitken 1973), the difference of per capita income and the absolute income level as variables to capture the so-called Linder Hypothesis and differences in factor endowments respectively (see e.g. Elbadawi 1997 and others). Linder (1961) argued countries with similar income level have incentives to trade with each other. In addition to distance and adjacency variables, recent studies also include a geographical measure of “remoteness” although our concentration on the ASEAN region makes its inclusion unnecessary. 10 This is a variation on the original Tinbergen (1962) and Pöylönen (1963) specifications. 11 All regressions are estimated using OLS in TSP. Estimations using a Tobit model (to account for the fact that trade values are bounded from below at zero) resulted in very similar results. See Soloaga and Winters (2001) for a discussion.
11
( ) ( ) ( ) ( ) ( )
( ) ( )
) -or( ) -or (
log
) -or ( )( )( ) -or ( (-)
loglog
)( )( )( )(
loglogloglogloglog
1110
98765
43210
++
+++
++++
+++−++
++++
++++=
∑∑
∑
ijijkkijkk
ijkkijijjiij
jijiij
uexRTAimRTA
RTAADJCOMPGDPPGDPD
PGDPPGDPGDPGDPM
ββ
βββββ
βββββ
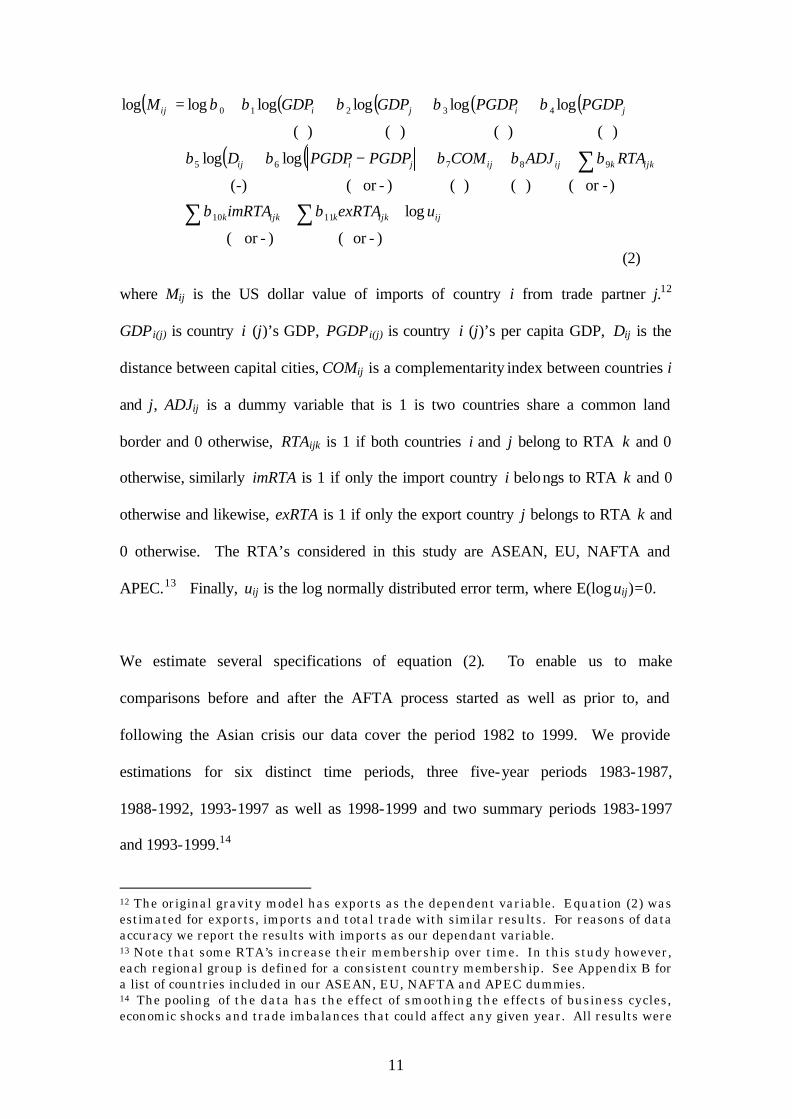
(2)
where Mij is the US dollar value of imports of country i from trade partner j.12
GDPi(j) is country i (j)’s GDP, PGDPi(j) is country i (j)’s per capita GDP, Dij is the
distance between capital cities, COMij is a complementarity index between countries i
and j, ADJij is a dummy variable that is 1 is two countries share a common land
border and 0 otherwise, RTAijk is 1 if both countries i and j belong to RTA k and 0
otherwise, similarly imRTA is 1 if only the import country i belongs to RTA k and 0
otherwise and likewise, exRTA is 1 if only the export country j belongs to RTA k and
0 otherwise. The RTA’s considered in this study are ASEAN, EU, NAFTA and
APEC.13 Finally, uij is the log normally distributed error term, where E(log uij)=0.
We estimate several specifications of equation (2). To enable us to make
comparisons before and after the AFTA process started as well as prior to, and
following the Asian crisis our data cover the period 1982 to 1999. We provide
estimations for six distinct time periods, three five-year periods 1983-1987,
1988-1992, 1993-1997 as well as 1998-1999 and two summary periods 1983-1997
and 1993-1999.14
12 The original gravity model has exports as the dependent variable. Equation (2) was estimated for exports, imports and total trade with similar results. For reasons of data accuracy we report the results with imports as our dependant variable. 13 Note that some RTA’s increase their membership over time. In this study however, each regional group is defined for a consistent country membership. See Appendix B for a list of countries included in our ASEAN, EU, NAFTA and APEC dummies. 14 The pooling of the data has the effect of smoothing the effects of business cycles, economic shocks and trade imbalances that could affect any given year. All results were

12
There are two excluded variables that require further discussion. The first is the real
exchange rate. If our regressions were simple yearly cross sections then real
exchange rates are not relevant as it is not possible to tell whether a currency is over
or undervalued. With pooled data however, competitiveness via the real exchange
rates matters. If we are to take account of the effect of the Asian crisis on trade
relationships it would seem appropriate to have a measure that can pick up the effect
of changes in the real exchange rates over the period of study. In this paper we
experimented with a number of real exchange rate variables although the existing
gravity literature provides limited guidance. Our approach was to include a single
variable where country i’s real exchange rate relative to country j was defined as
country i’s local currency value of one unit of country j’s currency multiplied by j’s
GDP deflator and divided by country i’s GDP deflator where i is the importer and j is
the exporter country. See Appendix C for a graphical representation. This is
similar to Soloaga and Winters (2001) who include two variables, one for each
country where country i(j)’s real exchange rate was defined as the local currency
value of one US$ multiplied by the US GDP deflator and divided by country i(j)’s
GDP deflator. In both cases the means over our periods are set to zero so that
movements relative to the mean reflect real exchange rate effects. The inclusion of
our variable made little difference to overall results while the Soloago and Winters
(2001) results were often inconsistent. The mixed evidence from previous studies
makes the results using real exchange rates questionable and are thus, not reported in
this paper.15 The other variable that is usually included in gravity equations is a
re-estimated using 1993-1996 instead of 1993-1997 but no discernible differences were observed. 15 Results of equation (2) including our exchange rate variables are available from the author upon request.

13
common language dummy but as we are primarily interested in a group of countries
that all have their own distinct language the results are not reported.
The structure of equation (2) differs from the standard gravity model in two main
ways. First, we include an index of complementarity. One of the characteristics of
the basic gravity equation is that it does not explicitly include a factor endowment
variable as, although income level differences reflect factor endowment differences,
they may also explain product differentiation or demand dissimilarity (see e.g.
Deardorff 1984 and Frankel 1997). A complementarity index (COMij) based on
Drysdale (1967) is included to directly capture factor endowment differences and is
given by;
( )( )[ ]( ){ }∑ −−= jkj
ki
kwiwi
kiij MMMMMMXXCOM
where kiX is country i’s exports (of commodity k), k
jM is country j’s imports (of
commodity k) and kwM is world imports (of commodity k). COMij is able to
separate the impact of the commodity composition from other factors that drive trade
flows and represents the extent of the fit between the structure of exports and imports
of bilateral trade partners based on the assumption that traded commodities reflect

14
factor endowments.16 The index is calculated at the three-digit level of the Standard
Internationa l Trade Classifications (SITC).17
A second methodological issue concerns the definition and measurement of trade
creation and trade diversion where a gravity approach is seen as a more elaborate
method of measurement (Hine 1994).18 Aitken (1973) was one of the first studies to
attempt to capture trade creation and trade diversion by the inclusion of a regional
dummy with additional calculations for the counterfactual residual to capture the trade
diversion and the net trade creation in a Vinerian sense. Elbadawi (1997), Bayoumi
and Eichengreen (1997), Frankel (1997), Frankel and Wei (1998) introduced a second
dummy to show the regional integration effect on the trade with non-members as well
as an intra-bloc dummy. The first two studies, however, do not separate the
diversionary effect of imports and exports, while Frankel and Wei (1998) ignore the
possible effect of regional integration on exports to non-members (Soloaga and
16 Drysdale (1967) attempted to explain the causes of bi lateral trade by dividing trade intensity (I) into complementarity (C) and bias (B) where I = C × B. Complementarity is a product of comparative advantage if we assume that import and export patterns reflect their resource endowment and represents the extent to which economies resources and production structures are complementary while bias is what remains after accounting for complementarity and includes geographical, social, historical, cultural and institutional ties. 17 A number of studies argue that the three-digit SITC level captures commodities that are produced using a similar technology and factors (see e.g. Greenaway and Milner 1986, and Menon 1996). 18 Viner (1950) first referred to trade creation and trade diversion in the context of the welfare effects of trade barriers. Early approaches however, tended to compare actual import value data for a post regional integration period with counterfactual import values estimated by using only pre-integration data. For example, Truman (1969) assumed the pre-integration shares of imports in apparent consumption to be unchanged, whilst Balassa (1967, 1974, 1975) assumed that the pre-integration import elasticity would have continued in the post -integration period. Truman interpreted the increase in import share, compared to the antimode to mean trade creation and the decrease in the rest of the world share to mean trade diversion, while Balassa argued that increased intra-elasticity was gross trade creation, increased elasticity from all sources was trade creation and decreased elasticity from non-area sources was trade diversion. Kruger (1999) examined NAFTA’s trade creation and trade diversion effects using industry level data. Other approaches include Verdoorn and Schwartz (1972) who incorporated relative prices into the model and Prewo (1974) who combined input-output tables and the gravity model as a general equilibrium approach

15
Winters, 2001). We follow Endoh (1999, 2000) and pursue the relatively new
approach of employing three dummies per region.19
Including dummies for what we define as “import trade diversion” and “export trade
diversion” enables us to tell whether an increase in an institutional dummy is due to
an increase in intra-regional trade, a decrease in trade between members and
non-members, or both. In our estimates “RTA” captures the total intra-regional
trade bias or trade creation defined in a Johnson (1962) sense. The dummy “imRTA”
captures the extra-regional import bias of intra-RTA trade or the import trade
diversion as a result of changes to the import structure of the RTA where a negative
and significant coefficient indicates that member countries have switched to importing
from members rather than non-members. Finally, “exRTA” captures the
extra-regional export bias of the RTA to the rest of the world or the export trade
diversion where a negative and significant coefficient means that the RTA has
resulted in a member country preferring to export to members rather than
non-members.20
In the first instance, as a method of explaining the world’s bilateral trade patterns, we
estimate a relatively simple gravity equation with a single intra-regional bias dummy
19 We acknowledge however, that in Viners original welfare context we cannot make unambiguous conclusions about the degrees of trade creation and trade diversion without knowing exact tariff structures and relative price changes (World Bank 1999). Soloaga and Winters (2001) also include three dummy variables but differ in their interpretation of trade creation and trade diversion. 20 The term export trade diversion was first used by Endoh (1999) and differs from definitions of trade diversion given by Balassa (1967), Johnson (1962) and Viner (1950). Elbadawi (1997) and Endoh (1999) state that whether a RTA is trade creating or diverting depends on the sign of the RTA dummies and not their movements over time. The size of the coefficient however, can be affected by the country sample size. As a consequence, it is more appropriate to pay attention to changes in the coefficient through the RTA formation period rather than the level itself.

16
for four PTA’s (ASEAN, APEC, NAFTA and the EU).21 Second, we investigate the
degree of the trade creation and trade diversion as a result of AFTA by incorporating
our two additional dummies, imRTA and exRTA. The degree of trade creation and
trade diversion for each RTA is extracted from the movement of the coefficients on
the three dummy variables. Finally, we estimate equation (2) for the intra-ASEAN
trade only to better understand the intra-regional trade flows for the same five yearly
periods.
4 Results
Table 1 presents the results for the simple gravity equation. Regional dummy
variables are included all together and then separately and jointly for the case of
ASEAN and APEC. The signs of the coefficients on the variables in the first half of
Table 1 are as expected and are generally highly significant. The coefficient on GDP
for example, is generally between 0.7 and 0.8 suggesting that trade increases as
economic capacity grows.22 We also find the traditional negative sign on distance
and positive sign on our common border variable. The complementarity index also
records a positive and significant coefficient and seems to support the hypothesis that
trade is greater when two countries endowments (reflected in the structure of the
commodities traded) are complementary. Only per capita GDP differences records a
decline in significance (and even changes sign) over time. One possible explanation
21 Ideally we would have liked to include all possible RTA’s to avoid bias in the results. By including the main groupings in terms of trade volumes however, the bias is likely to be minimal. See Endoh (1999) for further discussion. 22 Frankel (1993) notes that a coefficient of less than one reflects the phenomenon that the smaller the country the greater the trade/production ratio.
17
is the Linder hypothesis that emphasises income similarity as the driver of trade
instead of income differences.
The intra-regional dummies for regressions (1) and (2) are positive for ASEAN and
APEC implying that countries located within these regions do trade more with each
other over and above the levels predicted by the basic explanatory variables. In
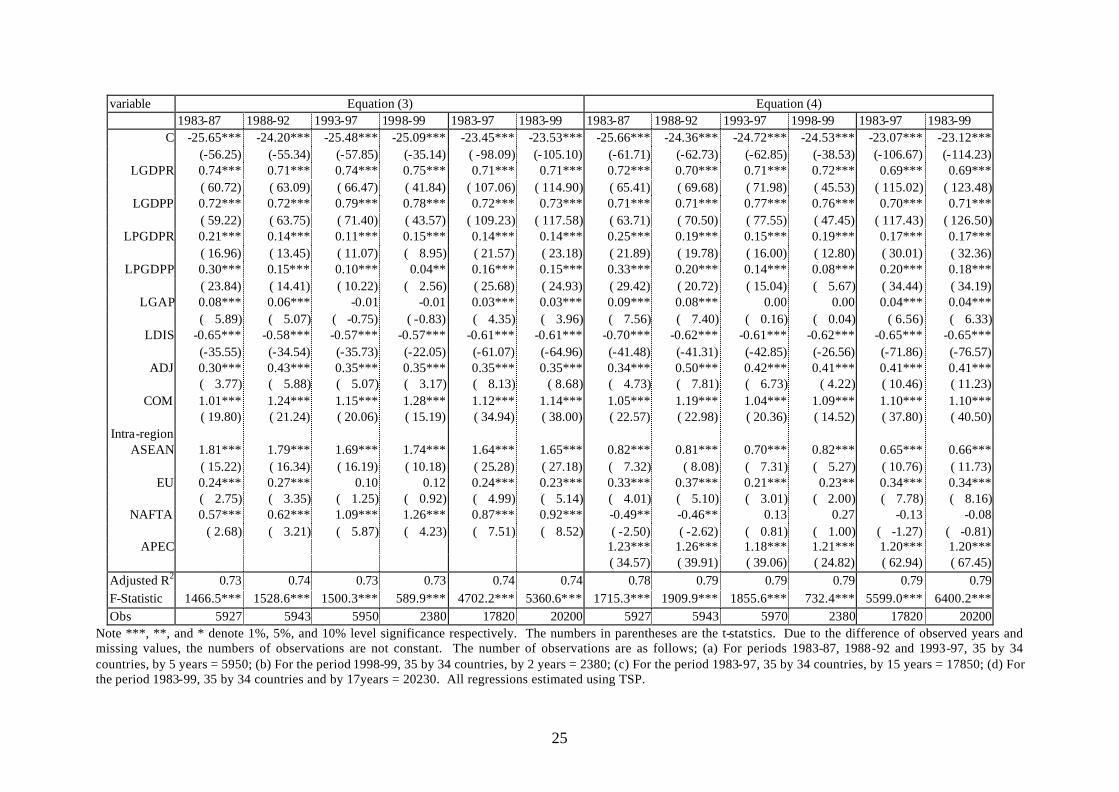
regression (3) we observe that the EU and NAFTA dummies are also generally
positive and significant.23 The inclusion of all four regional groupings in regression
(4) reveals however, that the NAFTA coefficient was negative and significant for the
first two periods (prior to the setting up of NAFTA) before becoming positive. Our
results, showing a positive and significant ASEAN effect, differ from a number of
previous studies such as Sharma and Chua (2000) and Soloaga and Winters (2001)
who both observe a negative relationship albeit for a different estimating equation and
country coverage but are similar to Frankel et al. (1995) and Endoh (2000) who
recorded positive and significant coefficients for APEC. Note that the ASEAN
coefficient falls between 1993-1997 after the AFTA process started and it was not
until after the Asian economic crisis that the trend reverted to an upward one. One
possible suggestion is that it took a regional economic shock of the form of the
currency crisis to trigger the latent forces of ASEAN regional integration that could
not be stimulated by mere political rhetoric.
Observe that when we include both ASEAN and APEC dummies the ASEAN
coefficient is significantly lower. This is consistent with Frankel (1993) who
23 Previous studies have included a variety of European regional dummies that have generally been found to be insignificant. The results tend to differ depending on the country coverage and method of estimation. When we included EU12 or EU15 dummies the variable was also insignificant.

18
observed that in 1980 and 1990 the ASEAN dummy was only significant when no
other Asian bloc dummies were included and concluded that ASEAN did not seem to
be an appropriate bloc around which to draw a border.
This leads us to enquire whether the AFTA process has been trade creating or trade
diverting and whether ASEAN is a discriminating bloc or exhibits “open
regionalism”.24 The lack of a consistent upward trend in the ASEAN dummy over
our period of analysis deserves closer examination. In Table 2 we include our two
additional dummies to represent the case where only the import or export country is a
member of the RTA. As previously discussed, AFTA is trade creating if the
ASEAN coefficient increases and that of the others do not change after the AFTA
process started and the AFTA is trade diverting in two cases; (i) ASEAN member’s
welfare is reduced if the ASEAN coefficient increases and that of imASEAN
decreases, (ii) non-member’s welfare is reduced if the ASEAN coefficient increases
and that of exASEAN decreases.
In Table 2 the three regional dummies are generally significant and justifies their
inclusion. A comparison of the RTA coefficients with Table 1 demonstrates that the
largest differences are for the ASEAN dummy (the EU and NAFTA coefficients
remain relatively stable).
Concentrating on ASEAN, observe that ASEAN, imASEAN and exASEAN all record
positive and significant coefficients with the former the largest in all periods. The
fact that all three dummies are positive and significant means that members and
24 For a discussion of the concept of “open regionalism” see Bergsten (1997) and Yamazowa (1992).

19
non-members have traded with each other more than the hypothetical trade level.
Examining coefficient changes over time we observe again that ASEAN falls between
1993 and 1997 and then rises while imASEAN increases until 1997 (despite the
ongoing AFTA process) and then decreases while exASEAN demonstrates a consistent
rise (with a significant jump after the crisis). Considered jointly, the imASEAN and
exASEAN coefficients reveal the extent of the extra-ASEAN trade bias over the
period. The generally increasing trend means that there has been a negative trade
diversion effect. More specifically, the upward trend in exASEAN indicates that
negative export trade diversion has been strengthening and means that the volume of
trade between members and non-members has been increasing (and not falling as
would be the case with trade diversion and welfare losses to non-members). The
slight fall in imASEAN after 1997 does reveal a weakening of the negative import
trade diversion effect as ASEAN members begin to prefer to import goods from
members rather than non-members but the effect is only small against a large increase
in intra-regional trade in general. These results seem to suggest that ASEAN
countries retained their openness and outward orientation despite AFTA and the Asian
economic crisis.
One explanation for the lack of any export diversionary effect and the slight
weakening of the negative import diversion effect after 1997 is that ASEAN countries
may have increased their exports to the rest of the world due to changes in their real
exchange rates (as exASEAN rose sharply after 1997 in Table 2). The devaluation of
ASEAN currencies during the Asian crisis should have contributed to an increase in
the competitiveness of their products with the rest of the world (as exports and

20
imports became less and more expensive respectively).25 Appendix C illustrates the
real exchange rate of ASEAN countries and demonstrates the simultaneous
depreciation of ASEAN currencies relative to non-member countries and the relative
stability of intra-ASEAN rates after 1997 that may explain some of the trend. The
inclusion of a real exchange rate variable made little difference to the results however
(see Section 3 for a discussion).
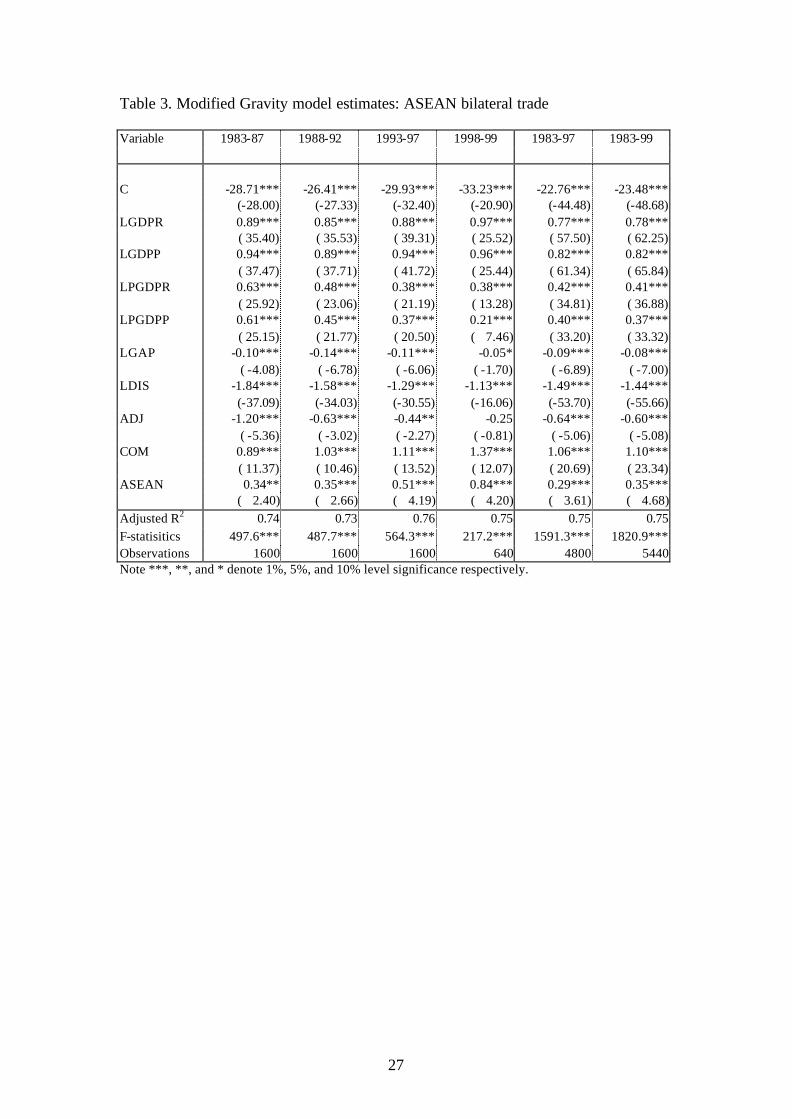
Finally, in Table 3 we investigate the nature of the AFTA process on ASEAN bilateral
trade. The observations of basic gravity variables in Table 3 are broadly in line with
the results in Table 1 although two related findings are worth mentioning. First the
ASEAN coefficient increases constantly over time especially after the AFTA
formation period. This suggests that the AFTA process may have had some effect
on intra-regional trade ever since its inception that has accelerated since the Asian
crisis. Second, there is little difference in the coefficients on the GDP variables
between the pre- and the post crisis period while the ASEAN coefficient rose. This
supports the argument that even accounting for the upheavals of the Asian crisis there
are no dramatic changes in the way other economic factors determine intra-ASEAN
trade flows.
5 Discussion
Using a modified gravity equation, this paper investigates the effect of AFTA on
world and regional trade patterns. Our first main finding is that trade flows were not
25 This competitive effect is partly offset by the increase in the prices of intermediate products and inputs in the manufacturing process.

21
significantly affected in the years immediately following the signing of the AFTA
agreement in 1993 and reinforces the findings of previous studies. Indeed, the
degree of trade creation was lower than the preceding period 1988-1992. When the
gravity equation was re-estimated for intra-ASEAN trade only however, we did find
some evidence of a positive AFTA effect that although limited at first, gradually
increased. It should be noted however, that institutional progress by ASEAN
governments at this time was relatively limited.
One possible explanation for the fall in trade creation immediately following 1993
was the emergence of credible competition for market share from the new industrial
and exporting powers of China, South American and Eastern Europe. Similarly
other regional trade agreements such as the EU and NAFTA and associated
agreements between these groupings and countries in Eastern Europe, the Middle East
and North Africa may have exhibited their own trade diversion effects. The
observation from Table 2 that the coefficient of NAFTA dramatically increases in
1990s while the coefficient of exNAFTA decreases (and is negative) supports this
conjecture.
Our second finding is that the Asian economic crisis was not a hindrance to the aims
of AFTA but rather may have worked as a trigger for a further acceleration of the
process and de facto economic integration itself. Indeed, evidence from Table 2 also
suggests that the effect of the Asian economic crisis was to generate a stronger desire
to source imports from within the region (even though the effect seems to have been
relatively small). A second explanation for the weakening of the negative import
diversion effect after the Asian crisis may reflect the consensus that prior to this date
22
that although ASEAN’s success was based on its outward orientation, perceived
problems of credibility and confidence in the region by the industrialised world meant
that ASEAN countries were forced to turn inwards and to focus on their local markets.
In response, ASEAN governments have made significant efforts to promote the
AFTA process in the midst of Asian crisis, for example at the ASEAN summit in
1998 when the final date for completion of AFTA was bought forward. Finally
however, it can be stated that the traditional stance of ASEAN countries to outward
oriented economic activity has not been significantly damaged but rather stimulated
by the AFTA process and/or the economic crisis resulting in no detrimental welfare
effects for the rest of the world
Recent developments suggest that ASEAN continues to make efforts to accelerate
institutional progress towards regional integration through both widening its
membership to include the entire Southeast Asian region and deepening its policy
coverage to non-trade areas and pursuing wider integration possibilities beyond the
region such as proposing economic cooperation with other regions and countries such
as China and Japan. It is, however, crucially important that there is a strong
economic rational to regional integration. In this sense, developments in this region
have benefited from support from multinational corporations and an additional
explanation for the recent rise in intra-ASEAN trade includes manufacturing’s
increasing reliance on an intra-regional production networks where parts, components
and other intermediate goods are produced across the ASEAN region and bought
together in one location for final assembly (Ng and Yeats 1999, Arndt 2001, Guiheux
and Lecler 2000).

23
There remain however, a number of questions raised by this study. First, the
short-run adjustment costs following the AFTA process and the Asian crisis are an
important issue both economically and politically. There is still little reference to
this subject for the case of ASEAN (early studies include Khalifah 1996, Menon 1996
and Brülhart and Thorpe 2000). 26 Secondly, the long-term dynamic gains that
ASEAN governments wished to peruse from AFTA such as the attraction of FDI,
accumulation of capital stock, technological progress, increasing product variety,
evolving comparative advantage structures and so on may be currently being realised
although it is still too early to observe them empirically (early studies include Madani
2001 and Bende-Nabende and Slater 2001).
26 Concerns about domestic industrial adjustment have already resulted in some countries calling for a rescheduling and rethinking of the product coverage (Menon 1996). Producers in Thailand and Malaysia for example, have requested more protective measures at least in the short-term and Malaysia introduced the Approved Permit System (APS) in April 1994 to restrict imports (Menon, 1996).

24
Table 1. Modified Gravity model estimates investigating intra-regional bias
variable Equation (1) Equation (2) 1983-87 1988-92 1993-97 1998-99 1983-97 1983-99 1983-87 1988-92 1993-97 1998-99 1983-97 1983-99
C -25.79*** -24.36*** -25.81*** -25.50** -23.63*** -23.73*** -24.84*** -23.46*** -24.13*** -23.86*** -22.54*** -22.59*** (-57.08) (-56.13) (-58.93) (-36.24) ( -99.46) (-106.62) (-61.47) (-62.30) (-63.12) (-38.61) (-106.73) (-114.31)
LGDPR 0.74*** 0.72*** 0.74*** 0.75*** 0.71*** 0.71*** 0.72*** 0.69*** 0.71*** 0.72*** 0.69*** 0.69*** ( 61.49) ( 63.89) ( 67.27) ( 42.42) ( 108.29) ( 116.23) ( 65.22) ( 69.36) ( 72.11) ( 45.57) ( 115.21) ( 123.69)
LGDPP 0.72*** 0.73*** 0.80*** 0.78*** 0.73*** 0.73*** 0.70*** 0.70*** 0.77*** 0.75*** 0.70*** 0.71*** ( 59.98) ( 64.56) ( 72.22) ( 44.16) ( 110.47) ( 118.91) ( 63.51) ( 70.19) ( 77.72) ( 47.50) ( 117.67) ( 126.73)
LPGDPR 0.21*** 0.14*** 0.11*** 0.15*** 0.14*** 0.14*** 0.24*** 0.18*** 0.14*** 0.18*** 0.17*** 0.17*** ( 17.05) ( 13.50) ( 11.07) ( 8.96) ( 21.57) ( 23.18) ( 21.26) ( 19.10) ( 15.42) ( 12.31) ( 29.31) ( 31.58)
LPGDPP 0.30*** 0.15*** 0.10*** 0.04** 0.16*** 0.15*** 0.33*** 0.19*** 0.13*** 0.08*** 0.20*** 0.18*** ( 23.92) ( 14.45) ( 10.23) ( 2.58) ( 25.68) ( 24.92) ( 28.79) ( 20.02) ( 14.46) ( 5.17) ( 33.73) ( 33.40)
LGAP 0.07*** 0.06*** -0.01 -0.01 0.03*** 0.02*** 0.08*** 0.06*** -0.01 -0.01 0.03*** 0.03*** ( 5.75) ( 4.87) ( -0.62) ( -0.75) ( 4.05) ( 3.64) ( 6.66) ( 6.24) ( -0.60) ( -0.45) ( 5.15) ( 4.81)
LDIS -0.67*** -0.60*** -0.57*** -0.57*** -0.62*** -0.62*** -0.74*** -0.67*** -0.64*** -0.65*** -0.69*** -0.69*** (-38.72) (-37.73) (-38.07) (-23.21) (-66.36) (-70.39) (-47.46) (-47.76) (-48.38) (-29.62) (-81.99) (-87.19)
ADJ 0.35*** 0.49*** 0.44*** 0.46*** 0.43*** 0.44*** 0.35*** 0.52*** 0.47*** 0.49*** 0.44*** 0.45*** ( 4.63) ( 6.94) ( 6.58) ( 4.24) ( 10.30) ( 11.08) ( 5.05) ( 8.22) ( 7.78) ( 5.06) ( 11.64) ( 12.62)
COM 1.02*** 1.24*** 1.15*** 1.28*** 1.13*** 1.15*** 1.07*** 1.18*** 1.04*** 1.14*** 1.10*** 1.11*** ( 19.85) ( 21.24) ( 20.10) ( 15.22) ( 35.00) ( 38.06) ( 22.92) ( 22.59) ( 20.31) ( 15.19) ( 37.79) ( 40.64)
Intra-region ASEAN 1.78*** 1.75*** 1.67*** 1.72*** 1.60*** 1.61***
( 14.99) ( 16.05) ( 16.04) ( 10.07) ( 24.75) ( 26.62) EU
NAFTA
APEC 1.27*** 1.30*** 1.23*** 1.27*** 1.24*** 1.25***
( 37.31) ( 42.69) ( 42.65) ( 26.98) ( 67.81) ( 72.78) Adjusted R2 0.73 0.74 0.73 0.73 0.74 0.74 0.77 0.79 0.79 0.78 0.79 0.79 F-Statistic 1787.19*** 1860.23*** 1819.54*** 713.96*** 5714.21*** 6511.43*** 2251.66*** 2497.03*** 2444.35*** 961.77*** 7378.55*** 8433.17*** Obs 5927 5943 5950 2380 17820 20200 5927 5943 5950 2380 17820 20200
25
variable Equation (3) Equation (4) 1983-87 1988-92 1993-97 1998-99 1983-97 1983-99 1983-87 1988-92 1993-97 1998-99 1983-97 1983-99
C -25.65*** -24.20*** -25.48*** -25.09*** -23.45*** -23.53*** -25.66*** -24.36*** -24.72*** -24.53*** -23.07*** -23.12*** (-56.25) (-55.34) (-57.85) (-35.14) ( -98.09) (-105.10) (-61.71) (-62.73) (-62.85) (-38.53) (-106.67) (-114.23)
LGDPR 0.74*** 0.71*** 0.74*** 0.75*** 0.71*** 0.71*** 0.72*** 0.70*** 0.71*** 0.72*** 0.69*** 0.69*** ( 60.72) ( 63.09) ( 66.47) ( 41.84) ( 107.06) ( 114.90) ( 65.41) ( 69.68) ( 71.98) ( 45.53) ( 115.02) ( 123.48)
LGDPP 0.72*** 0.72*** 0.79*** 0.78*** 0.72*** 0.73*** 0.71*** 0.71*** 0.77*** 0.76*** 0.70*** 0.71*** ( 59.22) ( 63.75) ( 71.40) ( 43.57) ( 109.23) ( 117.58) ( 63.71) ( 70.50) ( 77.55) ( 47.45) ( 117.43) ( 126.50)
LPGDPR 0.21*** 0.14*** 0.11*** 0.15*** 0.14*** 0.14*** 0.25*** 0.19*** 0.15*** 0.19*** 0.17*** 0.17*** ( 16.96) ( 13.45) ( 11.07) ( 8.95) ( 21.57) ( 23.18) ( 21.89) ( 19.78) ( 16.00) ( 12.80) ( 30.01) ( 32.36)
LPGDPP 0.30*** 0.15*** 0.10*** 0.04** 0.16*** 0.15*** 0.33*** 0.20*** 0.14*** 0.08*** 0.20*** 0.18*** ( 23.84) ( 14.41) ( 10.22) ( 2.56) ( 25.68) ( 24.93) ( 29.42) ( 20.72) ( 15.04) ( 5.67) ( 34.44) ( 34.19)
LGAP 0.08*** 0.06*** -0.01 -0.01 0.03*** 0.03*** 0.09*** 0.08*** 0.00 0.00 0.04*** 0.04*** ( 5.89) ( 5.07) ( -0.75) ( -0.83) ( 4.35) ( 3.96) ( 7.56) ( 7.40) ( 0.16) ( 0.04) ( 6.56) ( 6.33)
LDIS -0.65*** -0.58*** -0.57*** -0.57*** -0.61*** -0.61*** -0.70*** -0.62*** -0.61*** -0.62*** -0.65*** -0.65*** (-35.55) (-34.54) (-35.73) (-22.05) (-61.07) (-64.96) (-41.48) (-41.31) (-42.85) (-26.56) (-71.86) (-76.57)
ADJ 0.30*** 0.43*** 0.35*** 0.35*** 0.35*** 0.35*** 0.34*** 0.50*** 0.42*** 0.41*** 0.41*** 0.41*** ( 3.77) ( 5.88) ( 5.07) ( 3.17) ( 8.13) ( 8.68) ( 4.73) ( 7.81) ( 6.73) ( 4.22) ( 10.46) ( 11.23)
COM 1.01*** 1.24*** 1.15*** 1.28*** 1.12*** 1.14*** 1.05*** 1.19*** 1.04*** 1.09*** 1.10*** 1.10*** ( 19.80) ( 21.24) ( 20.06) ( 15.19) ( 34.94) ( 38.00) ( 22.57) ( 22.98) ( 20.36) ( 14.52) ( 37.80) ( 40.50)
Intra-region ASEAN 1.81*** 1.79*** 1.69*** 1.74*** 1.64*** 1.65*** 0.82*** 0.81*** 0.70*** 0.82*** 0.65*** 0.66***
( 15.22) ( 16.34) ( 16.19) ( 10.18) ( 25.28) ( 27.18) ( 7.32) ( 8.08) ( 7.31) ( 5.27) ( 10.76) ( 11.73) EU 0.24*** 0.27*** 0.10 0.12 0.24*** 0.23*** 0.33*** 0.37*** 0.21*** 0.23** 0.34*** 0.34***
( 2.75) ( 3.35) ( 1.25) ( 0.92) ( 4.99) ( 5.14) ( 4.01) ( 5.10) ( 3.01) ( 2.00) ( 7.78) ( 8.16) NAFTA 0.57*** 0.62*** 1.09*** 1.26*** 0.87*** 0.92*** -0.49** -0.46** 0.13 0.27 -0.13 -0.08
( 2.68) ( 3.21) ( 5.87) ( 4.23) ( 7.51) ( 8.52) ( -2.50) ( -2.62) ( 0.81) ( 1.00) ( -1.27) ( -0.81) APEC 1.23*** 1.26*** 1.18*** 1.21*** 1.20*** 1.20***
( 34.57) ( 39.91) ( 39.06) ( 24.82) ( 62.94) ( 67.45) Adjusted R2 0.73 0.74 0.73 0.73 0.74 0.74 0.78 0.79 0.79 0.79 0.79 0.79 F-Statistic 1466.5*** 1528.6*** 1500.3*** 589.9*** 4702.2*** 5360.6*** 1715.3*** 1909.9*** 1855.6*** 732.4*** 5599.0*** 6400.2*** Obs 5927 5943 5950 2380 17820 20200 5927 5943 5970 2380 17820 20200
Note ***, **, and * denote 1%, 5%, and 10% level significance respectively. The numbers in parentheses are the t-statstics. Due to the difference of observed years and missing values, the numbers of observations are not constant. The number of observations are as follows; (a) For periods 1983-87, 1988-92 and 1993-97, 35 by 34 countries, by 5 years = 5950; (b) For the period 1998-99, 35 by 34 countries, by 2 years = 2380; (c) For the period 1983-97, 35 by 34 countries, by 15 years = 17850; (d) For the period 1983-99, 35 by 34 countries and by 17years = 20230. All regressions estimated using TSP.

26
Table 2. Modified Gravity model estimates: trade creation and trade diversion
Variable 1983-87 1988-92 1993-97 1998-99 1983-97 1983-99
C -29.57*** -28.43*** -29.48*** -30.12*** -25.81*** -25.93*** (-57.64) (-59.71) (-64.79) (-40.34) (-102.03) (-109.92)
LGDPR 0.79*** 0.77*** 0.78*** 0.77*** 0.73*** 0.73*** ( 58.97) ( 63.23) ( 67.52) ( 41.49) (103.03) ( 110.27)
LGDPP 0.78*** 0.79*** 0.87*** 0.90*** 0.77*** 0.78*** ( 58.51) ( 64.72) ( 75.93) ( 48.83) (108.08) ( 117.39)
LPGDPR 0.25*** 0.19*** 0.16*** 0.20*** 0.17*** 0.17*** ( 20.13) ( 18.25) ( 16.98) ( 12.78) ( 26.97) ( 29.03)
LPGDPP 0.34*** 0.19*** 0.14*** 0.12*** 0.19*** 0.18*** ( 27.48) ( 18.34) ( 14.70) ( 7.70) ( 30.30) ( 30.50)
LGAP 0.06*** 0.04*** -0.02* -0.02 0.01* 0.01 ( 5.01) ( 3.78) ( -1.91) ( -1.44) ( 1.92) ( 1.36)
LDIS -0.65*** -0.59*** -0.60*** -0.62*** -0.63*** -0.63*** (-35.41) (-35.85) (-39.75) (-25.75) (-63.36) (-68.13)
ADJ 0.34*** 0.46*** 0.39*** 0.41*** 0.39*** 0.39*** ( 4.53) ( 6.79) ( 6.29) ( 4.22) ( 9.68) ( 10.43)
COM 1.02*** 1.23*** 1.20*** 1.31*** 1.15*** 1.18*** ( 20.99) ( 22.62) ( 23.07) ( 17.78) ( 37.99) ( 41.59)
Intra-regional bias
ASEAN 2.26*** 2.27*** 2.11*** 2.35*** 2.01*** 2.03*** ( 19.75) ( 21.95) ( 22.30) ( 15.53) ( 32.70) ( 35.50) EEC 0.29*** 0.27*** 0.11 0.11 0.34*** 0.33*** ( 3.34) ( 3.47) ( 1.49) ( 0.96) ( 7.26) ( 7.55) NAFTA 0.52*** 0.60*** 1.12*** 1.29*** 0.98*** 1.04*** ( 2.58) ( 3.28) ( 6.66) ( 4.90) ( 8.96) ( 10.22)
Extra-regional bias (imports to)
imASEAN 0.76*** 0.92*** 1.02*** 0.98*** 0.83*** 0.83*** ( 16.27) ( 21.51) ( 26.25) ( 15.68) ( 32.64) ( 35.41) imEEC 0.28*** 0.20*** 0.20*** 0.29*** 0.30*** 0.31*** ( 6.50) ( 5.34) ( 5.55) ( 5.28) ( 13.32) ( 14.64) imNAFTA -0.35*** -0.23*** 0.01 0.23*** -0.07** -0.02*** ( -5.82) ( -4.41) ( 0.28) ( 1.28) ( -2.06) ( -0.60)
(exports from) exASEAN 0.79*** 0.81*** 0.91*** 1.28*** 0.77*** 0.82*** ( 16.97) ( 19.05) ( 23.55) ( 20.59) ( 30.32) ( 34.74) exEEC 0.22*** 0.19*** 0.21*** 0.21*** 0.29*** 0.29*** ( 5.18) ( 4.90) ( 5.87) ( 3.75) ( 12.56) ( 13.49) exNAFTA -0.41*** -0.43*** -0.57*** -0.58*** -0.34*** -0.36*** ( -6.92) ( -8.12) ( -11.71) ( -7.56) ( -10.88) ( -12.17)
Adjusted R2 0.76 0.77 0.78 0.79 0.77 0.78 F-statisitics 1095.6*** 1193.5*** 1273.4*** 541.02*** 3566.8*** 4114.5*** Observations 5927 5943 5950 2380 17820 20200
Note ***, **, and * denote 1%, 5%, and 10% level significance respectively .
27
Table 3. Modified Gravity model estimates: ASEAN bilateral trade Variable 1983-87 1988-92 1993-97 1998-99 1983-97 1983-99
C -28.71*** -26.41*** -29.93*** -33.23*** -22.76*** -23.48*** (-28.00) (-27.33) (-32.40) (-20.90) (-44.48) (-48.68)
LGDPR 0.89*** 0.85*** 0.88*** 0.97*** 0.77*** 0.78*** ( 35.40) ( 35.53) ( 39.31) ( 25.52) ( 57.50) ( 62.25)
LGDPP 0.94*** 0.89*** 0.94*** 0.96*** 0.82*** 0.82*** ( 37.47) ( 37.71) ( 41.72) ( 25.44) ( 61.34) ( 65.84)
LPGDPR 0.63*** 0.48*** 0.38*** 0.38*** 0.42*** 0.41*** ( 25.92) ( 23.06) ( 21.19) ( 13.28) ( 34.81) ( 36.88)
LPGDPP 0.61*** 0.45*** 0.37*** 0.21*** 0.40*** 0.37*** ( 25.15) ( 21.77) ( 20.50) ( 7.46) ( 33.20) ( 33.32)
LGAP -0.10*** -0.14*** -0.11*** -0.05* -0.09*** -0.08*** ( -4.08) ( -6.78) ( -6.06) ( -1.70) ( -6.89) ( -7.00)
LDIS -1.84*** -1.58*** -1.29*** -1.13*** -1.49*** -1.44*** (-37.09) (-34.03) (-30.55) (-16.06) (-53.70) (-55.66)
ADJ -1.20*** -0.63*** -0.44** -0.25 -0.64*** -0.60*** ( -5.36) ( -3.02) ( -2.27) ( -0.81) ( -5.06) ( -5.08)
COM 0.89*** 1.03*** 1.11*** 1.37*** 1.06*** 1.10*** ( 11.37) ( 10.46) ( 13.52) ( 12.07) ( 20.69) ( 23.34)
ASEAN 0.34** 0.35*** 0.51*** 0.84*** 0.29*** 0.35*** ( 2.40) ( 2.66) ( 4.19) ( 4.20) ( 3.61) ( 4.68)
Adjusted R2 0.74 0.73 0.76 0.75 0.75 0.75 F-statisitics 497.6*** 487.7*** 564.3*** 217.2*** 1591.3*** 1820.9*** Observations 1600 1600 1600 640 4800 5440 Note ***, **, and * denote 1%, 5%, and 10% level significance respectively.
28
References
Adams, F. G. and Park, I. (1995), Measuring the Impact of AFTA: An Application of a
Linked CGE System, Journal of Policy Modelling, Vol. 17(4), pp. 325-365.
Aitken, N.D. (1973), The Effect of the EEC and EFTA on European Trade: a
Temporal Cross-Section Analysis, American Economic Review, Vol. 63, pp.
881-92.
Anderson, J. E. (1979), A theoretical foundation for a gravity equation, American
Economic Review, Vol. 69, pp. 106-116.
Anwar, D.F. (1994), Indonesia in ASEAN: Foreign Policy and Regionalism. New
York: St. Martin’s Press.
Ariff, M. (1994), Open Regionalism á la ASEAN, Journal of Asian Economics, Vol. 5,
pp. 99-117.
Arndt, S. W. (2001), Production Networks in an Economically Integrated Region,
ASEAN Economic Bulletin Vol. 18, No. 1, April, pp. 24-34.
ASEAN Secretariat (1995), AFTA Reader, Jakarta: ASEAN Secretariat.
ASEAN Secretariat (2002), ASEAN Economic Cooperation – Trade and AFTA,
http://www.aseansec.org/.
Asian Development Bank (2002). Asian Development Outlook 2002,
http://www.adbc.org/.
Athukorala, P.C. and Menon, J. (1997), AFTA and the Investment-Trade Nexus in
ASEAN, World Economy, Vol. 20(2), March, pp. 159-174.
Balassa, B. (1967), Trade creation and trade diversion in the European Common
Market. Economic Journal, 77, pp.1-21.
Balassa, B. (1974), Trade creation and trade diversion in the European Common
Market: An appraisal of the evidence. Manchester School of Economic and Social
Studies, 42, pp.93-135.
Balassa, B. (ed.) (1975), European Economic Integration. Amsterdam:
North-Holland.
Bayoumi, T., and Eichengreen, B. (1997). Is regionalism simply a diversion?
Evidence from the evolution of the EC and EFTA. In T. Ito and A. O. Krueger
(Eds.), Regionalism versus Multilateral Trade Arrangements. Chicago: University
of Chicago Press.
Bergsten, F. (1997), Open Regionalisam, Institute for International Economics

29
Working Paper 97-3.
Bergstrand, J. H. (1985), The gravity equation in international trade: Some
microeconomic foundations and empirical evidence, Review of Economics and
Statistics, Vol. 67, pp. 474-481.
Bende-Nabende, A., Ford, J. L. and Slater, J. R., (2001), FDI, Regional Economic
Integration and Endogenous Growth: Some evidence from Southeast Asia, Pacific
Economic Review, Vol 6, No. 3, pp. 1-18.
Bhagwati, J. (1991). The World Trading System at Risk. Princeton, NJ: Princeton U.
Press.
Brülhart, M. and Thorpe, M. (2000), Intra-Industry Trade and Adjustment in
Malaysia: Puzzling Evidence, Applied Economics Letters, Vol. 7, No. 11, pp.
729-733.
Clarete, R., Edmonds, C. and Seddon, J. (forthcoming), Asian Regionalism and its
Effects of Trade in the 1990’s . ABD Economics and Research Department Working
Paper.
Deardorff, A.V. (1984), Testing Trade Theories and Predicting Trade Flows, in Jones,
R.W. and Kenon, P (eds) Handbook of International Economics, Volume 1,
Elsevier Science Publishers, Amerstam.
DeRosa, A. Dean (1995), Regional Trading Arrangements among Developing
Countries: The ASEAN example, Research Report 103, International Food Policy
Research Institute, Washington D.C.
Drysdale, P. D. (1967), Japan, Australia and New Zealand: the prospects for Western
Pacific integration, Economic Record, Vol. 45(111), September, pp.321-342.
Elbadawi, I. (1997), The impact of Regional Trade and Monetary Schemes on
Intra-subSaharan Africa Trade, in A. Oyejide, I. Elbadawi, and P. Collier (eds.)
Regional Integration and Trade Liberalization in SubSaharan Africa Volume 1 :
Framework, Issues and Methodological Perspectives , London : Macmillan Press
Ltd., pp. 210-255.
Endoh, M. (1999), Trade creation and trade diversion in the EEC, the LAFTA and the
CMEA: 1960-1994, Applied Economics, 31, pp.207- 216.
Endoh, M. (2000) The transition of postwar Asia-Pacific trade relations, Journal of
Asian Economics 10, pp.571–589.
Ethier, Wilfred J. (1998), Regionalism in a Multilateral World, Journal of Political
Economy, Vol. 106, no.6, pp.1214-1245.
30
Evenett, S.J. and Keller, W. (2002), On Theories Explaining the Success of the
Gravity Equation, Journal of Political Economy, Vol. 110, no. 2, pp. 281-316.
Frankel, J. A. (1993), Is Japan Creating a yen block in East Asia and the Pacific?, in
Jeffrey A. Frankel and Miles Kahler (eds.), Regionalism and Rivalry: Japan and
the United States in Pacific Asia, Chicago: University of Chicago Press, pp.
53-85.(reprinted in R. Garnaut and P. Drysdale (eds.), Asia-Pacific Regionalism:
Readings in International Economic Relations, Sydney: Harper Educational
Publishers, pp. 227-249.
Frankel, J., Stein, E., & Wei, S. (1995), Trading blocs and the Americas: the natural,
the unnatural, and the super-natural, Journal of Development Economics Vol. 47
(1), 61–95.
Frankel, J. A. (1997), Regional Trading Blocs in the World Economic System.
Washington, DC: Institute for International Economics.
Frankel, J. A. and Wei, S.J (1998), Regionalization of World Trade and Currencies:
Economics and Politics, in Jeffrey A. Frankel ed., The Regionalization of the
World Economy, Chicago and London: The University of Chicago Press,
pp.189-219.
Garnaut, R. and Drysdale, P. (1994) Asia-Pacific Regionalism: The Issues, in R.
Garnaut and P. Drysdale (eds.), Asia-Pacific Regionalism: Readings in
International Economic Relations, Sydney: Harper Educational Publishers, pp.
1-7.
Greenaway, D. and Milner, C. (1986), The Economics of Intra-Industry Trade,
Oxford: Blackwell.
Guiheux, G. and Lecler, Y. (2000), Japanese Car Manufacturers and Component
Makers in the ASEAN Region: a Case of Expatriation under Duress- or a Strategy
of Regionally Integrated Production?”, in John Humphrey, Yveline Lecler and
Mario Sergio Salerno (eds.), Global Strategies and Local Realities: The Auto
Industry in Emerging Markets, London: Macmillan Press Ltd, pp. 207-233.
Hamilton, C. B. and Winters, L. A. (1992) Opening up international trade with Eastern
Europe, Economic Policy, pp. 77-116.
Helpman, E., and Krugman, P. A. (1985), Market Structure and Foreign Trade,
Cambridge: MIT Press.
Hine, R. C. (1994) International Economic Integration. In David Greenaway and L.
Alan Winte (eds), Surveys in international trade. Oxford : Blackwell.

31
Imada, P., Montes, M. and Naya, S. (1991) A Free Trade Area - Implications for
ASEAN, Singapore: ASEAN Economic Research Unit, Institute Southeast Asian
Studies (ISEAS).
Institute of Development Studies (IDS) (1999), Regional Trade Agreement, Trade &
Investment, Background briefing No.2.
Johnson, H. G. (1962), Money Trade and Economic Growth – Survey Lectures in
Economic Theory, George Allen and Urwin, London.
Khalifah, N. A. (1996), AFTA and Intra-Industry Trade, ASEAN Economic Bulletin
Vol. 12, No.3, pp. 351-368.
Kruger, A. (1999), Trade creation and trade diversion under NAFTA, NBER Working
Paper series, No.7429.
Krugman, P. R. (1991) Is Bilateral Bad? In E. Helpman and A. Razim E (eds.),
International Trade and Policy, Cambridge: MIT Press.
Lawrence, R. (1991), Emerging Regional Arrangements: Building Blocks or
Stumbling Blocks? In Finance and the International Economy, edited by R.
O’Brian. The AMEX Bank Review Prize Essays. United Kingdom: Oxford
University Press.
Linder, S. B. (1961), An Essay on Trade and Transformation, Stockholm: Almqvist &
Wiksell.
Linneman, H. (1966), An Economic Study of International Trade Flows, Amsterdam:
North-Holland.
Madani, D. (2001), Regional Integration and Industrial Growth among Developing
Countries: The Case of Three ASEAN Members, World Bank Working Paper
No.2697, New York: World Bank.
Menon, J. (1996), Adjusting towards AFTA: The Dynamics of Trade in ASEAN,
Singapore: Institute of Southeast Asian Studies.
Ng, F. and Yeats, A. (1999), Production Sharing in East Asia: Who Does What for
Whom and Why?, Policy Research Working Paper 2197, The World Bank,
Development Research Group, Washington D.C.
OECD (Organisation for Economic Cooperation and Development) (1993) Regional
Integration and Developing Countries. Paris: OECD.
Pangestu, M., Soesastro, H. and Ahmad, M. (1992), A new look at intra-ASEAN
economic cooperation, ASEAN Economic Bulletin, Vol. 8(3), pp. 333-352.
Park, D. (1999), The Prospects for Further Economic Integration in ASEAN, Journal
32
of Economic Integration, Vol. 14(3), September, pp. 382-418.
Pomfret, R (1996), ASEAN: Always at the Crossroads? Journal of the Asia Pacific
Economy, Vol. 1 (3): 365-90.
Pöyhönen, P. (1963), A tentative model for the volume of trade between countries,
Welwirtschaftliches Archiv, Vol. 90, pp. 93-99.
Prewo, W.E. 1974. Integration Effects in the EEC: An Attempt at Quantification in a
General Equilibrium Framework. European Economic Review 5: 379-405.
Sanso, M., Cuairan, R. and Sanz, F. (1993), Bilateral trade flows, the gravity equation,
and foundation form, Review of Economics and Statistics, Vol. 75, pp. 266-275.
Sharma, S. C., and Chua, S. Y. (2000), ASEAN: economic integration and
intra-regional trade, Applied Economics Letters, Vol. 7, pp. 165-169.
Soloaga, Isidro and Winters, L. Alan (2001) Regionalism in the nineties: What effect
on trade?, The North American Journal of Economics and Finance, Vol. 12,
pp.1-29.
Summers, L. (1991), Regionalism and the World Trading System. In Policy
Implications of Trade and Currency Zones. Wyoming: Federal Reserve Bank of
Kansas City.
Tan, G. (1992), ASEAN Preferential Trading Arrangements: An Overview, The
ASEAN Reader, Singapore: Institute of Southeast Asian Studies, pp. 237-241.
Tinbergen, J. (1962), Shaping the World Economy: Suggestions for an International
Economic Policy, New York: The Twentieth Century Fund.
Todaro, P. M. (2000), Economic Development 7th (ed.). Harlow: Addison-Wesley.
Truman, E.M. (1969), The European Economic Community: Trade creation and trade
diversion, Yale Economic Essays, 9, pp.201-257.
Verdoorn, P. J. and Schwartz, A. N. R. (1972), Two alternative estimates of the effects
of EEC and EFTA on the pattern of trade. European Economic Review, Vol. 3,
pp.291-335.
Viner, J. (1950), The Customs Union, New York: Carnegie Endowment for
International Peace.
World Bank (1999), Trade Blocs, New York: Oxford University Press.
WTO (World Trade Organisation) (2001), The WTO Annual Report 2001, Geneva:
WTO.
Yamazawa, I. (1992), On Pacific Economic Integration, The Economic Journal Vol.
102, no. 415 (November), pp. 1519-29.

33
Appendix A
Timetable for Accelerating AFTA (CEPT Scheme) Definition 1992 Protocol
(Signed in Jan.1992) (Begun on 1.Jan.1993)
1995 Protocol (Signed in Dec.1995)
(Begun on 1.Jan.1996)
Some progress after 1995 protocol including acceptance of new member
Coverage in 2001 CEPT
Product List Covering all manufactured good (not including unprocessed agricultural product)
Covering all manufactured good (including unprocessed agricultural product)
Fast Track
Present rate < 20% à 0-5% by 1.1. 2000
à 0-5% by 1.1. 1998
Present rate = 20% à 0-5% by 1.1. 2003
à 0-5% by 1.1. 2000
Normal Track
Present rate < 20% à 0-5% by 1.1. 2003
à 0-5% by 1.1. 2000
Present rate = 20% à 20% within 5-8 years
à 20% by 1.1. 1998
Inclusion List (INL)
Immediate liberalization through reduction in intra-regional (CEPT) tariff rates, removal of quantitative restrictions and other non-tariff barriers
0-5% by 1.1. 2008 0-5% by 1.1. 2003
For original six countries, according to 1998 agreement, 85% of all INL: 0-5% by 1.1.2000. 90% of all INL: 0-5% by 1.1.2001. 100% of all INL: 0-5% by 1.1.2002. with flexibility For Vietnam, reduced to 0-5% by 2006 For Laos and Myanmar by 2008 For Cambodia by 2010
55,680 tariff line representing 84.74% of all.
Temporary Exclusion List (TEL)
Temporarily excluded from liberalisation, but have to be transferred into the Inclusion List
Tariff not removed until 31.12.2000, but to be reviewed
Gradually transferred to INL, for original six countries, since 1996
Gradually transferred to INL, for Vietnam, since 1999 for Laos and Myanmar, since 2001 for Cambodia, beginning in 2003
8,660 tariff lines representing about 13.4% of all
Sensitive List
The commitment to reduce tariffs, remove quantitative restrictions and other non-tariff barriers is extended.
Tariff not removed Phased in CEPT, beginning 2001-03, reduced to 0-5%, for original six countries, by 2010
Phased in CEPT, reduced to 0-5%, for Vietnam by 2013 for Laos an Myanmar by 2015 for Cambodia by 2017 (note: remaining “Highly sensitive List” which need special arrangement for liberalisation )
360 tariff lines making up 0.55% of all tariff lines
General Exclusion List
Permanently excluded from FTA for reasons of national security, protection of human, animal or plant life and health and articles of artistic, historic and archaeological value
Tariff not removed 829 tariff lines representing about 1.28% of all tariff lines
(Source) ASEAN Secretariat
34
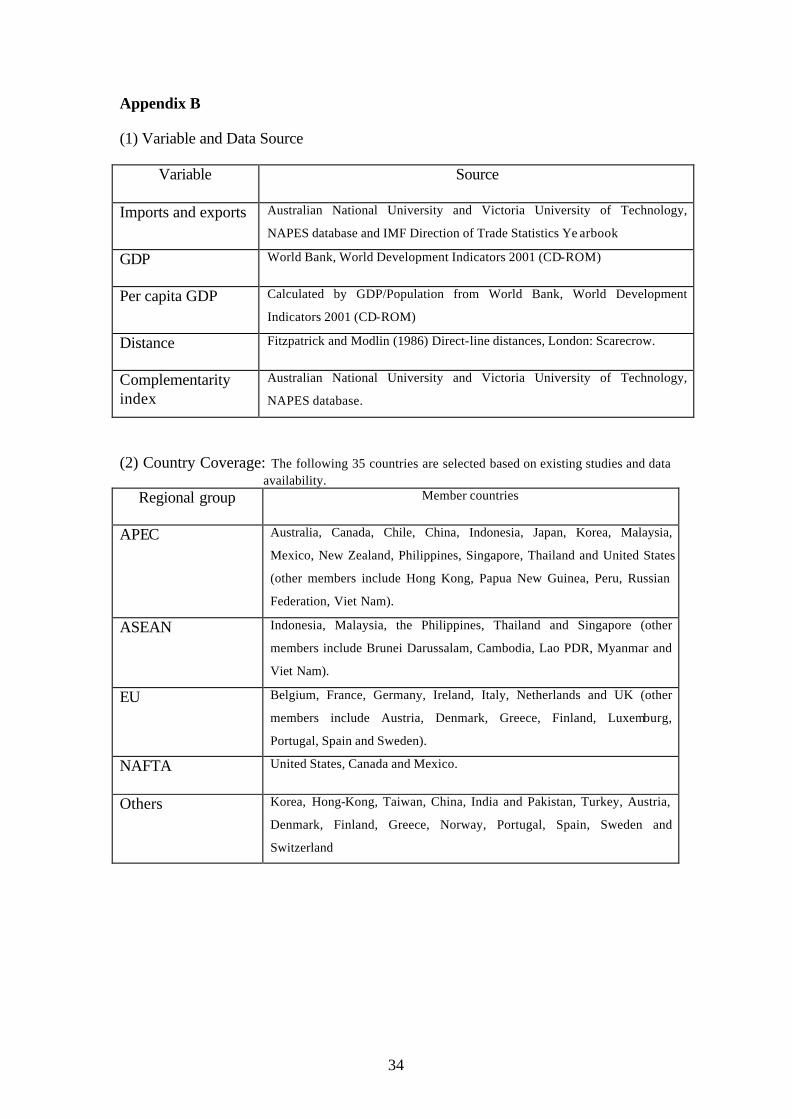
Appendix B (1) Variable and Data Source
Variable Source
Imports and exports Australian National University and Victoria University of Technology,
NAPES database and IMF Direction of Trade Statistics Ye arbook
GDP World Bank, World Development Indicators 2001 (CD-ROM)
Per capita GDP Calculated by GDP/Population from World Bank, World Development
Indicators 2001 (CD-ROM)
Distance Fitzpatrick and Modlin (1986) Direct-line distances, London: Scarecrow.
Complementarity index
Australian National University and Victoria University of Technology,
NAPES database.
(2) Country Coverage: The following 35 countries are selected based on existing studies and data availability.
Regional group Member countries
APEC Australia, Canada, Chile, China, Indonesia, Japan, Korea, Malaysia,
Mexico, New Zealand, Philippines, Singapore, Thailand and United States
(other members include Hong Kong, Papua New Guinea, Peru, Russian
Federation, Viet Nam).
ASEAN Indonesia, Malaysia, the Philippines, Thailand and Singapore (other
members include Brunei Darussalam, Cambodia, Lao PDR, Myanmar and
Viet Nam).
EU Belgium, France, Germany, Ireland, Italy, Netherlands and UK (other
members include Austria, Denmark, Greece, Finland, Luxemburg,
Portugal, Spain and Sweden).
NAFTA United States, Canada and Mexico.
Others Korea, Hong-Kong, Taiwan, China, India and Pakistan, Turkey, Austria,
Denmark, Finland, Greece, Norway, Portugal, Spain, Sweden and
Switzerland

35
Appendix C. ASEAN real exchange rates
Relative Real Exchange Rate of ASEAN countries
Note. Relative exchange rates are calculated as follows: (1) Country i’s relative real exchange rate to country j was defined as the local currency value of 1
j’s local currency, multiplied by the j’s GDP deflator and devided by country i’s GDP deflator, where i is each ASEAN country and j is our every sample country.
(2) Country i’s relative real exchange rate to ASEAN was calculated by weighting an each relative real exchange rate by the share of i’s trade with each ASEAN country in i’s trade with the ASEAN total and summing.
(3) Similarly, country i’s relative real exchange rate to non ASEAN member was calculated by weighting an each relative real exchange rate by the share of i’s trade with each non ASEAN country in i’s trade with the non ASEAN members total and summing.
Depreciate
Appreciate
Indonesia
0
20
40
60
80
100
120
140
1983
1984
1985
1986
1987
1988
1989
1990
1991
1992
1993
1994
1995
1996
1997
1998
1999
ASEAN NASEAN
Malaysia
0
20
40
60
80
100
120
140
160
1983
1984
1985
1986
1987
1988
1989
1990
1991
1992
1993
1994
1995
1996
1997
1998
1999
ASEAN NASEAN
Philippines
0
20
40
60
80
100
120
140
160
1983
1984
1985
1986
1987
1988
1989
1990
1991
1992
1993
1994
1995
1996
1997
1998
1999
ASEAN NASEAN
Thailand
0204060
80100120140160
180
1983
1984
1985
1986
1987
1988
1989
1990
1991
1992
1993
1994
1995
1996
1997
1998
1999
ASEAN NASEAN
Singapore
0
20
40
60
80
100
120
1983
1984
1985
1986
1987
1988
1989
1990
1991
1992
1993
1994
1995
1996
1997
1998
1999
ASEAN NASEAN


