


Agenda
• Final Modal Assignments• Prioritization• Supporting Network• Financial Analysis

22 CorridorsSunRail
High Speed Rail
Winter ParkUS 192US 192Silver Star RdSanfordInnovation WayUS 17-92US 17-92SR 436SR 436US 441US 441/17-92US 441/17-92SR 50John Young PkwyOrange AveKirkman RdSR 528SR 434Aloma AveMaitland BlvdSeminole Way
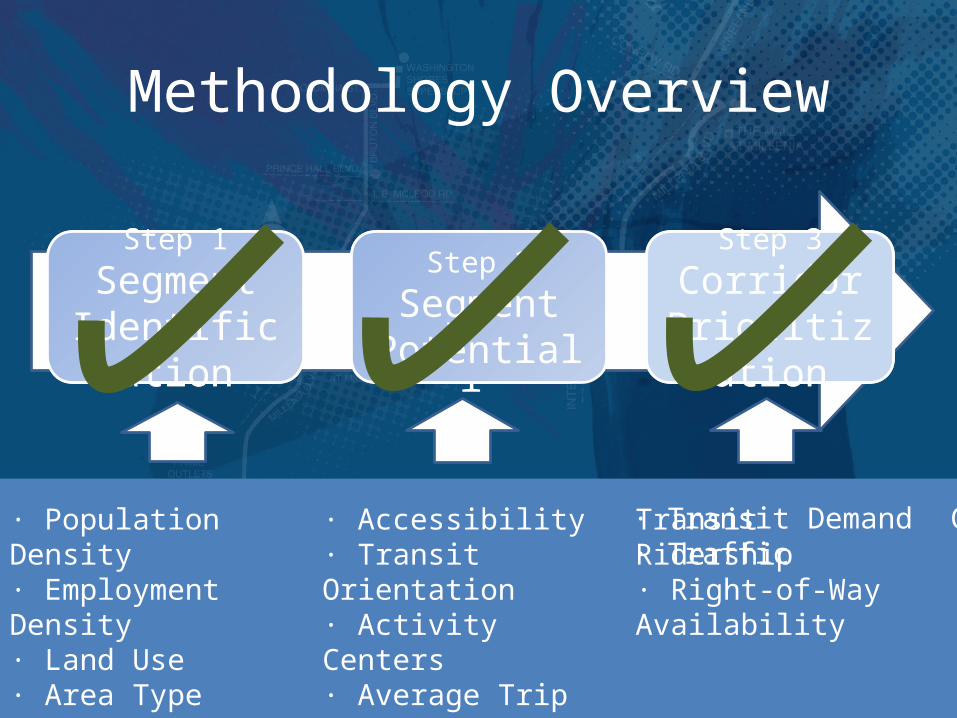
Methodology Overview
Step 1Segment
Identification
Step 2 Segment Potential
Step 3Corridor
Prioritization
· Population Density· Employment Density· Land Use· Area Type· User Market· Accessibility
· Transit Orientation · Activity Centers· Average Trip Length · Existing Transit Ridership· Right-of-Way Availability
· Transit Demand· Traffic Conditions· Roadway Improvements· Compatibility
Step 1Segment
Identification
Step 2Segment Potential
Step 3Corridor
Prioritization

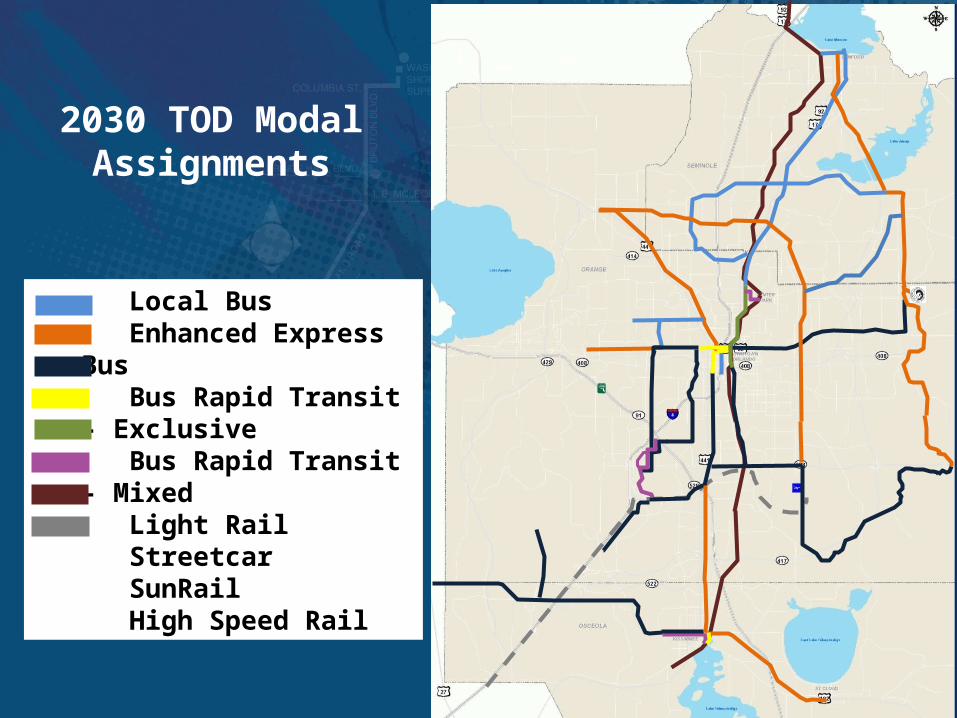
2030 TOD* Modal Assignments
Local Bus Enhanced Express Bus Bus Rapid Transit - Exclusive Bus Rapid Transit - Mixed Light Rail Streetcar SunRail High Speed Rail
* Consistent with MetroPlan’s adopted alternative land use plan

Prioritization
Methodology Overview• Mode prioritization by segment• Cost identification by segment• Cost vs. available revenue comparison• Identification of financially feasible service• Network compatibility adjustments• Policy adjustments• Network compatibility adjustments• Supporting network identification

Mode Prioritization by Segment
Existing Conditions Score
2030 Conditions Score
2015 Score
2020 Score
2025 Score
• Segment aa
• Segment cc
• Segment xx
• …
• Segment aa
• Segment cc
• Segment xx
• …
• Segment bb
• Segment yy
• Segment zz
• …
• Segment zz
• Segment dd
• Segment ee
• …
• Segment dd
• Segment aa
• Segment ff
• …
Linear Interpolation
Funding Cut-off

2015 TOD Modal Assignments
Local Bus Enhanced Express Bus Bus Rapid Transit - Exclusive Bus Rapid Transit - Mixed Light Rail Streetcar SunRail High Speed Rail

2020 TOD Modal Assignments
Local Bus Enhanced Express Bus Bus Rapid Transit - Exclusive Bus Rapid Transit - Mixed Light Rail Streetcar SunRail High Speed Rail

2025 TOD Modal Assignments
Local Bus Enhanced Express Bus Bus Rapid Transit - Exclusive Bus Rapid Transit - Mixed Light Rail Streetcar SunRail High Speed Rail
2030 TOD Modal Assignments
Local Bus Enhanced Express Bus Bus Rapid Transit - Exclusive Bus Rapid Transit - Mixed Light Rail Streetcar SunRail High Speed Rail

LRTP Transit Cost Feasible Plan
I-Drive to Medical City/ Innovation Way LRT
US 441 to Apopka
US 17/92 north of Winter Park
Pine Hills Road
Medical City/Innovation Way to UCF BRT

LRTP and Vision 2030 Differences
• Compilation of findings from different studies • Different corridor set• Varying age of data• Different methodologies• Policy decisions• Corridor versus network approach
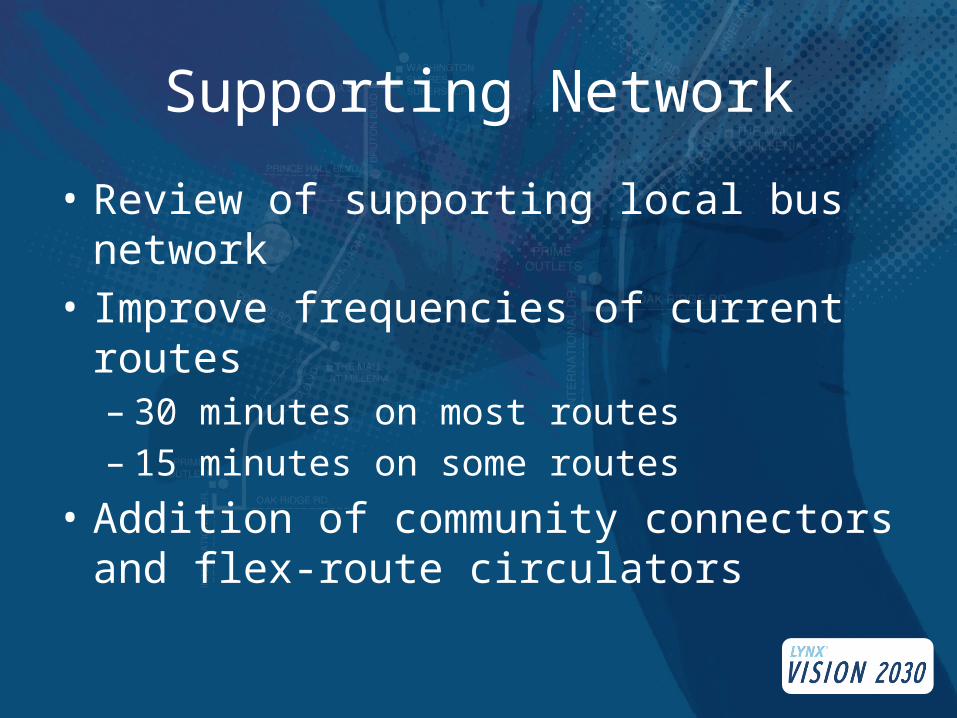
Supporting Network
• Review of supporting local bus network• Improve frequencies of current routes– 30 minutes on most routes– 15 minutes on some routes
• Addition of community connectors and flex-route circulators

Supporting Network
• Community Connectors– Circulates on specific route– Makes frequent stops at bus stops
• Flex-Route Circulators– Operates in a specified area– Circulates on a specific route but deviates within
service area when requested

2030 Community Connectors and
Flex-Route Circulators
Local Bus Enhanced Express Bus Rapid Transit - Exclusive Bus Rapid Transit - Mixed Light Rail Streetcar SunRail High Speed Rail Community Connector Flex-Route Circulator
John Young Parkway S
OrangeAve S
WinterGarden
Orlovista ConwayGoldenrod
ColonialTown
Maitland
Zellwood
Heathrow
Sanford
Poinciana
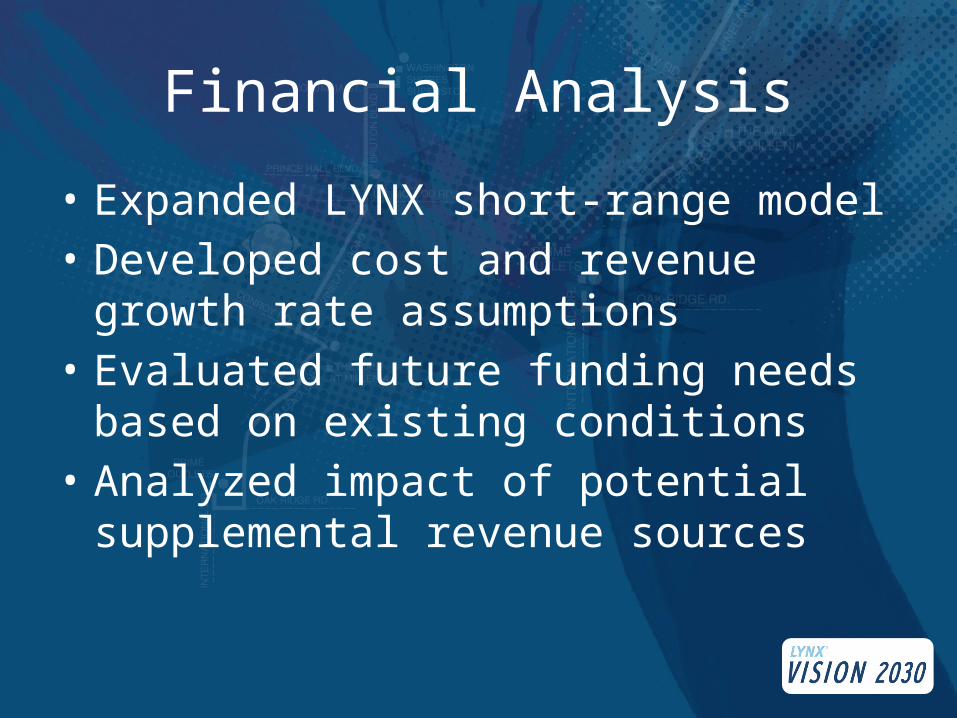
Financial Analysis
• Expanded LYNX short-range model• Developed cost and revenue growth rate
assumptions• Evaluated future funding needs based on
existing conditions• Analyzed impact of potential supplemental
revenue sources

Costs (Year-of-Expenditure Dollars) (Millions)$0
$50
$100
$150
$200
$250
$300
$350
$400
$450
$500
$161
$265
$344
$446
2015202020252030
TOD Scenario: Operating Costs

2015 2020 2025 2030$0
$50
$100
$150
$200
$250
$300
$350
$400
$450
$500
CostRevenue
TOD Scenario: Operating Costs & Revenues
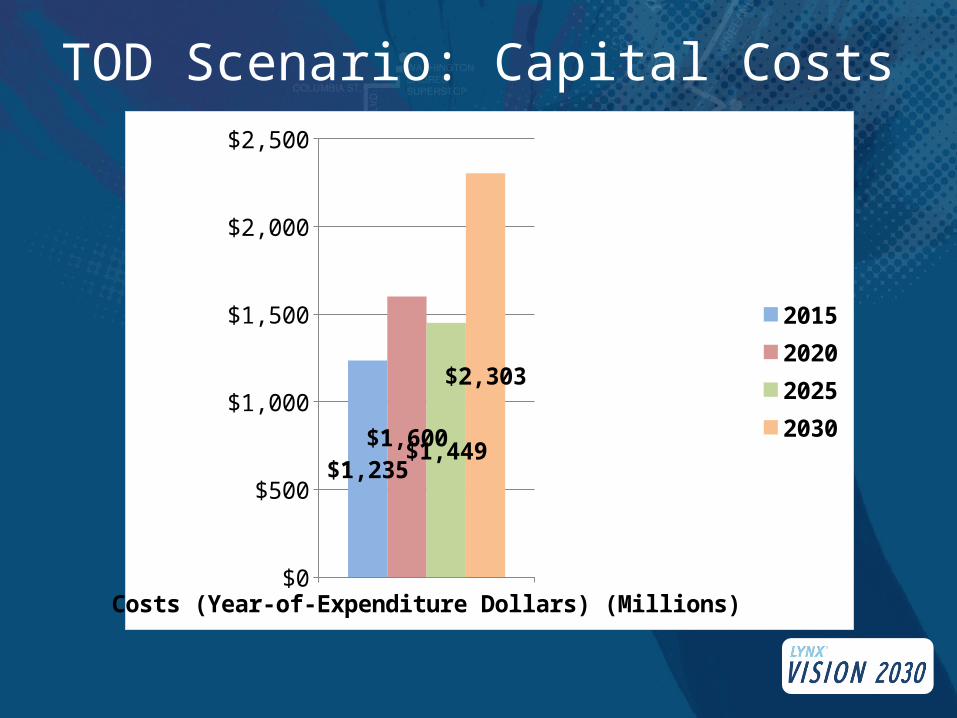
Costs (Year-of-Expenditure Dollars) (Millions)$0
$500
$1,000
$1,500
$2,000
$2,500
$1,235$1,600 $1,449
$2,303
2015202020252030
TOD Scenario: Capital Costs

2015 2020 2025 2030$0
$500
$1,000
$1,500
$2,000
$2,500
CostRevenue
TOD Scenario: Capital Costs & Revenues
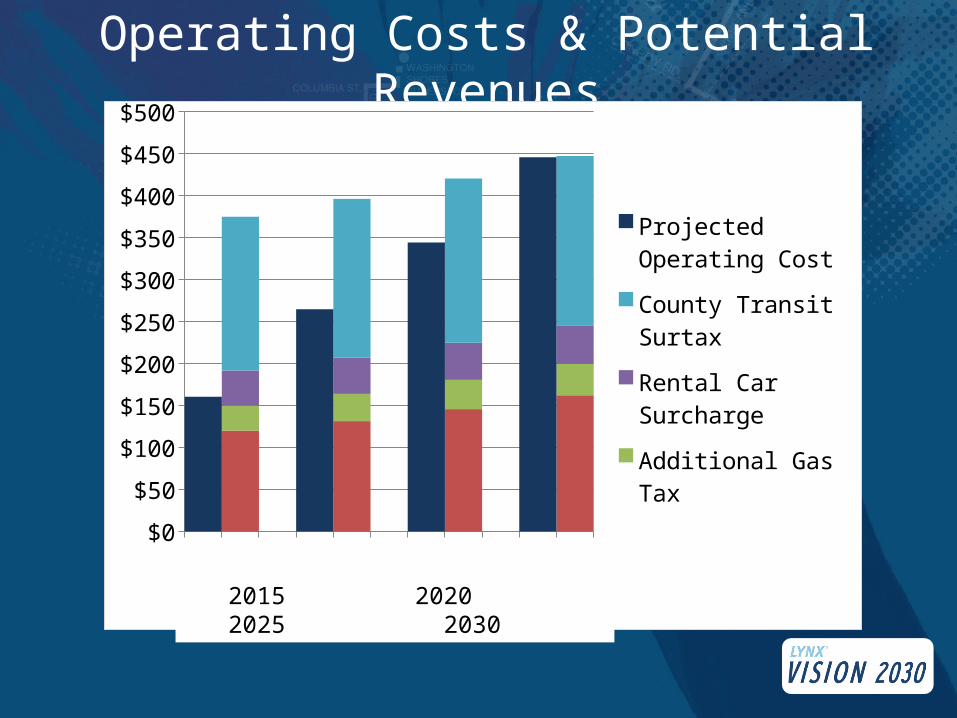
Operating Costs & Potential Revenues
20152020
20252030
$0
$50
$100
$150
$200
$250
$300
$350
$400
$450
$500
Projected Operating Cost
County Transit Surtax
Rental Car Surcharge
Additional Gas Tax
Existing Operating Revenue Sources
2015 2020 2025 2030

Near-Term Recommendations
• Work with MetroPlan to ensure LYNX Vision 2030 is incorporated into 2040 LRTP update
• Meet with local jurisdictions and MetroPlan Land Use Subcommittee to discuss how localities can make adopted LRTP land use plan a reality
• Need to ensure changes do not create disproportionate adverse impacts to under-represented individuals

Near-Term Recommendations
• Explore options for dedicated/supplementary funding for transit
• Develop and implement bicycle- and pedestrian-friendly land use policies
• Continue coordination and discussions with stakeholders (i.e., Disney, OIA, UCF, etc.)

Mid-Term Recommendations
• Update the plan on a regular basis• Identify additional corridors for inclusion in
next update• Work with counties and municipalities to
develop transit-supportive growth plans– Develop transit-supportive corridor plans
• Undertake individual corridor studies to identify better termini, operational improvements, and implementation plan

Mid-Term Recommendations
• Study the possibility of implementing Limited Stop Connector Service
• Secure dedicated funding source for transit• Identify locations for park-and-ride lots• Continue coordination and discussions with
stakeholders (i.e., Disney, OIA, UCF, etc.)

Long-Term Recommendations
• Changing conditions will need to be monitored (i.e., Medical City/Innovation Way development, HSR, etc.)
• Continue coordination and discussions with stakeholders (i.e., Disney, OIA, UCF, etc.)

Questions or Comments
Thank you


