1© All rights reserved to
Agile Analytics in Mobile Gaming:lessons learned
Volodymyr (Vlad) KazantsevHead of Data Science at Product Madness
2015

3
Heart of Vegas in charts
iPad rankings, US iPad rankings, Australia

4
Data Impact Team
● Ad-hoc analytics and daily fires
● Deep dive analysis;Predictive analytics
● Data Engineering; R&D
Team of 6

5
Few Examples
A B
A/B TestsCustomer Lifetime Value
days
$ va
lue
Segmentation
group 1 group 2 group 3 group 4

6
Technology Stack
C++ETL
orchestration
Transformation& Aggregation
SQL
Data Products
Reports
Dashboards
+

7
Lessons
8
Lesson 1: Agile Philosophy for Data Science
1

9
Agile Manifesto
Individuals and interactions over processes and tools
Working software over comprehensive documentation
Customer collaboration over contract negotiation
Responding to change over following a plan
* agilemanifesto.org

10
Agile Data Science Manifesto
Individuals and interactions over processes and tools
Actionable insights over comprehensive reports
Customer collaboration over project negotiation
Responding to change over following a plan

11
“If a building doesn’t encourage [collaboration], you’ll lose a lot of innovation and the magic that’s sparked by serendipity” - Steve Jobs
Individuals and interactions over processes and tools

12
Individuals and interactions over processes and tools
Standing Desks + Easily Available Whiteboard

13
Agile Principles
Iterative, incremental and evolutionary
Efficient and face-to-face communication
Very short feedback loop and adaptation cycle
Quality focus
- iterations, timeboxed estimates
- no to tasks by email (with no face-to-face)
- daily standups, pair analysis
- verifiable, reproducible findings

14
Data Science Board
15
Scrum-Ban in Data Science @ProductMadness
● Weekly cycle
● Daily standup meeting @10am
● ToDo/WIP/Waiting buckets are kept small
● Disruptions to weekly plan are expected
● On-demand planning

16
Lesson 1: Agile methods in Data Science
1. co-location matter; whiteboard next to your desk
2. Work with decision maker; share preliminary findings
3. Make a research plan; pivot early
4. Book “Findings” meeting before project start
5. MVP for Data Products
6. Do Daily Stand-ups !
17
Lesson 2: Agile Velocity vs. Acceleration
2

18
What is Agile Acceleration
Waterfall Scrum
Units of WorkTime IntervalVelocity = ΔVelocity = Acceleration* ΔTime
VS.

19
a = Fm
I run SQL, copy-paste data to Excel and send it by email
I created a deep neural network to predict high spenders

20
Case Study: to Git or not to Git
Scripts (ruby, bash, python)Python AppsPython ModulesIPython NotebooksResearch Documents (word)Presentations (powerpoint)Spreadsheets (excel)

21
Case Study: Git or not to Git
Scripts (ruby, bash, python)Python AppsPython ModulesIPython Notebooks ?Research Documents (word)Slides (powerpoint)Spreadsheets (excel)

22
Case Study: Git or not to Git
Scripts (ruby, bash, python)Python AppsPython ModulesIPython NotebooksResearch Documents (word)Slides (powerpoint)Spreadsheets (excel)

23
Remove unnecessary weight

24
Lesson 2: find the lightest suitable tool1. IPython notebooks: Dropbox over Git2. Google Slides over Powerpoint
Google Slides over Email with images (>2 images)
3. Google Spreadsheets over Excel (for analytics)4. Podio over Jira (for analytics)5. Data Transformations in DWH in SQL over Hadoop6. Don’t copy-paste code in IPython notebooks; use functions;
don’t copy-paste functions in notebooks, use modules
25
Lesson 3: Focus on Closing the Loop
3

26
Analytics Loop
Spot Opportunity
Ask the Right Question
Make Decision
Improve the Business
Data Science @work
27
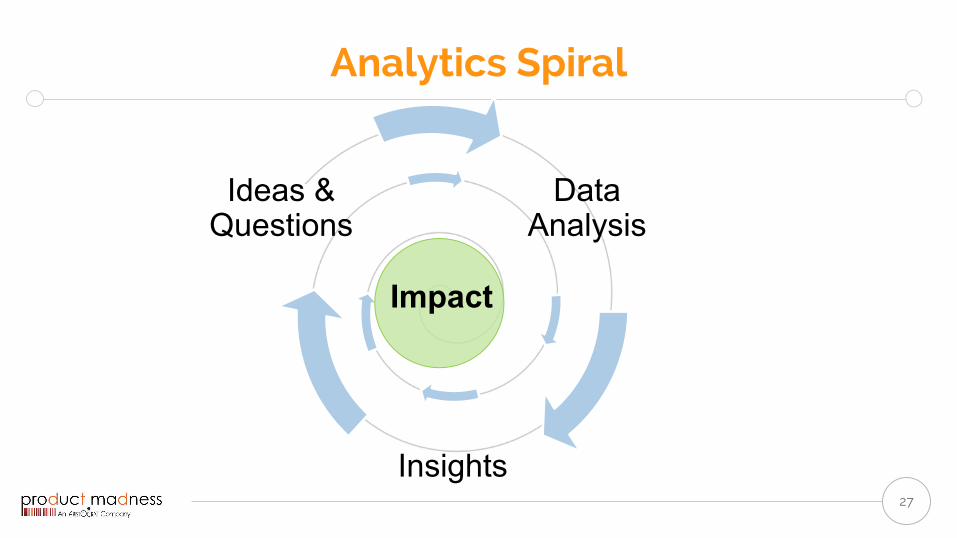
Analytics Spiral
Ideas & Questions
Data Analysis
Insights
Impact

28
Data Science Value Pyramid
Store & Query
Reports
Descriptive Analytics
Predictive Analytics
Data Products
* inspired by Agile Data Science, Russell Jurney, O'Reilly Media 2013
Record what Happened
Was it good or bad?
Why did it happen?
What will happen?
Affect the outcome
com
plex
ity
valu
e

29
Data Science Value Loop
Record what Happened
Was it good or bad?
Why did it happen?
What will happen?
Affect the outcome

30
Limit the number of Open Loops
90% 90%
75%80%
80%60%
100% 100%
100%100%
0% 0%
Always prefer to have: 90% of tasks are 100% complete
over 100% of tasks are 90% complete
VS.

31
Lesson 3: Focus on Closing the Loop1. Don’t build predictive models that you can’t act upon. Don’t
analyse stuff that does not help to make a decision
2. The best way to deal with Analytics Spiral is to avoid the spiral. Practise Crack a Case and “what if” method.
3. Climb the Data Value Pyramid fast.Once climbed - optimise the Data Value Loop.
4. Limit the number of “open loops”

32
Lesson 4: Reproducibility Matters
4

33
To the and back!
34
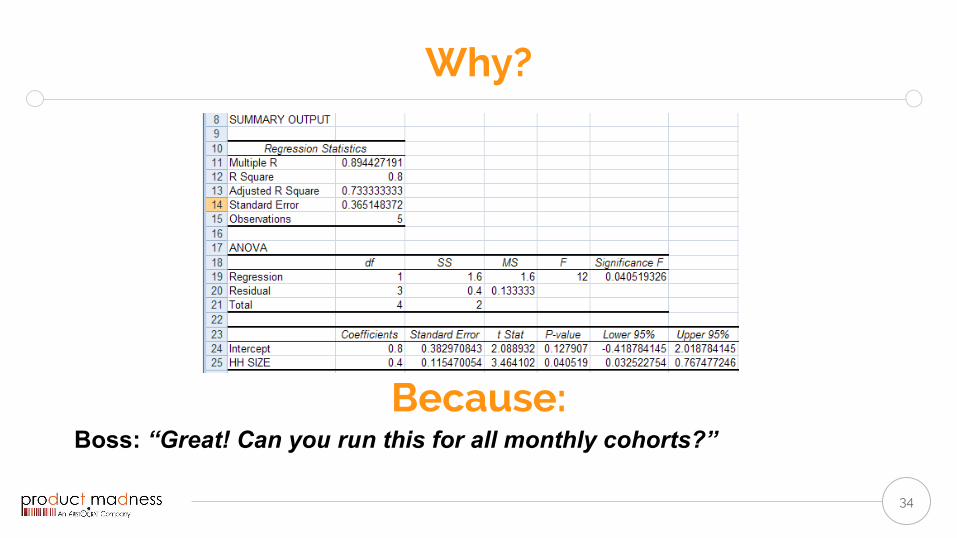
Why?
Boss: “Great! Can you run this for all monthly cohorts?”Because:
35
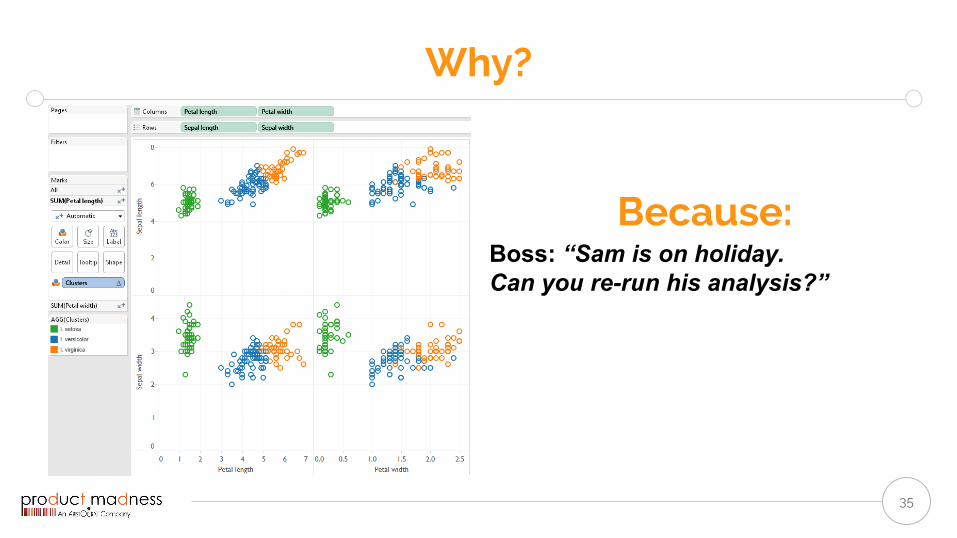
Why?
Because:Boss: “Sam is on holiday.Can you re-run his analysis?”

36
Few IPython Tips

37
Import all commonly used toolsin one line.
All access and security is abstracted away.Focus on SQL, not data access
formatting and publishing a .png in one line of code
PyCharm has great SQL editor

38
Lesson 4: Reproducibility
● Get rid of Windows and you get rid of Excel
● ipynb are always shared and versioned;Prefer simple cloud sharing to VCS
● Streamline data access functions
● Cache long-running code and queries
● Develop a common library
39
In Summary...

40
Summary
● Agile approach works well in Data Science
● Find the lightest suitable tool for a task
● Reproducibility is not negotiable
● Focus on closing the loop(s)